
Software Productivity in Practice: A Systematic Mapping Study


Abstract
1. Introduction
2. Systematic Mapping Methodology
2.1. Context Definitions
2.2. Systematic Mapping Definitions
2.3. Review Question Formulation
- RQ1
- Which business sectors and knowledge areas are studied in connection to software productivity?
- RQ2
- How is productivity data collected and analyzed, based on which measures?
- RQ3
- Which are the approaches to software productivity and what are their effects?
- RQ4
- What kinds of empirical studies are developed regarding software productivity and what are their findings?
2.4. Bibliographic Reference Search Strategy
2.5. Reference Exclusion Criteria
- Correspond to complete articles written in English published in peer-reviewed journals and event proceedings: The retrieved references were ignored if they corresponded to books, theses, technical reports, editorials, abstracts and summaries, preventing the analysis of incomplete, partial or not completely validated research results. The few references corresponding to papers written in other languages were also ignored;
- Correspond to journal papers, book chapters and conference/workshop papers which were not later subsumed: Each retrieved reference was excluded if it was later subsumed by a subsequent publication. Subsumption was chosen as an exclusion criteria to avoid analyzing results that later on appear in modified form or with different contents in relation to previously published versions;
- Are strictly connected to software productivity: This criterion was posed to avoid analyzing studies related primarily to other subjects (such as SE education and training), or experience reports that study specific subjects (such as productivity software) or methods, techniques and tools addressing software productivity as a secondary subject (such as management techniques and software development environments that ensure higher productivity);
2.6. Paper Inclusion Criteria
- Reports at least on one empirical study;
- Has a industry practitioner author or analyses software industry data (data from the software industry is admitted here in an ample sense, covering raw data and source code from private and public administration organizations, from open databases or closed development projects, so long as they are effectively used/adopted in industry);
- Describes the adopted methodology;
- Explains the studied variables and measures;
- Answers the study(ies) research question(s);
- Provides a statement of the main findings.
2.7. Secondary and Tertiary Study Treatment
2.8. Paper Processing and Treatment
- Bibliographic key;
- Year of publication;
- Total number of authors and industry practitioner authors;
- Author(s) affiliation(s) information;
- Number of studies on software productivity;
- (Qualified) empirical study type(s);
- Studied business sector(s);
- Main SE KA and KA topic(s);
- Productivity approach ultimate goal;
- Data source(s) and their characterization(s);
- Interventions and outcomes, if applicable;
- Adopted productivity measure(s);
- Employed analysis method(s);
- Main finding(s);
- Conflict of interest and funding information.
2.9. Analysis and Synthesis Methods
3. Data Analysis and Primary Study Finding Compilation
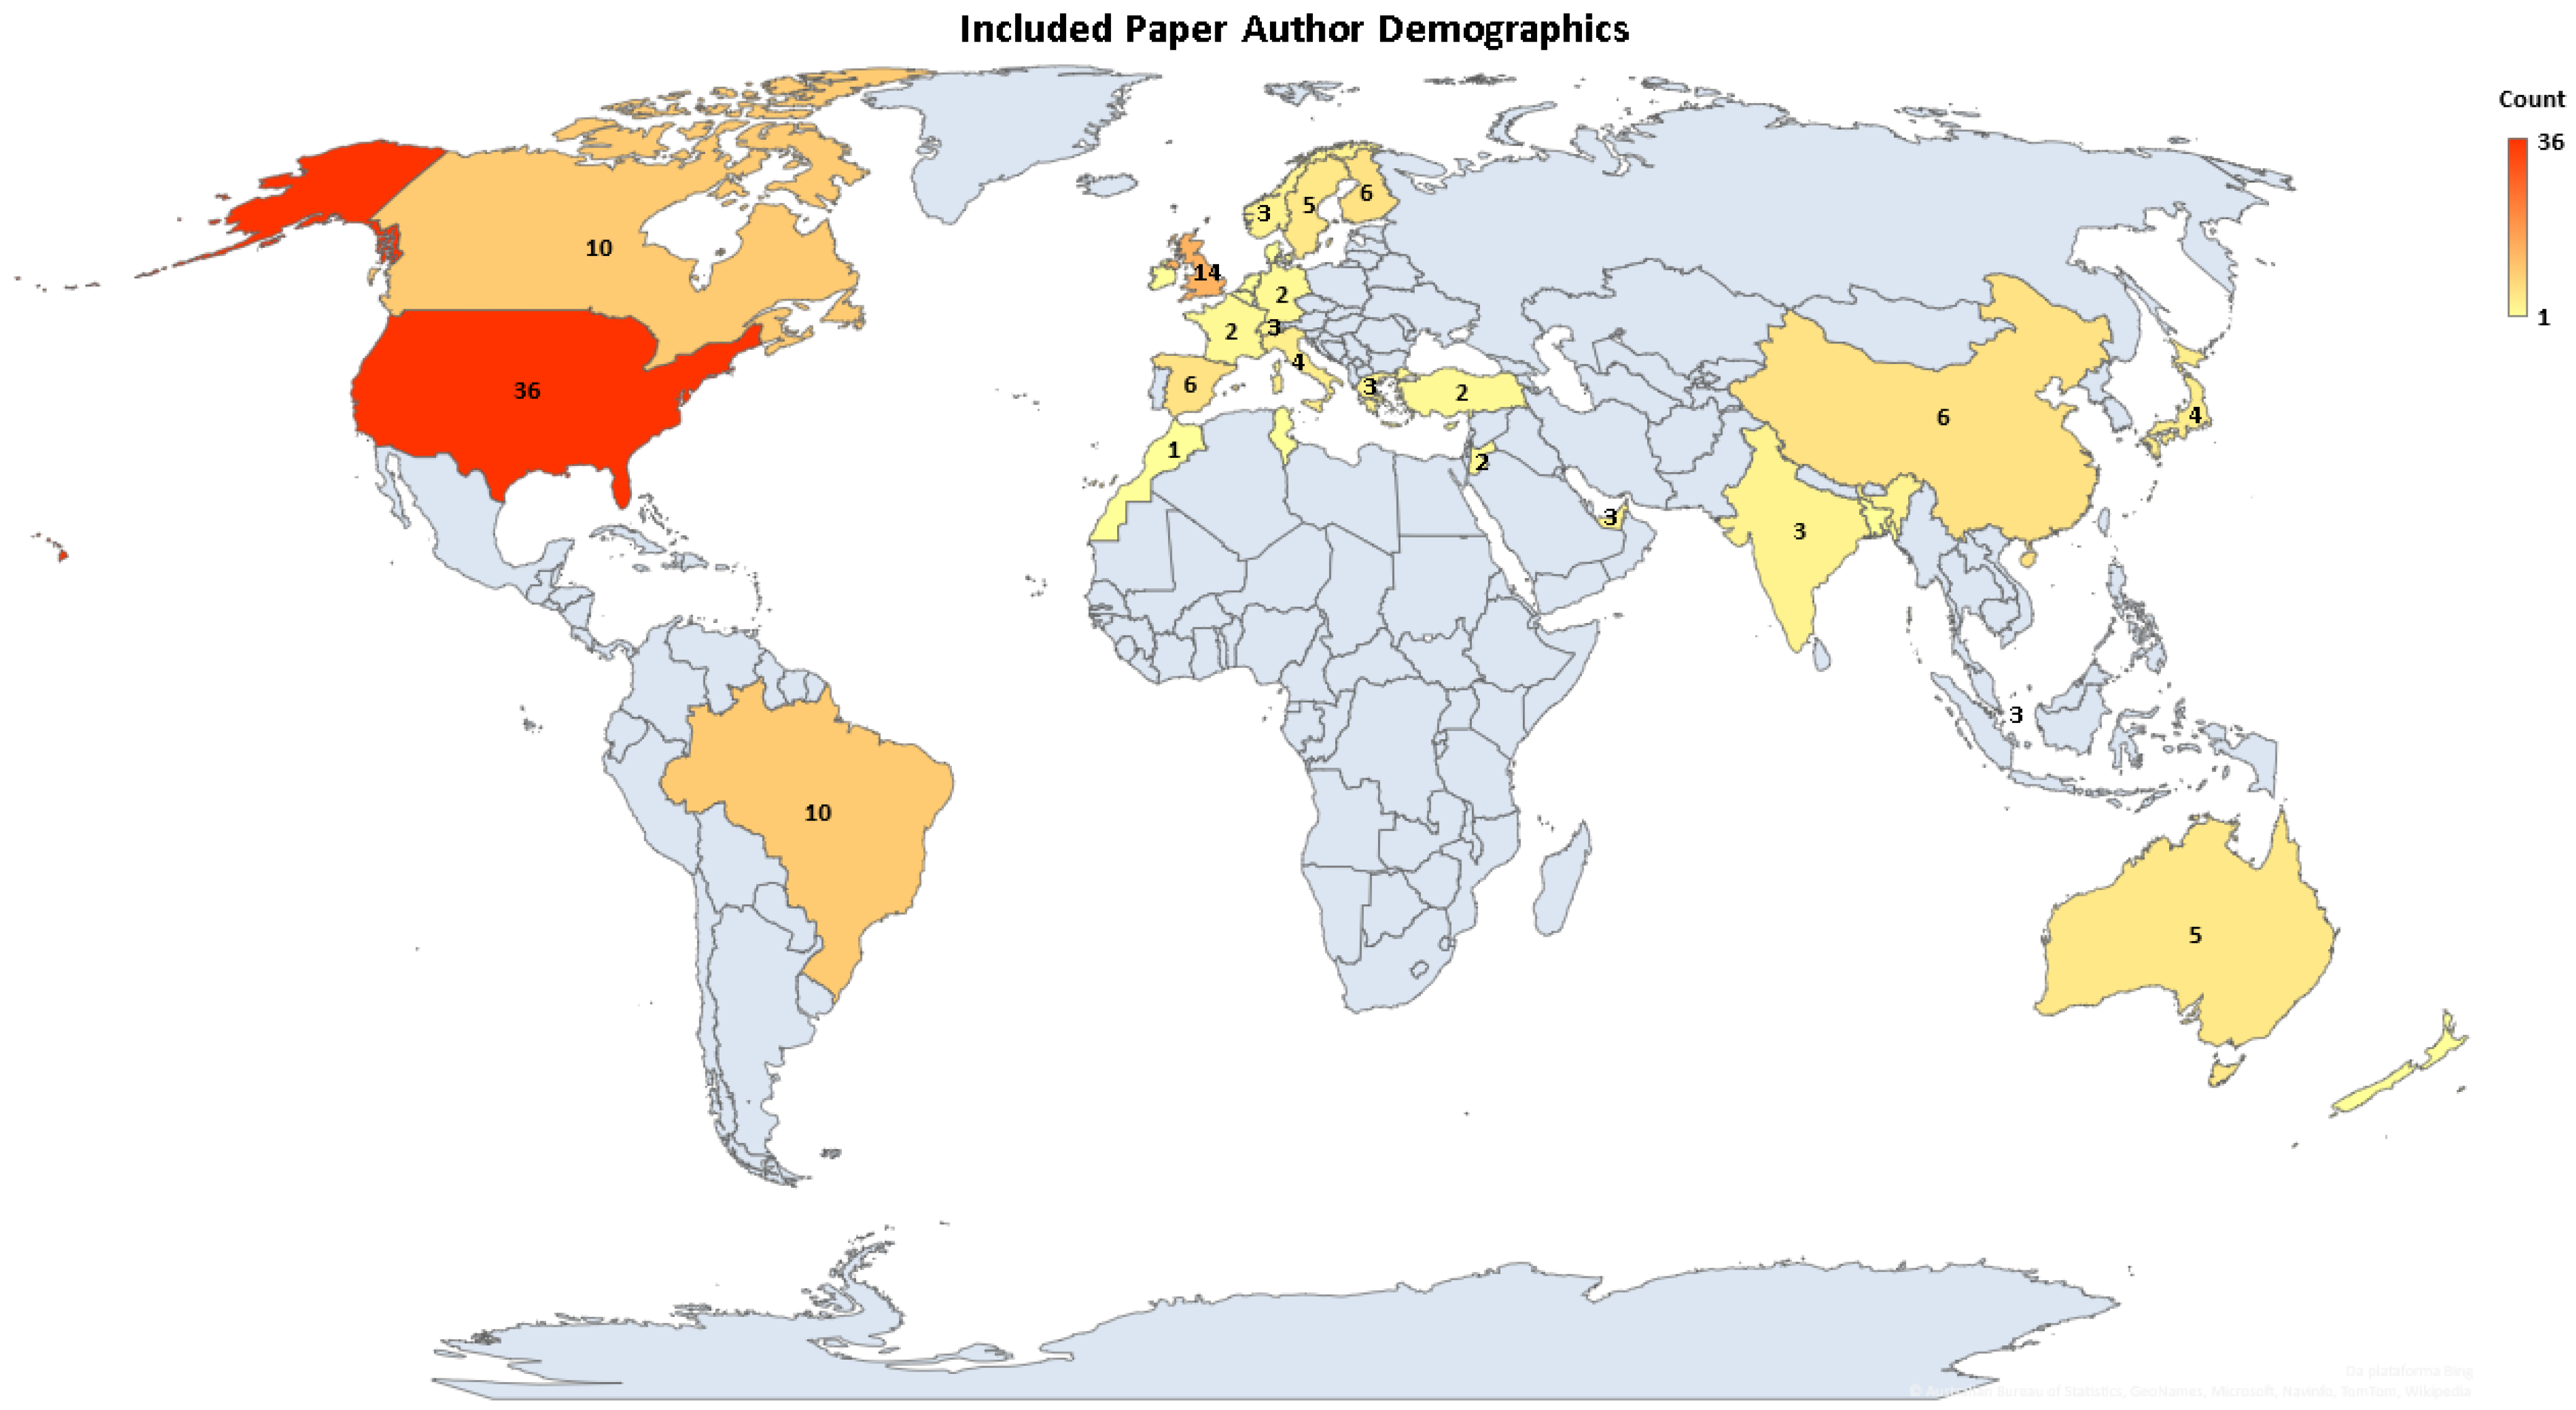
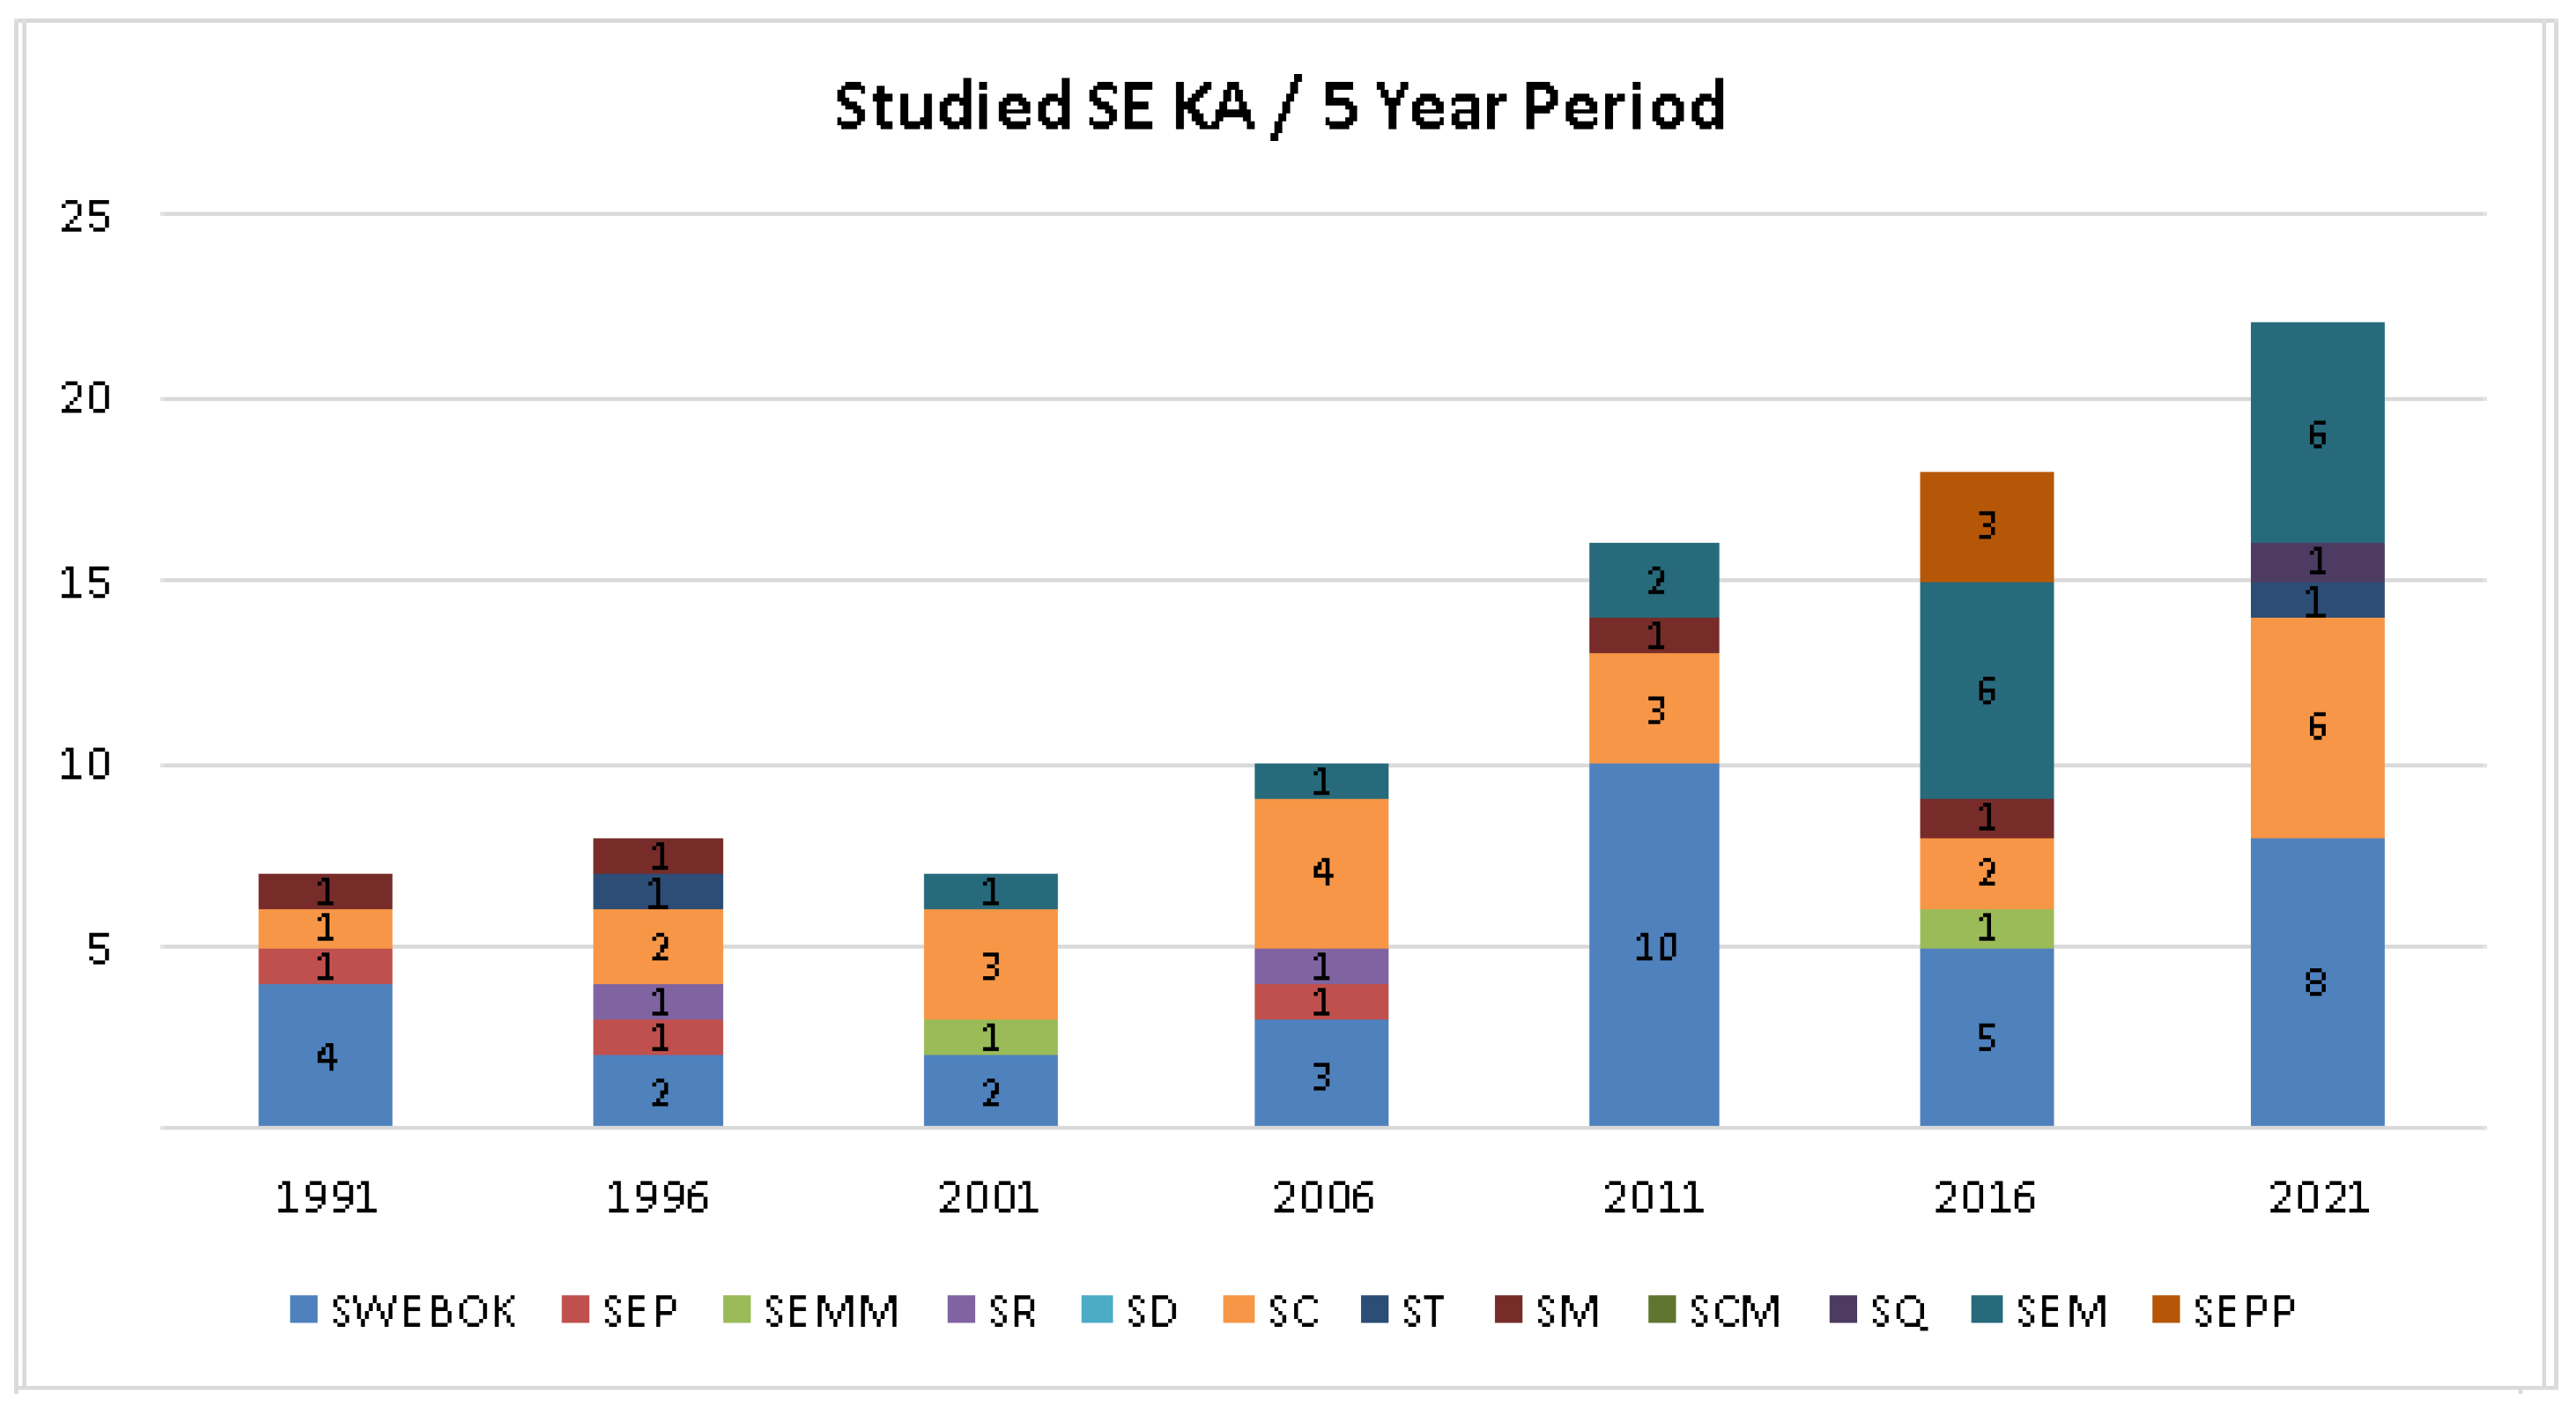
3.1. Business Sectors and KAs in Studies (RQ1)
3.2. Data Collection, Measurement and Analysis (RQ2)

| Name | Definition | Count | Primary Studies (with Occurrence Period) |
|---|---|---|---|
| many | many different measures were used | 14 | [3,7,10,11,24,32,44,46,51,83,91,103,104,105] * |
| TFP | total factor productivity | 1 | [106,107] (2012–2021) |
| EVA/y | economic value added per year | 2 | [90,99] (2009–2011) |
| labor productivity | annual net revenue/number of employees | 2 | [54,100] (2013–2017) |
| US$ Cost/LOC | American Dollar cost per line of code | 1 | [80] (1999–1999) |
| SDE | stochastic data envelopes: f(FP, SLOC)/person-hour | 4 | [62,63,70,96] (1991–2006) |
| CP/US$ cost | change points/cost in American dollars | 1 | [65] (1995–1995) |
| adjusted size/total effort | deliverables size-effort/total-effort month | 2 | [22,23] (2004–2017) |
| effort/task | source lines of task code/task person-hours | 1 | [75] (2021–2021) |
| FP/p-(m; d; h) | function points/person-(months; days; hours) | 8 | [42]; [35,37,57,77]; [49,50,53] ** |
| FP/y | function points per year | 1 | [78] (1993–1993) |
| UFP/(m; h) | unadjusted function point per (month; hour) | 5 | [55,69] (1999–2017); [56,93,97] (2004–2020) |
| UCP/p-h | use case points/person-hours | 2 | [85,86] (2017–2018) |
| LOP/p-w | lines of proof/person-weeks | 1 | [101] (2014–2014) |
| SLOC/p-(y; m; h) | source lines of code/person-(years; months; hours) | 11 | [48]; [41,61,68,108]; [21,38,52,71,72,84] *** |
| NCSLOC/p-(m; d) | non-comm. source lines of code/person-(months; days) | 2 | [64] (1994–1994); [81] (2001–2001) |
| DSLOC/p-(m; h) | delivered lines of code/person-(months; hours) | 3 | [79,92] (1996–2005); [67] (1996–1996) |
| added SLOC/d | added source lines of code/days elapsed | 1 | [98] (2016–2016) |
| p-h/FP | person-hours per function point | 2 | [39,58] (2011–2012) |
| resolution time/task | resolution time per task | 1 | [40] (2013–2013) |
| features/w | features per week | 1 | [66] (1996–1996) |
| CLOC/m | committed lines of code per month | 1 | [94] (2010–2010) |
| time to first CCR | time to first contributor commit | 1 | [45] (2017–2017) |
| daily contribution | committed lines of code and files per day | 1 | [102] (2021–2021) |
| CCR/(m; w) | contributor commits per (month; week) | 1 | [59] (2009–2009); [36] (2009–2009) |
| PR/m | pull requests per month | 1 | [95] (2021–2021) |
| inter-CCR time | time between contributor commits | 1 | [43] (2016–2016) |
| SAP | self-assessed productivity | 8 | [4,5,47,60,74,76,87,88,89] (2015–2021) |
| qualitative | only qualitative measures were used | 7 | [6,9,12,73,82,109] (1991–2017) |
| TOTAL | 89 | periods: * (1991–2020). ** (2014–2014); (1991–2012); (2000–2009). *** (1999–1999); (1988–2014); (1987–2011). |
3.3. Software Productivity Approaches (RQ3)
3.4. Study Types and Reported Findings (RQ4)
3.4.1. Studies Using SE Economics Databases
3.4.2. Other Studies Covering the SWEBOK
- Economies and diseconomies of scale in pure, mixed and non-SaaS firms ([99]);
- Positioning of software companies in supply chains as prime contractors, intermediate contractors, end-contractors, and independent enterprises ([104]);
- Regional differences in the level of development of software companies ([107]).
3.4.3. Requirements Engineering
3.4.4. Object-Oriented Development
3.4.5. Software Construction
3.4.6. Software Reuse
3.4.7. Open-Source Software
3.4.8. Software Testing
3.4.9. Software Maintenance
3.4.10. Software Engineering Management
3.4.11. Rapid Application Development
3.4.12. Software Engineering Professional Practice
3.4.13. Software Processes, Quality, Models and Methods
4. Related Work Discussion and Indirect Study Finding Compilation
5. Systematic Mapping Findings and Recommendations
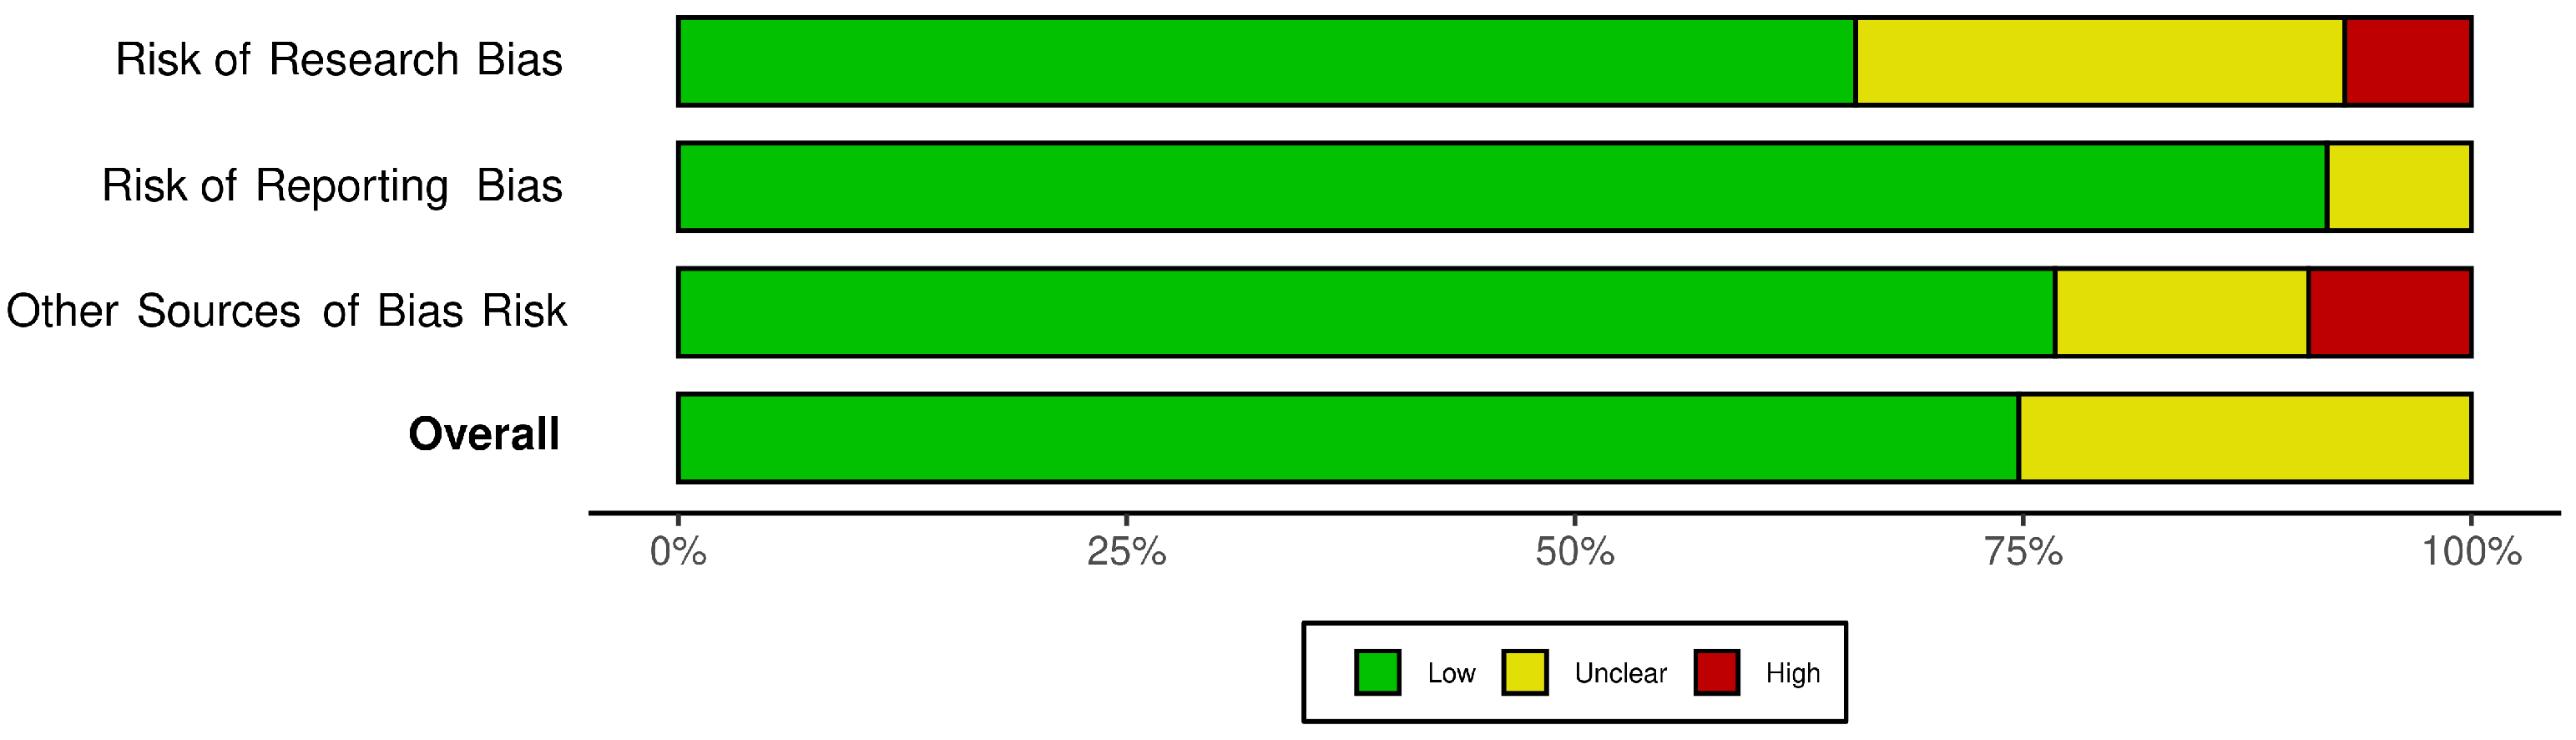
5.1. Risk of Bias Assessment
5.2. Evaluation of Certainty in the Body of Evidence
5.3. Evidence Profile and Summary of Findings Table
- Remotion of individual studies with low certainty: Only studies with moderate or high certainty are considered;
- Inclusion of findings that have been deemed collectively important: Only outcomes determined in at least three high- or moderate-certainty papers are considered;
- Formulation of each aggregated finding definition: Analysis of individual definitions and formulation of an aggregated relationship, involving the productivity factors mentioned in the original studies, any directionality of effects and significance of results, considering the lowest significance and more general scope conclusively reported;
- Computation of the numbers of papers and studies leading to the finding;
- Evaluation of the pooled risk of bias for the finding: Computed by weighing the individual paper risk of bias ratings according to the respective number of reported studies and their assessments of risk of bias, using the same criteria of Section 6.1;
- Determination of inconsistency, indirectness, imprecision and review limitations related to the finding: Usage of the GRADE criteria for determining these aspects;
- Computation of the overall quality of the finding: Usage of the lowest quality of evidence level among the respective studies as the baseline quality of the outcome, possibly downgraded (according to what was determined in the previous two steps) or upgraded (depending on the findings reported in any systematic indirect study with the same coverage) in one or two certainty levels;
- Registration of any relevant comment.
5.4. Methodological Lessons Learned and Recommendations
5.4.1. Software Productivity Standards
Lesson 1. The software productivity community should seek to reduce the uncertainty concerning definitions related to software productivity by participating in standardization initiatives and standardization boards, apart from effectively adopting standards in research and practice.
5.4.2. Practitioner/Industry Involvement and Participation
Lesson 2. In order to motivate involvement, software productivity researchers should seek the participation of industry practitioners and researchers in studies by presenting them the potential benefits together with the identified risk mitigators.
5.4.3. Software Productivity Data Collection
Lesson 3. Software productivity data analysts should be concerned with data collection processes and data quality. They should always characterize the context and population under study in a precise way; propose in a justified manner sample, experiment or case study size; describe data sources, studied variables and data collection processes, with their time spans and collection instruments. Whenever possible, randomization should be adopted.
5.4.4. Usage of Productivity and Open-Source Code Databases
Lesson 4. Software productivity data scientists should seek to adopt and expand the practice of compiling productivity databases towards exploring new and innovative applications, taking into account the best practices and the associated challenges and opportunities.
5.4.5. Software Productivity Measurement and Analysis
Lesson 5. Software productivity data analysts should choose productivity measurement and analysis methods considering the problem at hand. They should take into account the measurement level and approach, the corporate goals and the best practices in terms of analysis methods.
5.4.6. Confounding Factors
Lesson 6. Authors of software productivity studies should clarify and analyze the software engineering dimensions that may be confounded with software productivity and the factors that may confound software productivity analysis.
5.4.7. Conduction of Studies on Software Productivity
Lesson 7. Authors of software productivity studies should prefer GCM over PICO. The adoption of PICO should always be justified in terms of the study goals and characteristics.
Lesson 8. The IEEE SWEBOK should be updated to cover emergent software engineering subjects and should contain more practice-oriented guidance.
Lesson 9. Authors of systematic literature reviews and mappings on software productivity should formulate strategies of paper screening considering variation in the adopted search string and bibliographic reference databases, apart from using alternative methods of reference discovery.
Lesson 10. Authors of software productivity studies should ensure research quality and transparent reporting by including in their papers clear and explicit statements of author affiliations, sources of funding, technology and data, and conflicts of interests, apart from transparently reporting incentives for study participation and disclosure limitations on research data and findings.
6. Threats to Validity
6.1. Construct and Internal Validity
6.2. External Validity
7. Concluding Remarks
Supplementary Materials
Funding
Conflicts of Interest
Appendix A. Coding of Factors Affecting Software Productivity
Appendix A.1. Studies Using SE Economics Databases
- development platform development project productivity ([55]);
- business sector □ software project productivity
- team size development project productivity
- adopted programming language □ development project productivity
- project size development project productivity ([52]);
- level of outsourcing development project productivity ([53]);
- adopted programming language → maintenance project productivity ([56]);
- adoption of development tools development project productivity ([56]);
- development project productivity □ maintenance project productivity
- large team development productivity < small team development productivity ([39]).
Appendix A.2. Other Studies Covering the SWEBOK
- formal education labor productivity ([106]);
- organizational structure development project productivity ([108]);
- risk classification development project productivity ([57]);
- UCPs development project productivity; ([86]);
- FPs development project productivity ([57]);
- LOCs development project productivity ([108]);
- development platform development project productivity ([57]);
- software complexity development project productivity ([86]);
- adopted programming language recency development project productivity ([109]);
- team experience development project productivity ([109]);
- experience with user community development project productivity ([109]);
- team size development project productivity ([108]);
- application type → development project productivity ([108]);
- software reuse development project productivity ([61]);
- technical debt development project productivity ([87]);
- software development approach adequacy scientific software productivity ([83]);
- RAD development project productivity ([21]);
- adopted programming language → development project productivity ([108]);
Appendix A.3. Requirements Engineering
Appendix A.4. Object-Oriented Development
- project size development project productivity ([48]);
- application domain → development project productivity ([72]);
- adoption of OOD → development project productivity ([69]);
- rigorous enforcement of project deadlines development project productivity ([68]);
- early intermediate task completion incentives development project productivity ([68]).
Appendix A.5. Software Construction
- software reuse development project productivity
- formal education development project productivity ([23]);
- architecture → development project productivity ([84]);
- requirements volatility development project productivity ([71]);
- knowledge of unit testing development project productivity ([23]);
- concurrent development pair productivity < simultaneous development pair productivity ([97]).
Appendix A.6. Software Reuse
- software reuse development project productivity
Appendix A.7. Open-Source Software
- adopted programming language fragmentation OSS project productivity ([94]);
- OSS adoption service corporate labor productivity ([100]);
- OSS age OSS project productivity ([95]);
- team size OSS project productivity ([43]);
- team experience OSS project productivity ([36]);
- LOC-based size increment OSS project project productivity ([41]).
Appendix A.8. Software Testing
Appendix A.9. Software Maintenance
- domain knowledge maintenance project productivity ([96]);
- team capabilities maintenance project productivity ([96]);
- mentors succession and experience maintenance project productivity ([59]);
- mentors work load maintenance project productivity ([59]);
- level of offshoring succession maintenance project productivity. ([59]);
- project size maintenance project productivity
- LOC-based size increment maintenance project productivity ([63]);
- maintenance granularity maintenance project productivity ([98]);
- software artifact coupling maintenance project productivity ([98]);
- project quality maintenance project productivity ([96]).
Appendix A.10. Software Engineering Management
- project size development project productivity ([35]);
- adoption of development tools development project productivity ([47]);
- adoption of process models development project productivity ([47]);
- team autonomy development project productivity ([47]);
- technology knowledge development project productivity ([37]);
- team experience heterogeneity development project productivity ([38]);
- adoption of testing tools development project productivity ([37]);
- task coordination development project productivity ([40]);
- software complexity development project productivity ([37]);
- task completion incentives development project productivity ([47]);
- possibility of mobility development project productivity ([47]);
- in-house development project productivity □ offshored development project productivity
Appendix A.11. Rapid Application Development
- team size → agile software development productivity ([12]);
- team diversity → agile software development productivity ([12]);
- team turnover → agile software development productivity ([12]);
- Scrum adoption → software development productivity. ([73]);
- traditional project productivity < Scrum-RUP project productivity ([58]).
Appendix A.12. Software Processes, Quality, Models and Methods
- organizational structure → development project productivity ([78]);
- personal software process maturity levels → software developer productivity ([82]);
- proof size → formal verification productivity ([101]);
- appraised software process maturity levels □ corporate labor productivity
- adoption of development tools development project productivity ([77]);
- proof complexity formal verification productivity ([101]).
Appendix B. Risk of Bias Assessment Tables
| Key | Risk of Bias Domains | |||
|---|---|---|---|---|
| D1 | D2 | D3 | D4 | |
| (AbdelHamid96) [79] | Low | Low | Low | Low |
| (AdamsCB09) [36] | Unclear | Low | Low | Low |
| (AsmildPK06) [70] | Low | Low | Low | Low |
| (AzzehN17) [85] | Low | Low | Low | Low |
| (AzzehN18) [86] | Low | Low | Low | Low |
| (BankerDK91) [96] | Low | Low | Low | Low |
| (BankerK91) [62] | Unclear | Low | High | Unclear |
| (BankerS94) [63] | Low | Low | Low | Low |
| (BellerOBZ21) [74] | Low | Low | High | Unclear |
| (BeskerMB19) [87] | High | Low | Low | Unclear |
| (BezerraEA20) [88] | Unclear | Low | Low | Low |
| (BibiAS16) [98] | Low | Low | Low | Low |
| (BibiSA08) [91] | Unclear | Low | Low | Low |
| (Boehm87) [21] | Low | Low | Low | Low |
| (Boehm99a) [80] | Low | Low | Low | Low |
| (CarvalhoRSCB11) [58] | Low | Unclear | Low | Unclear |
| (CataldoH13) [40] | Low | Low | Unclear | Low |
| (ChapettaT20) [24] | Low | Low | Low | Low |
| (Chatman95) [65] | Unclear | Low | High | Unclear |
| (CheikhiARI12) [11] | Low | Low | Low | Low |
| (DamianC06) [9] | Low | Low | Low | Low |
| (DiesteEtAll17) [23] | High | Low | Low | Unclear |
| (Duarte17a) [54] | Unclear | Low | Low | Low |
| (Duncan88) [61] | Low | Low | High | Unclear |
| (FatemaS17) [6] | Low | Low | Low | Low |
| (FaulkLVSV09) [83] | Low | Unclear | High | Unclear |
| (FrakesS01) [81] | Low | Low | Low | Low |
| (GeH11) [90] | Low | Low | Low | Low |
| (GraziotinWA15) [4] | High | Low | Low | Unclear |
| (GreenHC05) [82] | Unclear | Low | Low | Low |
| (HenshawJMB96) [66] | Low | Low | Unclear | Low |
| (HernandezLopezCSC15) [7] | High | Low | Low | Unclear |
| (HernandezLopezPGC11) [32] | Low | Low | Low | Low |
| (HuangW09) [99] | Unclear | Low | Low | Low |
| (JaloteK21) [75] | Unclear | Low | Unclear | Unclear |
| (JohnsonZB21) [76] | Unclear | Unclear | High | Unclear |
| (KautzJU14) [73] | Low | Low | Low | Low |
| (KemayelMO91) [109] | Low | Low | Low | Low |
| (KitchenhamM04) [22] | Unclear | Low | Low | Low |
| (KreinMKDE10) [94] | Low | Low | Low | Low |
| (KuutilaMCEA21) [102] | Low | Low | Low | Low |
| (LagerstromWHL12) [57] | Low | Low | Low | Low |
| (LavazzaMT18) [56] | Unclear | Low | Low | Low |
| (LavazzaLM20) [93] | Unclear | Low | Low | Low |
| (LiaoEA21) [95] | Low | Low | Low | Low |
| (Lim94) [64] | Low | Low | High | Unclear |
| (LowJ91) [77] | Low | Low | Low | Low |
| (MacCormackKCC03) [35] | Unclear | Low | Unclear | Unclear |
| (MantylaADGO16) [60] | Low | Low | Low | Low |
| (Maxwe96) [108] | Low | Low | Unclear | Low |
| (MaxwellF00) [49] | Low | Low | Unclear | Low |
| (MeloCKC13) [12] | Low | Low | Low | Low |
| (MeyerBMZF17) [5] | Unclear | Low | Low | Low |
| (MeyerZF17) [10] | Unclear | Low | Unclear | Unclear |
| (MinetakiM09) [104] | Low | Low | Low | Low |
| (MoazeniLCB14) [41] | High | Low | Low | Unclear |
| (Mockus09) [59] | Low | Low | High | Unclear |
| (Mohapatra11) [37] | Low | Low | Low | Low |
| (MosesFPS06) [51] | Unclear | Low | Low | Low |
| (MurphyHillEA21) [89] | Low | Low | Low | Low |
| (OliveiraEA20) [46] | Unclear | Low | Low | Low |
| (PalaciosCSGT14) [42] | Unclear | Low | Low | Low |
| (ParrishSHH04) [97] | Low | Low | Low | Low |
| (PortM99) [69] | Low | Low | Unclear | Low |
| (PotokV97) [68] | Low | Low | High | Unclear |
| (PotokVR99) [48] | Low | Low | Unclear | Low |
| (PremrajSKF05) [50] | Low | Low | Unclear | Low |
| (RamasubbuCBH11) [38] | Low | Low | Unclear | Low |
| (RastogiT0NC17) [45] | Low | Low | Low | Low |
| (RodriguezSGH12) [39] | Low | Low | Low | Low |
| (Rubin93a) [78] | Low | Low | Low | Low |
| (Scacchi91) [103] | Low | Low | Low | Low |
| (ScholtesMS16) [43] | Low | Low | Low | Low |
| (SentasASB05) [92] | Low | Low | Low | Low |
| (SiokT07) [72] | Low | Low | Unclear | Low |
| (SovaS96) [67] | Low | Low | Low | Low |
| (StaplesEA14) [101] | Low | Low | Low | Low |
| (StoreyEA21) [47] | Unclear | Low | Low | Low |
| (StylianouA16) [44] | Low | Low | Low | Low |
| (Tan09) [84] | Low | Low | Low | Low |
| (TanihanaN13) [100] | Low | Low | Low | Low |
| (TomaszewskiL06) [71] | Low | Low | Low | Low |
| (TrendM09) [105] | Low | Low | Low | Low |
| (Tsuno09) [53] | Low | Low | Low | Low |
| (TsunodaA17) [55] | Low | Low | Low | Low |
| (Wang12) [106] | Low | Low | Low | Low |
| (WangWZ08) [52] | Low | Low | Low | Low |
| (YilmazOC16) [3] | Low | Low | Low | Low |
| (ZhaoWW21) [107] | Low | Low | Low | Low |
| (BissiNE16) [25] | Unclear | Low | Low | Low |
| (CardozoNBFS10) [26] | Unclear | Unclear | Low | Unclear |
| (HernandezLopezPG13) [8] | Unclear | Unclear | Low | Unclear |
| (MohagheghiC07) [18] | High | Low | Low | Unclear |
| (OliveiraVCC17) [27] | Unclear | Unclear | Low | Unclear |
| (OliveiraCCV18) [28] | Unclear | Unclear | Low | Unclear |
| (Peter11) [29] | Unclear | Low | Low | Low |
| (RafiqueM13) [17] | Low | Low | Low | Low |
| (ShahPN15) [30] | Unclear | Unclear | Low | Unclear |
| (WagnerR08) [2] | High | Low | Unclear | Unclear |
| Key | Explanation for Downgrading |
|---|---|
| (AdamsCB09) [36] | Bug-tracking data were disregarded and only actual commits studied (observation risk); |
| (BankerK91) [62] | “Our final sample of 20 projects excluded one project among the initial 21 that was believed to be an outlier” (exclusion risk); “Bedell’s alternative strategy to cope with this ’functionality risk’ was to build the ICASE tool in house. Although the investment posed a major risk to the firm, First Boston Bank subsequently committed $65 million”, “This article addresses three principal research questions: did reusability lead to any significant productivity gains during the first two years of the deployment of the ICASE tool” (conflicting interests risk, studied tool financially supported by the company that demanded the study); |
| (BellerOBZ21) [74] | “We start to bridge the gap between them with an empirical study of 81 software developers at Microsoft” (conflicting interests risk, due to the authors’ affiliation); |
| (BeskerMB19) [87] | “This study’s selection of participating companies was carried out with a representative convenience sample of software professionals from our industrial partners” (selection-availability risk). “On average, each respondent reported their data on 11 out of 14 occasions” (missing data or non-response risk); |
| (BezerraEA20) [88] | “The survey used two approaches: (i) we used self-recruitment, sharing posts to invite members of social networking groups related to IT professionals on Facebook, Instagram and mailing lists; and, (ii) we sent out direct invitations to people we knew” (selection-availability risk); |
| (BibiSA08) [91] | “Although there are many missing values in the above fields (over 72%) and the extracted rules have low values of confidence, the results are satisfactory” (missing data risk); |
| (CarvalhoRSCB11) [58] | 14 samples were analyzed, but data were collected regarding 16 projects (selective reporting risk); |
| (CataldoH13) [40] | “We collected data from a multinational development organization responsible for producing a complex embedded system for the automotive industry” (conflicting interests risk, due to the affiliation of an author); |
| (Chatman95) [65] | “Current data retention does not preserve all the data implied by the change-point approach, so the results shown in the figures are incomplete” (missing data risk); “The figures present data collected for three releases of a product developed at IBM’s Santa Teresa Laboratory” (conflicting interests risk, due to the affiliation of the author); |
| (DiesteEtAll17) [23] | “The experimental subjects were convenience sampled” (selection-availability risk); “Although we had 126 experimental subjects, 11 observations were lost during the analysis as two subjects failed to complete the experimental task, six failed to report their academic qualifications and four failed to report any experience” (missing data or non-response risk); “Each quasi-experiment was measured by a single measurer” (measurement risk); |
| (Duarte17a) [54] | “Since our economic data set is sparse, in the sense that there are some missing observations in the middle of some periods, we used interpolation” (missing data risk); |
| (Duncan88) [61] | “The paper describes the software development process used within one software engineering group at Digital Equipment Corporation”, “The questions that the Commercial Languages and Tools software product engineering group at DEC asked are: how are we doing compared to ourselves in previous years? Can we quantify the impact of using software development tools?” (conflicting interests risk, due to the affiliation of the author); |
| (FaulkLVSV09) [83] | “We ran a set of experiments”, but only reduction ratio was reported (selective reporting risk); “Sun Microsystems took a broad view of the productivity problem”, “We studied the missions, technologies and practices at government-funded institutions”, “DARPA programmatic goal was to address ’real productivity”’ (conflicting interests risk, due to author’s affiliations and the source of funding); |
| (GraziotinWA15) [4] | “The participants have been obtained using convenience sampling” (selection-availability risk); “When questioned about the difficulties and about what influenced their productivity, the participants found difficulties in answering” (measurement-recall risk); |
| (GreenHC05) [82] | “A few respondents noted that it was too early to assess productivity gains. Therefore, some respondents did not respond to productivity related items” (non-response risk); |
| (HenshawJMB96) [66] | “In the organization we studied, requirements planning had been done using the AIX file and operating system” (conflicting interests risk, studied technology supplied by the employer of an author); |
| (HernandezLopezCSC15) [7] | “One of the authors contacted via e-mail ex-alumni with experience of at least one year in any activities of SE. From these, 15 positive answers were obtained. Interviews were conducted between April and October 2011” (selection-availability risk); “The authors wrote some posts in LinkedIn groups related to SE. 31% of the respondents accessed the questionnaire from LinkedIn” (selection-inception risk); |
| (HuangW09) [99] | “Since we do not have access to the proportion of SaaS revenue in a software company, we need to subjectively decide whether its SaaS operations are significant enough so that the target firm is coded as a mixed-SaaS firm. The other source of data limitations is that some firms do not mention their SaaS business in the annual report, or use a different name for SaaS services that is not captured by our Java program” (observation risk); |
| (JaloteK21) [75] | “As the data were not normally distributed, the Kruskal–Wallis non-parametric test was conducted after removing the outlier” (exclusion risk)” (exclusion risk); “We conducted this field study at Robert Bosch Engineering and Business Solutions Ltd (RBEI)” (conflicting interests risk, due to the affiliation of an author); |
| (JohnsonZB21) [76] | “We sent the survey to 1,252 individuals with an engineer or program management position at Microsoft in the Puget Sound area” (selection risk); “Design with a total of 1,159 participants” and “We sent the survey to 1,252 individuals” (selective reporting risk); “To address the lack of empirical data on work environments in software development, we carried out an empirical study of physical work environments at Microsoft” (conflicting interests risk, due to the authors’ affiliation); |
| (LavazzaMT18) [56] | “In the derivation of models, outliers, identified based on Cook’s distance, following a consolidated practice, were excluded” (exclusion risk); |
| (LavazzaLM20) [93] | “Data points with Cook’s distance greater than 4/n (n being the cardinality of the training set) were considered for removal” (exclusion risk); |
| (Lim94) [64] | “The reusable work products were written in Pascal and SPL, the Systems Programming Language for HP 300 computer system”, “The development operating system was HPUX” (conflicting interests risk, studied technology supplied by the employer of the author); |
| (MacCormackKCC03) [35] | “We removed from the analysis projects that were outliers on each performance dimension on a case-by-case analysis” (exclusion risk); “Our results are based on a sample of HP software development projects” (conflicting interests risk, studied technology supplied by the employer of an author); |
| (Maxwe96) [108] | “We present the results of our analysis of the European Space Agency software development database” (conflicting interests risk, studied projects funded by the research financial supporter). |
| (MaxwellF00) [49] | “The project grew and is now an STTF-managed commercial activity” (conflicting interests risk, studied database supplied by the employer of an author); |
| (MeyerBMZF17) [5] | “We used personal contacts, e-mails and sometimes a short presentation at the company to recruit participants” (selection-availability risk); |
| (MeyerZF17) [10] | “We advertised the survey by sending personalized invitation emails to 1600 professional software developers within Microsoft” (selection risk); “We analyze the variation in productivity perceptions based on an online survey with 413 professional software developers at Microsoft” (conflicting interests risk, due to the affiliation of an author); |
| (MoazeniLCB14) [41] | “The threat is mitigated for professional and student developers by the likelihood of distortions being common to all parts of the project” (measurement risk); “For a limited range of increments within a minor version of projects that have been going on for many years, the staff size and the applied effort of the staff members remained either constant or did not change significantly” (observation risk); |
| (Mockus09) [59] | “We investigate software development at Avaya with many past and present projects of various sizes and types involving more than 2000 developers” (conflicting interests risk, studied developers affiliated to the employer of the author); |
| (MosesFPS06) [51] | “It is necessary to assume that SLOC are counted in approximately the same way for the company” (measurement risk); |
| (OliveiraEA20) [46] | “We have contacted as many companies as possible to ask for authorization to analyze their projects” (inception risk); |
| (PalaciosCSGT14) [42] | “Participants were obtained from those who responded positively to a personal invitation sent by the authors to contacts working in Spanish and French IT companies” (selection-availability risk); |
| (PortM99) [69] | “The organization requesting the study hoped to compare the projects through the metric of productivity”, “The customer of this study was particularly interested in this aspect” (conflicting interests risk, studied projects supported by the employer of an author); |
| (PotokV97) [68] | “The empirical data was collected at the IBM Software Solutions Laboratory in Research Triangle Park, North Carolina” (conflicting interests risk, studied projects supported by the employer of the authors); |
| (PotokVR99) [48] | “The empirical data discussed in this paper was collected at IBM Software Solutions”, “The measurements collected are defined by a corporate metric council” (conflicting interests risk, studied projects supported by the employer of an author); |
| (PremrajSKF05) [50] | “The authors regret that presently the data set is not publicly available” (conflicting interests risk, studied database supported by the employer of an author); |
| (RamasubbuCBH11) [38] | “CodeMine provides a data collection framework for all major Microsoft development teams”, “We conducted quantitative analysis on the version control system data and employee information stores in CodeMine” (conflicting interests risk, due to the affiliation of most authors); |
| (SiokT07) [72] | “The goal of this study was to provide answers to several questions regarding software development productivity and product quality within the avionics software engineering organization” (conflicting interests risk, studied projects supported by the employer of an author); |
| (StoreyEA21) [47] | “Our case company, Microsoft, is a large software company with tens of thousands of developers distributed in offices around the word” (conflicting interests risk, due to the affiliation of most authors); |
| (BissiNE16) [25] | No risk of bias assessment (performance risk); |
| (CardozoNBFS10) [26] | No risk of bias assessment (performance risk); Synthesis methods were not sufficiently detailed (selective non-reporting risk); |
| (HernandezLopezPG13) [8] | No risk of bias assessment (performance risk); Synthesis methods were not sufficiently detailed (selective non-reporting risk); |
| (MohagheghiC07) [18] | Paper screening, inclusion and exclusion criteria not sufficiently detailed (selection risk); No risk of bias assessment (performance risk); |
| (OliveiraVCC17) [27] | No risk of bias assessment (performance risk); Synthesis methods were not sufficiently detailed (selective non-reporting risk); |
| (OliveiraCCV18) [28] | No risk of bias assessment (performance risk); Synthesis methods were not sufficiently detailed (selective non-reporting risk); |
| (Peter11) [29] | No risk of bias assessment (performance risk); |
| (ShahPN15) [30] | No risk of bias assessment (performance risk); Synthesis methods were not sufficiently detailed (selective non-reporting risk); |
| (WagnerR08) [2] | “We inspected the first 100 results of each portal. We also collected papers manually in a number of important journals” (selection risk); No risk of bias assessment (performance risk); “The ProdFLOW method uses interview techniques for determining the most influential factors in productivity for a specific organization. ProdFLOW is a registered trademark of the Siemens AG” (conflicting interest risk, due to the affiliation of an author). |
Appendix C. Evaluation of Certainty in the Body of Evidence
| Key | Certainty Evaluation Criteria | ||
|---|---|---|---|
| C1 | C2 | C3 | |
| (AbdelHamid96) [79] | Low | Low | Low |
| (AdamsCB09) [36] | Low | Low | Low |
| (AsmildPK06) [70] | High | Low | High |
| (AzzehN17) [85] | High | Low | High |
| (AzzehN18) [86] | High | Low | High |
| (BankerDK91) [96] | High | Low | High |
| (BankerK91) [62] | Moderate | Unclear | Low |
| (BankerS94) [63] | Moderate | Low | Moderate |
| (BellerOBZ21) [74] | Moderate | Unclear | Low |
| (BeskerMB19) [87] | Moderate | Unclear | Low |
| (BezerraEA20) [88] | Moderate | Low | Moderate |
| (BibiAS16) [98] | Low | Low | Low |
| (BibiSA08) [91] | Moderate | Low | Moderate |
| (Boehm87) [21] | Moderate | Low | Moderate |
| (Boehm99a) [80] | Moderate | Low | Moderate |
| (CarvalhoRSCB11) [58] | Low | Unclear | Very low |
| (CataldoH13) [40] | Low | Low | Low |
| (ChapettaT20) [24] | Moderate | Low | Moderate |
| (Chatman95) [65] | Low | Unclear | Very low |
| (CheikhiARI12) [11] | Moderate | Low | Moderate |
| (DamianC06) [9] | Moderate | Low | Moderate |
| (DiesteEtAll17) [23] | High | Unclear | Moderate |
| (Duarte17a) [54] | Moderate | Low | Moderate |
| (Duncan88) [61] | Low | Unclear | Very low |
| (FatemaS17) [6] | Moderate | Low | Moderate |
| (FaulkLVSV09) [83] | Moderate | Unclear | Low |
| (FrakesS01) [81] | Moderate | Low | Moderate |
| (GeH11) [90] | Moderate | Low | Moderate |
| (GraziotinWA15) [4] | Moderate | Unclear | Low |
| (GreenHC05) [82] | Moderate | Low | Moderate |
| (HenshawJMB96) [66] | Low | Low | Low |
| (HernandezLopezCSC15) [7] | Moderate | Unclear | Low |
| (HernandezLopezPGC11) [32] | Moderate | Low | Moderate |
| (HuangW09) [99] | High | Low | High |
| (JaloteK21) [75] | Moderate | Unclear | Low |
| (JohnsonZB21) [76] | Moderate | Unclear | Low |
| (KautzJU14) [73] | Low | Low | Low |
| (KemayelMO91) [109] | Moderate | Low | Moderate |
| (KitchenhamM04) [22] | High | Low | High |
| (KreinMKDE10) [94] | High | Low | High |
| (KuutilaMCEA21) [102] | Moderate | Low | Moderate |
| (LagerstromWHL12) [57] | High | Low | High |
| (LavazzaMT18) [56] | Moderate | Low | Moderate |
| (LavazzaLM20) [93] | Moderate | Low | Moderate |
| (LiaoEA21) [95] | Moderate | Low | Moderate |
| (Lim94) [64] | Low | Unclear | Very low |
| (LowJ91) [77] | Moderate | Low | Moderate |
| (MacCormackKCC03) [35] | Moderate | Unclear | Low |
| (MantylaADGO16) [60] | Moderate | Low | Moderate |
| (Maxwe96) [108] | High | Low | High |
| (MaxwellF00) [49] | Low | Low | Low |
| (MeloCKC13) [12] | Low | Low | Low |
| (MeyerBMZF17) [5] | Moderate | Low | Moderate |
| (MeyerZF17) [10] | Moderate | Unclear | Low |
| (MinetakiM09) [104] | Moderate | Low | Moderate |
| (MoazeniLCB14) [41] | Low | Unclear | Very low |
| (Mockus09) [59] | High | Unclear | Moderate |
| (Mohapatra11) [37] | Moderate | Low | Moderate |
| (MosesFPS06) [51] | Low | Low | Low |
| (MurphyHillEA21) [89] | High | Low | High |
| (OliveiraEA20) [46] | Moderate | Low | Moderate |
| (PalaciosCSGT14) [42] | Moderate | Low | Moderate |
| (ParrishSHH04) [97] | Low | Low | Low |
| (PortM99) [69] | Low | Low | Low |
| (PotokV97) [68] | Low | Unclear | Very low |
| (PotokVR99) [48] | High | Low | High |
| (PremrajSKF05) [50] | High | Low | High |
| (RamasubbuCBH11) [38] | High | Low | High |
| (RastogiT0NC17) [45] | Moderate | Low | Moderate |
| (RodriguezSGH12) [39] | High | Low | High |
| (Rubin93a) [78] | Moderate | Low | Moderate |
| (Scacchi91) [103] | Moderate | Low | Moderate |
| (ScholtesMS16) [43] | High | Low | High |
| (SentasASB05) [92] | Moderate | Low | Moderate |
| (SiokT07) [72] | Moderate | Low | Moderate |
| (SovaS96) [67] | Low | Low | Low |
| (StaplesEA14) [101] | Moderate | Low | Moderate |
| (StoreyEA21) [47] | High | Low | High |
| (StylianouA16) [44] | Low | Low | Low |
| (Tan09) [84] | Low | Low | Low |
| (TanihanaN13) [100] | Low | Low | Low |
| (TomaszewskiL06) [71] | Low | Low | Low |
| (TrendM09) [105] | Moderate | Low | Moderate |
| (Tsuno09) [53] | Moderate | Low | Moderate |
| (TsunodaA17) [55] | Moderate | Low | Moderate |
| (Wang12) [106] | Moderate | Low | Moderate |
| (WangWZ08) [52] | Low | Low | Low |
| (YilmazOC16) [3] | Moderate | Low | Moderate |
| (ZhaoWW21) [107] | Moderate | Low | Moderate |
| (BissiNE16) [25] | High | Low | High |
| (CardozoNBFS10) [26] | High | Unclear | Moderate |
| (HernandezLopezPG13) [8] | High | Unclear | Moderate |
| (MohagheghiC07) [18] | High | Unclear | Moderate |
| (OliveiraVCC17) [27] | High | Unclear | Moderate |
| (OliveiraCCV18) [28] | High | Unclear | Moderate |
| (Peter11) [29] | High | Low | High |
| (RafiqueM13) [17] | High | Low | High |
| (ShahPN15) [30] | High | Unclear | Moderate |
| (WagnerR08) [2] | High | Unclear | Moderate |
References
- Boehm, B.W. Software Engineering Economics; Prentice-Hall: Hoboken, NJ, USA, 1981. [Google Scholar]
- Wagner, S.; Ruhe, M. A Systematic Review of Productivity Factors in Software Development. In Proceedings of the 2nd International Workshop on Software Productivity Analysis and Cost Estimation (SPACE 2008), Beijing, China, 2 December 2008. [Google Scholar]
- Yilmaz, M.; O’Connor, R.V.; Clarke, P. Effective Social Productivity Measurements during Software Development—An Empirical Study. J. Softw. Eng. Knowl. Eng. 2016, 26, 457–490. [Google Scholar] [CrossRef]
- Graziotin, D.; Wang, X.; Abrahamsson, P. Do feelings matter? On the correlation of affects and the self-assessed productivity in software engineering. J. Softw. Evol. Process 2015, 27, 467–487. [Google Scholar] [CrossRef]
- Meyer, A.; Barton, L.; Murphy, G.C.; Zimmermann, T.; Fritz, T. The Work-Life of Developers: Activities, Switches and Perceived Productivity. IEEE Trans. Softw. Eng. 2017, 43, 1178–1193. [Google Scholar] [CrossRef]
- Fatema, I.; Sakib, K. Factors Influencing Productivity of Agile Software Development Teamwork: A Qualitative System Dynamics Approach. In Proceedings of the 24th Asia-Pacific Software Engineering Conference (APSEC 2017), Nanjing, China, 4–8 December 2017; Lv, J., Zhang, H.J., Hinchey, M., Liu, X., Eds.; IEEE: Piscataway, NJ, USA, 2017; pp. 737–742. [Google Scholar]
- Hernández-López, A.; Palacios, R.C.; Soto-Acosta, P.; Casado-Lumbreras, C. Productivity Measurement in Software Engineering: A Study of the Inputs and the Outputs. Int. J. Inf. Technol. Syst. Appl. 2015, 8, 46–68. [Google Scholar] [CrossRef]
- Hernández-López, A.; Palacios, R.C.; García-Crespo, Á. Software Engineering Job Productivity—A Systematic Review. J. Softw. Eng. Knowl. Eng. 2013, 23, 387–406. [Google Scholar] [CrossRef]
- Damian, D.; Chisan, J. An Empirical Study of the Complex Relationships between Requirements Engineering Processes and Other Processes that lead to Payoffs in Productivity, Quality and Risk Management. IEEE Trans. Softw. Eng. 2006, 32, 433–453. [Google Scholar] [CrossRef]
- Meyer, A.; Zimmermann, T.; Fritz, T. Characterizing Software Developers by Perceptions of Productivity. In Proceedings of the International Symposium on Empirical Software Engineering and Measurement (ESEM 2017), Markham, ON, Canada, 9–10 November 2017; Bener, A., Turhan, B., Biffl, S., Eds.; IEEE: Piscataway, NJ, USA, 2017; pp. 105–110. [Google Scholar]
- Cheikhi, L.; Al-Qutaish, R.E.; Idri, A. Software Productivity: Harmonization in ISO/IEEE Software Engineering Standards. J. Softw. 2012, 7, 462–470. [Google Scholar] [CrossRef][Green Version]
- de O. Melo, C.; Cruzes, D.S.; Kon, F.; Conradi, R. Interpretative case studies on agile team productivity and management. Inf. Softw. Technol. 2013, 55, 412–427. [Google Scholar] [CrossRef]
- Duarte, C.H.C. The Quest for Productivity in Software Engineering: A Practitioners Systematic Literature Review. In Proceedings of the International Conference of Systems and Software Processes (ICSSP 2019), Montreal, QC, Canada, 25 May 2019; pp. 145–154. [Google Scholar]
- Kitchenham, B.; Charters, S. Guidelines for Performing Systematic Literature Reviews in Software Engineering; Technical Report EBSE 2007-001, Keele University and Durham University Joint Report. 2007. Available online: https://www.elsevier.com/__data/promis_misc/525444systematicreviewsguide.pdf (accessed on 31 January 2022).
- Page, M.J.; McKenzie, J.E.; Bossuyt, P.M.; Boutron, I.; Hoffmann, T.C.; Mulrow, C.D.; Shamseer, L.; Tetzlaff, J.M.; Akl, E.A.; Brennan, S.E.; et al. The PRISMA 2020 Statement: An Updated Guideline for Reporting Systematic Reviews. PLoS Med. 2021, 18, e1003583. [Google Scholar] [CrossRef]
- Schünemann, H.; Brożek, J.; Guyatt, G.; Oxman, A. Handbook for Grading the Quality of Evidence and the Strength of Recommendations Using the GRADE Approach. 2013. Available online: https://gradepro.org/handbook (accessed on 31 January 2022).
- Rafique, Y.; Misic, V.B. The Effects of Test-Driven Development on External Quality and Productivity: A Meta-Analysis. IEEE Trans. Softw. Eng. 2013, 39, 835–856. [Google Scholar] [CrossRef]
- Mohagheghi, P.; Conradi, R. Quality, productivity and economic benefits of software reuse: A review of industrial studies. Empir. Softw. Eng. 2007, 12, 471–516. [Google Scholar] [CrossRef]
- Basili, V.; Caldiera, G.; Rombach, H.D. Goal Question Metric (GCM) Approach. In Encyclopedia of Software Engineering; Wiley: Hoboken, NJ, USA, 2002; pp. 528–532. [Google Scholar]
- Ley, M. DBLP: Some Lessons Learned. Proc. VLDB Endow. 2009, 2, 1493–1500. [Google Scholar] [CrossRef]
- Boehm, B.W. Improving Software Productivity. IEEE Comput. 1987, 20, 43–57. [Google Scholar] [CrossRef]
- Kitchenham, B.; Mendes, E. Software productivity measurement using multiple size measures. IEEE Trans. Softw. Eng. 2004, 30, 1023–1035. [Google Scholar] [CrossRef]
- Dieste, O.; Aranda, A.M.; Uyaguari, F.U.; Turhan, B.; Tosun, A.; Fucci, D.; Oivo, M.; Juristo, N. Empirical evaluation of the effects of experience on code quality and programmer productivity: An exploratory study. Empir. Softw. Eng. 2017, 22, 2457–2542. [Google Scholar] [CrossRef]
- Chapetta, W.A.; Travassos, G.H. Towards an evidence-based theoretical framework on factors influencing the software development productivity. Empir. Softw. Eng. 2020, 25, 3501–3543. [Google Scholar] [CrossRef]
- Bissi, W.; Neto, A.G.S.S.; Emer, M.C.F.P. The effects of test-driven development on internal quality, external quality and productivity: A systematic review. Inf. Softw. Technol. 2016, 74, 45–54. [Google Scholar] [CrossRef]
- Cardozo, E.S.F.; Neto, J.B.F.A.; Barza, A.; França, A.C.C.; da Silva, F.Q.B. Scrum and Productivity in Software Projects: A Systematic Literature Review. In Proceedings of the 14th International Conference on Evaluation and Assessment in Software Engineering (EASE 2010), Keele, UK, 12–13 April 2010. [Google Scholar]
- de Oliveira, E.C.C.; Viana, D.; Cristo, M.; Conte, T. How have Software Engineering Researchers been Measuring Software Productivity? A Systematic Mapping Study. In Proceedings of the 19th International Conference on Enterprise Information Systems (ICEIS 2017), Porto, Portugal, 26–29 April 2017; Hammoudi, S., Smialek, M., Camp, O., Filipe, J., Eds.; SciTePress: Setubal, Portugal, 2017; Volume 2, pp. 76–87. [Google Scholar]
- de Oliveira, E.C.C.; Conte, T.; Cristo, M.; Valentim, N.M.C. Influence Factors in Software Productivity: Tertiary Literature Review. J. Softw. Eng. Knowl. Eng. 2018, 28, 1795–1810. [Google Scholar] [CrossRef]
- Petersen, K. Measuring and Predicting Software Productivity. Inf. Softw. Technol. 2011, 53, 317–343. [Google Scholar] [CrossRef]
- Shah, S.M.A.; Papatheocharous, E.; Nyfjord, J. Measuring productivity in agile software development process: A scoping study. In Proceedings of the International Conference on Software and System Process (ICSSP 2015), Tallinn, Estonia, 24–26 August 2015; pp. 102–106. [Google Scholar]
- Jalali, S.; Wohlin, C. Systematic Literature Studies: Database Searches vs. Backward Snowballing. In Proceedings of the International Symposium on Empirical Software Engineering and Measurement (ESEM 2012), Lund, Sweden, 19–20 September 2012; pp. 29–38. [Google Scholar]
- Hernández-López, A.; Palacios, R.C.; García-Crespo, Á.; Cabezas-Isla, F. Software Engineering Productivity: Concepts, Issues and Challenges. Int. J. Inf. Technol. Syst. Approach 2011, 2, 37–47. [Google Scholar] [CrossRef][Green Version]
- Bourque, P.; Fairley, R.E. (Eds.) Guide to the Software Engineering Body of Knowledge (SWEBOK), 3rd ed.; IEEE: Piscataway, NJ, USA, 2014. [Google Scholar]
- Wohlin, C.; Runeson, P.; Høst, M.; Ohlsson, M.C.; Regnell, B.; Wesslén, A. Experimentation in Software Engineering; Springer: Berlin/Heidelberg, Germany, 2012. [Google Scholar]
- MacCormack, A.; Kemerer, C.F.; Cusumano, M.A.; Crandall, B. Trade-offs between Productivity and Quality in Selecting Software Development Practices. IEEE Softw. 2003, 20, 78–85. [Google Scholar] [CrossRef]
- Adams, P.J.; Capiluppi, A.; Boldyreff, C. Coordination and productivity issues in free software: The role of Brooks’ Law. In Proceedings of the 25th International Conference on Software Maintenance (ICSM 2009), Edmonton, AB, Canada, 20–26 September 2009; pp. 319–328. [Google Scholar]
- Mohapatra, S. Maximising productivity by controlling influencing factors in commercial software development. J. Inf. Commun. Technol. 2011, 3, 160–179. [Google Scholar] [CrossRef]
- Ramasubbu, N.; Cataldo, M.; Balan, R.K.; Herbsleb, J.D. Configuring global software teams: A multi-company analysis of project productivity, quality, and profits. In Proceedings of the 33rd International Conference on Software Engineering (ICSE 2011), Honolulu, HI, USA, 21–28 May 2011; Taylor, R.N., Gall, H.C., Medvidovic, N., Eds.; ACM: New York, NY, USA, 2011; pp. 261–270. [Google Scholar]
- Rodríguez-García, D.; Sicilia, M.; Barriocanal, E.G.; Harrison, R. Empirical findings on team size and productivity in software development. J. Syst. Softw. 2012, 85, 562–570. [Google Scholar] [CrossRef]
- Cataldo, M.; Herbsleb, J.D. Coordination Breakdowns and Their Impact on Development Productivity and Software Failures. IEEE Trans. Softw. Eng. 2013, 39, 343–360. [Google Scholar] [CrossRef]
- Moazeni, R.; Link, D.; Chen, C.; Boehm, B.W. Software domains in incremental development productivity decline. In Proceedings of the International Conference on Software and Systems Process (ICSSP 2014), Nanjing, China, 26–28 May 2014; Zhang, H., Huang, L., Richardson, I., Eds.; ACM: New York, NY, USA, 2014; pp. 75–83. [Google Scholar]
- Palacios, R.C.; Casado-Lumbreras, C.; Soto-Acosta, P.; García-Peñalvo, F.J.; Tovar, E. Project managers in global software development teams: A study of the effects on productivity and performance. Softw. Qual. J. 2014, 22, 3–19. [Google Scholar] [CrossRef]
- Scholtes, I.; Mavrodiev, P.; Schweitzer, F. From Aristotle to Ringelmann: A large-scale analysis of team productivity and coordination in Open-Source Software projects. Empir. Softw. Eng. 2016, 21, 642–683. [Google Scholar] [CrossRef]
- Stylianou, C.; Andreou, A.S. Investigating the impact of developer productivity, task interdependence type and communication overhead in a multi-objective optimization approach for software project planning. Adv. Eng. Softw. 2016, 98, 79–96. [Google Scholar] [CrossRef]
- Rastogi, A.; Thummalapenta, S.; Zimmermann, T.; Nagappan, N.; Czerwonka, J. Ramp-up Journey of New Hires: Do strategic practices of software companies influence productivity? In Proceedings of the 10th Innovations in Software Engineering Conference (ISEC 2017), Jaipur, India, 5–7 February 2017; pp. 107–111. [Google Scholar]
- Oliveira, E.; Fernandes, E.; Steinmacher, I.; Cristo, M.; Conte, T.; Garcia, A. Code and commit metrics of developer productivity: A study on team leaders perceptions. Empir. Softw. Eng. 2020, 25, 2519–2549. [Google Scholar] [CrossRef]
- Storey, M.A.D.; Zimmermann, T.; Bird, C.; Czerwonka, J.; Murphy, B.; Kalliamvakou, E. Towards a Theory of Software Developer Job Satisfaction and Perceived Productivity. IEEE Trans. Softw. Eng. 2021, 47, 2125–2142. [Google Scholar] [CrossRef]
- Potok, T.E.; Vouk, M.A.; Rindos, A. Productivity Analysis of Object-Oriented Software Development in a Commercial Environment. Softw. Pract. Exp. 1999, 29, 833–847. [Google Scholar] [CrossRef]
- Maxwell, K.D.; Forselius, P. Benchmarking Software-Development Productivity. IEEE Softw. 2000, 17, 80–88. [Google Scholar] [CrossRef]
- Premraj, R.; Shepperd, M.J.; Kitchenham, B.A.; Forselius, P. An Empirical Analysis of Software Productivity over Time. In Proceedings of the 11th International Symposium on Software Metrics (METRICS 2005), Como, Italy, 19–22 September 2005; pp. 37–46. [Google Scholar]
- Moses, J.; Farrow, M.; Parrington, N.; Smith, P. A productivity benchmarking case study using Bayesian credible intervals. Softw. Qual. J. 2006, 14, 37–52. [Google Scholar] [CrossRef]
- Wang, H.; Wang, H.; Zhang, H. Software Productivity Analysis with CSBSG Data Set. In Proceedings of the International Conference on Computer Science and Software Engineering (CSSE 2008), Wuhan, China, 12–14 December 2008; Volume 2, pp. 587–593. [Google Scholar]
- Tsunoda, M.; Monden, A.; Yadohisa, H.; Kikuchi, N.; Matsumoto, K. Software Development Productivity of Japanese Enterprise Applications. Inf. Technol. Manag. 2009, 10, 193–205. [Google Scholar] [CrossRef]
- Duarte, C.H.C. Productivity Paradoxes Revisited: Assessing the Relationship Between Quality Maturity Levels and Labor Productivity in Brazilian Software Companies. Empir. Softw. Eng. 2017, 22, 818–847. [Google Scholar] [CrossRef]
- Tsunoda, M.; Amasaki, S. On Software Productivity Analysis with Propensity Score Matching. In Proceedings of the International Symposium on Empirical Software Engineering and Measurement (ESEM 2017), Toronto, ON, Canada, 9–10 November 2017; Bener, A., Turhan, B., Biffl, S., Eds.; IEEE: Piscataway, NJ, USA, 2017; pp. 436–441.
- Lavazza, L.; Morasca, S.; Tosi, D. An Empirical Study on the Factors Affecting Software Development Productivity. e-Inform. Softw. Eng. J. 2018, 12, 27–49. [Google Scholar]
- Lagerström, R.; von Würtemberg, L.M.; Holm, H.; Luczak, O. Identifying factors affecting software development cost and productivity. Softw. Qual. J. 2012, 20, 395–417. [Google Scholar] [CrossRef]
- de Souza Carvalho, W.C.; Rosa, P.F.; dos Santos Soares, M.; da Cunha, M.A.T., Jr.; Buiatte, L.C. A Comparative Analysis of the Agile and Traditional Software Development Processes Productivity. In Proceedings of the 30th International Conference of the Chilean Computer Science Society (SCCC 2011), Curico, Chile, 9–11 November 2011; pp. 74–82. [Google Scholar]
- Mockus, A. Succession: Measuring transfer of code and developer productivity. In Proceedings of the 31st International Conference on Software Engineering (ICSE 2009), Vancouver, BC, Canada, 16–24 May 2009; pp. 67–77. [Google Scholar]
- Mantyla, M.; Adams, B.; Destefanis, G.; Graziotin, D.; Ortu, M. Mining Valence, arousal, and Dominance—Possibilities for detecting burnout and productivity? In Proceedings of the 13th Conference on Mining Software Repositories (MSR 2016), Austin, TX, USA, 14–22 May 2016; Kim, M., Robbes, R., Bird, C., Eds.; ACM: New York, NY, USA, 2016; pp. 247–258. [Google Scholar]
- Duncan, A.S. Software Development Productivity Tools and Metrics. In Proceedings of the 10th International Conference on Software Engineering (ICSE 1988), Singapore, 11–15 April 1988; Nam, T.C., Druffel, L.E., Meyer, B., Eds.; IEEE: Piscataway, NJ, USA, 1988; pp. 41–48. [Google Scholar]
- Banker, R.D.; Kauffman, R.J. Reuse and Productivity in Integrated Computer-Aided Software Engineering: An Empirical Study. MIS Q. 1991, 15, 375–401. [Google Scholar] [CrossRef]
- Banker, R.D.; Slaughter, S. Project Size and Software Maintenance Productivity: Empirical Evidence on Economies of Scale in Software Maintenance. In Proceedings of the 15th International Conference on Information Systems, Vancouver, BC, Canada, 14–17 December 1994; DeGross, J.I., Huff, S.L., Munro, M., Eds.; Association for Information Systems: Atlanta, GA, USA, 1994; pp. 279–289. [Google Scholar]
- Lim, W.C. Effects of Reuse on Quality, Productivity, and Economics. IEEE Softw. 1994, 11, 23–30. [Google Scholar] [CrossRef]
- Chatman, V.V., III. CHANGE-POINTs: A proposal for software productivity measurement. J. Syst. Softw. 1995, 31, 71–91. [Google Scholar] [CrossRef]
- Bruckhaus, T.; Madhavji, N.H.; Henshaw, J.; Janssen, I. The Impact of Tools on Software Productivity. IEEE Softw. 1996, 13, 29–38. [Google Scholar] [CrossRef]
- Sova, D.W.; Smidts, C.S. Increasing testing productivity and software quality: A comparison of software testing methodologies within NASA. Empir. Softw. Eng. 1996, 1, 165–188. [Google Scholar] [CrossRef]
- Potok, T.E.; Vou, M.A. The Effects of the Business Model on Object-Oriented Software Development Productivity. IBM Syst. J. 1997, 36, 140–161. [Google Scholar] [CrossRef]
- Port, D.; McArthur, M. A Study of Productivity and Efficiency for Object-Oriented Methods and Languages. In Proceedings of the 6th Asia-Pacific Software Engineering Conference (APSEC 1999), Takamatsu, Japan, 7–10 December 1999; pp. 128–135. [Google Scholar]
- Asmild, M.; Paradi, J.C.; Kulkarni, A. Using Data Envelopment Analysis in software development productivity measurement. Softw. Process. Improv. Pract. 2006, 11, 561–572. [Google Scholar] [CrossRef]
- Tomaszewski, P.; Lundberg, L. The increase of productivity over time—An industrial case study. Inf. Softw. Technol. 2006, 48, 915–927. [Google Scholar] [CrossRef]
- Siok, M.F.; Tian, J. Empirical Study of Embedded Software Quality and Productivity. In Proceedings of the 10th International Symposium on High-Assurance Systems Engineering (HASE 2007), Dallas, TX, USA, 14–16 November 2007; pp. 313–320. [Google Scholar]
- Kautz, K.; Johansen, T.H.; Uldahl, A. The Perceived Impact of the Agile Development and Project Management Method Scrum on Information Systems and Software Development Productivity. Australas. J. Inf. Syst. 2014, 18, 303–315. [Google Scholar] [CrossRef]
- Beller, M.; Orgovan, V.R.; Buja, S.; Zimmermann, T. Mind the Gap: On the Relationship between Automatically Measured and Self-Reported Productivity. IEEE Softw. 2021, 38, 24–31. [Google Scholar] [CrossRef]
- Jalote, P.; Kamma, D. Studying Task Processes for Improving Programmer Productivity. Trans. Softw. Eng. 2021, 47, 801–817. [Google Scholar] [CrossRef]
- Johnson, B.; Zimmermann, T.; Bird, C. The Effect of Work Environments on Productivity and Satisfaction of Software Engineers. IEEE Trans. Softw. Eng. 2021, 47, 736–757. [Google Scholar] [CrossRef]
- Low, G.; Jeffery, D. Software development productivity and back-end CASE tools. Inf. Softw. Technol. 1991, 33, 616–621. [Google Scholar] [CrossRef]
- Rubin, H.A. Software process maturity: Measuring its impact on productivity and quality. In Proceedings of the 15th International Conference on Software Engineering (ICSE 1993), Baltimore, MA, USA, 17–21 May 1993; pp. 468–476. [Google Scholar]
- Abdel-Hamid, T.K. The Slippery Path to Productivity Improvement. IEEE Softw. 1996, 13, 43–52. [Google Scholar] [CrossRef]
- Boehm, B.W. Managing Software Productivity and Reuse. IEEE Comput. 1999, 32, 111–113. [Google Scholar] [CrossRef]
- Frakes, W.B.; Succi, G. An industrial study of reuse, quality, and productivity. J. Syst. Softw. 2001, 57, 99–106. [Google Scholar] [CrossRef]
- Green, G.C.; Hevner, A.R.; Collins, R.W. The impacts of quality and productivity perceptions on the use of software process improvement innovations. Inf. Softw. Technol. 2005, 47, 543–553. [Google Scholar] [CrossRef]
- Faulk, S.R.; Loh, E.; de Vanter, M.L.V.; Squires, S.; Votta, L.G. Scientific Computing’s Productivity Gridlock: How Software Engineering Can Help. Comput. Sci. Eng. 2009, 11, 30–39. [Google Scholar] [CrossRef]
- Tan, T.; Li, Q.; Boehm, B.; Yang, Y.; Hei, M.; Moazeni, R. Productivity Trends in Incremental and Iterative Software Development. In Proceedings of the 3rd International Symposium on Empirical Software Engineering and Measurement (ESEM 2009), Lake Buena Vista, FL, USA, 15–16 October 2009; pp. 1–10. [Google Scholar]
- Azzeh, M.; Nassif, A.B. Analyzing the relationship between project productivity and environment factors in the use case points method. J. Softw. Evol. Process 2017, 29–53, e1882. [Google Scholar] [CrossRef]
- Azzeh, M.; Nassif, A.B. Project productivity evaluation in early software effort estimation. J. Softw. Evol. Process 2018, 30, e2110. [Google Scholar] [CrossRef]
- Besker, T.; Martini, A.; Bosch, J. Software developer productivity loss due to technical debt—A replication and extension study examining developers’ development work. J. Syst. Softw. 2019, 156, 41–61. [Google Scholar] [CrossRef]
- Bezerra, C.I.M.; de Souza Filho, J.C.; Coutinho, E.F.; Gama, A.; Ferreira, A.L.; ao de Andrade, G.L.; Feitosa, C.E. How Human and Organizational Factors Influence Software Teams Productivity in COVID-19 Pandemic: A Brazilian Survey. In Proceedings of the 34th Brazilian Symposium on Software Engineering (SBES 2020), Natal, Brazil, 21–23 October 2020; pp. 606–615. [Google Scholar]
- Murphy-Hill, E.R.; Jaspan, C.; Sadowski, C.; Shepherd, D.C.; Phillips, M.; Winter, C.; Knight, A.; Smith, E.K.; Jorde, M. What Predicts Software Developers’ Productivity? IEEE Trans. Softw. Eng. 2021, 47, 582–594. [Google Scholar] [CrossRef]
- Ge, C.; Huang, K. Productivity Differences and Catch-Up Effects among Software as a Service Firms: A Stochastic Frontier Approach. In Proceedings of the International Conference on Information Systems (ICIS 2011), Shanghai, China, 4–7 December 2011; Galletta, D.F., Liang, T., Eds.; Association for Information Systems: Atlanta, GA, USA, 2011. [Google Scholar]
- Bibi, S.; Stamelos, I.; Ampatzoglou, A. Combining probabilistic models for explanatory productivity estimation. Inf. Softw. Technol. 2008, 50, 656–669. [Google Scholar] [CrossRef]
- Sentas, P.; Angelis, L.; Stamelos, I.; Bleris, G.L. Software productivity and effort prediction with ordinal regression. Inf. Softw. Technol. 2005, 47, 17–29. [Google Scholar] [CrossRef]
- Lavazza, L.; Liu, G.; Meli, R. Productivity of software enhancement projects: An empirical study. In Proceedings of the Joint 30th International Workshop on Software Measurement and the 15th International Conference on Software Process and Product Measurement (IWSM-Mensura 2020), Mexico City, Mexico, 29–30 October 2020. [Google Scholar]
- Krein, J.L.; MacLean, A.C.; Knutson, C.D.; Delorey, D.P.; Eggett, D. Impact of Programming Language Fragmentation on Developer Productivity: A Sourceforge Empirical Study. Int. J. Open-Source Softw. Process. 2010, 2, 41–61. [Google Scholar] [CrossRef]
- Liao, Z.; Zhao, Y.; Liu, S.; Zhang, Y.; Liu, L.; Long, J. The Measurement of the Software Ecosystem’s Productivity with GitHub. Comput. Syst. Sci. Eng. 2021, 36, 239–258. [Google Scholar] [CrossRef]
- Banker, R.D.; Datar, S.M.; Kemerer, C.F. Model to evaluate variables impact in the productivity of software maintenance projects. Manag. Sci. 1991, 37, 1–18. [Google Scholar] [CrossRef]
- Parrish, A.S.; Smith, R.K.; Hale, D.P.; Hale, J.E. A Field Study of Developer Pairs: Productivity Impacts and Implications. IEEE Softw. 2004, 21, 76–79. [Google Scholar] [CrossRef]
- Bibi, S.; Ampatzoglou, A.; Stamelos, I. A Bayesian Belief Network for Modeling Open-Source Software Maintenance Productivity. In Proceedings of the International Conference 12th IFIP WG 2.13 Open-Source Systems: Integrating Communities (OSS 2016), Gothenburg, Sweden, 30 May–2 June 2016; IFIP Advances in Information and Communication Technology. Springer: Berlin/Heidelberg, Germany, 2016; Volume 472, pp. 32–44. [Google Scholar]
- Huang, K.; Wang, M. Firm-Level Productivity Analysis for Software as a Service Companies. In Proceedings of the Information Conference on Information Systems (ICIS 2009), Phoenix, AZ, USA, 15–18 December 2009; pp. 1–17. [Google Scholar]
- Tanihana, K.; Noda, T. Empirical Study of the Relation between Open-Source Software Use and Productivity of Japan’s Information Service Industries. In Proceedings of the 9th IFIP WG 2.13 International Conference on Open-Source Software: Quality Verification (OSS 2013), Koper-Capodistria, Slovenia, 25–28 June 2013; Petrinja, E., Succi, G., Joni, N.E., Sillitti, A., Eds.; Springer: Berlin/Heidelberg, Germany, 2013; pp. 18–29. [Google Scholar]
- Staples, M.; Jeffery, R.; Andronick, J.; Murray, T.; Klein, G.; Kolanski, R. Productivity for proof engineering. In Proceedings of the 8th International Symposium on Empirical Software Engineering and Measurement (ESEM 2014), Torino, Italy, 18–19 September 2014; Morisio, M., Dyba, T., Torchiano, M., Eds.; ACM: New York, NY, USA, 2014; pp. 1–4. [Google Scholar]
- Kuutila, M.; Mäntylä, M.; Claes, M.; Elovainio, M.; Adams, B. Individual differences limit predicting well-being and productivity using software repositories: A longitudinal industrial study. Empir. Softw. Eng. 2021, 26, 88. [Google Scholar] [CrossRef]
- Scacchi, W. Understanding Software Productivity: Towards a Knowledge-Based Approach. J. Softw. Eng. Knowl. Eng. 1991, 1, 293–321. [Google Scholar] [CrossRef]
- Minetaki, K.; Motohashi, K. Subcontracting Structure and Productivity in the Japanese Software Industry. Rev. Socionetw. Strateg. 2009, 3, 51–65. [Google Scholar] [CrossRef]
- Trendowicz, A.; Münch, J. Factors Influencing Software Development Productivity: State-of-the-Art and Industrial Experiences. Adv. Comput. 2009, 77, 185–241. [Google Scholar]
- Wang, Y.; Zhang, C.; Chen, G.; Shi, Y. Empirical research on the total factor productivity of Chinese software companies. In Proceedings of the International Joint Conferences on Web Intelligence and Intelligent Agent Technology (WI-IAT 2012), Macau, China, 4–7 December 2012; Volume 3, pp. 25–29. [Google Scholar]
- Zhao, L.; Wang, X.; Wu, S. The Total Factor Productivity of China’s Software Industry and its Promotion Path. IEEE Access 2021, 9, 96039–96055. [Google Scholar] [CrossRef]
- Maxwell, K.; Wassenhove, L.V.; Dutta, S. Software development productivity of European space, military and industrial applications. IEEE Trans. Softw. Eng. 1996, 22, 706–718. [Google Scholar] [CrossRef]
- Kemayel, L.; Mili, A.; Ouederni, I. Controllable factors for programmer productivity: A statistical study. J. Syst. Softw. 1991, 16, 151–163. [Google Scholar] [CrossRef]
- Budgen, D.; Brereton, P.; Drummond, S.; Williams, N. Reporting systematic reviews: Some lessons from a tertiary study. Inf. Softw. Technol. 2018, 95, 62–74. [Google Scholar] [CrossRef]
- Higgins, J.P.T.; Thomas, J.; Chandler, J.; Cumpston, M.; Li, T.; Page, M.J.; Welch, V.A. (Eds.) Cochrane Handbook of Systematic Reviews of Interventions, 6.2 version; Wiley-Blackwell: Hoboken, NJ, USA, 2021. [Google Scholar]
- McGuinness, L.A.; Higgins, J.P.T. Risk-of-bias Visualization (Robvis): An R package and Shiny web app for visualizing risk-of-bias assessments. Res. Synth. Methods 2021, 12, 55–61. [Google Scholar] [CrossRef]
- Guyatt, G.; Oxman, A.D.; Akl, E.A.; Kunz, R.; Vist, G.; Brozek, J.; Norris, S.; Falck-Ytter, Y.; Glasziou, P.; DeBeer, H.; et al. GRADE Guidelines: 1. Introduction — GRADE Evidence Profiles and Summary of Findings Tables. J. Clin. Epidemiol. 2011, 64, 383–394. [Google Scholar] [CrossRef]
- Brereton, P.; Kitchenham, B.A.; Budgen, D.; Turner, M.; Khalil, M. Lessons from Applying the Systematic Literature Review Process within the Software Engineering Domain. J. Syst. Softw. 2007, 80, 571–583. [Google Scholar] [CrossRef]
- Whiting, P.; Savović, J.; Higgins, J.P.; Caldwell, D.M.; Reeves, B.C.; Shea, B.; Davies, P.; Kleijnen, J.; Churchill, R. ROBIS: A new tool to assess risk of bias in systematic reviews was developed. J. Clin. Epidemiol. 2016, 69, 225–234. [Google Scholar] [CrossRef]


| Study Type | Description |
|---|---|
| Case Study | Adopts research questions, hypotheses, units of analysis, logic linking data to hypotheses and multiple criteria for interpreting the findings. If some of these requirements are not satisfied, it is considered an exploratory case study . It is called a case-control study if comparisons are drawn between a focus group and a control group, which has not suffered any intervention. |
| Experiment | Adopts random assignment(s) of interventions in subjects, large sample sizes, well-formulated hypotheses and the selection of (an) independent variable(s), which is (are) (randomly) sampled. If all these requirements are satisfied, it is considered a controlled experiment; otherwise, it is a quasi-experiment. |
| Simulation | Adopts models to represent specific real situations/environments or data from real situations as a basis for setting key parameters in models. If the model is used to establish the goal(s) of (an) objective function(s), it is called an optimization model. |
| Survey | Proposes questions addressed to participants through questionnaires, (structured) interviews, online surveys, focus group meetings and others. Participants may also be approached in a census process or according to random sampling. |
| Review | Incorporates results from previous studies in the analysis. If the subjects are papers, it corresponds to a literature review. If a well-defined methodology is used to collect references, critically appraise results and synthesize their findings, it is called a systematic literature review. If the purpose is to provide a broad overview of a subject area, mapping the distribution of objects across a conceptual structure, it is called a systematic mapping. If statistical analysis methods are adopted, it is regarded as a meta-analysis. |
| STUDY | Literature Review | Systematic Mapping |
|---|---|---|
| Period | 1987–2017 | 1987–2021 |
| Primary Paper Search | ||
| Recovered bibliographic references (a) | 338 | 495 |
| Excluded references after screening (b) | 170 | 242 |
| Papers that were not available (c) | 68 | 90 |
| Papers that did not meet inclusion criteria (d) | 31 | 66 |
| Number of included papers (e = a − b − c − d) | 69 | 97 |
| Backward Snowballing Search | ||
| Recovered bibliographic references (f) | 16 | 9 |
| Excluded references after screening (g) | 3 | 2 |
| Papers that were not available (h) | 8 | 5 |
| Papers that did not meet inclusion criteria (i) | 1 | 0 |
| Number of included papers (j = f − g − h − i) | 4 | 2 |
| Number of Analyzed Papers (k = e + j) | 73 | 99 |
| Acronym | Chapter | Knowledge Area |
|---|---|---|
| SWEBOK | Many | Software Engineering Body of Knowledge |
| SR | 1 | Software Requirements |
| SD | 2 | Software Design |
| SC | 3 | Software Construction |
| ST | 4 | Software Testing |
| SM | 5 | Software Maintenance |
| SCM | 6 | Software Configuration Management |
| SEM | 7 | Software Engineering Management |
| SEP | 8 | Software Engineering Processes |
| SEMM | 9 | Software Engineering Models and Methods |
| SQ | 10 | Software Quality |
| SEPP | 11 | Software Engineering Professional Practice |
| Name/Occurrence | Definition (Based on [18]) | Count | Primary Studies (in Order of Publication) |
|---|---|---|---|
| observation (—) | Empirical observation of the objects and subjects of study (since little is known about them). | 0 | — |
| analysis (2009–2015) | Adoption of established procedures to investigate what are the research objects and subjects. | 4 | [7,32,90,99] |
| description (1996–2017) | Provision of logical descriptions and classifications of studied objects and subjects based on analyses. | 8 | [3,4,6,11,12,55,67,82] |
| understanding (1988–2021) | Explanation of why and how something happens in relation to research objects and subjects (including measurement). | 49 | [5,9,10,22,23,35,39,40,41,43,45,46,47,48,49,50,51,52,53,54,56,57,58,59,60,61,64,65,69,73,74,76,77,78,81,84,87,88,94,97,98,100,101,102,103,104,105,106,108] |
| prediction (1991–2021) | Description of what will happen regarding studied objects and subjects. | 14 | [42,62,63,68,70,79,85,86,89,91,92,93,95,96] |
| action (1987–2021) | Prescription or description of interactions with research objects and subjects so as to give rise to observable effects. | 14 | [21,24,36,37,38,44,66,71,72,75,80,83,107,109] |
| TOTAL | 89 |
| Key | Auth./Pract. | # Studies | Qualified Study Type | SE KA | Main Findings (Related to Productivity) |
|---|---|---|---|---|---|
| (MaxwellF00) [49] | 2/2 | 1 | case study | SWEBOK | The factors mostly impacting software productivity are company and business sector. Companies must statistically analyze available data to develop benchmarking equations based on key productivity factors. |
| (PremrajSKF05) [50] | 4/2 | 1 | controlled experiment | SWEBOK | There is evidence of improved productivity over time, with variations coming from company and business sector. Insurance and commerce are the least productive, while manufacturing is the most productive sector among the studied projects. There is no significant difference in productivity between new developments and maintenance projects. |
| (SentasASB05) [92] | 4/0 | 1 | quasi-experiment | SWEBOK | The ability of ordinal regression models to classify any future project in one of the predefined categories is high based on the studied databases. |
| (AsmildPK06) [70] | 3/0 | 1 | controlled experiment | SWEBOK | It is possible to develop proper exponential statistical models to predict productivity, but linear models are inappropriate. DEA can incorporate the time factor in analyses and can be used to determine the best performers for benchmarking purposes. |
| (MosesFPS06) [51] | 4/0 | 1 | case study | SC | The studied company outperforms those in the ISBSG database by approximately 2.2 times. Possible explanations are that projects are lead by staff with knowledge of systems and business processes and an optimized model-based development process is adopted. The Bayesian credible intervals gives a more informative form of productivity estimation than it would be possible using the usual confidence interval alternative for the geometric mean of the ratio. |
| (WangWZ08) [52] | 3/2 | 1 | exploratory case study | SWEBOK | Project size, type and business sector are factors that influence software productivity with varying significance levels. There is no evidence that team size and adopted programming languages affect productivity. There is no significant difference in productivity between new developments and redevelopment projects. |
| (BibiSA08) [91] | 3/0 | 2 | quasi-experiment | SWEBOK | A combination of the methods of association rules and regression trees is prescribed for software productivity prediction using homogeneous datasets. Their estimates are in the form of rules that the final user can easily understand and modify. |
| (Tsuno09) [53] | 5/1 | 1 | quasi-experiment | SWEBOK | Architecture and team size have a strong correlation with productivity. Business sector, outsourcing and projects skewed towards the implementation ensure moderate productivity. |
| (GeH11) [90] | 2/0 | 1 | quasi-experiment | SWEBOK | The stochastic frontier approach takes both inefficiency and random noise into account and is a better approach for productivity analysis. It allows the understanding of SaaS company dynamics and catch-up effects by comparison to traditional companies. |
| (RodriguezSGH12) [39] | 4/0 | 1 | controlled experiment | SEM | Improvement projects have significantly better productivity than new development and larger teams are less productive than smaller ones. |
| (TsunodaA17) [55] | 2/0 | 1 | quasi-experiment | SWEBOK | The propensity score analysis can determine undiscovered productivity factors. The company business sector and the development platform are significantly related to software productivity. |
| (LavazzaMT18) [56] | 3/0 | 1 | quasi-experiment | SC | The adopted primary programming language has a significant effect on the productivity of new development projects. The productivity of enhancement projects appears much less dependent on programming languages. The business area and architecture have significant effect on productivity. No evidence of the impact of CASE tools usage on productivity was determined. The productivity of new development projects tends to be higher than that of enhancement projects. |
| (LavazzaLM20) [93] | 3/1 | 1 | quasi-experiment | SC | Software enhancement costs more than new software development, at least for projects greater than 300 Function Points. There is a lot of variability in studied data to reach this conclusion. |
| Key | Auth./Pract. | # Studies | Qualified Study Type | SE KA | Main Findings (Related to Productivity) |
|---|---|---|---|---|---|
| (Boehm87) [21] | 1/1 | 3 | many | SWEBOK | Productivity is slightly higher in the prototyping approach since it consumes fewer resources. Regarding 4GLs, great variance is observed. The increase in demand and software costs create a need to improve productivity. There are opportunities in (a) getting the best from people; (b) making process steps more efficient; (c) eliminating steps; (d) eliminating rework; (e) building simpler products; (f) reusing components. |
| (Duncan88) [61] | 1/1 | 1 | case study | SWEBOK | There has been a significant increase in productivity, which is attributed to increased code reuse due to the use of software productivity tools. |
| (KemayelMO91) [109] | 3/0 | 1 | questionnaire-based survey | SWEBOK | A manager can determine the personnel, process, and customer factors that significantly affect productivity. The most significant personnel factors are experience with virtual machines and the user community. Among process factors, the most significant are the definition of life cycle and cost estimation, the use of modern programming languages, and the power of adopted equipment. Concerning user factors, the experience with the community, computers, and with analysts and programmers are the most significant. The most significant motivational factors are technical supervision, working conditions, achievement, responsibilities and recognition. |
| (Scacchi91) [103] | 1/0 | 1 | review | SWEBOK | Analytical instruments or tools are required to model and measure productivity in ways that managers and developers can employ. This may lead us away from simple quantitative measures towards knowledge-based tools that embody symbolic and qualitative (dynamic) models. |
| (AbdelHamid96) [79] | 1/0 | 1 | simulation study | SWEBOK | Software productivity is usually eroded by motivational factors and communication overhead. These have to do with the failure to execute perfectly reasonable management practices since most software projects are conducted with poorly defined requirements, staff turnover, volatile hardware and others. |
| (Maxwe96) [108] | 3/0 | 1 | controlled experiment | SWEBOK | Organizational differences are the primary source of variance in software productivity, but development team size, application types, programming languages and development tools are also essential and controllable productivity factors. This highlights the need for companies to establish their own software metrics database and benchmark their data against other companies. |
| (FaulkLVSV09) [83] | 5/4 | 2 | interviews, questionnaire-based survey | SWEBOK | Barriers to productivity improvement in scientific computing are the specific development approaches adopted in this domain, since they present bottlenecks that current practices cannot avoid. |
| (HuangW09) [99] | 2/0 | 1 | controlled experiment | SWEBOK | Mixed SaaS firms may enjoy significant economies of scale and are more efficient than pure SaaS firms. Pure SaaS companies exhibit smaller economies of scale than conventional companies and are more productive only in utilizing capital assets. |
| (MinetakiM09) [104] | 2/0 | 1 | survey | SWEBOK | Software enterprises are classified as prime contractors, intermediate subcontractors, end-contractors, and independent enterprises. Intermediate subcontractors are the least productive. However, those possessing highly skilled workers have high productivity levels. |
| (TrendM09) [105] | 2/0 | 1 | review | SWEBOK | Successful productivity improvement depends on humans. The obtained results do not support the traditional belief that software reuse is the key to productivity improvements. Other frequent factors mentioned in the literature are tools and methods. Factors facilitating team communication and work coordination are also important in software outsourcing. Selecting the right factors is the first step towards quantitative productivity management. |
| (HernandezLopezPGC11) [32] | 4/0 | 1 | review | SWEBOK | Motivation, performance, management, compensation and rewards, organizational climate and happiness can influence productivity. The influence of reuse should be further studied. Another challenge is to develop measures that differentiate new developments from maintenance. |
| (CheikhiARI12) [11] | 3/0 | 1 | review | SWEBOK | Factors mentioned in industrial software engineering standards may affect productivity. For the ISO 9126-4 standard, productivity is a quality characteristic, whereas there are metric models in the IEEE 1045 standard to deal with productivity. Their differences do not allow building a consensual productivity model. However, the latter can be used as part of the former. |
| (LagerstromWHL12) [57] | 4/0 | 1 | controlled experiment | SWEBOK | Developed function points, adopted software platforms, and risk classification significantly impact software costs and productivity. Two factors often assumed to affect the project cost, the efficiency of the implementation and the costs of pre-study, failed to display significant impacts. |
| (Wang12) [106] | 4/1 | 1 | quasi-experiment | SWEBOK | Productivity increases come from technology adoption and progress. Education is also a factor that positively affects the productivity of software companies. |
| (HernandezLopezCSC15) [7] | 4/0 | 1 | interviews, questionnaire-based survey | SWEBOK | SE practitioners can be classified as knowledge workers. They perceive some SE factors both as inputs and as outputs. New productivity measures should consider job position definitions to guide developing the respective metrics. |
| (AzzehN17) [85] | 2/0 | 4 | randomized experiment | SWEBOK | Learning how to predict productivity from environmental factors is more efficient than using expert assumptions. Still, it is better to exclude them from calculating UCPs and make them available only for computing productivity. |
| (BeskerMB19) [87] | 3/0 | 2 | online survey, interviews | SWEBOK | Developers waste, on average, 23% of their time due to technical debt and they are frequently forced to introduce additional technical debt in those cases in which it is already present. The most common activity on which additional time is spent is performing further testing. |
| (BezerraEA20) [88] | 7/0 | 1 | online survey | SWEBOK | During the COVID-19 pandemic, 74.1% of the surveyed developers said their productivity remained good or excellent and 84.5% felt motivated and communicated easily with co-workers. The main factors influencing productivity are external interruption, environment adaptation and emotional issues. |
| (ChapettaT20) [24] | 2/0 | 2 | many | SWEBOK | The structured synthesis method allows inferring the intensity and confidence of the factors affecting software development productivity. It offers an initial theoretical framework for representing the current status of empirical knowledge in software development productivity. |
| (JohnsonZB21) [76] | 3/2 | 2 | online survey, interviews | SWEBOK | In productivity models, the overall satisfaction with the work environment and the ability to work privately with no interruptions are as important and significant factors. Private offices were linked to higher perceived productivity across all disciplines. For software engineers, another vital factor for perceived productivity was communicating with the team and leads. |
| (MurphyHillEA21) [89] | 9/9 | 4 | randomized questionnaire-based survey | SWEBOK | Factors that most strongly correlate with self-rated productivity are non-technical factors, such as job enthusiasm, peer support for new ideas, and receiving helpful feedback about job performance. Compared to other knowledge workers, software developers’ self-rated productivity is more strongly related to task variety and working remotely. |
| (ZhaoWW21) [107] | 3/0 | 1 | quasi-experiment | SWEBOK | There are regional differences in the level of development of local software companies. Different public policy promotion paths should be adopted in each case considering simultaneously all the identified gaps in the degree of higher education, the scale of enterprises and the level of investment in research and development activities and fixed assets, acting on them accordingly. |
| Key | Auth./Pract. | # Studies | Qualified Study Type | SE KA | Main Findings (Related to Productivity) |
|---|---|---|---|---|---|
| (HenshawJMB96) [66] | 4/2 | 1 | exploratory case study | SR | There is a perception of productivity improvements due to personal software processes. To increase productivity, requirement management tools should be selected considering the project size and development process. |
| (DamianC06) [9] | 2/1 | 1 | questionnaire-based survey | SR | RE productivity improvements arise from improved project communication and reduced rework. Basing designs and test cases on more accurate specifications provides consistent and informative direction for requirement engineers. |
| (PotokV97) [68] | 2/1 | 1 | simulation study | SWEBOK/OOD | The lack of incentives for early completion of intermediate project tasks and rigorous enforcement of final project deadlines may trigger delays and negatively affect software development productivity. Common business practices might lower project productivity and project completion probability. Organizations must control the productivity ranges in which their development teams operate. |
| (PotokVR99) [48] | 3/2 | 1 | controlled experiment | SWEBOK/OOD | The governing influence on OOD productivity may be the business workflow, but not the development approach. There is significant evidence that productivity increases as project size increases. Business deadlines may have a strong influence on the overall productivity of projects. |
| (PortM99) [69] | 2/1 | 1 | case study | SEMM/OO | The adoption of OOD coupled with OOP significantly improves overall project productivity and efficiency, but OO development approaches are less efficient than traditional approaches in the requirements phase. |
| (SiokT07) [72] | 2/1 | 1 | quasi-experiment | SWEBOK/OOD | Productivity is significantly different for distinct application domains. There is no significant difference in productivity between projects developed using OOA/ODD and SA/SD or programming language. Small projects are slightly more productive than medium and large projects. |
| Key | Auth./Pract. | # Studies | Qualified Study Type | SE KA | Main Findings (Related to Productivity) |
|---|---|---|---|---|---|
| (Chatman95) [65] | 1/1 | 1 | case study | SC | The change-point measure permits both combined and individual productivity measurement for design, implementation and test activities. It supports a conceptual approach to productivity measurement at a higher level than in each development activity. |
| (KitchenhamM04) [22] | 2/0 | 1 | controlled experiment | SC | A software productivity measure related to effort can be formulated when several jointly significant factors are related to effort. The practice of reuse is determined to affect productivity significantly. Executives evaluate that requirements stability, customer satisfaction and customer/staff personality type may contribute to software productivity. |
| (ParrishSHH04) [97] | 4/0 | 1 | case study | SC | Highly collaborative pairs are dramatically (4 times) less productive than pairs working on the same task but not simultaneously. Programming pairs can learn to work more productively together over time by devising their productive collaboration process. Any productivity gains reported with pair programming are likely due entirely to the role-based protocol rather than to any inherent consequences of working closely in pairs. |
| (TomaszewskiL06) [71] | 2/0 | 1 | case study | SC | The following are identified as productivity bottlenecks in software construction: unstable requirements and lack of programming tools (large); quality of platform documentation, and too optimistic planning (average). Apart from treating these bottlenecks, higher knowledge of the development language and platform and adoption of reuse practices may improve productivity. |
| (Tan09) [84] | 6/0 | 1 | case study | SC | The collected data present a clear trend of decreased software productivity over the years. Staff capabilities, software architecture, and other development tasks affect software productivity, either positively or negatively. In incremental development, the assumption that productivity will vary from increment to increment cannot be taken for granted. |
| (DiesteEtAll17) [23] | 8/0 | 10 | controlled experiment | SC | Familiarity with a unit testing framework or IDEs appears to affect software productivity positively. Years of practical or academic programming experience do not influence programmer productivity, so the routine practice does not appear to lead to improved performance. However, academic learning, which could be considered an instance of deliberate practice, influences quality and productivity. |
| (AzzehN18) [86] | 2/0 | 2 | controlled experiment | SC | Learning productivity ratios for each project look more reasonable and efficient than using a static ratio for all software organization projects. Using effort regression models based on UCP size variables is more accurate than effort estimation-based productivity models. |
| (BellerOBZ21) [74] | 4/4 | 1 | quasi-experiment | SC | A simple linear regression model could explain almost half of the variance in self-reported productivity when expressed as a product and process measure. Organizations should be aware of the large conceptual discrepancy between self-reported and measured productivity and that optimizing for individual productivity is different from optimizing for team productivity. |
| Key | Auth./Pract. | # Studies | Qualified Study Type | SE KA | Main Findings (Related to Productivity) |
|---|---|---|---|---|---|
| (Boehm99a) [80] | 1/0 | 1 | review | SC/REUSE | Elicited reuse success factors for improved productivity are: (a) adoption of a software product line (SPL) approach; (b) business case analyses; (c) focus on black-box reuse; (d) empowerment of SPL managers; (e) establishment of reuse-oriented processes; (f) adoption of an incremental approach; (g) usage of metrics-based management; (h) establishment of an SPL strategy. |
| (BankerK91) [62] | 2/0 | 1 | quasi-experiment | SC/REUSE | There is an order of magnitude productivity gain due to the adoption of reuse in software construction. |
| (Lim94) [64] | 1/1 | 2 | case study | SC/REUSE | Performing cost–benefit analyses for potential new products helps determine which should be created or reengineered to be reusable. |
| (FrakesS01) [81] | 2/0 | 1 | quaisi-experiment | SC/REUSE | More reuse results in higher quality, but the relationship between the amount of reuse and productivity is unclear. |
| Key | Auth./Pract. | # Studies | Qualified Study Type | SE KA | Main Findings (Related to Productivity) |
|---|---|---|---|---|---|
| (AdamsCB09) [36] | 3/1 | 1 | case study | SEM/OSS | Contributor commits change over time in OSS projects. Depending on the project nature, there is an irregular ramp-up period, after which developers start increasing their productivity. |
| (KreinMKDE10) [94] | 5/1 | 1 | randomized experiment | SWEBOK/OSS | Programming language fragmentation is negatively related to the total amount of code contributed by developers. For a developer who programs in multiple languages, it appears that he or she is most productive when language fragmentation is minimal. |
| (TanihanaN13) [100] | 2/0 | 1 | case study | SWEBOK/OSS | The economic effect of the OSS segment for the labor productivity of the Japanese information service sector is positive. However, each OSS produces a variety of economic effects. |
| (MoazeniLCB14) [41] | 4/0 | 1 | case study | SEM/OSS | Incremental development productivity decline varies significantly according to product categories and domains. |
| (ScholtesMS16) [43] | 3/0 | 1 | controlled experiment | SEM/OSS | The productivity of OSS development decreases as the team grows in size. Due to the overhead of required coordination, open-source projects are examples of diseconomies of scale. |
| (LiaoEA21) [95] | 6/0 | 9 | many | SWEBOK/OSS | The flow of participants and the popularity of an open-source ecosystem impact its capacity to produce information. Positive communication by participants can hurt the ability of an ecosystem to solve practical problems. No matter what stage the ecosystem is in, its age will impact productivity. The number of publishers participating in ecosystems and of followers harm ecosystems’ net productivity. |
| Key | Auth./Pract. | # Studies | Qualified Study Type | SE KA | Main Findings (Related to Productivity) |
|---|---|---|---|---|---|
| (SovaS96) [67] | 2/1 | 2 | case study | ST | There was a consistent agreement between expert opinion ratings and the developed testing productivity measure. Both determined that difficult projects have lower productivity with the adoption of a testing methodology. |
| (JaloteK21) [75] | 2/1 | 3 | many | ST | There are clearly identifiable differences between the task processes of high-productivity programmers and the task processes of average-productivity programmers. Task processes of high-productivity programmers were transferred to average-productivity programmers by training them on the key steps missing in their processes but commonly present in the work of their high-productivity peers. A substantial productivity gain was found among average-productivity programmers due to this transfer. |
| (BankerDK91) [96] | 3/0 | 1 | controlled experiment | SM | High project quality does not necessarily reduce maintenance productivity. A significant positive impact is observed on maintenance productivity by project team capabilities and good response time. A negative significant impact is identified due to the lack of previous experience in the application domain. |
| (BankerS94) [63] | 2/0 | 1 | quasi-experiment | SM | Project size has an important influence on maintenance productivity. There are significant economies of scale in the studied maintenance projects. There may be significant gains in maintenance productivity by grouping simple modification projects into larger planned releases. |
| (Mockus09) [59] | 1/1 | 2 | controlled experiment | SM | Larger projects, overload mentors and offshoring succession significantly reduce the productivity ratio. The breadth of mentor experience and succession of mentors’ primary product significantly increase productivity. |
| (BibiAS16) [98] | 3/0 | 1 | case study | SM | Small methods produce nearly maximal productivity in the majority of cases. Tightly coupled systems exhibit low productivity rates, a negative effect of coupling on maintainability. |
| Key | Auth./Pract. | # Studies | Qualified Study Type | SE KA | Main Findings (Related to Productivity) |
|---|---|---|---|---|---|
| (MacCormackKCC03) [35] | 4/1 | 1 | online survey | SEM | Larger projects are more productive and have lower defect levels than smaller ones. Early prototyping and daily builds promise subsequent work on the features most valued by customers, with a significant positive impact on productivity. Other practices are not correlated to productivity. There is danger in assuming the implementation of more flexible processes piecemeal by picking-and-choosing practices because there are complex interactions among them. |
| (RamasubbuCBH11) [38] | 4/0 | 1 | controlled experiment | SEM | Firms that distribute software development across long distances benefit from improved productivity. Variations in configurational characteristics of distributed teams lead to different performances. Locally tailored, agile, and interaction-oriented process models are associated with improved productivity. Project configurations that attain high productivity tend to achieve low quality and vice versa. An imbalance in the experiences of personnel significantly decreases productivity. |
| (Mohapatra11) [37] | 1/0 | 1 | quasi-experiment | SEM | Application complexity affects productivity negatively, and training in the application domain has an opposite effect. Productivity tends to increase with the availability of documentation and testing tools and better client support. |
| (CataldoH13) [40] | 2/1 | 2 | case study | SEM | Identifying the right set of relevant work dependencies and coordinating accordingly has a significant impact on increasing productivity. When developers’ coordination patterns are congruent with their coordination needs, productivity increases. |
| (PalaciosCSGT14) [42] | 5/0 | 1 | questionnaire-based survey | SEM | Performance in global development projects is lower than in-house projects due to the lack of attention to tasks by software managers. This is due to communication, coordination and control overheads. The management of offshore projects affects their performance in negative ways. Significantly improved performance is perceived in case managers present accessibility, responsivity and neglect their superior roles. |
| (StylianouA16) [44] | 2/0 | 2 | optimization study | SEM | The Pareto optimal set, which is generated from models, supports managers better deciding on who will work on what and when. |
| (MeyerBMZF17) [5] | 5/1 | 1 | online survey | SEM | Productivity is a highly personal matter, and perceptions of what is considered to be productive are different across participants. Productivity and the factors that influence it are highly individual. The daily work of each developer is highly fragmented. |
| (MeyerZF17) [10] | 3/1 | 1 | online survey | SEM | Personalized recommendations for improving software developers’ work are essential to optimize personal and organizational workflows. Software developers can be classified as social, lone, focused, balanced, leading or goal-oriented developers. |
| (RastogiT0NC17) [45] | 5/4 | 1 | quasi-experiment | SEM | New hires tend to take several weeks to reach the same productivity levels as experienced employees. The effect of team support decreases with time. Employees with prior internships tend to perform better than others in the beginning. |
| (OliveiraEA20) [46] | 6/0 | 1 | many | SEM | Code-based metrics outperformed commit-based metrics, reflecting team leaders’ perceptions of developer productivity. Data triangulation can strengthen organizational confidence in productivity metrics. |
| (StoreyEA21) [47] | 6/4 | 1 | randomized online survey | SEM | The perception of existence of an engineering system, impactful work, autonomy, and capability to complete tasks positively affect self-assessed productivity. In contrast, the possibility of mobility, compensation and job characteristics affect it negatively. The relationships of these factors to job satisfaction is statistically significant in many models for different work contexts. |
| Key | Auth./Pract. | # Studies | Qualified Study Type | SE KA | Main Findings (Related to Productivity) |
|---|---|---|---|---|---|
| (CarvalhoRSCB11) [58] | 5/0 | 1 | exploratory case-control study | SC/RAD | There is a significant and positive productivity difference in Scrum-RUP projects when contrasted to traditional development. The proposed hybrid process incorporates the advantages and benefits of the dynamics of agile principles but recognizes the importance of conducting rigorous requirements management and architecture in the traditional way. |
| (MeloCKC13) [12] | 4/0 | 1 | case study | SC/RAD | Agile team management is the most influential factor in achieving higher team productivity. Team size, diversity, skill, collocation and time allocation are critical factors for designing agile teams. Teams should be aware of the negative impact of member turnover. |
| (KautzJU14) [73] | 3/2 | 1 | case study | SC/RAD | There is a decrease in the mistakes and interruptions in software projects due to the adoption of Scrum. Short interaction cycles prevent endless developments. Scrum has a significant positive impact on software productivity, not at the expense of software quality. However, customers do not perceive these improvements. |
| (FatemaS17) [6] | 2/0 | 1 | interviews, questionnaire-based survey | SEM/RAD | Factors that significantly affect agile team productivity are external factors and dependencies, team management and effectiveness, motivation, skillfulness and culture. |
| (KuutilaMCEA21) [102] | 5/0 | 2 | online survey, interviews | SC/RAD | Using software repository variables to predict developers’ well-being or productivity is challenging due to individual differences. Prediction models developed for each developer individually work better. |
| (GraziotinWA15) [4] | 3/0 | 1 | questionnaire-based survey | SEPP | Affects (emotions, moods and feelings) impact the cognitive activity of individuals. Valence (the attractiveness of an event) and dominance (change in the sensation of control of a situation) are positively related to self-assessed productivity. Arousal (the intensity of emotional activation) does not provide additional explanatory power to the developed model. |
| (MantylaADGO16) [60] | 5/0 | 1 | quasi-experiment | SEPP | Issue reports of different types produce a fair valence variation (the attractiveness of an event). Increases in issue priority typically increase arousal (the intensity of emotional activation). The resolution of an issue increases valence. As the resolution time of an issue increases, so does the individual arousal assigned to the issue. |
| (YilmazOC16) [3] | 3/0 | 1 | interviews, questionnaire-based survey | SEPP | Software productivity has a multi-factor structure. Productivity is highly associated with social productivity (an intangible asset related to social life, information awareness, fairness, frequent meeting, reputation, social debt, team communication and cohesion) and moderately associated with social capital (intangible resources related to group characteristics, norms, togetherness, sociability, neighborhoods, volunteerism and trust). The productivity of software development was found to be higher for smaller software teams. |
| Key | Auth./Pract. | # Studies | Qualified Study Type | SE KA | Main Findings (Related to Productivity) |
|---|---|---|---|---|---|
| (LowJ91) [77] | 2/0 | 1 | quasi-experiment | SEP | Overall, there is no statistical evidence for a productivity improvement or decline resulting from CASE tools. Close evaluation of individual projects reveals support for traditional learning-curve patterns and the importance of staff training in new technology. |
| (Rubin93a) [78] | 1/0 | 1 | quaisi-experiment | SEP | Among studied companies, only 20% had information on their portfolio size, only 3.3% on portfolio changes and only 2% had information about quantifiable aspects of software quality. Process improvement and organizational aspects are important factors for software productivity. |
| (GreenHC05) [82] | 3/0 | 1 | questionnaire-based survey | SEP | There is increased perception of productivity improvements due to personal software processes. |
| (Duarte17a) [54] | 1/1 | 1 | quaisi-experiment | SQ | There is no evidence of improved labor productivity or productivity growth in companies with appraised software quality levels. Companies with appraised quality maturity levels are more or less productive depending on their business nature, capital’s main origin, and maintained quality level. There is statistically significant evidence that software productivity variance decreases as a company with appraised quality levels moves towards higher levels. |
| (StaplesEA14) [101] | 6/0 | 1 | quasi-experiment | SEMM | Lines of proof is a problematic measure, and so improved size measures are required. Effort is highly correlated with proof size. Since there are proofs that are much simpler and less complex than other proofs, it would be expected that effort and productivity depend on proof complexity. Still, empirical data do not provide support for this belief. |
| Key | Auth./Pract. | Study Type | SE KA/Topics | Ultimate Goal | Initial Year | Final Year | Queried Sources | Reference Processing/Paper Selection | Main Findings (Related to Productivity) |
|---|---|---|---|---|---|---|---|---|---|
| (MohagheghiC07) [18] | 2/0 | systematic literature review | SC/- | action | 1994 | 2005 | ACM Digital Library, IEEE Explore. | After duplicate removal, 17 references were obtained and 13 selected. After reading, 11 papers were included and analyzed. | There is significant evidence of apparent productivity gains in small and medium-scale studies. Results for actual productivity are rather inconsistent. The definition of productivity measures is problematic and great variance is observed. |
| (WagnerR08) [2] | 2/1 | systematic literature review | SWEBOK/- | action | 1970 | 2007 | ACM Digital Library, Google Scholar, IEEE Xplore, Science Direct. | 962 references were obtained, 586 were filtered and 53 selected. After reading, 38 papers were included and analyzed. | Communication efforts are positive for software productivity, which is also sensible to business domains. |
| (CardozoNBFS10) [26] | 5/0 | systematic literature review | SC/RAD | understanding | 2000 | 2009 | ACM Digital Library, Compendex, IEEE Xplore, Science Direct, Scopus. | 274 references were obtained, 28 papers included and analyzed. | The relationship between the adoption of Scrum and the productivity of software projects is likely positive. |
| (Peter11) [29] | 1/0 | systematic literature review and systematic mapping | SWEBOK/- | prediction | 1985 | 2009 | ACM Digital Library, Compendex, IEEE Explore, Inspec, ISI Web of Science. | 53 references were obtained, 26 papers included and analyzed. | Simple ratio measures are misleading and should be evaluated with care. SDE analysis is more robust for comparing projects. Managers should be aware of validity threats regarding productivity research and address them. |
| (HernandezLopezPG13) [8] | 3/0 | systematic literature review | SEPP/- | understanding | 1993 | 2003 | ACM Digital Library, IEEE Xplore, ISI Web of Science, Science Direct, Taylor, Francis and Wiley Online. | 187 references were obtained, 177 considered unique and 51 selected. After reading, 3 articles were included. The list was completed by snowballing and 3 additional texts were included, resulting in 6 analyzed papers. | Productivity measures at job levels (requiring advanced technical knowledge and skills) focus either on units of a product (SLOC/Time) or planned project units (Tasks Completed/Time). There is no clear differentiation of productivity according to specific job descriptions. |
| (RafiqueM13) [17] | 2/0 | meta-analysis | SWEBOK/TDD | action | 2002 | 2011 | ACM Digital Library, IEEE Xplore, ISI Web of Science, Science Direct, Springer Link, Scopus. | 274 references were obtained and 28 papers included and analyzed. | Test-Driven Development (TDD) has little effect on productivity. Subgroup analyses show that the productivity drop is much larger in industries which adopt TDD, due to the additional overhead. |
| (ShahPN15) [30] | 3/0 | systematic literature review | SC/RAD | understanding | 2000 | 2014 | ACM Digital Library, IEEE Xplore, Science Direct, Springer Link. | 150 references were obtained, 12 papers were included and analyzed. | Productivity measures are not capable of satisfying the requirements agile development processes. They must also consider the knowledge dimension. |
| (BissiNE16) [25] | 3/0 | systematic literature review | SC/TDD | action | 1999 | 2014 | ACM Digital Library, CiteSeerx, IEEE Xplore, Science Direct, Wiley Online Library. | 1107 references were obtained, 964 considered unique and 64 selected. After reading, 24 articles were included. This list was completed by snowballing and 3 additional texts included, resulting in 27 analyzed papers. | There is a decrease in productivity when Test-Driven Development (TDD) is adopted in industry, when compared to Test Last Development. |
| (OliveiraVCC17) [27] | 4/0 | systematic literature review | SWEBOK/- | understanding | 1982 | 2015 | Scopus, the Web of Science. | 695 references were obtained, 625 considered unique and 224 selected. After reading, 71 papers were included and analyzed. | Productivity measures are usually defined using time or effort as the inputs and LOC as the output. Single ratio measures are easier to obtain, but riskier to adopt. |
| (OliveiraCCV18) [28] | 4/0 | tertiary systematic literature review | SWEBOK/- | action | – | – | ACM Digital Library, Engineering Village, IEEE Xplore Digital Library, Scopus and Web of Science. | After duplicate removal, 240 references were selected. After random sampling, 4 publications were included and analyzed. | No single classification exists for software productivity factors, but they are organized in product, process, project and people categories. The reviewed literature studies 35 influential factors over which organizations must intervene to obtain software productivity improvements. |
| Finding | Overall RoB † | Limitations | Inconsistency | Indirectness | Imprecision | # Studies | Papers | Quality | Comments |
|---|---|---|---|---|---|---|---|---|---|
| development project productivity ∼ maintenance project productivity | Low | — | [39]: ; [50]: ; [56]: >; | — | — | 3 | [39], [50], [56] | LOW | Downgraded due to inconsistency |
| project size development project productivity | Low | — | — | — | — | 6 | [57], [86], [108] | HIGH | [59,63]: Similar findings concerning maintenance project productivity with directionality of effect in the opposite direction |
| team size software project productivity | Low | — | — | — | — | 4 | [39], [43], [53], [108] | MODERATE | — |
| professional experience software project productivity | Unclear | [59]: RoBs come from CoIs ‡ | — | — | — | 4 | [38], [59], [109] | MODERATE | [38]: Reports on experience heterogeneity |
| technical and managerial capabilities software project productivity | Unclear | [23]: RoBs come from risks of research bias | — | — | small samples, missing data, measurement issues | 15 | [6], [23], [37] , [96] , [102] | LOW | Downgraded due to imprecision; [6]: Reports not significant findings |
| adoption of development tools development project productivity | Unclear | [23]: RoBs come from risks of research bias | — | — | small samples, missing data, measurement issues | 15 | [23], [37], [47] , [56], [77], [108] | LOW | Downgraded due to imprecision |
| adopted programming language software project productivity | Low | — | — | — | — | 3 | [56], [108], [109] | MODERATE | [55,57]: Similar findings concerning development platforms |
| artifact complexity development project productivity | Low | — | — | — | — | 4 | [37], [86], [101] | MODERATE | [101]: Neither conclusive nor significant findings |
| software reuse development project productivity | Low | — | — | — | — | 3 | [22] , [80], [81] | MODERATE | [18]: Additional inconclusive evidence |
| RAD development project productivity | Low | — | — | — | Direct versus indirect study findings | 4 | [21], [38] | LOW | Downgraded due to imprecision; [26,30]: Additional inconclusive evidence |
| TDD productivity < TLD productivity | Unclear | [23]: RoBs come from risks of research bias | — | — | small samples, missing data, measurement issues | 10 | [17], [23], [25] | MODERATE | Downgraded due to imprecision; Upgraded due to the certainty supported by SLRs |
Publisher’s Note: MDPI stays neutral with regard to jurisdictional claims in published maps and institutional affiliations. |
© 2022 by the author. Licensee MDPI, Basel, Switzerland. This article is an open access article distributed under the terms and conditions of the Creative Commons Attribution (CC BY) license (https://creativecommons.org/licenses/by/4.0/).
Share and Cite
Duarte, C.H.C. Software Productivity in Practice: A Systematic Mapping Study. Software 2022, 1, 164-214. https://doi.org/10.3390/software1020008
Duarte CHC. Software Productivity in Practice: A Systematic Mapping Study. Software. 2022; 1(2):164-214. https://doi.org/10.3390/software1020008
Chicago/Turabian StyleDuarte, Carlos Henrique C. 2022. "Software Productivity in Practice: A Systematic Mapping Study" Software 1, no. 2: 164-214. https://doi.org/10.3390/software1020008
APA StyleDuarte, C. H. C. (2022). Software Productivity in Practice: A Systematic Mapping Study. Software, 1(2), 164-214. https://doi.org/10.3390/software1020008