Article

The Effect of Interrupted Loading on the Lüder Phenomena in AISI 1524 Steel Alloy

by
Mohamed Almatroushi
1,2,
Salman Pervaiz
1,* and
Wael A. Samad
1,*
1
Department of Mechanical and Industrial Engineering, Rochester Institute of Technology, Dubai Campus, Dubai P.O. Box 341055, United Arab Emirates
2
Mohammed Bin Rashid Space Centre (MBRSC), Dubai 211833, United Arab Emirates
*
Authors to whom correspondence should be addressed.
Alloys 2025, 4(3), 19; https://doi.org/10.3390/alloys4030019
Submission received: 30 July 2025 / Revised: 9 September 2025 / Accepted: 15 September 2025 / Published: 17 September 2025

Abstract

Under specific temperature and strain rate conditions, certain materials, such as low-carbon steels and select magnesium and aluminum alloys, experience a localized deformation phenomenon known as the Lüders effect. This behavior manifests as a well-defined yield point, after which the stress–strain response transitions into a plateau phase. Experimentally observed through full-field tests, the Lüders effect appears in the form of a band(s). This manuscript presents, for the first time, a systematic study of interrupted loading on the Lüders phenomenon in AISI 1524 hot-rolled steel, using uniaxial tensile testing combined with digital image correlation (DIC). While similar approaches have been applied to other alloys, no prior work has reported on AISI 1524 steel under unloading–reloading cycles during the Lüders plateau. Interruptions in loading involved unloading at 25%, 50%, and 75% of the total plateau region independently until stress approached zero, followed by reloading at the same rate until failure. Each unloading case was subjected to two tests, alongside two additional control tests where loading proceeded without interruption. Based on the findings of this study, it can be inferred that the Lüders phenomenon in AISI 1524 steel exhibits a decrease in strain intensity upon unloading, along with an extension of the Lüders plateau when interrupted loading occurs up to halfway through the plateau region. However, implementing an interrupted loading regime at three-quarters of the plateau had minimal to no discernible effect on the phenomenon. The majority of samples displayed two Lüders bands, a few exhibited either a single band or three bands, suggesting a complex relationship with material heterogeneity and specific impurities present in each sample. The novelty of this work lies in showing how controlled unloading–reloading cycles alter both the propagation and characteristics of Lüders bands in AISI 1524 steel.

1. Introduction

The Lüder band phenomenon occurs at the yield point of certain materials, particularly low-carbon steels, where localized plastic deformation propagates in bands. This behavior arises during the transition from elastic to plastic zone in the stress–strain curve, specifically within the yield point elongation region, which spans from the first zero-slope point to the transition into uniform strain hardening [1]. Lüder bands typically initiate near the specimen grips and propagate longitudinally [2]. Advances in full-field displacement techniques have facilitated their study using methods such as surface coating [3], strain gauges [4], infrared thermography [5], and, more recently, digital image correlation (DIC), which has become the preferred approach due to its full-field deformation mapping. Additionally, Lüder band behavior has been analyzed using acoustic emission techniques in high-strain-rate scenarios [6] and through finite element simulations integrated with DIC results [7].
At the microscopic level, Lüder band formation is primarily driven by dislocation movement [8] and is influenced by multiple factors, including material composition, grain size, temperature, strain rate, stress level, loading conditions, microstructure, heat treatment, alloying elements, specimen geometry, and surface conditions [8]. This phenomenon has been observed in low-carbon steels, aluminum alloys such as Al5456, and niobium micro-alloyed steels. In [9], tensile tests on three steel types—carbon–nickel–molybdenum pressure vessel steel, high-sulfur low-carbon steel, and ultra-low-carbon steel—showed Lüder band formation across all samples. The study found that Lüder strain increases with tempered martensitic microstructures (smaller grain sizes) and decreases with pearlite (higher carbon content). A correlation was also observed between increased Lüder strain magnitude, higher dislocation density, and a reduced dislocation mean free path.
Specimen thickness also influences Lüder strain, as shown in studies on AISI 1524 steel [10] and Al5456 aluminum alloy [11], where thinner specimens exhibited higher Lüder strain. Both studies also noted that Lüder band propagation velocity increases with specimen thickness, suggesting cross-material consistency in Lüder behavior. Strain rate effects on Lüder band propagation were examined in [12] through uniaxial tension tests on annealed mild steel. The study developed theoretical equations incorporating strain rate, crosshead speed, initial gauge length, Lüder band count, and material properties. Results demonstrated a strong positive correlation between strain rate, Lüder strain, and band velocity, with a linear relationship on a logarithmic scale. Similar findings were reported in [13,14].
In [15], Lüder band evolution under different loading conditions—pure tension, interrupted tension, and compression tension—was investigated using DIC and finite element simulations with a custom plasticity model. Findings revealed that when loading transitions from compression to tension, Lüder bands form under compression but appear elastic in tension until reaching the prior stress level. Interrupted loading resulted in a structural response governed by distinct stress–strain histories at different specimen points.
Although many studies have examined factors like strain rate, grain size, and specimen geometry, the effect of unloading–reloading cycles during the Lüders plateau in medium-carbon steels such as AISI 1524 remains largely unexplored. This gap is important because in processes like stamping, deep drawing, and sheet metal forming, as well as in structural components under cyclic service loads, materials often experience partial unloading and reloading. Interrupted loading offers a controlled way to simulate these conditions and study how deformation history affects Lüders band nucleation, strain intensity, and plateau length. Using tensile tests with DIC, this study provides new insights into Lüders behavior in AISI 1524 steel, with direct relevance to both fundamental understanding and industrial applications.

2. Materials and Methods

2.1. Specimen Material

The chemical composition of the AISI 1524 steel under study was analyzed three times using optical emission spectroscopy (OES) in compliance with ASTM E415 [16]. The OES results, summarized in Table 1, confirm the AISI 1524 classification, with key elemental concentrations including 0.24 wt.% carbon (C), 0.83 wt.% manganese (Mn), 0.031 wt.% phosphorus (P), and 0.016 wt.% sulfur (S).
The microstructural characteristics of the material were further examined using an optical microscope (Chennai Metco Metscope I), as depicted in Figure 1. Grain size analysis was performed utilizing Chennai Metco Envision software, (version 4.0) following the ASTM E112 [17] standard for planimetric grain size measurement. The average grain size of the investigated AISI 1524 steel was determined to be 11 μm. Although grain size was not a focal variable in this study, previous research [18] suggests that the microstructural properties of the steel alloy could impact Lüders band formation.

2.2. Specimen Geometry

The geometry of the test specimen is per ASTM E8/E8M standard for rectangular tension test specimens. For optimum image capturing using the digital image correlation equipment used in this project, the sheet-type 12.5 mm wide standard test specimens were machined from the mild steel sheet. The thickness of the test specimen is 1 mm, which complies with the maximum thickness for this type of specimen of 19 mm as in ASTM E8/E8M [1]. This thickness was picked for this study as it was readily available in the market as well, and it displayed a relatively wide Lüder band in previous Lüder band studies [6], which helped reduce the error of actual versus targeted unloading point throughout the Lüder band. There was some variation in the cross-sectional thickness between specimens, but this is attributed to the raw material sheet that was procured. The difference between the maximum and minimum thickness was 0.14 mm, and the average was 1.18 mm.

2.3. Specimen Preparation

Specimen preparation involved degreasing and cleaning all sample surfaces. To maintain uniform thickness, no deburring or chamfering was performed on sharp edges. Each specimen was assigned an identification number (1–10), and the gauge cross-sectional width and thickness were measured using a digital vernier caliper. One side of each specimen was then spray-painted white with an even coat to prevent chipping or cracking during tensile testing, which could compromise DIC accuracy.
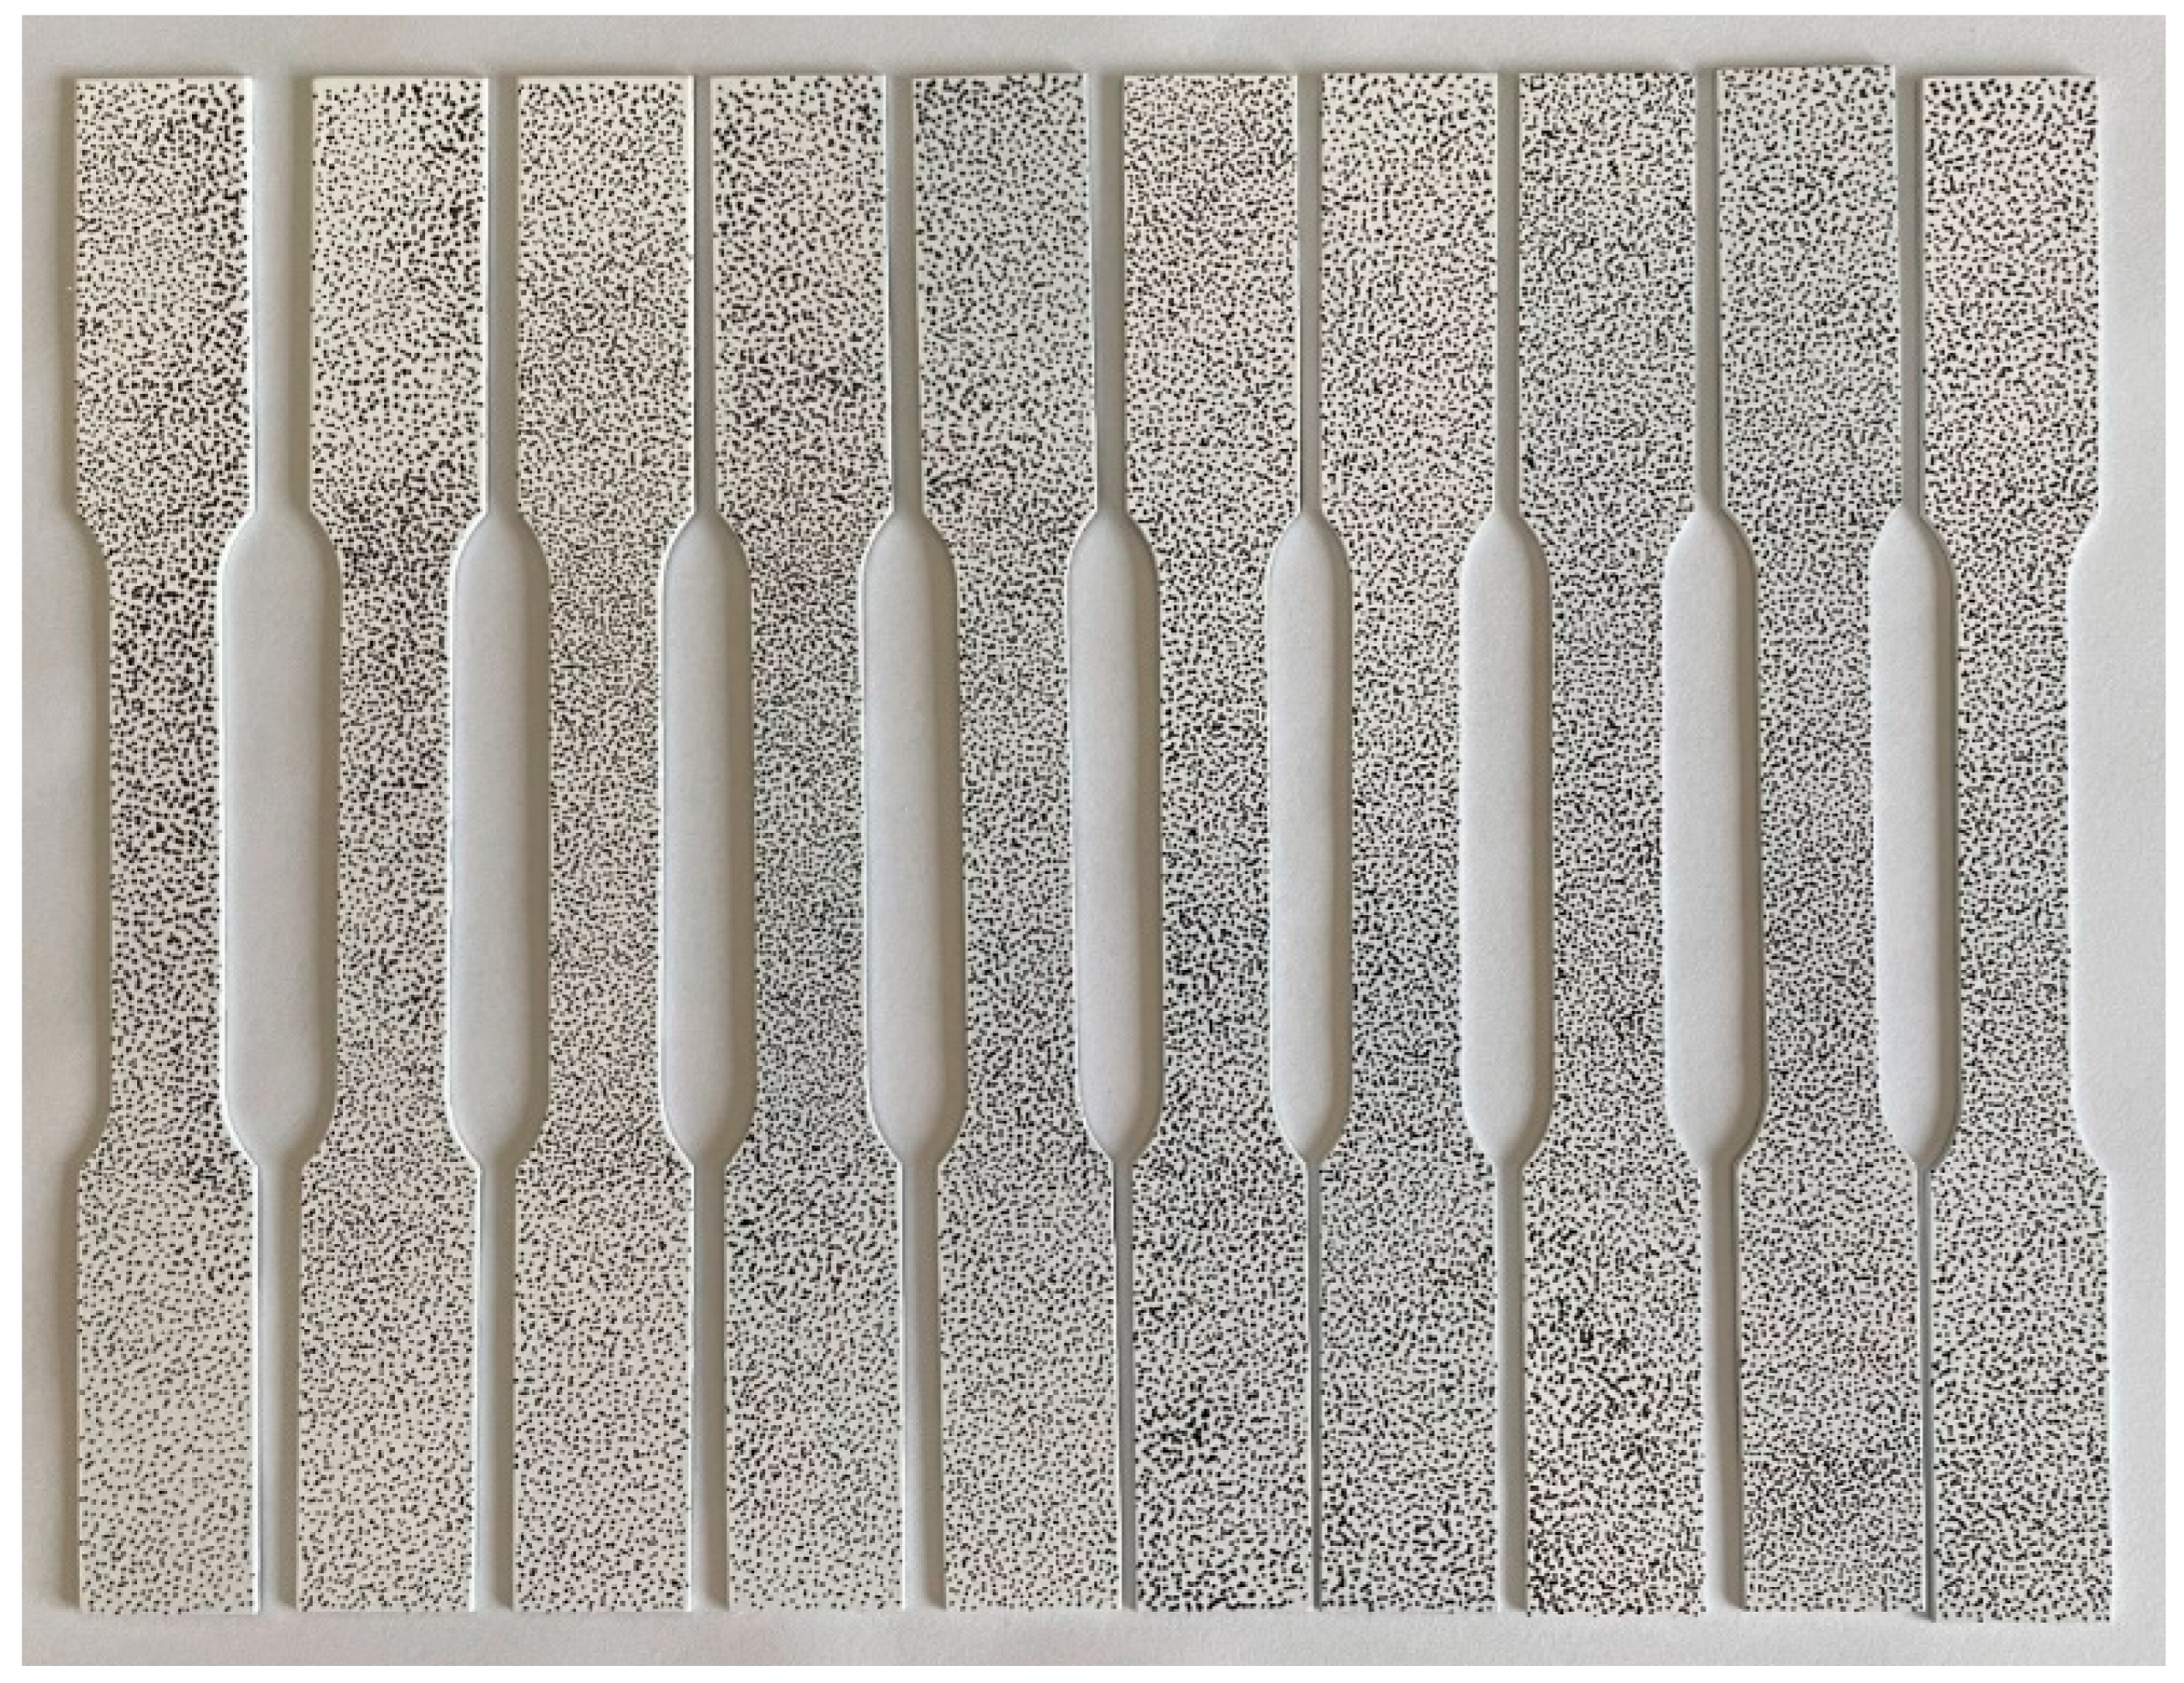
A random speckle pattern was applied to the painted surface using an extra-fine-tip black marker, ensuring high dot density and uniform distribution (Figure 2). As per Correlated Solutions Testing Guide recommendations [19], the speckle pattern was isotropic, randomly distributed, and maintained consistent speckle size, coverage, and contrast. These characteristics minimize measurement noise and enhance DIC accuracy. An example of the speckled specimens is shown in Figure 2.

2.4. Test Equipment

All tensile tests were conducted using a Laryee UE34100 servo-motor-controlled Universal Testing Machine with a 100 kN load capacity and 0.1 μm displacement resolution. Specimens were secured using flat wedge grips. The UTM recorded data at 10 Hz. DIC was performed using the Correlated Solutions VIC system, which includes stereo cameras with an integrated LED light source. Key DIC system specifications are provided in Table 2.
During the uniaxial tensile tests, all ten specimens were analyzed using 3D DIC. Images were captured at a frequency of 0.5 Hz with Vic-Snap and subsequently processed in Vic-3D 9, both developed by Correlated Solutions. To ensure consistency, testing was conducted sequentially with a fixed DIC camera arrangement, maintaining stable tripod positioning, shutter speed, aperture settings, and controlled lighting conditions. A single calibration procedure was performed to enhance accuracy and minimize experimental variability.
Tensile tests were displacement-controlled, with a constant displacement rate of 0.5 mm/min during both loading, unloading, and reloading scenarios. While the deformation rate influences Lüders phenomena, as noted in prior studies [20], it remained fixed in this study. Crosshead displacement and tensile loads were recorded at 10 Hz. Experimental conditions and parameters are summarized in Table 3.

2.5. Test Program

The experimental plan proceeded in stages. First, two specimens were tested until failure without any interruptions to the loading, allowing the calculation of the average Lüder band strain width. This value was then used to determine the exact point at which unloading would begin in the subsequent tests. Next, two specimens were tested with unloading introduced at 25% of Lüder’s strain ( ε L ), after which loading was resumed until failure. Similarly, two additional specimens were tested with unloading at 50% of ε L , and then reloaded to failure. Finally, two specimens were tested with unloading at 75% of ε L , followed once more by reloading until failure.
Test T1 served as a preliminary trial to assess the UTM, data acquisition, and DIC system functionality. Given the use of wedge grips, sandpapering the specimen surfaces improved grip stability. The crosshead speed was reduced from 1 to 0.5 mm/min to minimize slipping and increase the number of DIC images captured during the Lüders plateau phase.
The Lüders strain, ε L , was determined from tests T2 and T3 as 3.340% and 3.298%, respectively, averaging 3.32%. This value guided interrupted loading tests (T4–T9) to define unloading/reloading points: T4 and T5 at 25% of ε L (0.83% strain), T6 and T7 at 50% (1.66% strain), and T8 and T9 at 75% (2.49% strain). The UTM software, MaxTest, was updated accordingly to implement these loading sequences. It is important to note that throughout the testing program, all loading, unloading, and reloading procedures were consistently executed at a uniform displacement rate of 0.5 mm/min. Moreover, to minimize potential biases stemming from varying DIC test environments and conditions, all tests were conducted on the same day, with the DIC system maintained in a fixed position and settings unchanged throughout. The sequential order of testing was T1—T2—T3—T4—T6—T8—T5—T7—T9, ensuring a systematic approach.

3. Data Collection and Post-Processing

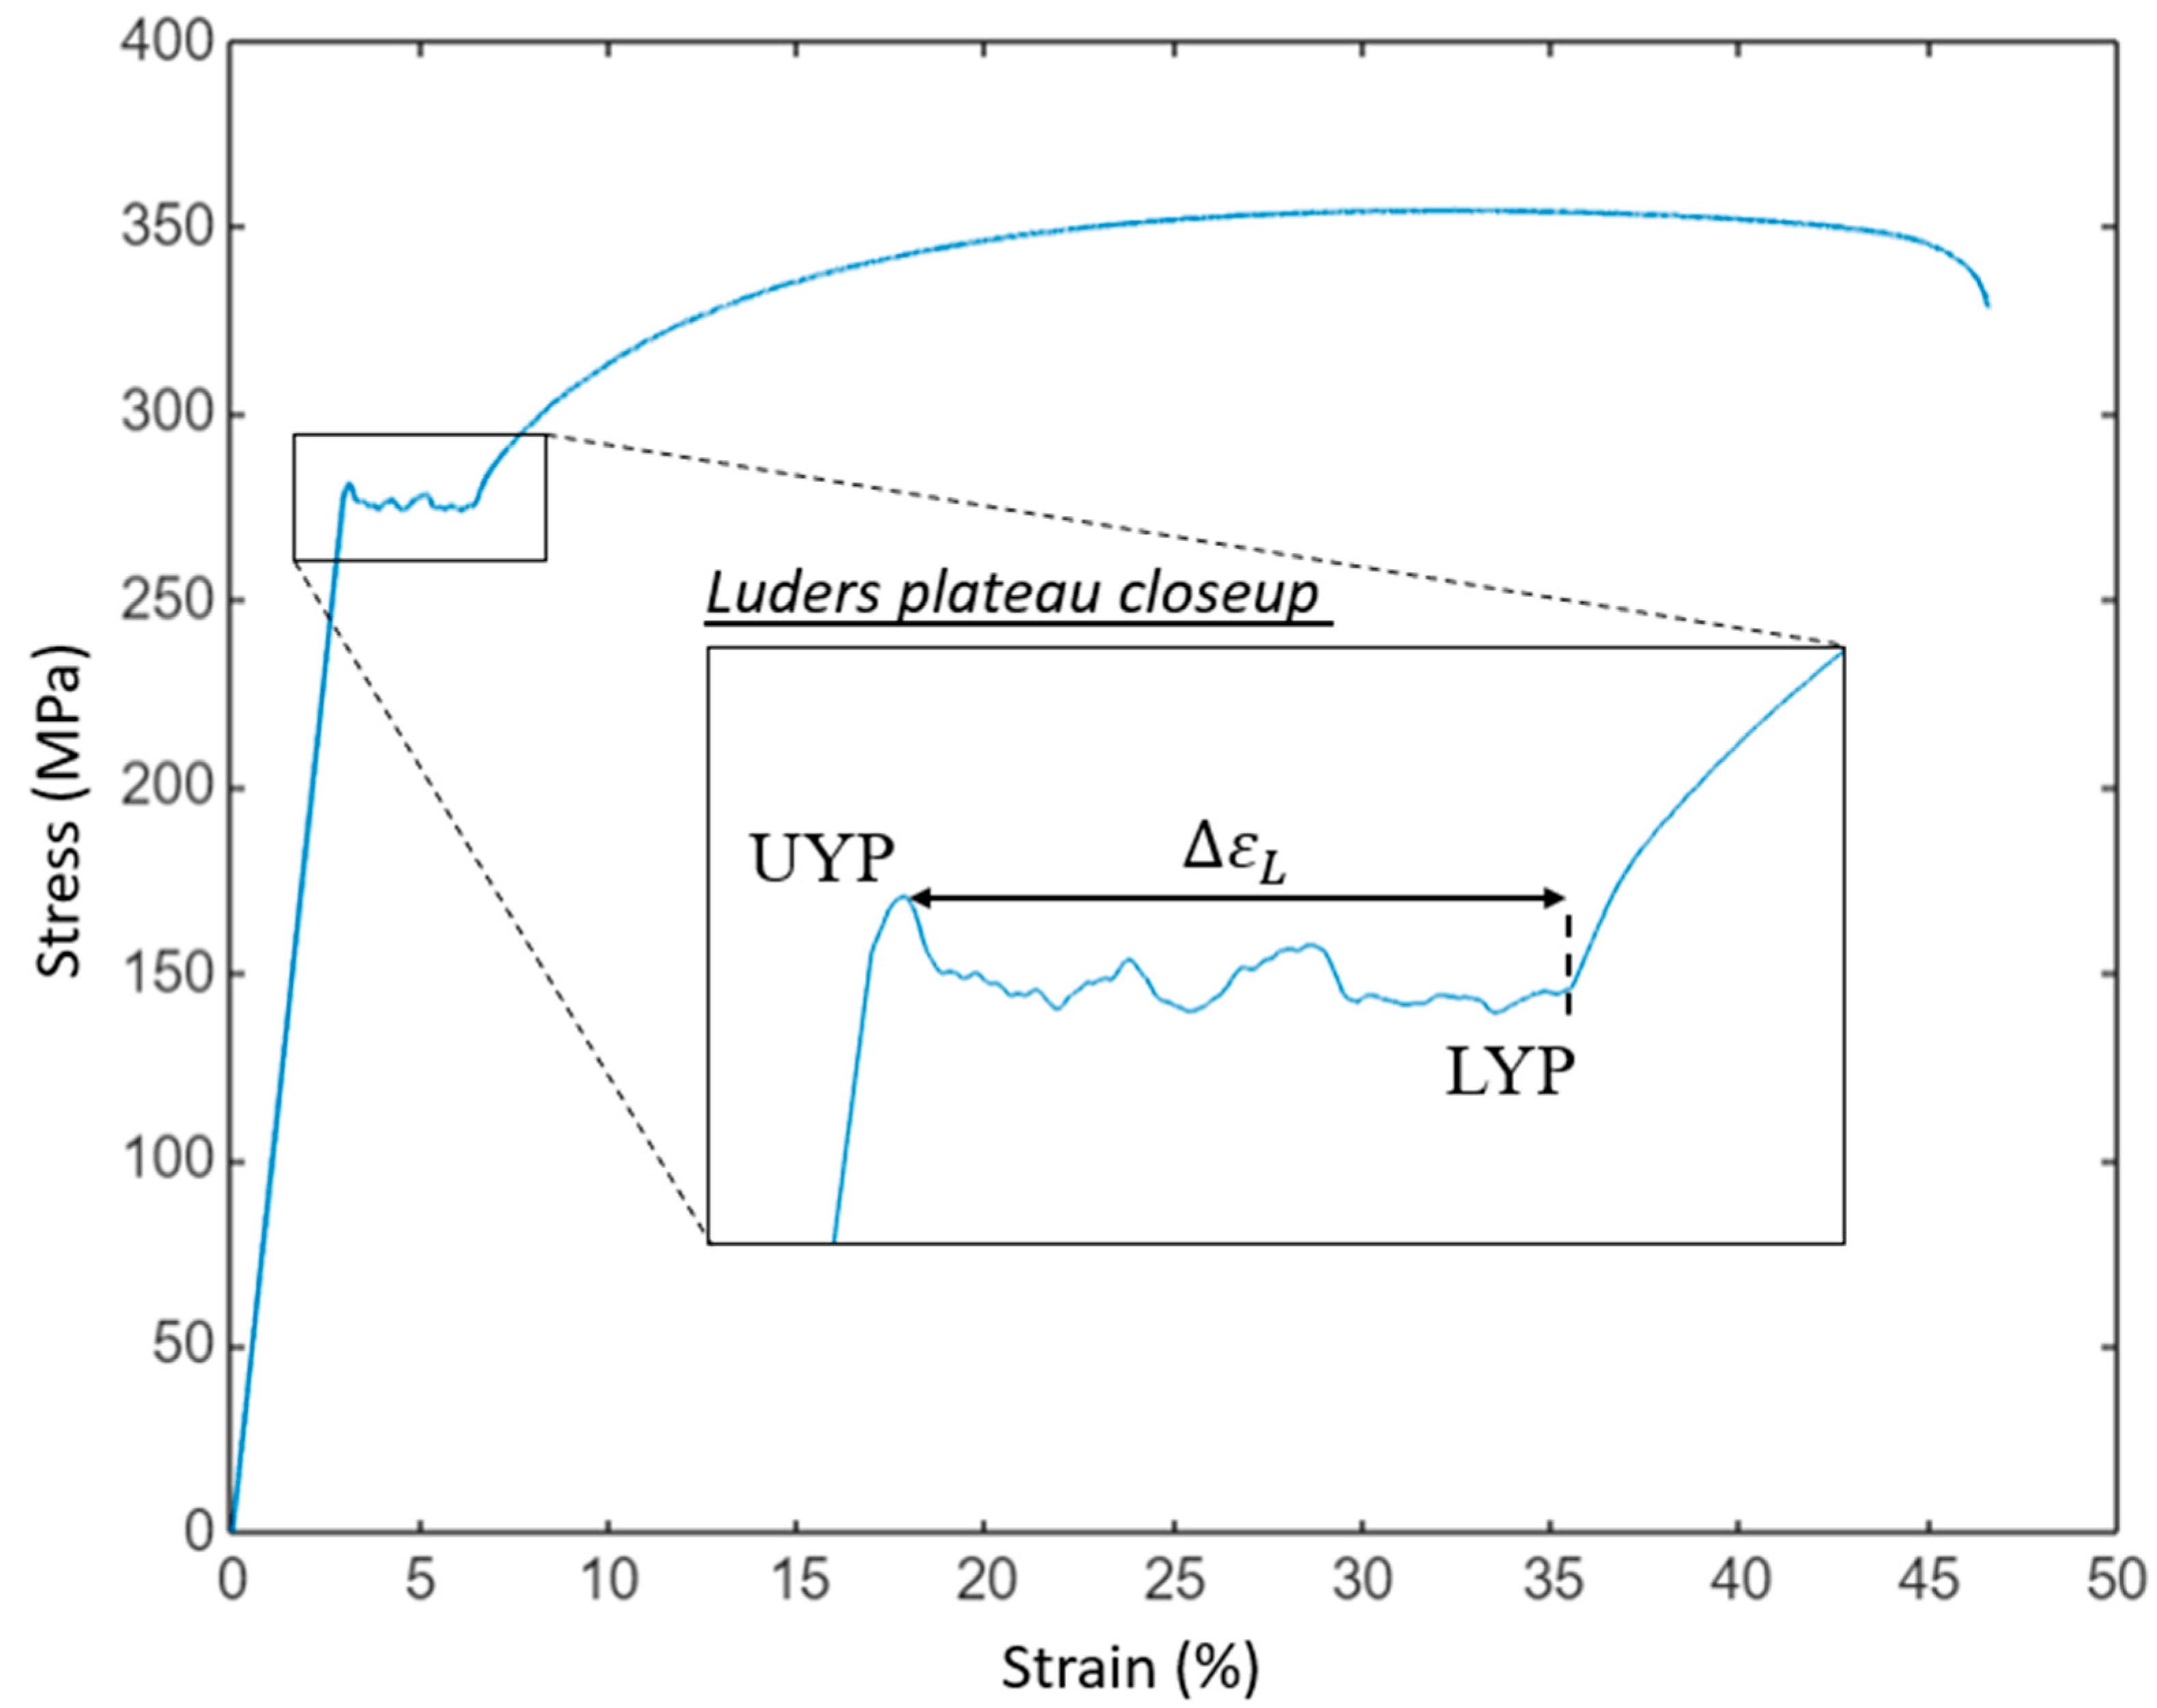
To account for potential misalignment or residual stress-induced straightening during loading, a strain offset was applied to the stress–strain data per ASTM E8/E8M guidelines [1]. Lüders strain ( Δ ε L ), the upper yield point (UYP), and the lower yield point (LYP) were then extracted from the stress–strain curves following ASTM E8/E8M standards. Figure 3 illustrates these yield properties. The elastic phase terminates at the upper yield point, where stress drops to the lower yield point and remains constant over the Lüders plateau ( Δ ε L ) before transitioning into strain hardening.
DIC image data for each specimen were processed using Correlated Solutions VIC-3D software (version 9). The workflow included stereoscopic calibration using calibration images, followed by importing test images and defining the area of interest (AOI) in the first image. A reference point was set at the very bottom of the AOI near the stationary grip, as per Correlated Solutions guidelines. The AOI was divided into grids by setting the subset parameter to 15, ensuring each grid contained at least four speckle dots. The step parameter, determining the number of iterations for each sub-grid, was fixed at a value of 4, roughly a quarter of the subset value. Correlation analysis computed three-dimensional displacements, followed by strain analysis to determine the full-field strain distribution.
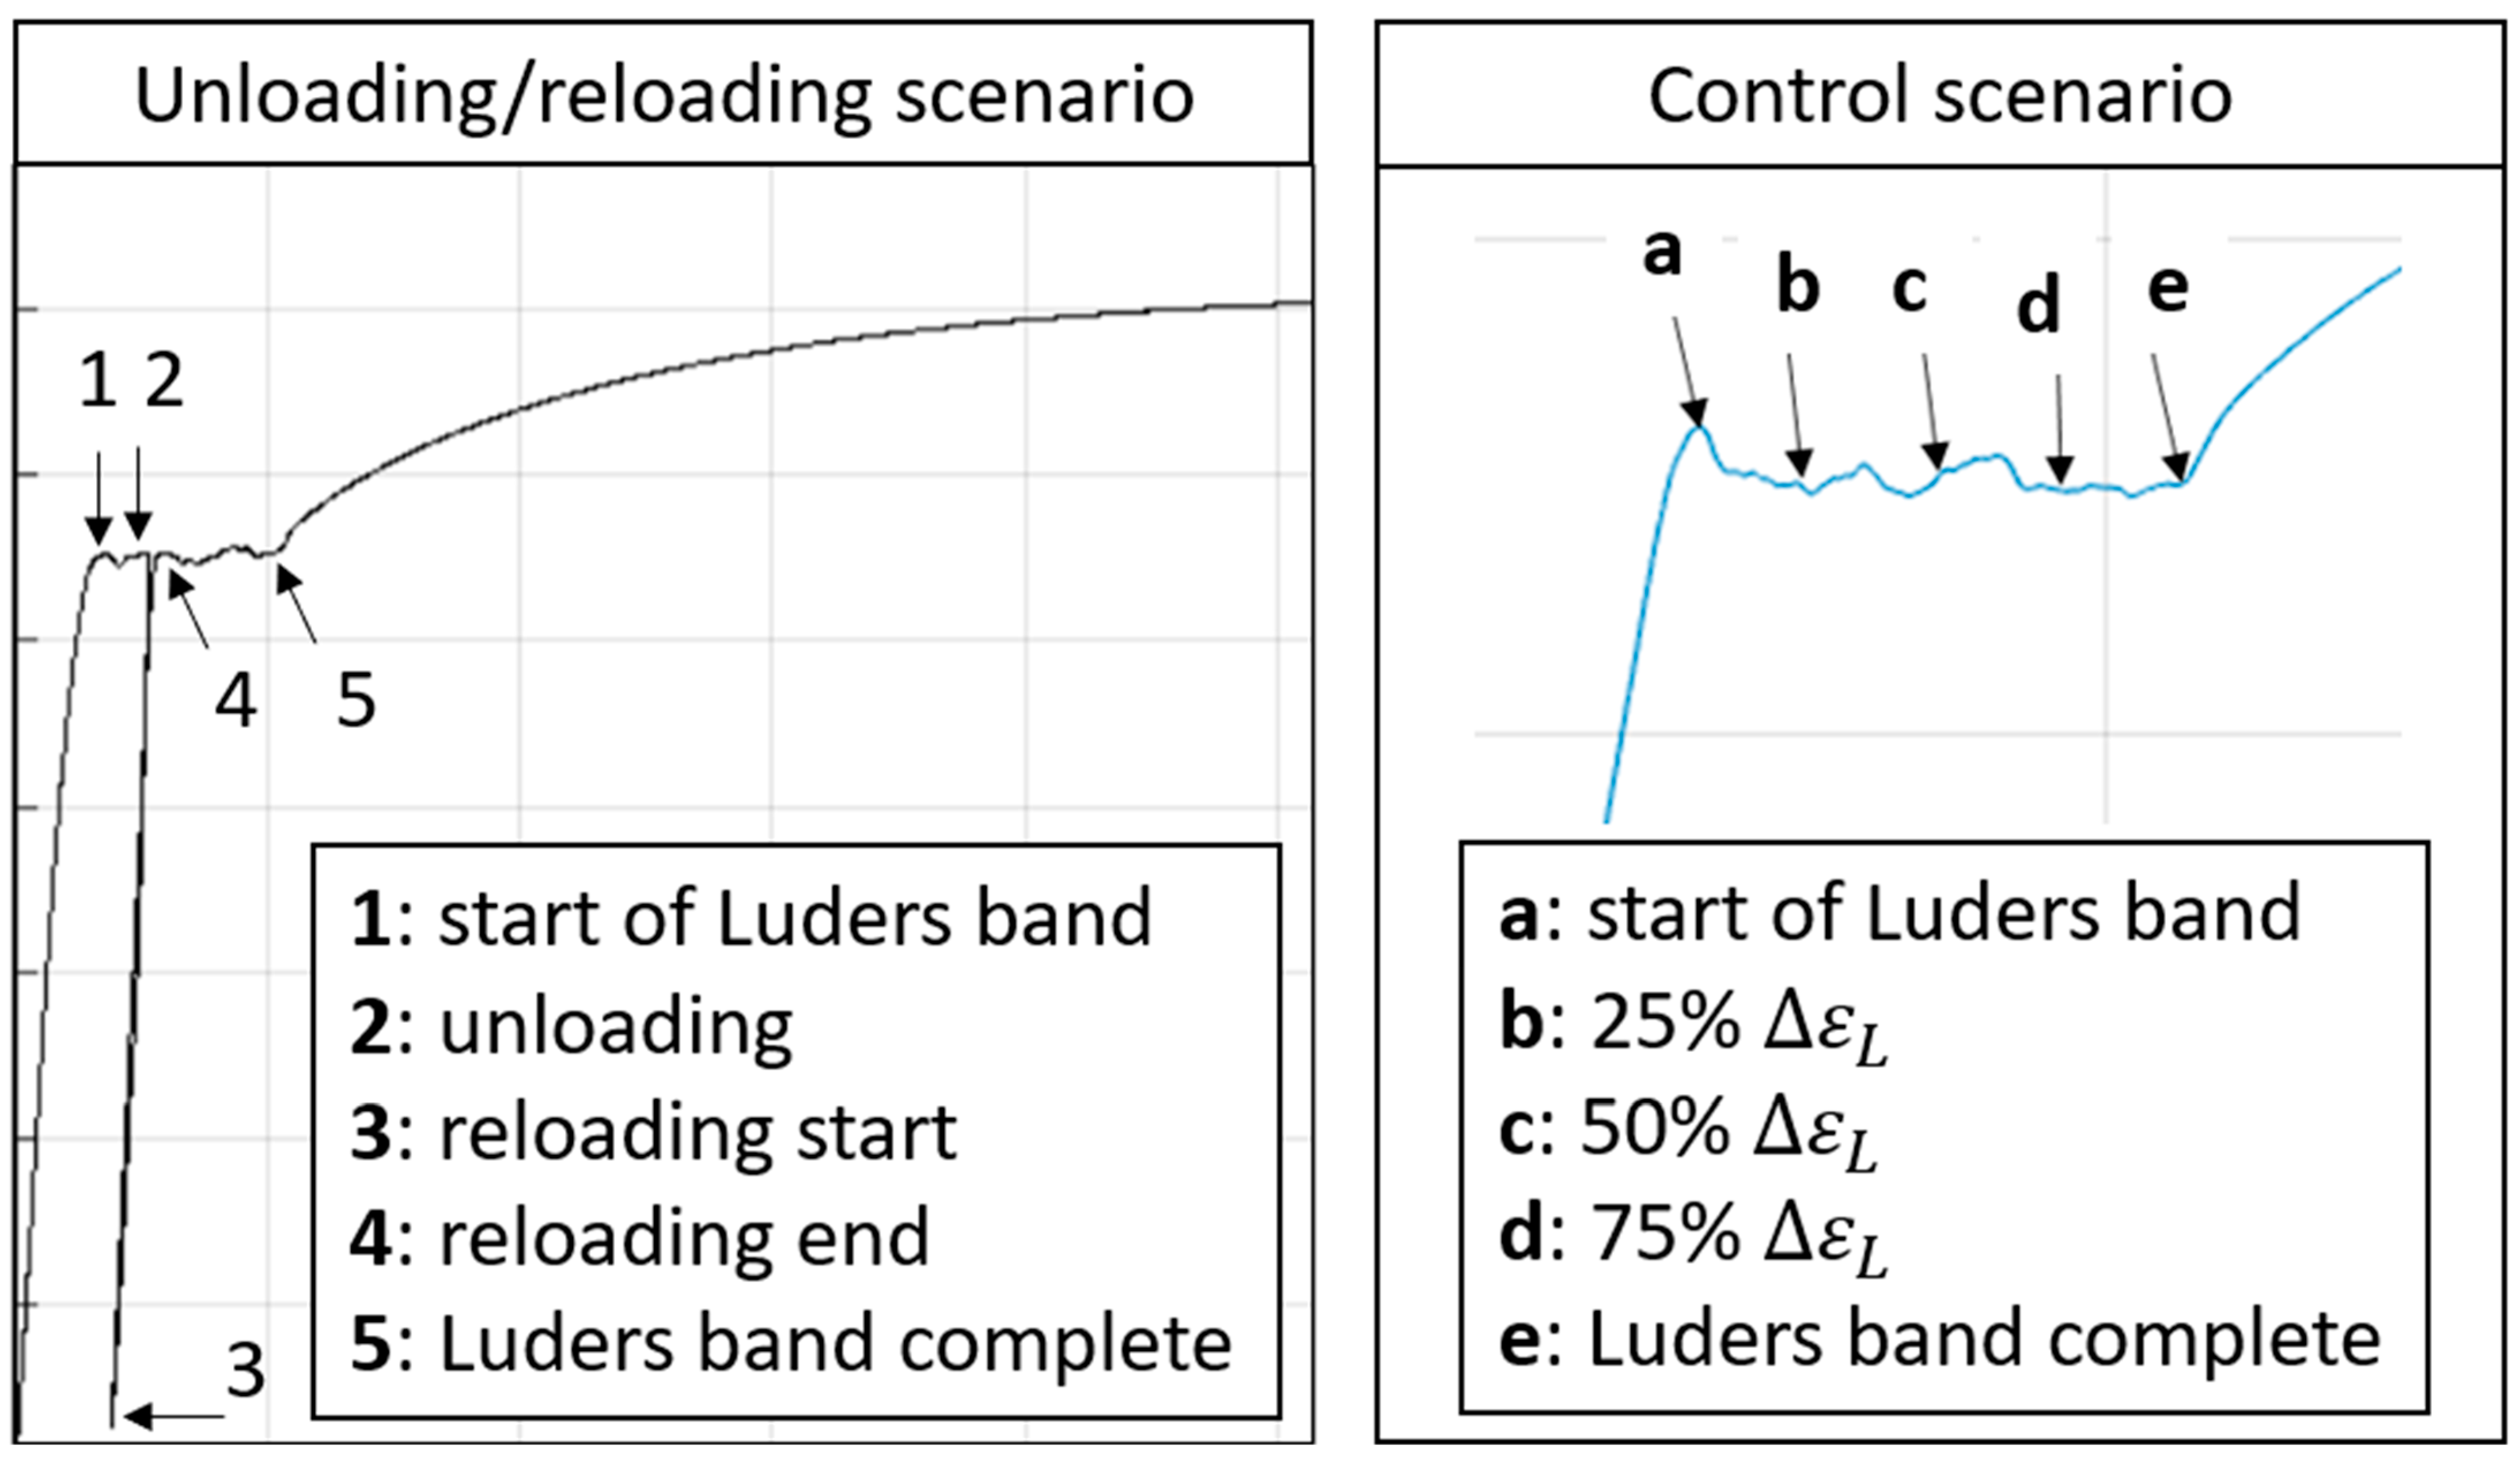
Strain along the length of the specimen (εyy) was extracted at five key instances of the test, as highlighted in Figure 4: (1) start of Lüder’s band, (2) instant at the start of unloading, (3) instant at the end of unloading (i.e., start of reloading), (4) instant at the end of reloading, and (5) end of Lüder’s band. It is important to note that for samples without unloading (T2/T3), the points labeled a, b, c, d, and e correspond to the start of Lüders band propagation, 25%, 50%, 75% and Lüders band completion stages.
The speckle pattern adhered to Correlated Solutions guidelines, ensuring isotropic distribution, random application, and uniform size, coverage, and contrast to minimize noise and enhance correlation accuracy. All speckled specimens are presented in Figure 2.

4. Results and Discussions

Figure 5 illustrates the stress–strain curves obtained from all experiments, demonstrating a high degree of repeatability and consistency, particularly within the elastic region up to the UYP. The Young’s modulus, UYP, LYP, and tensile strength (TS) were extracted from the stress–strain results and are tabulated in Table 4. Preliminary observations indicate the presence of Lüders deformation in all AISI 1524 steel specimens, suggesting localized strain heterogeneity and mechanical instability during the onset of plastic deformation.
This study aims to investigate Lüders phenomena in AISI 1524 steel under interrupted loading conditions, specifically during unloading and reloading sequences. The following sections will systematically quantify Lüders band formation, characterize the Lüders strain ( Δ ε L ), and analyze the distinctive features of Lüders bands across various interrupted loading scenarios.

4.1. Lüders Band Formation

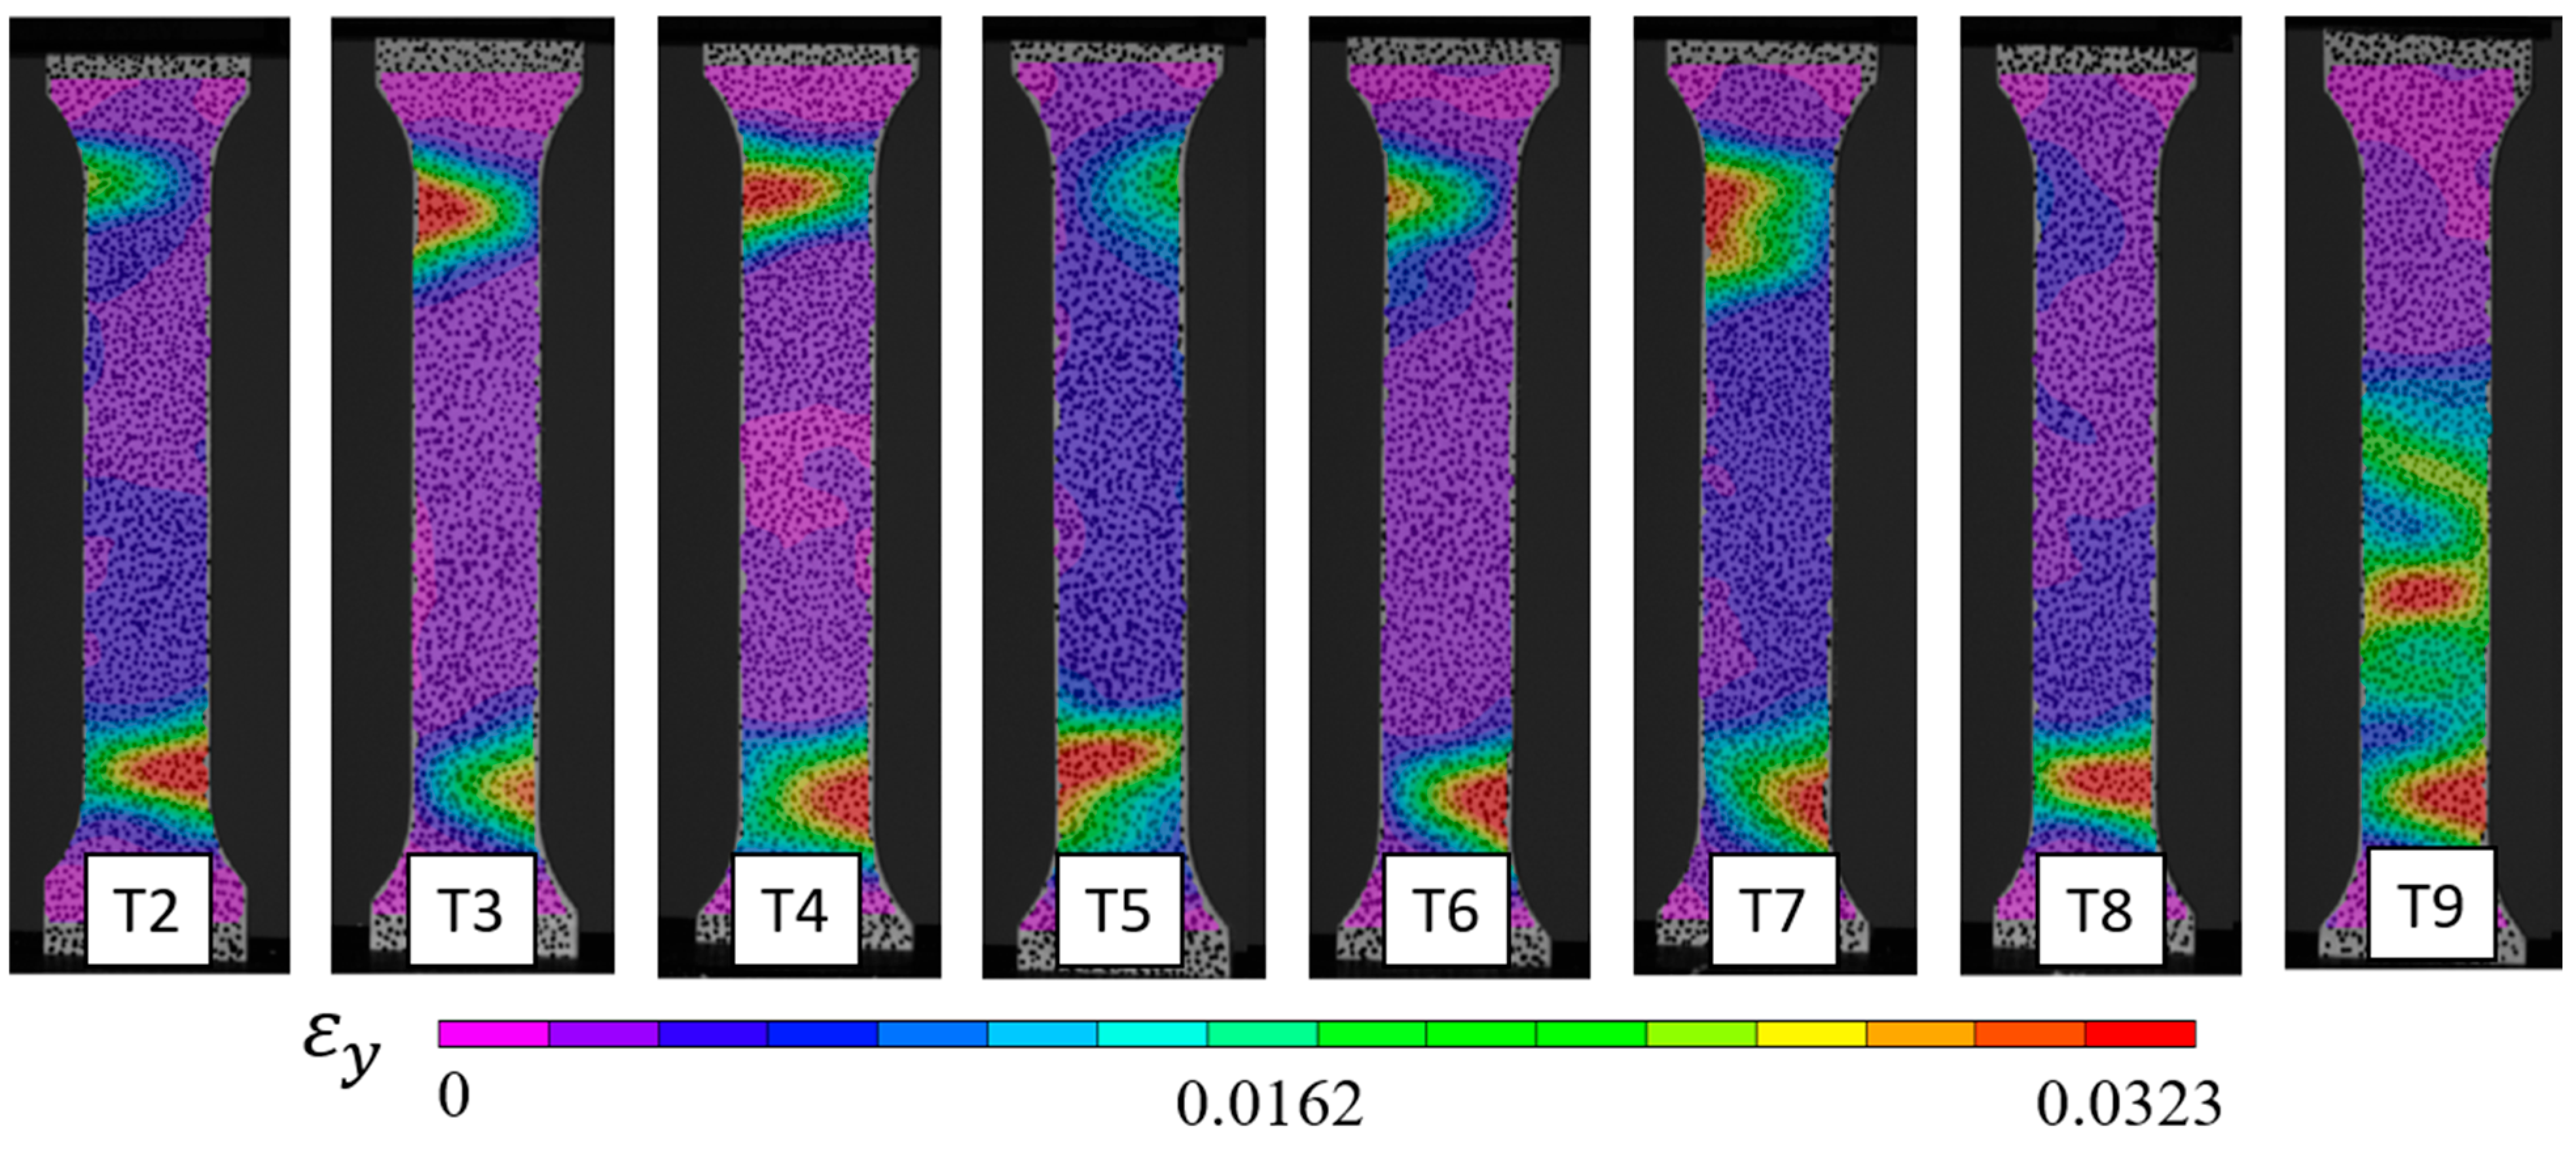
The initiation of the Lüders strain was determined through analysis of the vertical tensile strain data obtained via DIC. This metric represents the most reliable and widely used criterion for identifying band nucleation. Strain rate has also been demonstrated in the literature to be possible for such identification [21,22]. Figure 6 shows all 8 samples’ strain contours at the key point 1 of Figure 4 (i.e., at the UYP). Six out of the eight samples displayed the formation of two Lüders bands, as depicted in Figure 6 (T2 through T7). One sample exhibited the formation of a single band, as shown in Figure 6 (T8), while another sample showed the formation of three bands, with one dominant band, illustrated in Figure 6 (T9).
The occurrence of single Lüders bands is a common observation across various aluminum alloys, as documented in the literature [11], although it is not entirely uncommon in steel alloys. Similarly, investigations on nickel-titanium alloys have consistently identified the occurrence of a single distinct band [23]. Supporting our findings, other investigations into Lüders strains across various materials, particularly low alloy steels, have documented the occurrence of two bands [9,21].
The formation of one or two Lüders bands in a material can be attributed to a multitude of factors, including its microstructure, composition, and processing history. Materials characterized by a homogeneous microstructure and minimal defects typically manifest a single Lüders band, owing to the uniform propagation of plastic deformation throughout the specimen. Conversely, materials with a heterogeneous microstructure or containing defects such as inclusions or grain boundaries often exhibit multiple Lüders bands due to localized stress concentrations and non-uniform deformation. The microstructure in Figure 1 reveals equiaxed grains of varying sizes with well-defined boundaries, confirming a polycrystalline and largely random texture. Local heterogeneity in grain size and orientation, along with a few darker regions likely associated with inclusions or incomplete indexing, indicates variations in recrystallization across the sample. These microstructural features provide a direct basis for the observed Lüders band behavior, as grain boundaries, inclusions, and orientation differences can act as stress concentrators that promote multiple band nucleation and non-uniform propagation. Moreover, the presence of specific alloying elements or impurities can influence the initiation and propagation of Lüders bands. External factors such as loading conditions, strain rate, and temperature also play pivotal roles in determining the number of Lüders bands formed in a material.
It is worth noting that the different interrupted loading scenarios investigated in this paper had no effect on the band formation shown in Figure 6. Those are captured right at the UYP, whereas the interrupted loading scenarios started at 25%, 50%, and 75% Lüders strain. Stress concentrations can arise from variations in microstructural composition or alterations in specimen geometry. In this study, the consistent nucleation of Lüders bands at the top-right and bottom-left corners across nearly all tested samples suggests that these bands primarily originate from the gripping process during tensile testing. The gripping mechanism induces stress concentrations in the shoulder regions, particularly at the fillets, leading to dislocation pileups along the plane of maximum shear stress. This accumulation of dislocations facilitates the onset of Lüders banding at these locations. The observed nucleation sites align with prior investigations on Lüders band formation, including studies on hot-rolled steel [21], in IS 2062 grade-E250 B mild steel [5], and medium Mn steel [24], where Lüders bands were similarly found to initiate at the specimen shoulders or diagonally opposite corners.

4.2. Lüders Strain

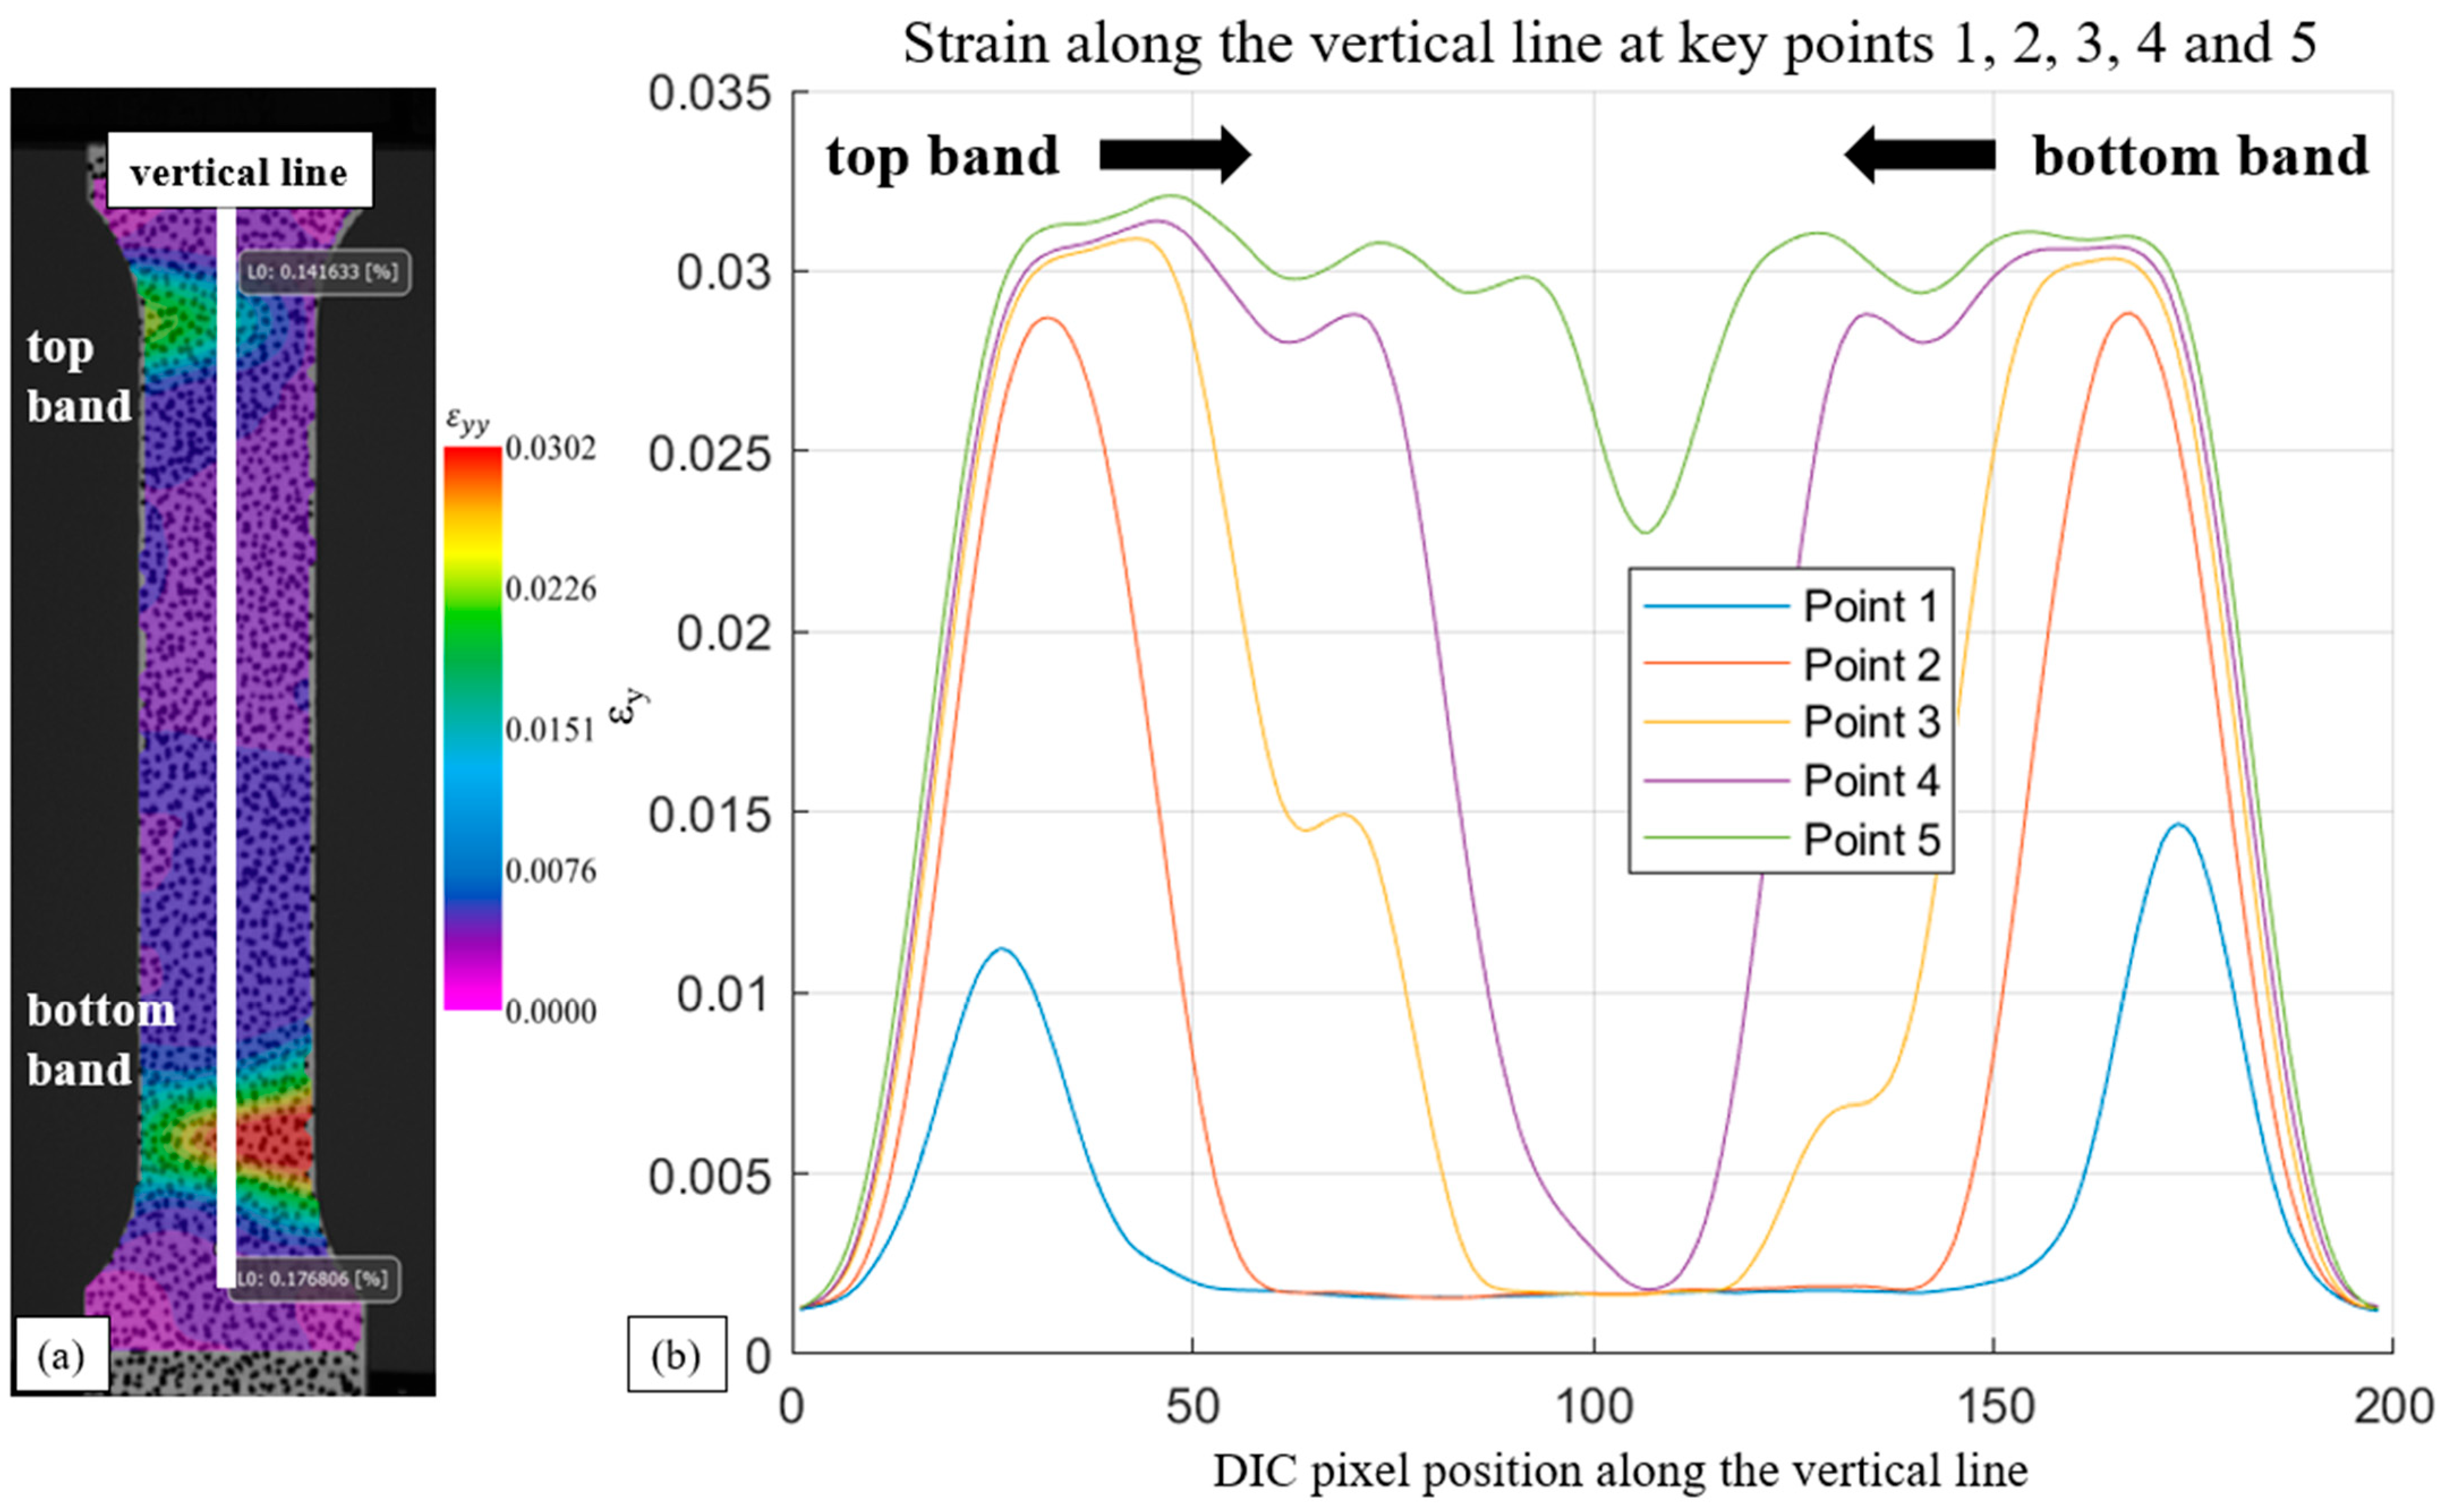
While the band is visible, as shown in Figure 6, a vertical line was introduced in the middle of the specimen in the VIC-3D software (Figure 7a). Local strain data in the y-direction of loading were extracted at the designated points, as previously identified in Figure 4. This enabled the export of strain values for further analysis. This facilitated the quantification of spatial aspects of the Lüders band throughout the plateau (Figure 7b). Note that the x-axis of Figure 7b refers to the DIC pixel location along the vertical line at the center of the sample, as identified in Figure 7a.
In Figure 3, the extent of the Lüders strain regime, Δ ε L , depicted in the stress–strain curve for the first two control samples, remained consistent, averaging at 3.3% strain. Using the average Lüders strain from T2 and T3 as a benchmark, we evaluated the impact of unloading. Interrupted loading at 25% and 50% Lüders strain increased the width of this regime by 11% and 8%, respectively. Conversely, unloading at 75% Lüders strain resulted in negligible changes to the Lüders plateau. This observed increase can be partially attributed to the additional displacement required to elevate the strain band intensities to levels comparable to those just before unloading.

4.3. Lüders Band Evolution

Specimen T2, the initial control specimen with no unloading, displayed the formation of two distinct Lüder bands: one at the bottom and the other at the top of the specimen. Notably, the lower band emerged earlier and exhibited a higher intensity compared to the upper band. Although the upper band showed limited growth and propagation towards the lower band, it did not extend significantly. The lower band gradually moved towards the upper band from points one to three. Upon nearing the center of the specimen, the lower band ceased its growth, and a third band emerged, as observed in the image at point four in Figure 8b. By point five, all three bands merged. Similar observations of the formation of more than two Lüder bands were also reported in [11]. Specimen T3, the subsequent control specimen in the test program, exhibited behavior largely consistent with that of Specimen T2, although specific details are not provided in this section.
In Specimen T4, two Lüder bands of similar intensities formed and grew concurrently until unloading. Following unloading, the overall strain across the specimen decreased by approximately 0.1%. A noticeable reduction in the size of the Lüder bands was observed between the images at points two and three. This can be seen in Figure 9c, where there is a drop in the strain level. Upon resuming tensile loading, the Lüder bands continued to expand toward the center of the specimen, ultimately merging at the end of the Lüders plateau region. Specimen T5 exhibited the development of a prominently pronounced lower Lüder band, fully matured by the point of unloading, resembling the initial band formation observed in Specimen T2. After unloading, there was a 0.1% decrease in overall strain. By point five, both upper and lower bands attained comparable sizes, with two additional bands emerging between them in a ripple-like pattern. This behavior mirrors that of Specimen T2, where the central merging of the two bands did not occur, but instead, additional bands appeared between them.
Specimen T6 displayed the formation of two Lüder bands of comparable size and intensity, persisting up to the unloading point, where a 0.1% decrease in strain occurred across the specimen’s length. These bands continued to propagate towards the center, ultimately merging at the conclusion of the Lüders plateau region, as illustrated in Figure 10.
Specimen T7 exhibited a similar overall behavior throughout the yield point elongation (YPE) region as Specimen T6; however, two notable differences were observed. Firstly, Specimen T7 displayed a larger upper band at the onset of the YPE region (point 1). Secondly, an additional band, distinct from the upper and lower bands, became apparent just below the upper band at index 114. This third ‘center’ band merged with the upper band before the ultimate fusion of the upper and lower bands at the conclusion of the YPE region.
Unlike the earlier six tests, specimen T8 developed a single Lüders band at the very bottom, as shown in Figure 11b, in contrast to the two-band patterns observed in Figure 8b, Figure 9b, and Figure 10b. Between points one and two, an upper band emerged, accompanied by three intermediate bands positioned between the upper and lower bands at various load frames across the plateau. Interestingly, specimen T9 displayed distinctive behavior compared to the initial six tests, showcasing the formation of three Lüders bands exclusively in the lower half of the specimen, with no corresponding formation of an upper band. The convergence of all three bands occurred before the initiation of the unloading sequence. While maintaining consistent behavior during unloading, characterized by an overall reduction in strain, the heightened development level of the bands in this specimen led to a comparatively less significant decrease in band size compared to specimens unloaded at earlier points. The microstructural image included in this study confirms heterogeneity in grain size, orientation, and inclusions. These features are known to act as stress concentrators and are therefore the most plausible explanation for the variations in band number and distribution observed in T8 and T9.
In this study, AISI 1524 steel alloy samples were subjected to interrupted tension loading at different points within the plastic Lüders region. Utilizing a DIC system, full-field strain data were captured to observe the Lüder banding formation and evolution. The impact of interrupted loading on the Lüders phenomenon in AISI 1524 steel can be summarized as follows:
The material exhibited a Lüders strain ( Δ ε L ) of approximately 3.3%.
Interrupted loading at 25% Δ ε L increased the Lüders plateau strain region by an average of 11%.
Interrupted loading at 50% Δ ε L increased the Lüders plateau strain region by an average of 8%.
Interrupted loading at 75% Δ ε L showed minimal impact on the evolution of Lüders bands. This trend is expected to be the case for interrupted loadings beyond 75%.
Unloading at various strain rates resulted in an immediate drop in strain intensity, indicative of elastic strain recovery.
While the majority of samples displayed two Lüders bands, a subset exhibited either a single band or three bands, suggesting a complex relationship with material heterogeneity and specific impurities present in each sample.
These results confirm that the response of Lüders bands is highly sensitive to loading history. From an industrial perspective, this means that partial unloading early in the Lüders plateau can exacerbate strain localization and extend the plateau, increasing the risk of surface defects such as stretcher strains. In contrast, unloading in the later stages has little impact, suggesting that process interruptions or tool dwell times are less critical at those points. Such insights are valuable for forming and stamping operations, where controlling banding is important for surface quality, and can also help refine constitutive models used in predictive forming simulations.
Future research could extend this work by examining specimens of varying thicknesses or geometries, exploring the influence of hold times in the unloaded state before reloading, and employing multiple DIC cameras to capture three-dimensional strain fields for a more detailed understanding of Lüders band nucleation, formation, and propagation.

Author Contributions

Conceptualization, W.A.S.; methodology, M.A. and W.A.S.; material preparation, M.A.; experimentation, M.A. and W.A.S.; formal analysis and investigation, M.A., S.P. and W.A.S.; writing—original draft preparation, M.A.; writing—review and editing, M.A., S.P. and W.A.S.; supervision, W.A.S. All authors have read and agreed to the published version of the manuscript.

Funding

This research received no external funding.

Institutional Review Board Statement

Not applicable.

Informed Consent Statement

Informed consent was obtained from all participants involved in the study. All participants provided informed consent for the publication of relevant data and findings.

Data Availability Statement

The data and materials used in this study are available from the corresponding author upon reasonable request.

Acknowledgments

The authors sincerely acknowledge the technical expertise and assistance provided by S. Raviprakash and Abhishek G. of Pyrodynamics, India, in facilitating the use of the DIC system. Additionally, appreciation is extended to Priyank Upadhyaya and Sudip Baul from BITS Pilani, Dubai Campus, for granting access to their Digital Microscope, which was instrumental in this study.

Conflicts of Interest

The authors affirm that no financial conflicts of interest or personal affiliations exist that could have influenced the results presented in this study.

References

  1. ASTM E8/E8M-22; Standard Test Methods for Tension Testing of Metallic Materials. ASTM International: West Conshohocken, PA, USA, 2022.
  2. Ananthan, V.; Hall, E. Macroscopic aspects of Lüders band deformation in mild steel. Acta Metall. Mater. 1991, 39, 3153–3160. [Google Scholar] [CrossRef]
  3. Kyriakides, S.; Miller, J.E. On the Propagation of Luders Bands in Steel Strips. J. Appl. Mech. 2000, 67, 645–654. [Google Scholar] [CrossRef]
  4. Onodera, R.; Nonomura, M.; Aramak, M. Stress Drop, Luders Strain and Strain Rate during Serrated Flow. J. Jpn. Inst. Met. Mater. 2000, 64, 1162–1171. [Google Scholar] [CrossRef][Green Version]
  5. Nagarajan, S.; Narayanaswamy, R.; Balasubramaniam, V. An Insight into Lüders Deformation Using Advanced Imaging Techniques. J. Mater. Eng. Perform. 2013, 22, 3085–3092. [Google Scholar] [CrossRef]
  6. Liu, G.-L.; Li, Y.-R.; Huang, G.-Y.; Ke, L.-L.; Wang, Y.-Z. Characterization of Portevin–Le Chatelier effect in aluminum alloy AA5052 under strain-controlled tensile test via digital image correlation and acoustic emission. J. Mater. Sci. 2024, 59, 16341–16354. [Google Scholar] [CrossRef]
  7. Lisiecka-Graca, P.; Lisiecki, Ł.; Zyguła, K.; Wojtaszek, M. Evaluation of cracking risk of 80MnSi8-6 nanobainitic steel during hot forging in the range of lower temperature limits. Mater. Sci. Pol. 2024, 42, 171–185. [Google Scholar]
  8. Brlić, T.; Rešković, S.; Vodopivec, F.; Jandrlić, I. Lüders Bands at the Beginning of the Plastic Flow of Materials. Metalurgija 2018, 47, 357–359. [Google Scholar]
  9. Johnson, D.; Edwards, M.; Chard-Tuckey, P. Microstructural effects on the magnitude of Lüders strains in a low alloy steel. Mater. Sci. Eng. A 2015, 625, 36–45. [Google Scholar] [CrossRef]
  10. van der Heijde, J.; Samad, W.A. The Effect of Specimen Thickness on the Lüders Phenomena in AISI 1524 Steel Alloy: Experimental Observations Using DIC. Exp. Mech. 2023, 63, 885–896. [Google Scholar] [CrossRef]
  11. Cai, Y.-L.; Yang, S.-L.; Fu, S.-H.; Zhang, Q.-C. The Influence of Specimen Thickness on the Lüders Effect of a 5456 Al-Based Alloy: Experimental Observations. Metals 2016, 6, 120. [Google Scholar] [CrossRef]
  12. Sun, H.B.; Yoshida, F.; Ohmori, M.; Ma, X. Effect of strain rate on Lüders band propagating velocity and Lüders strain for annealed mild steel under uniaxial tension. Mater. Lett. 2003, 57, 4535–4539. [Google Scholar] [CrossRef]
  13. Brlić, T.; Rešković, S.; Jandrlić, I.; Skender, F. Influence of strain rate on stress changes during Lüders bands formation and propagation. IOP Conf. Ser. Mater. Sci. Eng. 2018, 461, 012007. [Google Scholar] [CrossRef]
  14. Rešković, S.; Jandrlić, I.; Vodopivec, F. Influence of Testing Rate on Lüders Band Propagation in Niobium Microalloyed Steel. Metalurgija 2016, 55, 157–160. [Google Scholar]
  15. Zhang, W.; Kyriakides, S. Evolution of Lüders banding under axial loading and reverse loading. Int. J. Solids Struct. 2022, 257, 111780. [Google Scholar] [CrossRef]
  16. ASTM E415-21; Standard Test Method for Analysis of Carbon and Low-Alloy Steel by Spark Atomic Emission Spectrometry. ASTM International: West Conshohocken, PA, USA, 2021.
  17. ASTM E112-24; Standard Test Methods for Determining Average Grain Size. ASTM International: West Conshohocken, PA, USA, 2021.
  18. Tsuchidaa, N.; Masuda, H.; Harada, Y.; Fukaura, K.; Tomato, Y.; Nagai, K. Effect of ferrite grain size on tensile deformation behavior of a ferrite-cementite low carbon steel. Mater. Sci. Eng. A 2008, 488, 446–452. [Google Scholar] [CrossRef]
  19. Adkins, I. Vic-3D 9 Testing Guide; Correlated Solutions, Inc.: Irmo, SC, USA, 2020. [Google Scholar]
  20. Tsuchida, N.; Tomato, Y.; Nagai, K.; Fukaura, K. A simple relationship between Lüders elongation and work-hardening rate at lower yield stress. Scr. Mater. 2006, 54, 57–60. [Google Scholar] [CrossRef]
  21. Qiu, H.; Inoue, T.; Ueji, R. Experimental measurement of the variables of Lüders deformation in hot-rolled steel via digital image correlation. Mater. Sci. Eng. A 2020, 790, 139756. [Google Scholar] [CrossRef]
  22. Qiu, H.; Inoue, T.; Ueji, R. In-Situ Observation of Lüders Band Formation in Hot-Rolled Steel via Digital Image Correlation. Metals 2020, 10, 530. [Google Scholar] [CrossRef]
  23. Shariat, B.S.; Li, Y.; Yang, H.; Wang, Y.; Liu, Y. On the Lüders band formation and propagation in NiTi shape memory alloys. J. Mater. Sci. Technol. 2022, 116, 22–29. [Google Scholar] [CrossRef]
  24. Wang, X.G.; He, B.B.; Liu, C.H.; Jiang, C.; Huang, M.X. Extraordinary Lüders-strain-rate in medium Mn steels. Materialia 2019, 6, 100288. [Google Scholar] [CrossRef]
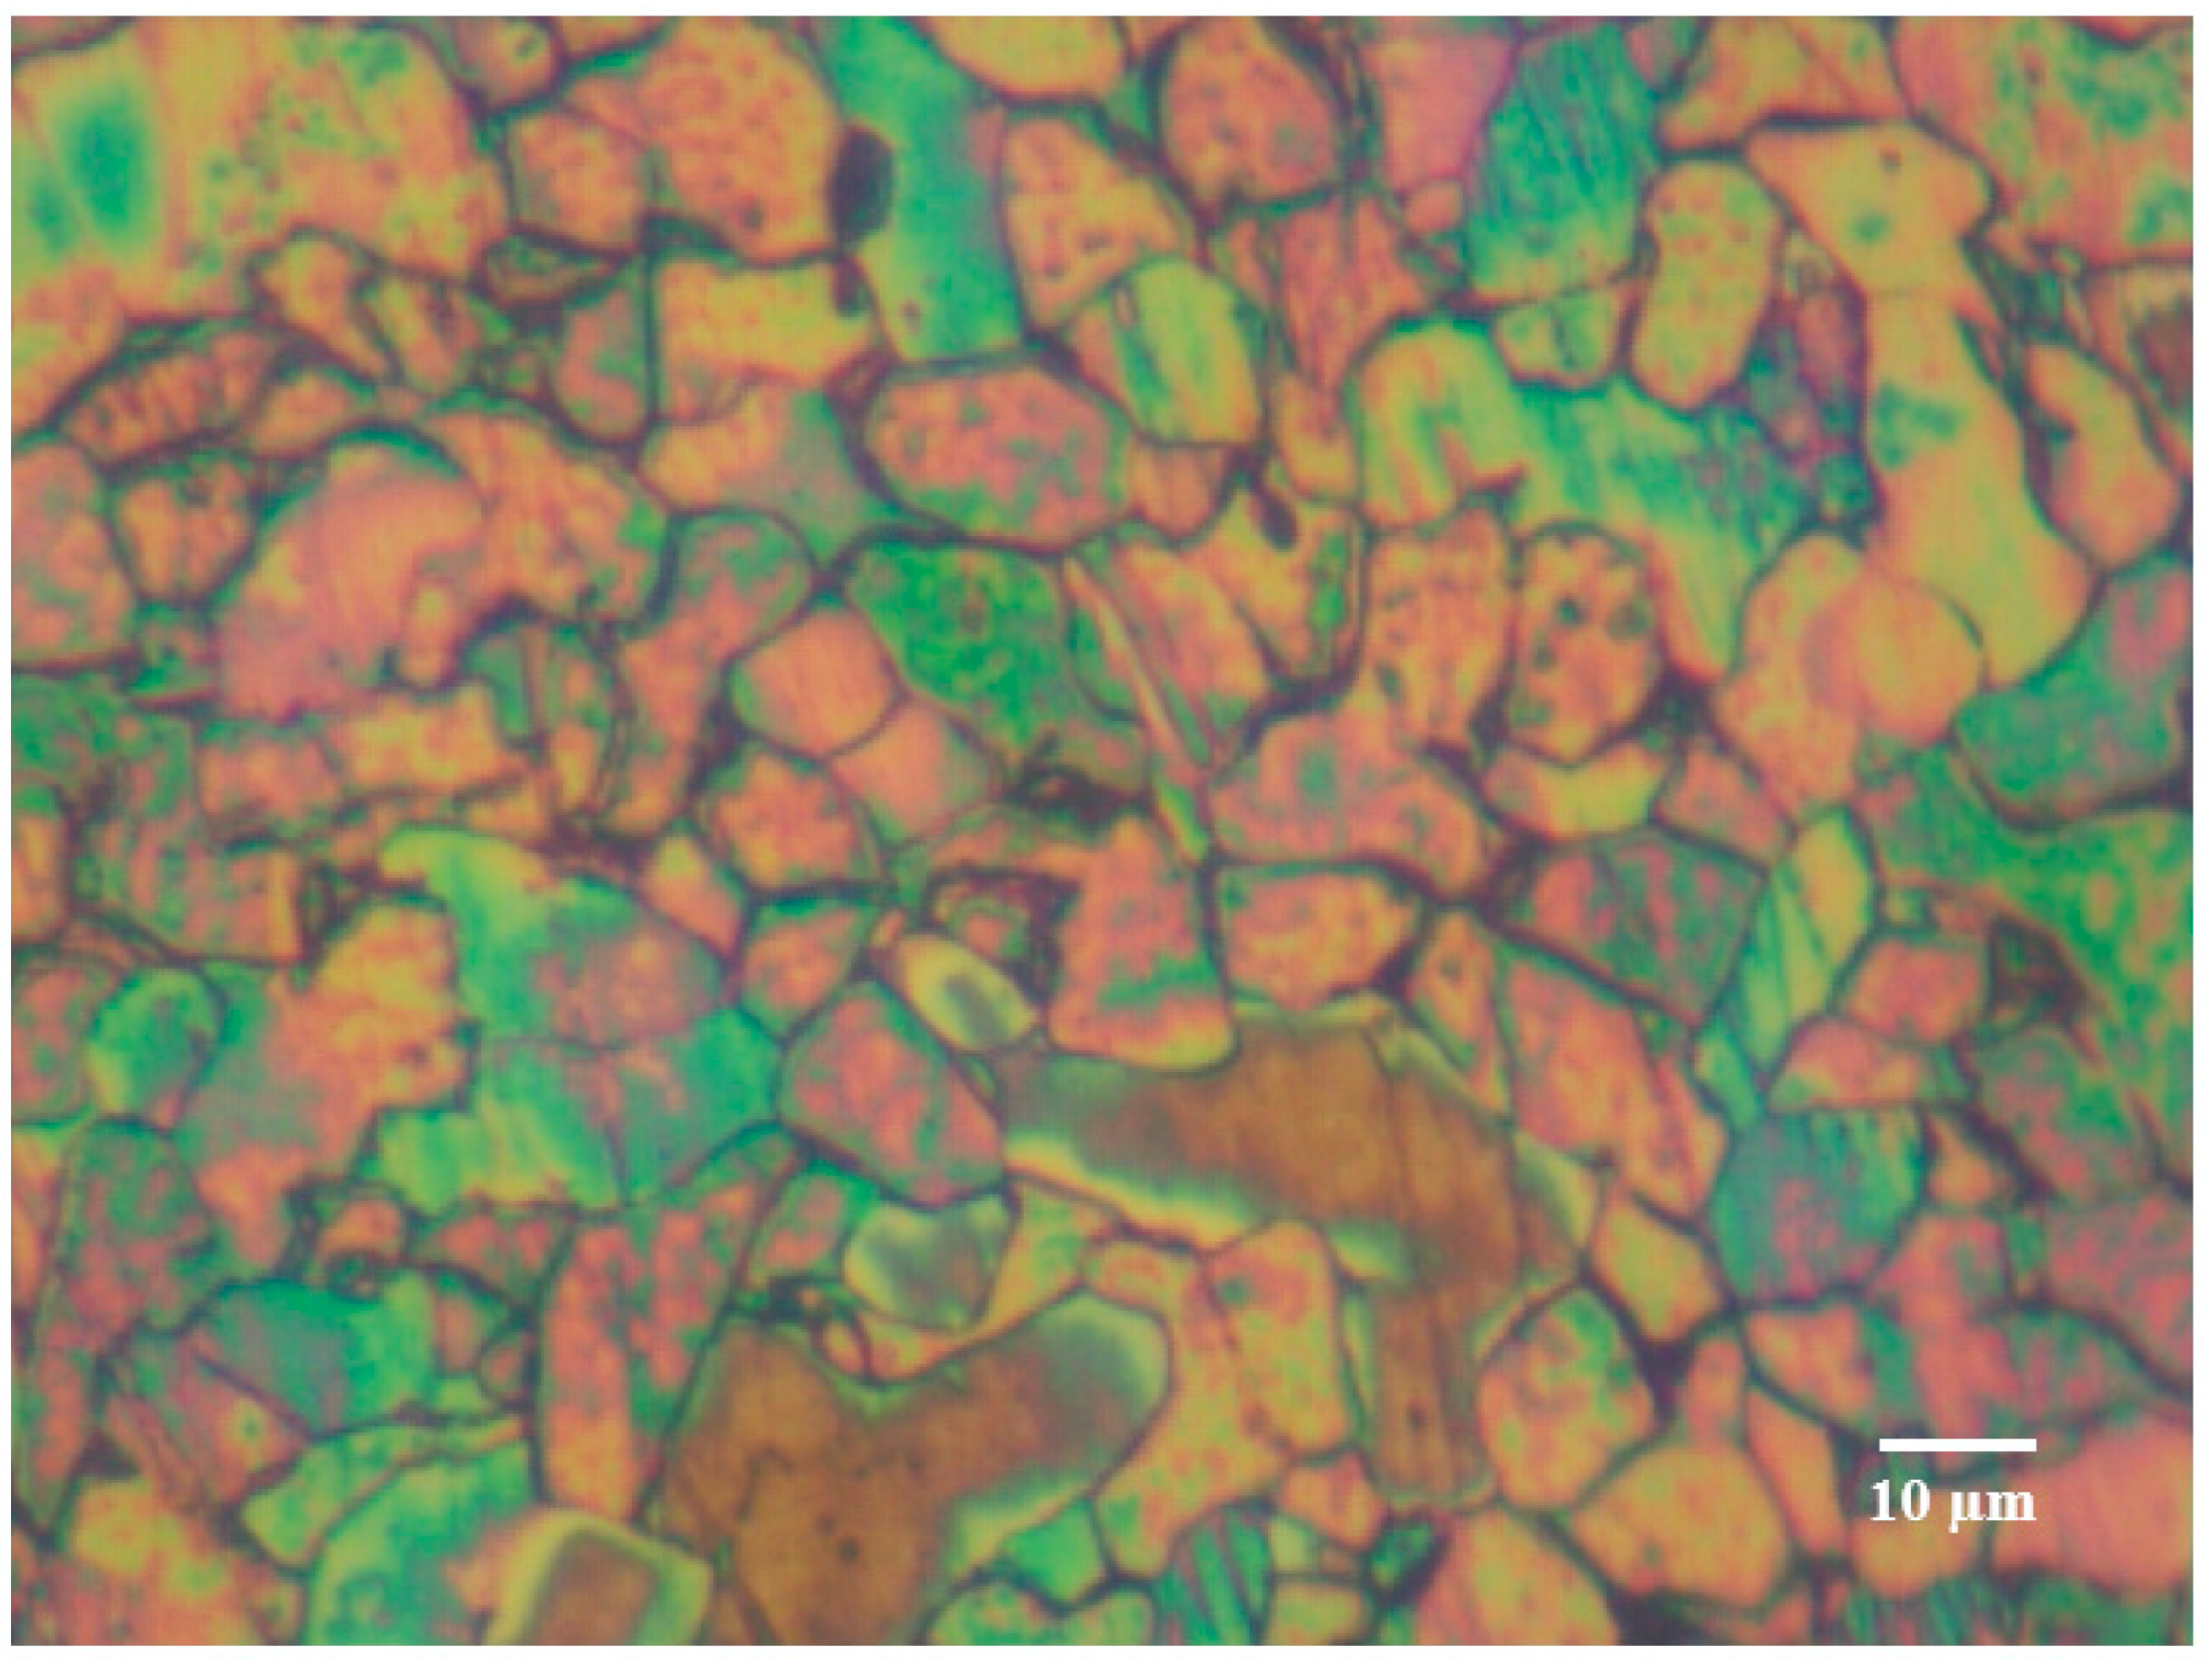
Figure 1. Grain microstructure of AISI 1524 steel under investigation.
Alloys 04 00019 g001
Figure 2. Specimens with a speckle pattern applied.
Alloys 04 00019 g002
Figure 3. Detailed view of the Lüders plateau, highlighting the Δ ε L , UYP, and LYP.
Alloys 04 00019 g003
Figure 4. Strain extraction points for the unloading–reloading and control scenarios.
Alloys 04 00019 g004
Figure 5. Combined stress–strain curves for all samples in Table 4.
Alloys 04 00019 g005
Figure 6. Lüders band for all samples right at the UYP.
Alloys 04 00019 g006
Figure 7. Lüders band quantification from (a) strain DIC data and (b) plot of corresponding strain distribution along the vertical centerline at key points 1, 2, 3, 4, and 5.
Alloys 04 00019 g007
Figure 8. Lüders band propagation in control scenario at key points 1–5: (a) close-up of the stress–strain curve, (b) DIC vertical strain contours, and (c) strain magnitude distribution along the specimen length.
Alloys 04 00019 g008
Figure 9. Lüders band propagation in unload at 25% scenario at key points 1–5: (a) close-up of the stress–strain curve, (b) DIC vertical strain contours, and (c) strain magnitude distribution along the specimen length.
Alloys 04 00019 g009
Figure 10. Lüders band propagation in unload at 50% scenario at key points 1–5: (a) close-up of the stress–strain curve, (b) DIC vertical strain contours, and (c) strain magnitude distribution along the specimen length
Alloys 04 00019 g010
Figure 11. Lüders band propagation in unload at 75% scenario at key points 1–5: (a) close-up of the stress–strain curve, (b) DIC vertical strain contours, and (c) strain magnitude distribution along the specimen length5. Conclusions.
Alloys 04 00019 g011
Table 1. AISI 1524 chemical composition.
ElementMnCSiPSFe
Content (wt. %)1.550.240.340.030.06Balance
Table 2. Correlated solution system specifications.
Camera Resolution1920 × 1200 (2.3 MP)
Exposure Time19 μs–1 s
Field of ViewFixed: 150 × 200 mm
Displacement ResolutionIn-plane: ±2 μm, Out-of-plane: ±4 μm
Strain Resolution50 με
Strain Range0.005% to >2000%
Table 3. Experimental conditions and parameters.
Test NumberSpecimen ID Target   Unload   ( % ε L )Thickness (mm)Crosshead Speed (mm/min)DIC Frame Rate (Hz)Temperature (°C)
1T10%110.523
2T20%10.50.523
3T30%10.50.523
4T425%10.50.523
5T525%10.50.523
6T650%10.50.523
7T750%10.50.523
8T875%10.50.523
9T975%10.50.523
Table 4. Mechanical properties.
Specimen IDE (GPa)UYS (MPa)LYS (MPa)TS (MPa)
T2230281276354
T3230273273353
T4220276272353
T5241279274356
T6239276275356
T7256278275358
T8248274271352
T9248277272357
Average239277274355
Disclaimer/Publisher’s Note: The statements, opinions and data contained in all publications are solely those of the individual author(s) and contributor(s) and not of MDPI and/or the editor(s). MDPI and/or the editor(s) disclaim responsibility for any injury to people or property resulting from any ideas, methods, instructions or products referred to in the content.