Article

Influence of Subsequent Heat Treatment on Fatigue Behavior of Shear-Cut Electrical Steel Sheets

Technische Hochschule Ingolstadt, Esplanade 10, 85049 Ingolstadt, Germany
*
Author to whom correspondence should be addressed.
Alloys 2024, 3(4), 281-294; https://doi.org/10.3390/alloys3040017
Submission received: 29 August 2024 / Revised: 16 October 2024 / Accepted: 7 November 2024 / Published: 25 November 2024

Abstract

:
The fatigue behavior of a fully processed, non-oriented electrical steel sheet is investigated in dependence on shear-cutting parameters and a subsequent heat treatment. For this, stress-controlled fatigue tests are performed before and after annealing at 700 °C for a total of six different shear-cutting settings. For all parameters, the fatigue strength of shear-cut sheets is improved by the heat treatment. This is due to reduction in a large part of the strain hardening region as well as the reduction in tensile residual stresses. Both were introduced during shear cutting and act detrimental to the fatigue strength. However, the intensity of this improvement depends on the shear-cutting parameters. This is related to the corresponding edge surfaces characteristically being formed during shear cutting. Specimens cut with a worn cutting tool show a more pronounced increase in fatigue life. In contrast, specimens produced with a sharp-edged cutting tool and high cutting clearance hardly benefit from the heat treatment. This appears to be caused by differences in surface topography, in particular coarse topographical damage in the form of grain breakouts. If these occur during shear cutting, the crack formation is not significantly delayed by additional annealing.

1. Introduction

Electrical steel sheets are thin metal strips made of iron alloys with silicon as the main alloying element. They are often used as laminated stacks to form the magnetic core of electric motors. The properties of electrical steel sheets are often optimized for soft magnetic characteristics. However, the design of electrical steels for automotive applications with high performance requirements is not entirely focused on magnetic properties. Instead, the combination of proper electromagnetic and mechanical properties is necessary due to high rotational speeds and frequent changes in velocity. Here, the mechanical stresses primarily emerge from centrifugal forces as a consequence of the rotational speeds present during operation. Especially for rotors of permanently excited synchronous motors, the laminate design contains several regions with thin bridges, for example, between the permanent magnets. This is aimed at to reduce magnetic flux leakages. Therefore, proper dimensioning of these areas can significantly influence the attainable torque, power density, and efficiency of the electric drivetrain [1,2,3].
The conventional processing of electrical sheets up to the finished coil takes place in multiple hot and cold rolling steps followed by final annealing. As a result of the latter, recrystallization and controlled grain growth typically lead to a stress-relieved microstructure with a low dislocation density. The subsequent processing of the coils into rotor stacks influences the mechanical and magnetic properties [4]. To comply with the requirements for high production volumes in the automotive industry, shear cutting is the most used manufacturing process. However, the plastic deformation and residual stresses introduced by shear cutting negatively affect the mechanical and magnetic properties. Hereby, the fatigue strength is degraded compared to a defect-free edge condition because of the deteriorated edge roughness. Depending on the shear parameters used, the fatigue strength can decrease by up to 40% in relation to a defect-free edge condition [5,6]. Such influence on fatigue life must be considered in the design of the rotor geometry and thus leads to thicker bridges to avoid preliminary failure. Thus, improving the fatigue behavior of electrical steel sheets can help to enhance the overall motor properties [2].
For steel sheets in general, it is known that a heat treatment after the manufacturing sequence can reduce the damage introduced during production in the form of dislocations and residual stresses. As a result, the initial magnetic properties are restored in large proportions. Consequently, performing a heat treatment is already an important measure to reduce magnetic losses in the stator [7,8,9].
Microstructural changes often tend to cause opposing effects on the mechanical properties in comparison to magnetic properties. Nevertheless, a subsequent heat treatment may also positively affect the mechanical fatigue strength due to the reduction in the strain-hardened edge zone, including regions with high tensile residual stresses [10,11]. Therefore, this study aims to investigate the influence of a subsequent heat treatment on the fatigue properties of non-oriented electrical steel. In addition, it should be emphasized that the tests are performed as a function of six different shear-cutting parameters to enhance the overall understanding of influencing factors.

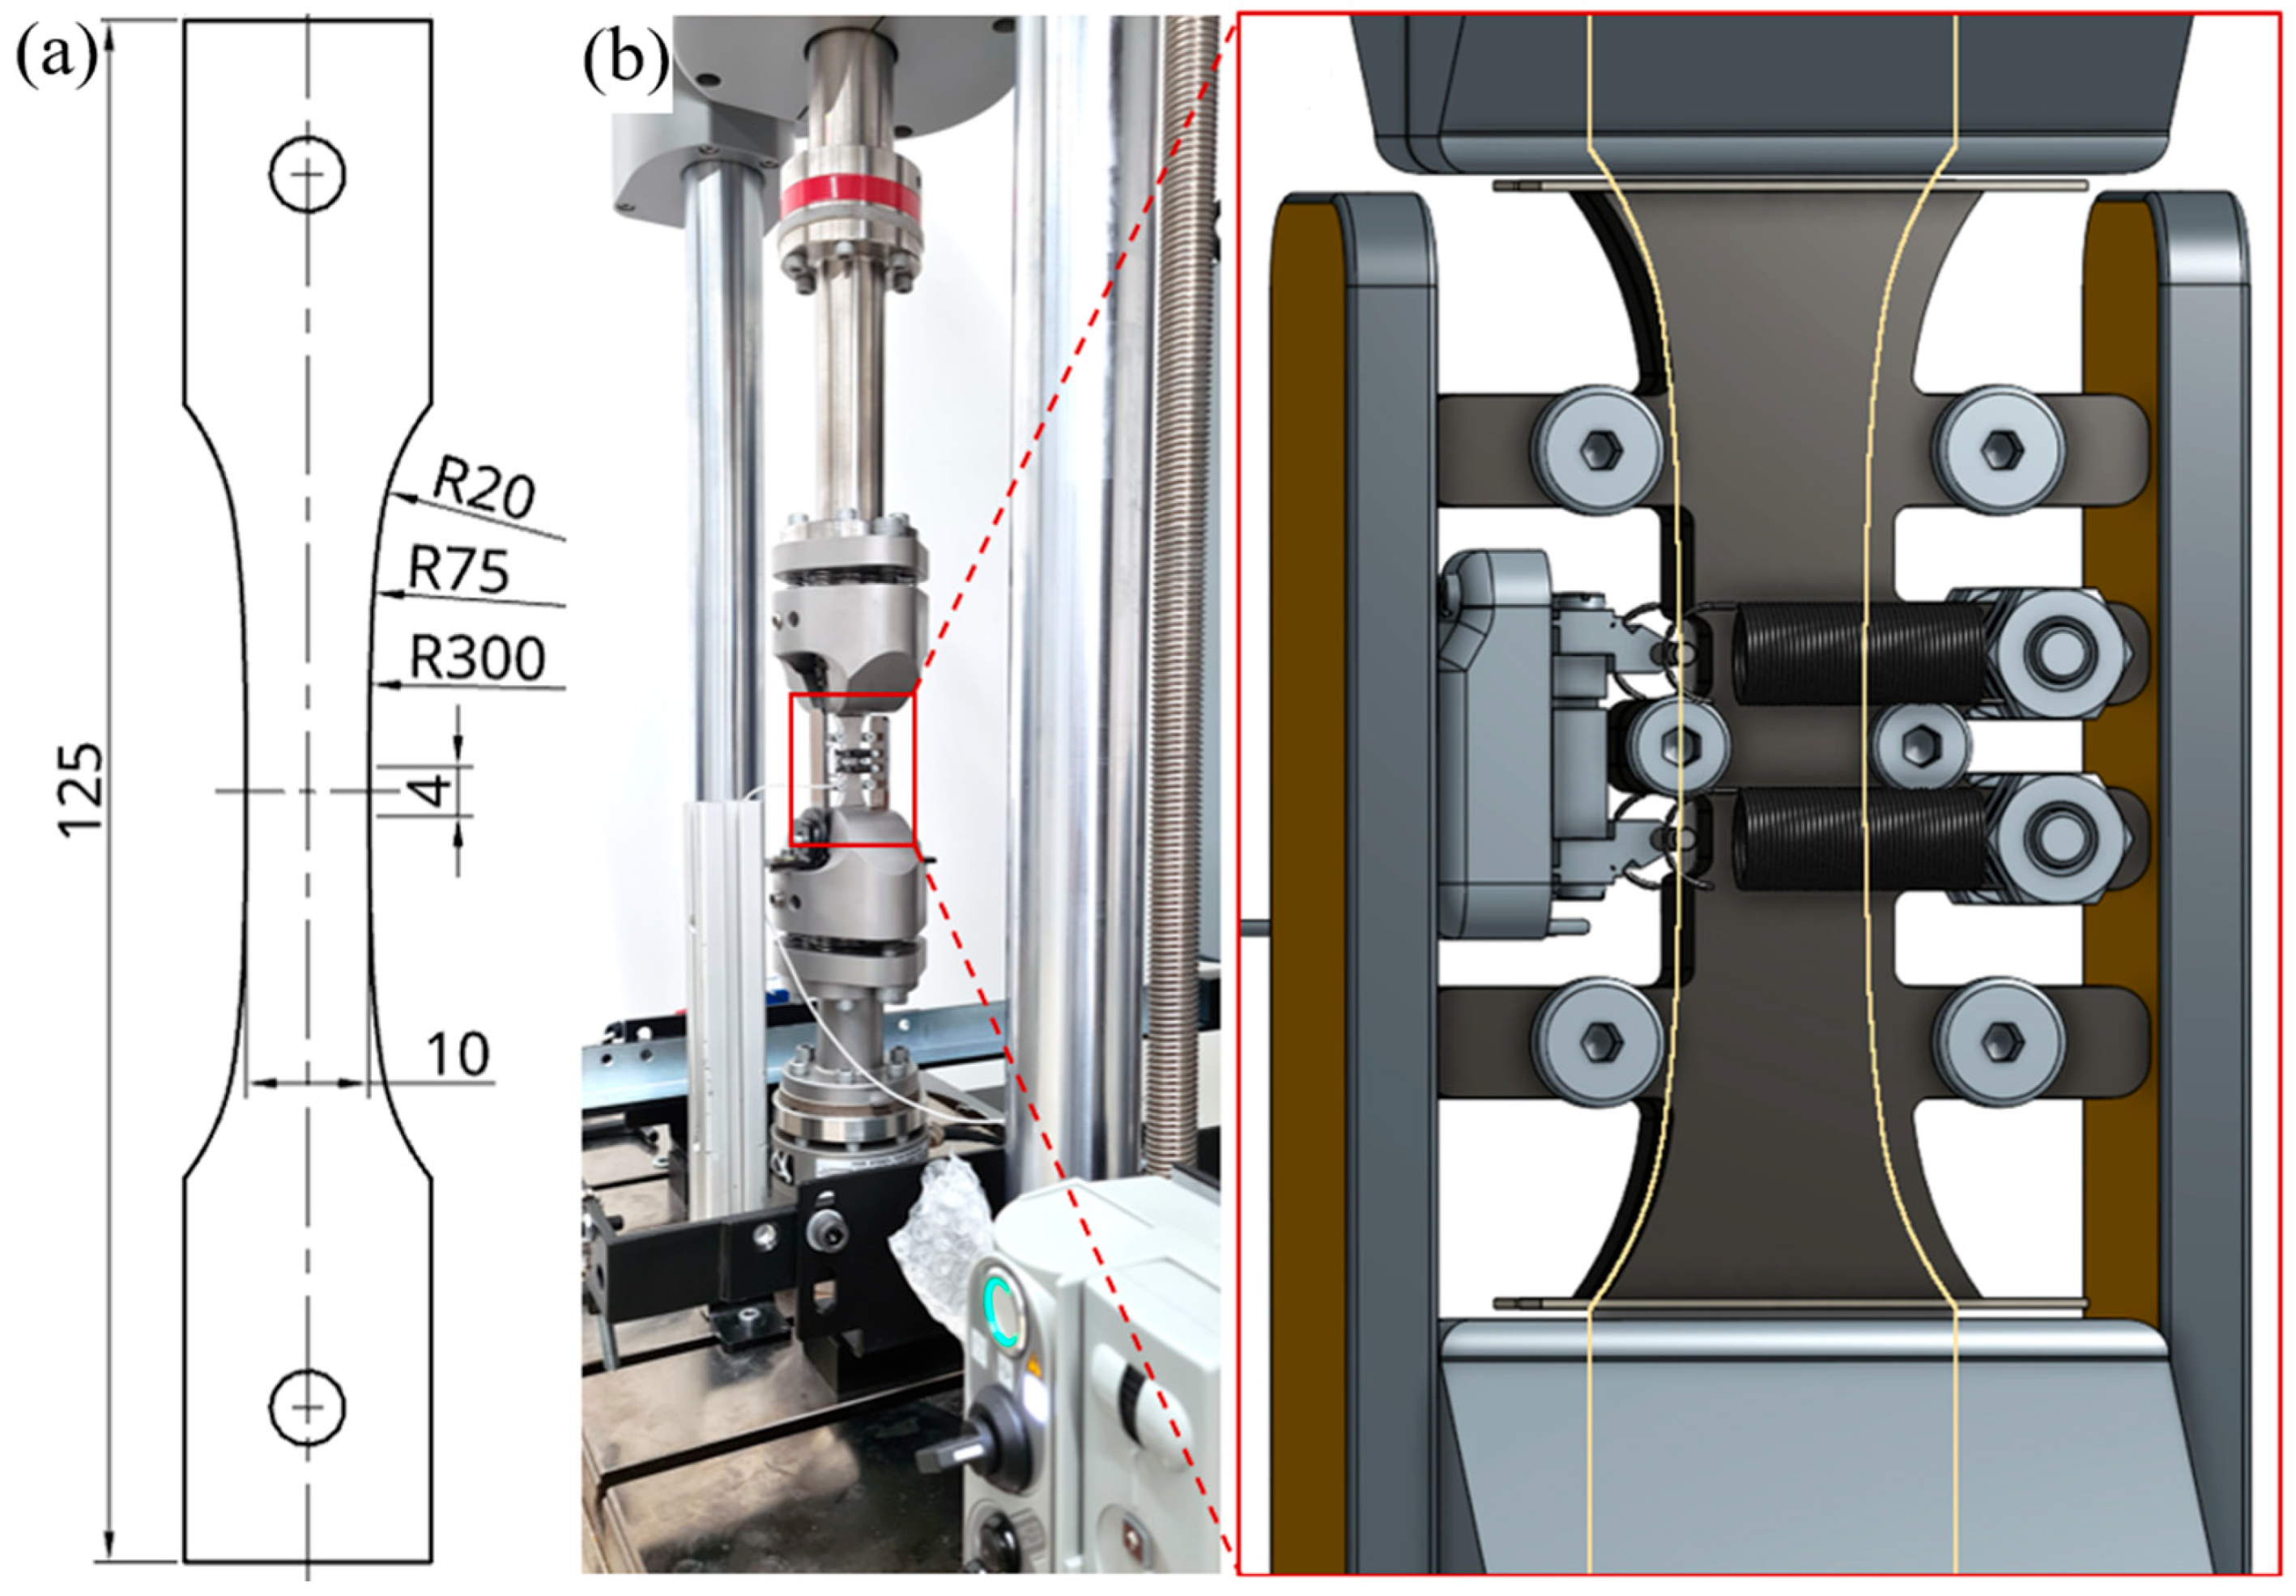
2. Materials and Methods

The studied material is a fully processed non-oriented electrical steel sheet with a nominal thickness of 270 µm. The chemical composition and monotonic properties are given in Table 1 and Table 2, respectively.
The stress–strain curve from the tensile test is given in Figure 1. The material shows a single and slightly pronounced yield drop of approximately 5 MPa.
Fatigue specimens are processed from the delivered electrical steel sheets by shear cutting with the punching machine BSTA 1600-181 (Bruderer AG, Frasnacht, Switzerland) with a cutting speed of 100 strokes per minute. Three cutting clearances (15 µm, 35 µm, 50 µm), each with two different tool wear states (sharp and worn), are selected. In total, six different shear-cutting parameter sets are compared in this study.
For pure iron, the recrystallization temperature is about 500 °C to 600 °C. However, for shear-cut electrical steel, significant changes in the magnetic properties are not detected until temperatures of at least 650 °C. Therefore, 700 °C to 750 °C is typically used [7,12]. In this study, all heat treatments are performed at 700 °C and under vacuum with the furnace Nabertherm RO 50-250/13 (Lilienthal, Germany). Heating and cooling rates are selected according to standard DIN 10341. As an additional protective measure, samples are wrapped in thin foils made of X5CrNiTi17-10. Since other authors often refer to the term stress relief annealing (SRA), despite the high temperatures, the abbreviation is used for this study as well.
High cycle fatigue (HCF) tests are performed with the electric dynamic testing machine ElectroPuls E10000 (INSTRON, High Wycombe, UK) with an extensometer, EXA 10-0.5 (SANDNER-Messtechnik GmbH, Biebesheim am Rhein, Germany). Compared to other fatigue specimens, the axial alignment of these thin electrical sheets is essential. For this purpose, the alignment fixture AlignPRO from INSTRON is utilized. HCF tests are carried out under stress control with stress ratios of Rσ = 0.1, a frequency of 40 Hz, and different upper stresses ranging between 300 MPa and 520 MPa. Fatigue specimens with a gauge length of 4 mm and width of 10 mm are used; see Figure 2a. The gage-to-grip transition area consists of three matching radii to achieve a homogeneous stress state with a stress concentration factor Kt of approximately 1.0. An anti-buckling restraint with Polytetrafluoroethylene (PTFE) coating is used to avoid buckling; see Figure 2b.
The used specimen geometry and setup features similarities to the test standard SEP 1240, which is intended for flat steels. The testing conditions used are consistent with the description in another publication [13].
Measurements of residual stresses are carried out in the rolling direction by using X-ray Diffraction System Empyrean 2 (PANalytical B.V., Almelo, The Netherlands) with a Cobalt cathode and by applying the sin2Ψ method.
Hardness data are acquired with a maximum load of 10 mN by Triboindenter TI Premier, equipped with a diamond Berkovich Tip TI-0039 (Bruker, Eden Prairie, MN, USA). The tip area function is calculated by indenting fused silica. All data are analyzed using the Oliver–Pharr method [14]. The measurement pattern of the cross-section at the cut edges can be observed in Figure 3b. In the region close to the edge, the distance between indentations is 10 µm, whereas further inwards, 20 µm is selected. The Electron Backscatter Diffraction (EBSD) data are acquired by using the scanning electron microscope LEO 1430 (Carl Zeiss AG, Oberkochen, Germany) with a Bruker e- Flash HR+ detector, tungsten cathode, sample tilt of 70°, and accelerating voltage of 20 kV. Furthermore, EBSD data are analyzed utilizing ATEX Software Version 4.14 [15]. The preparation for nanoindentation and EBSD imaging is performed by polishing with conventional metallographic techniques, followed by 12 h of vibration polishing with water-free suspension Etosil (QATM, Mammelzen, Germany).

3. Results

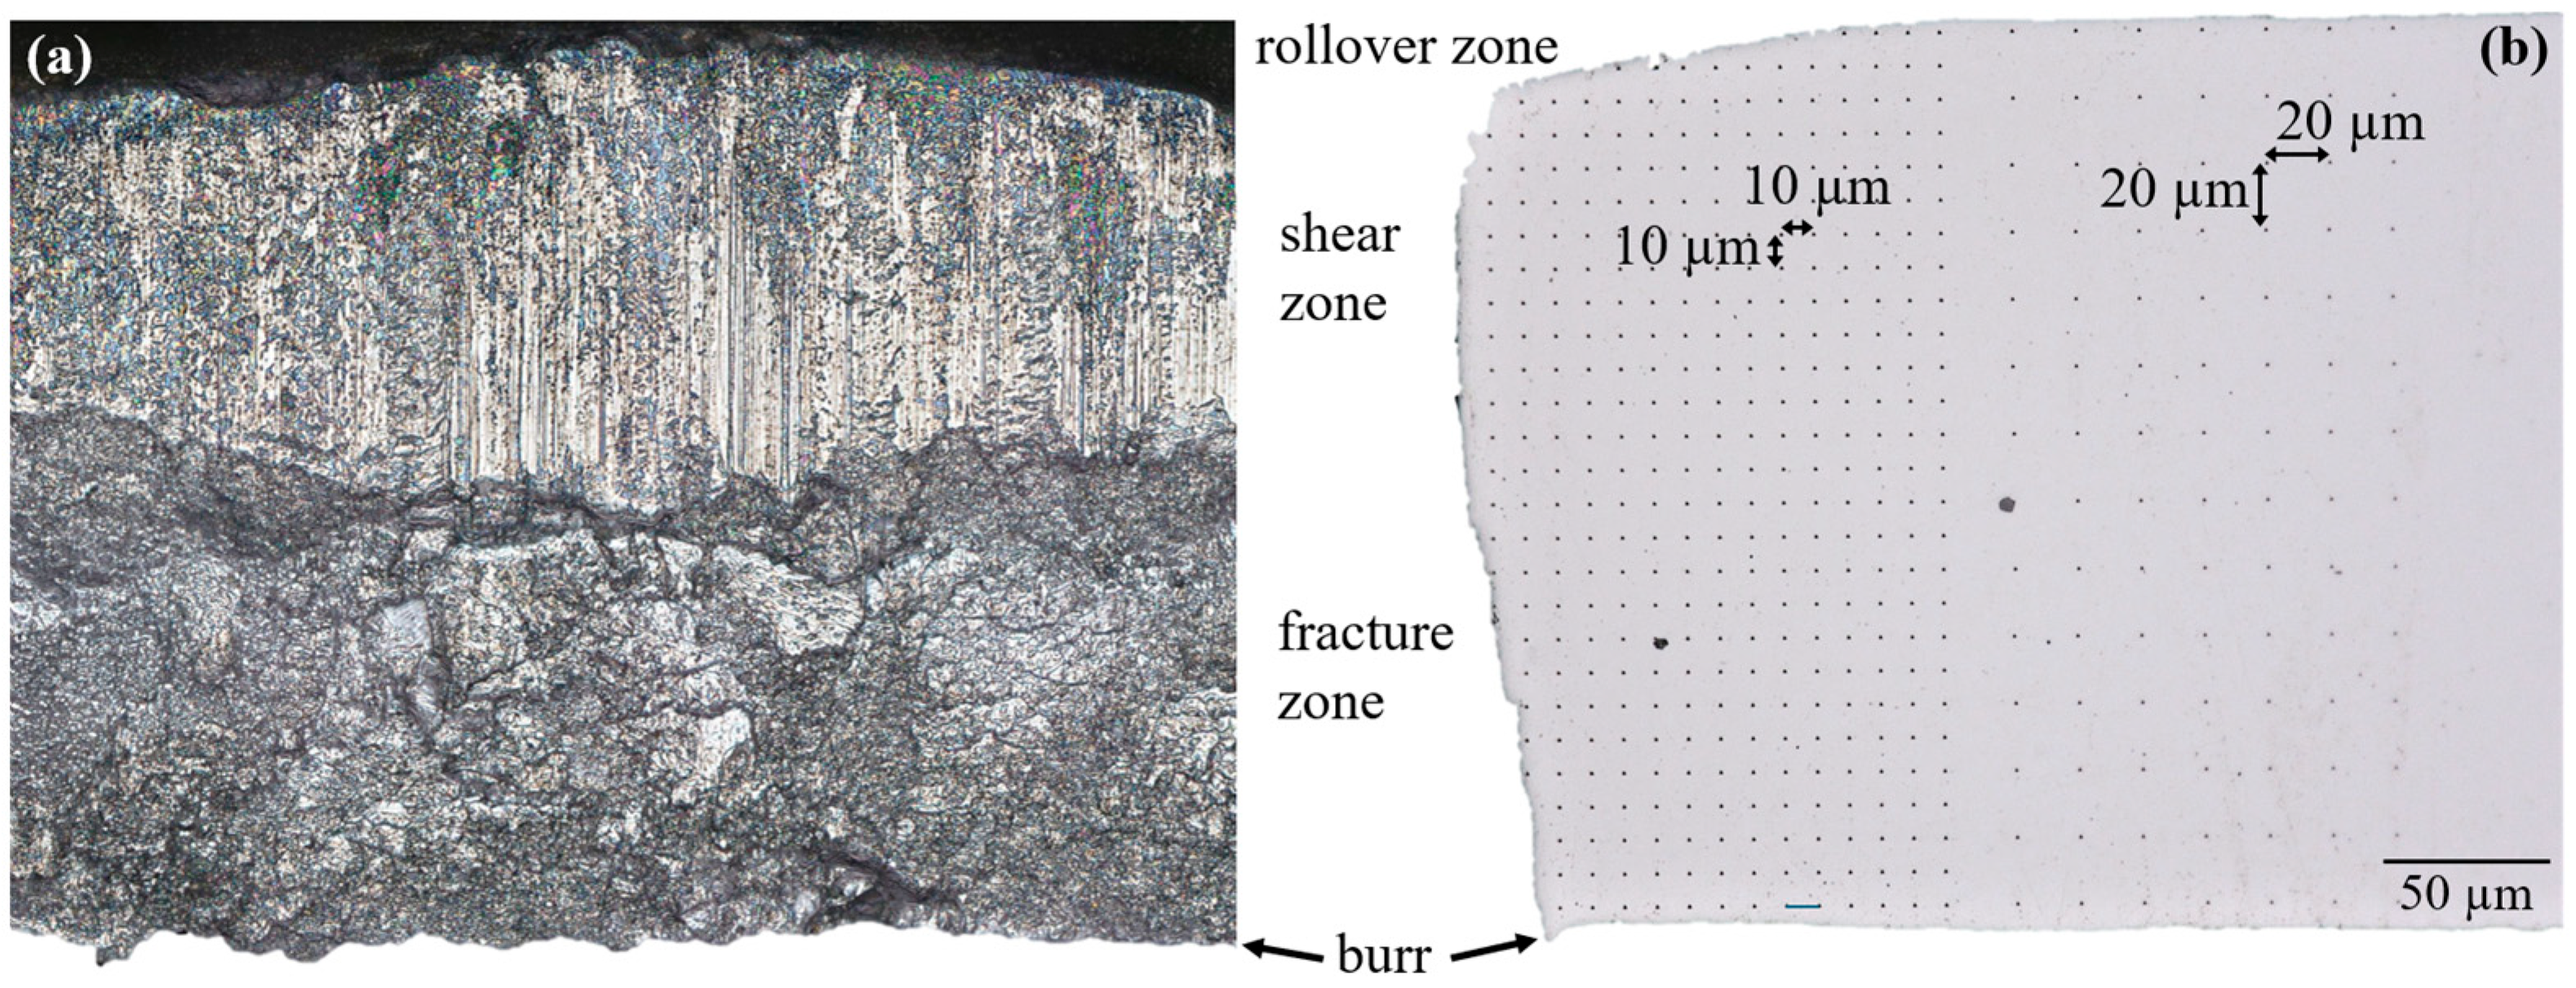
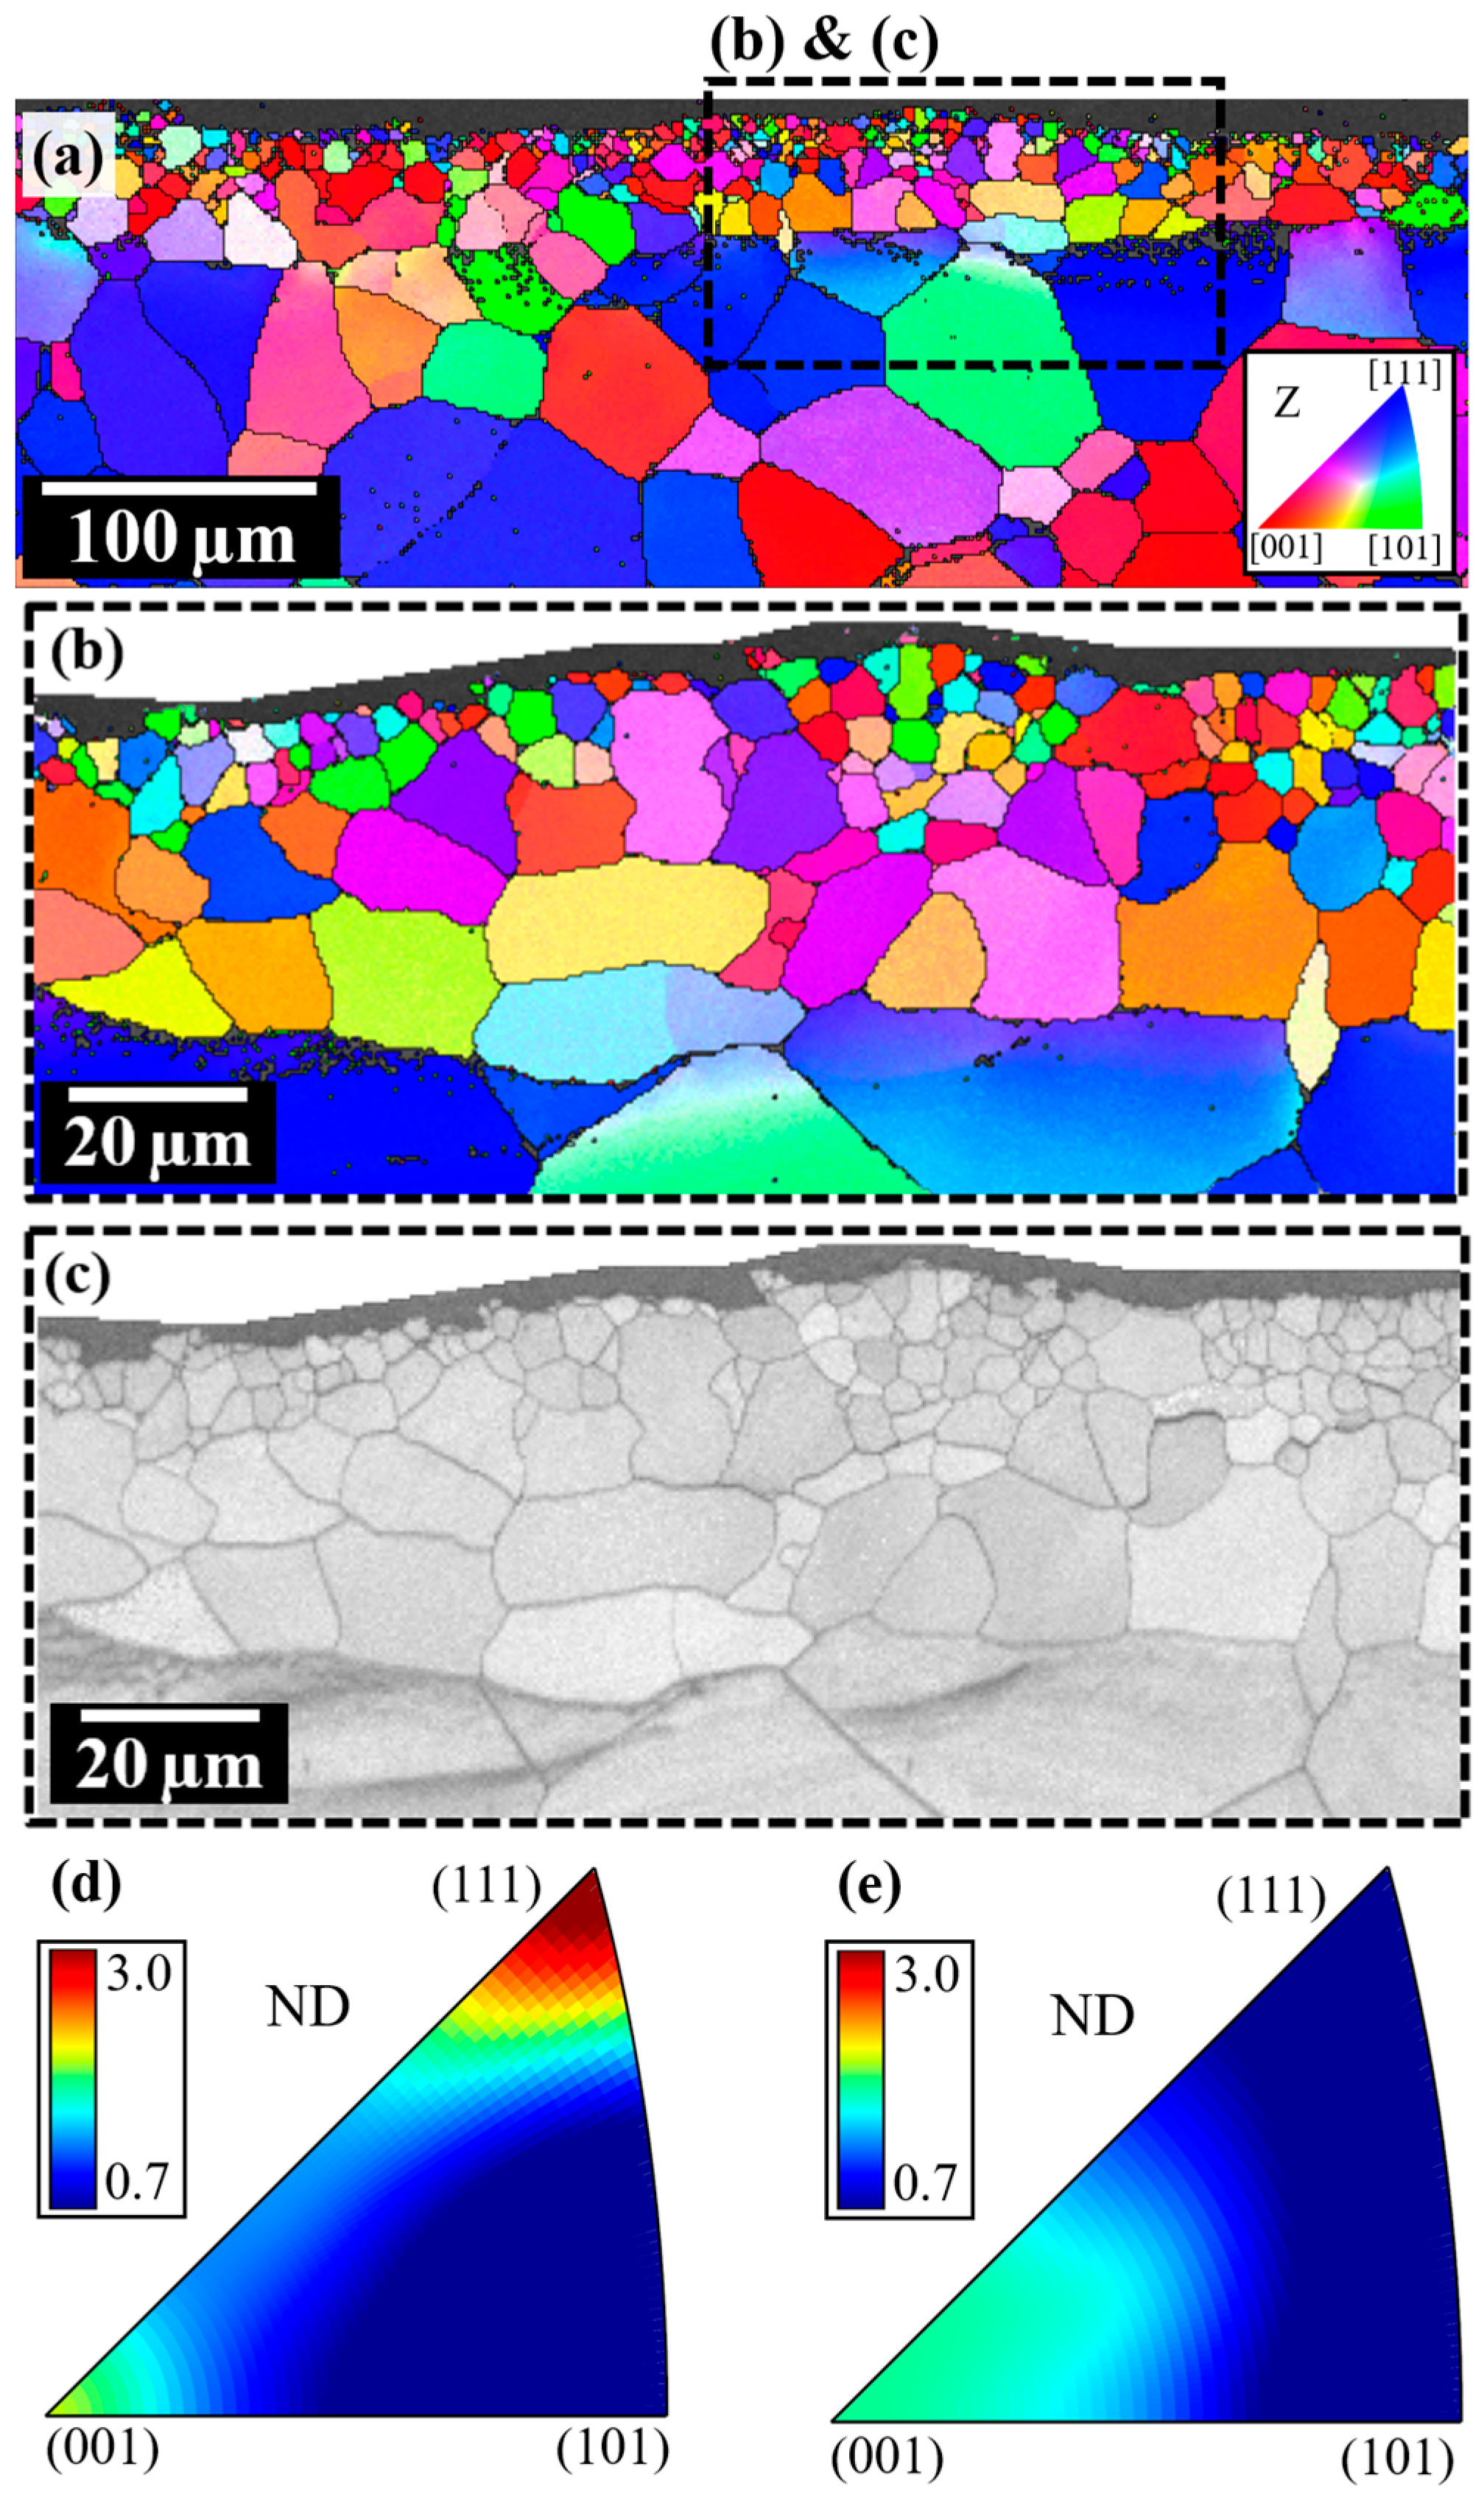
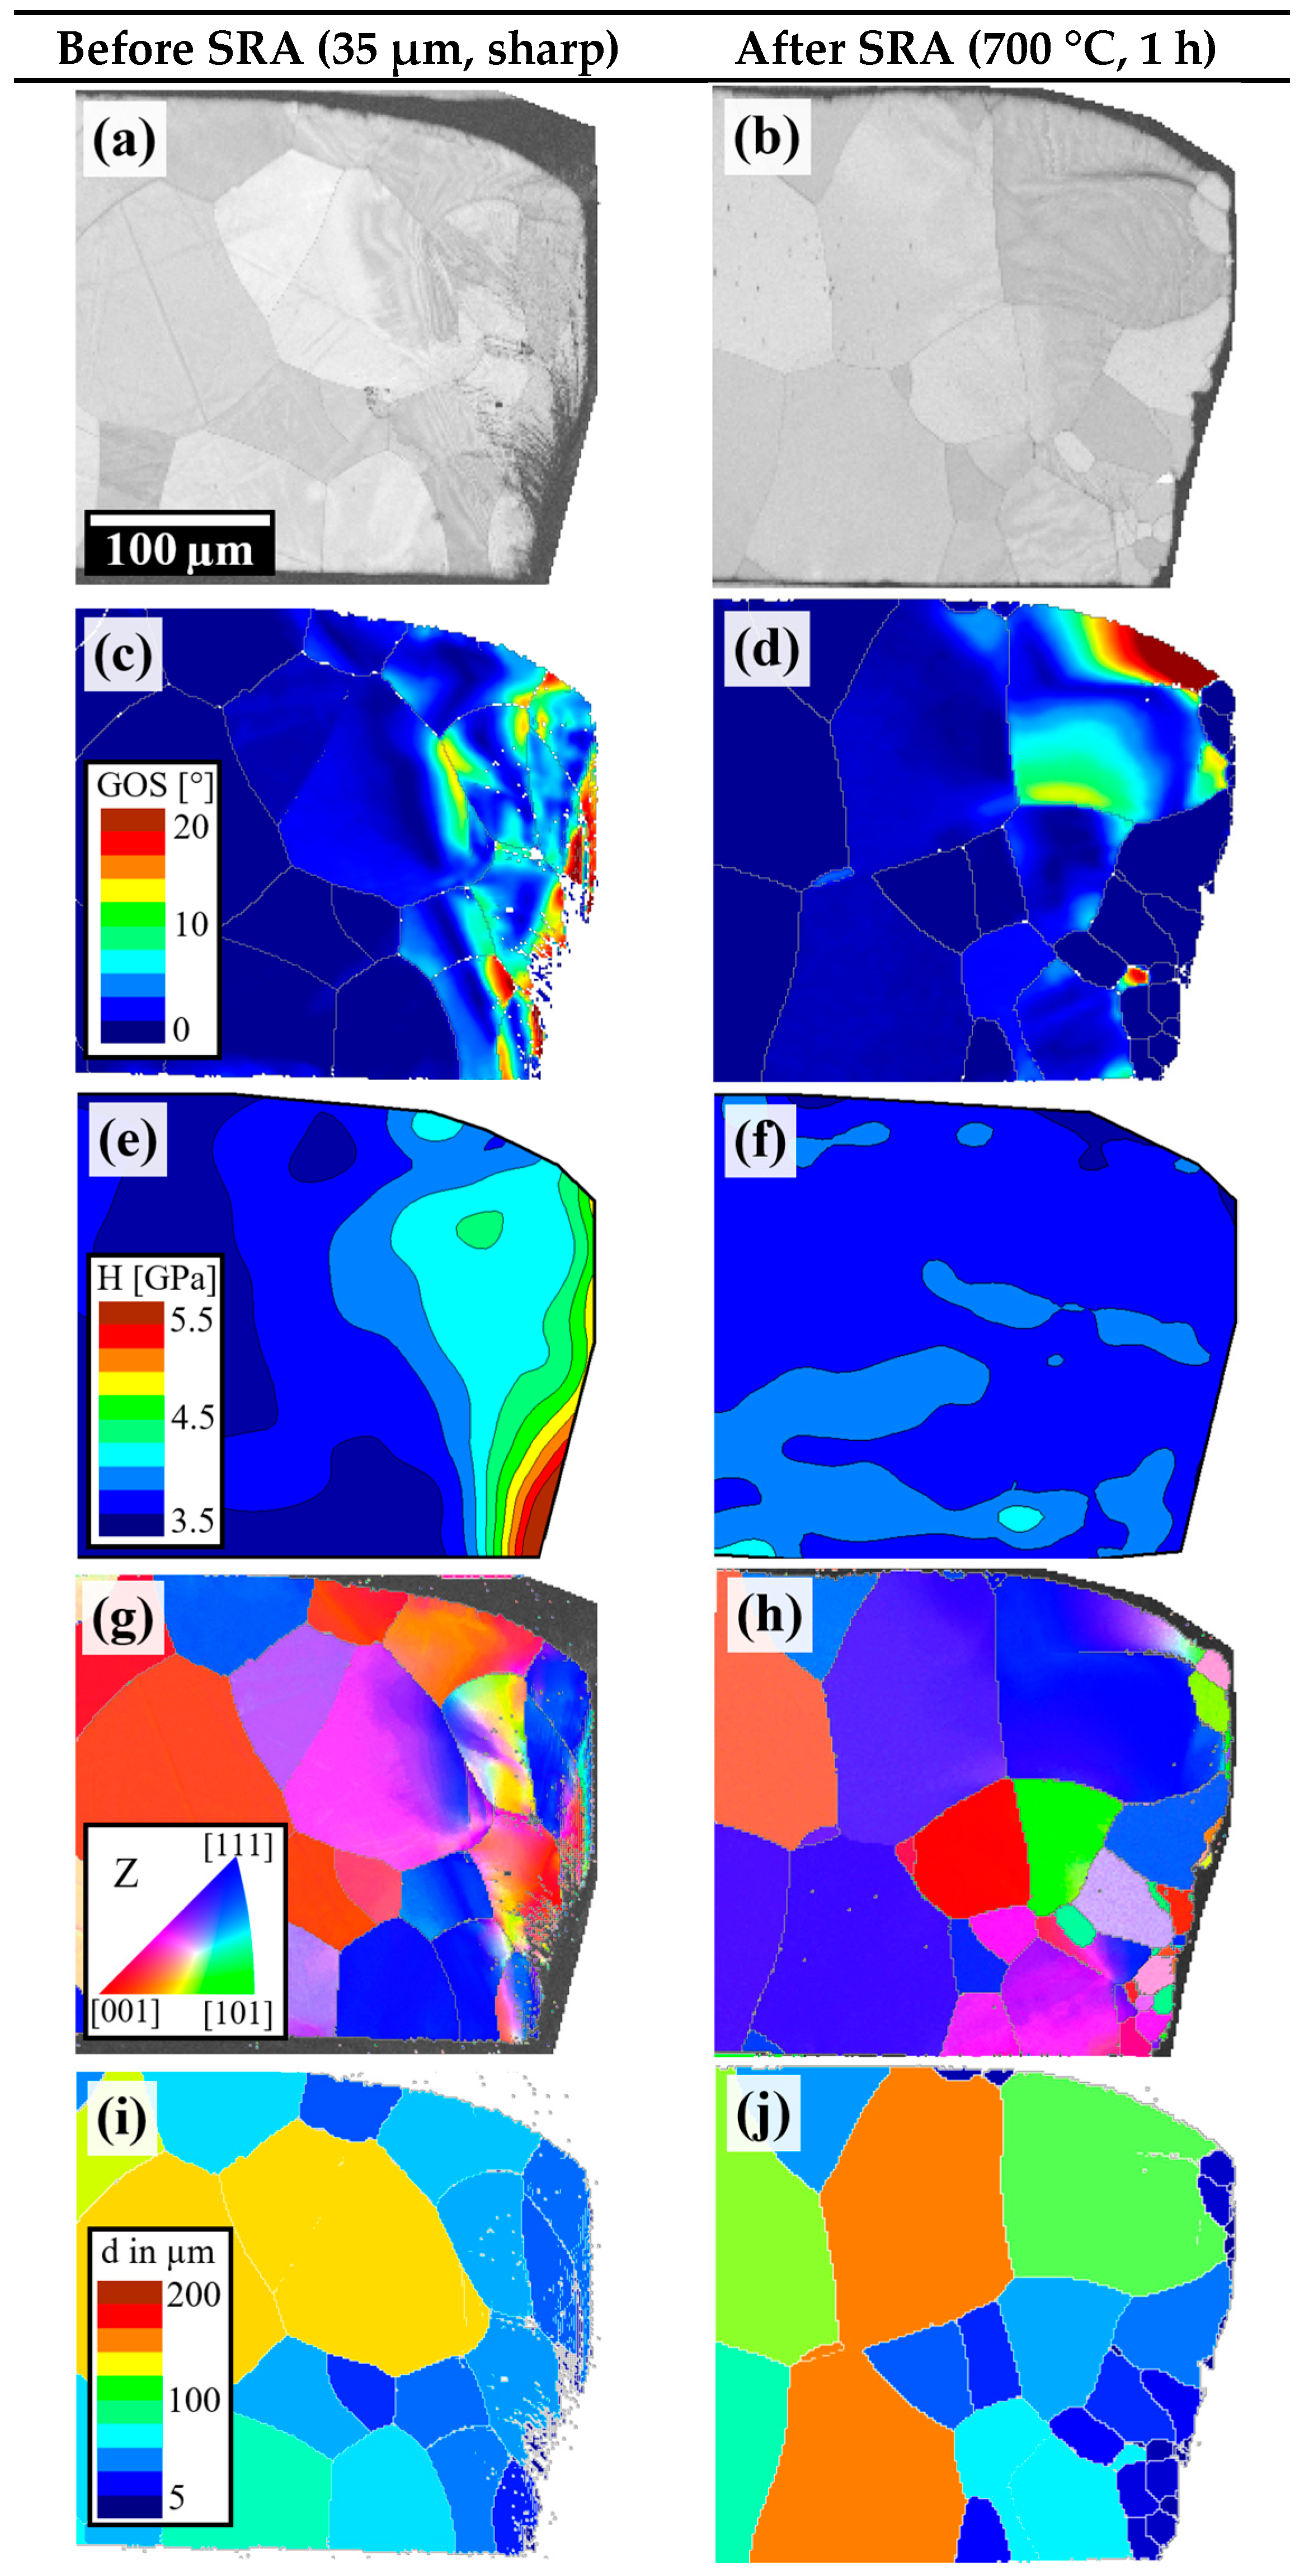
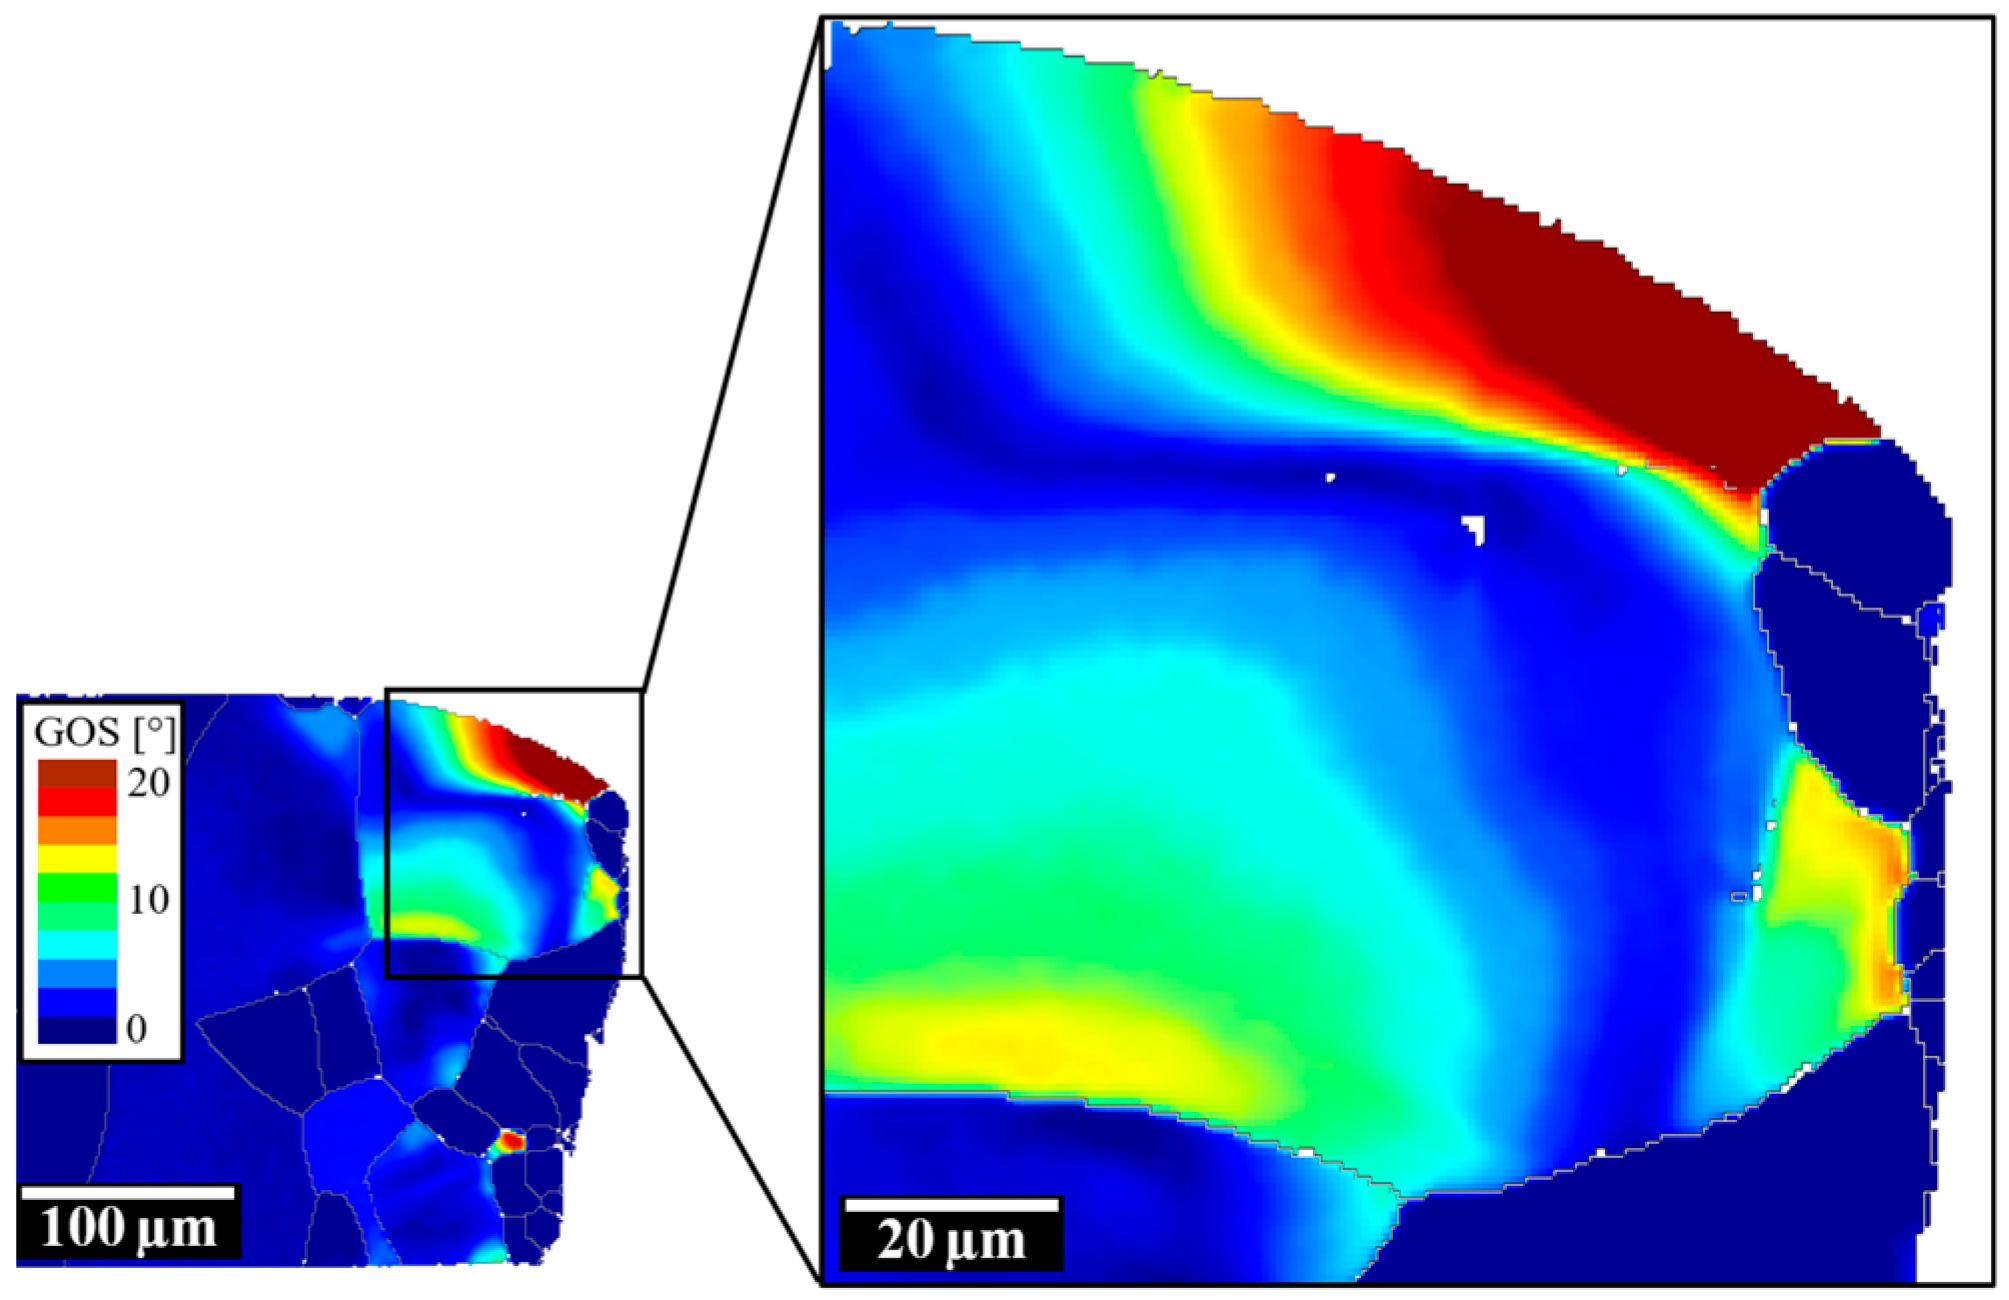
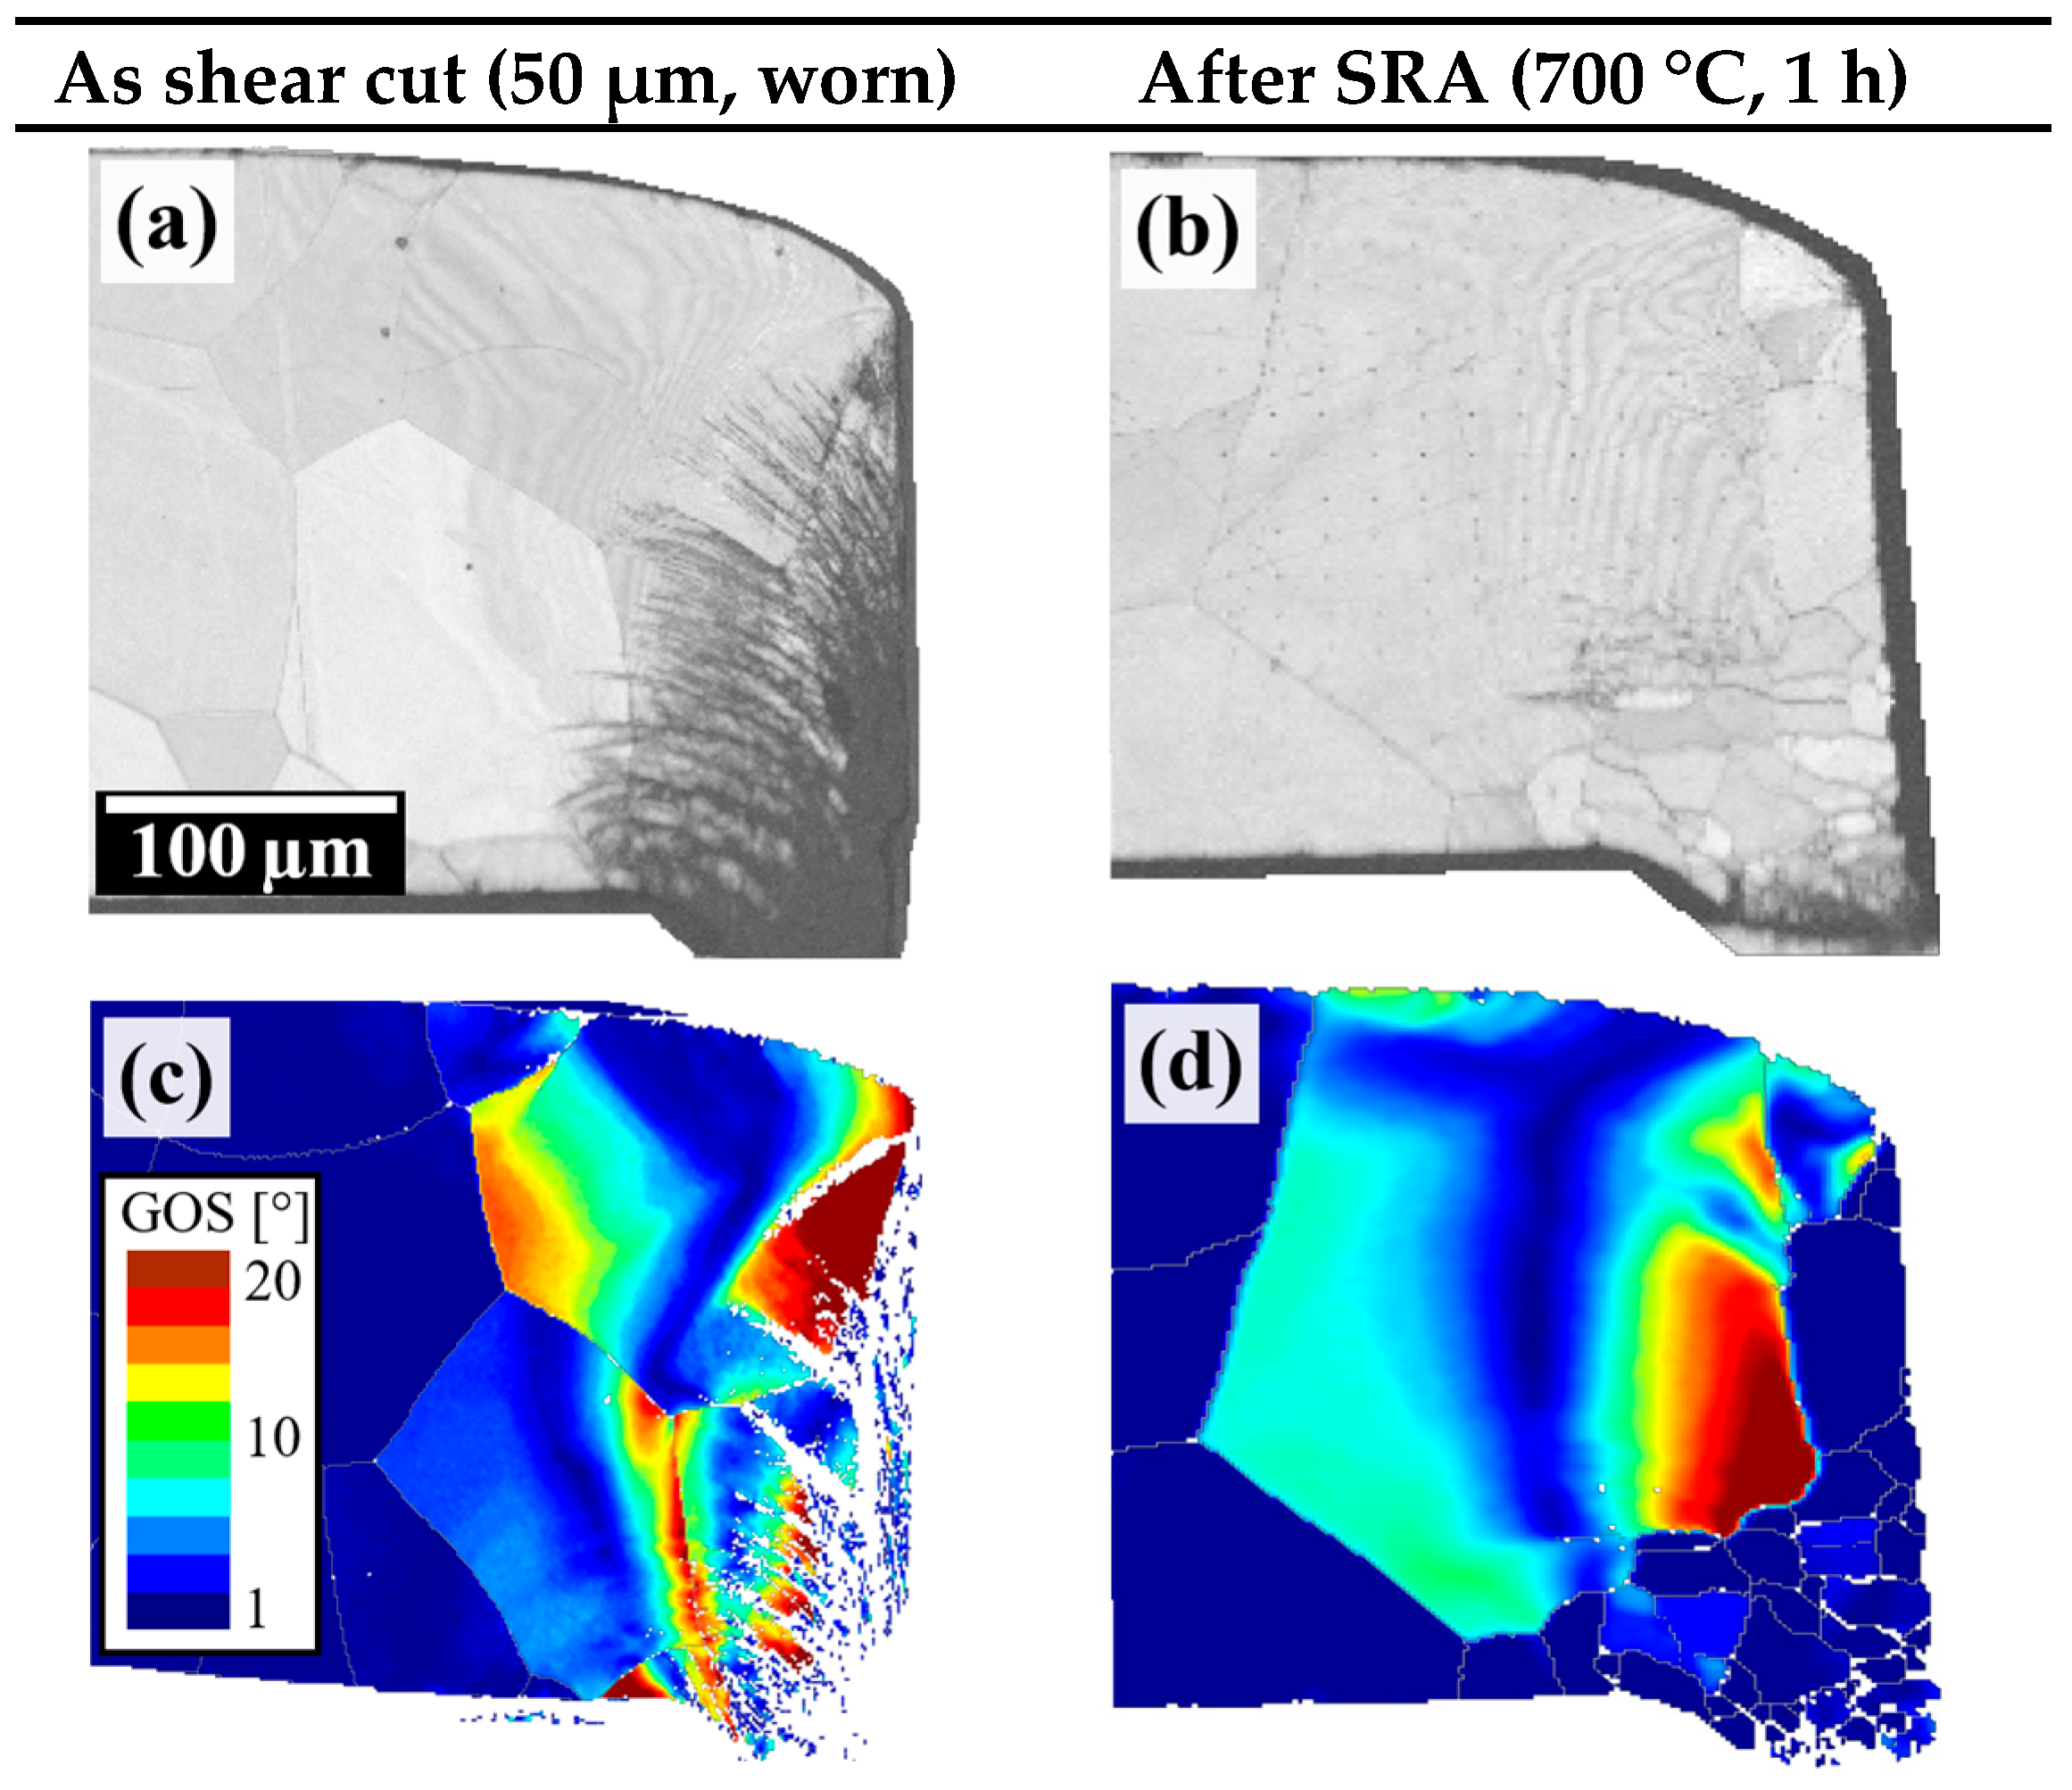
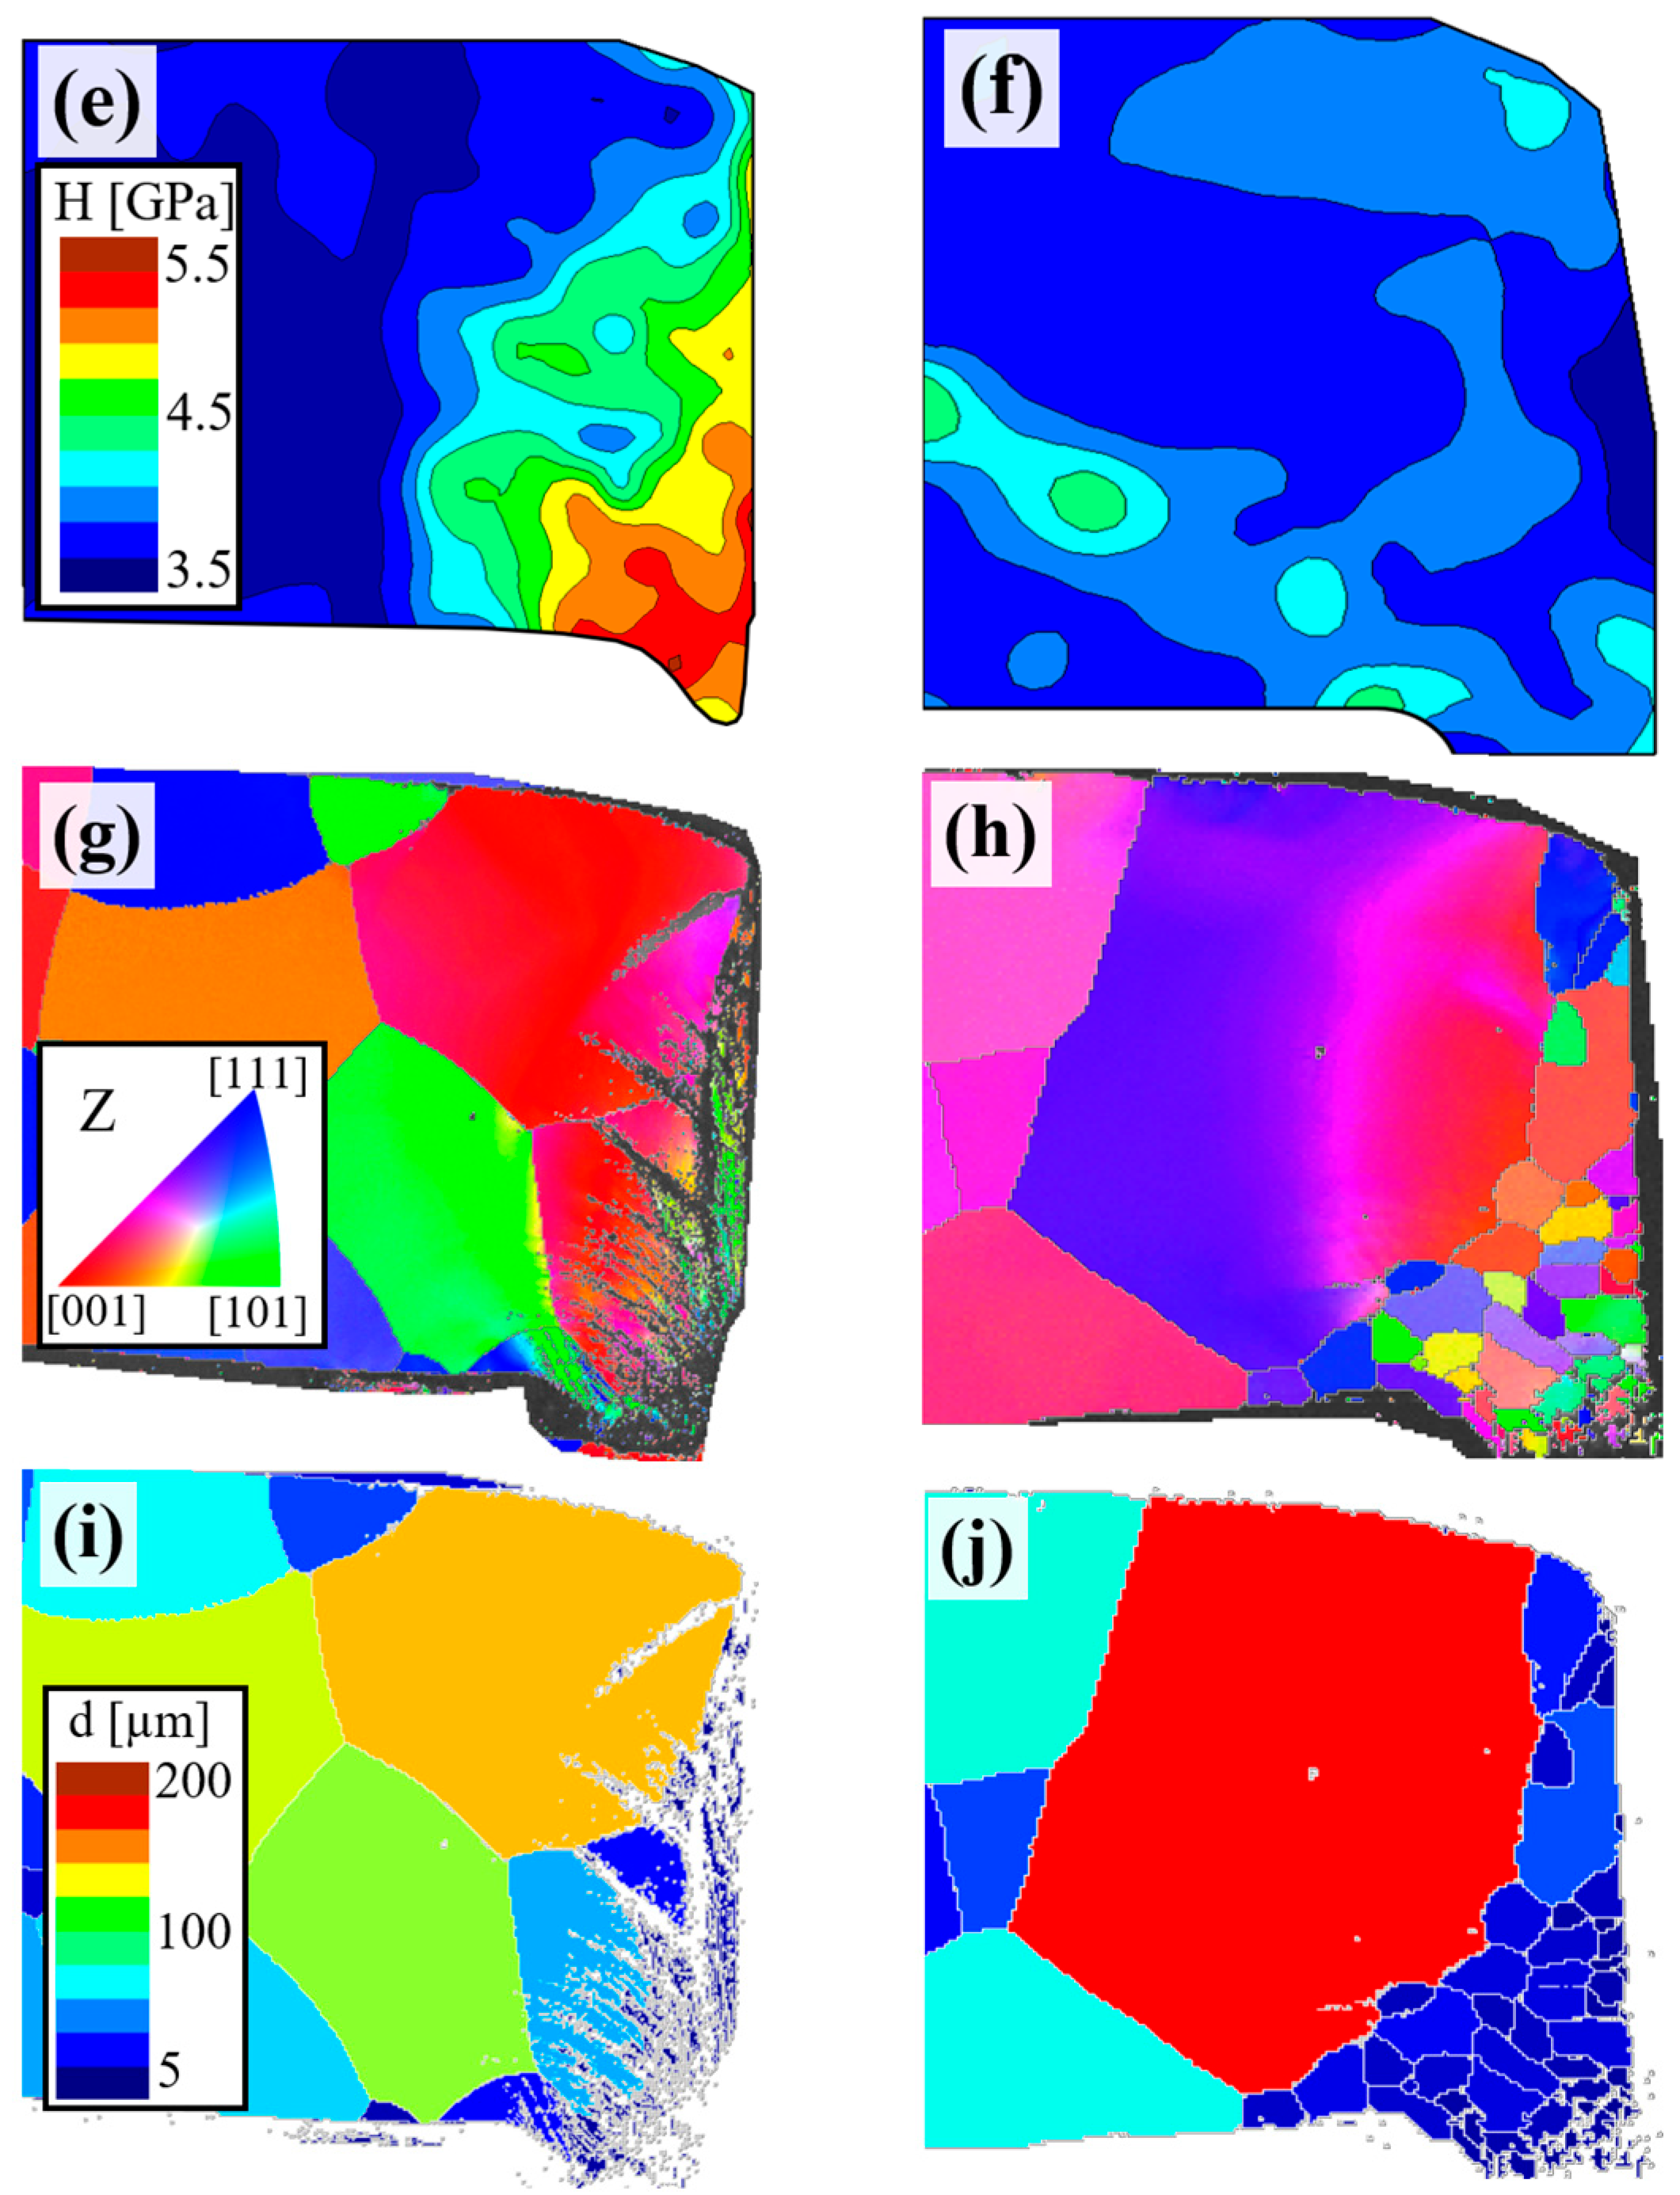
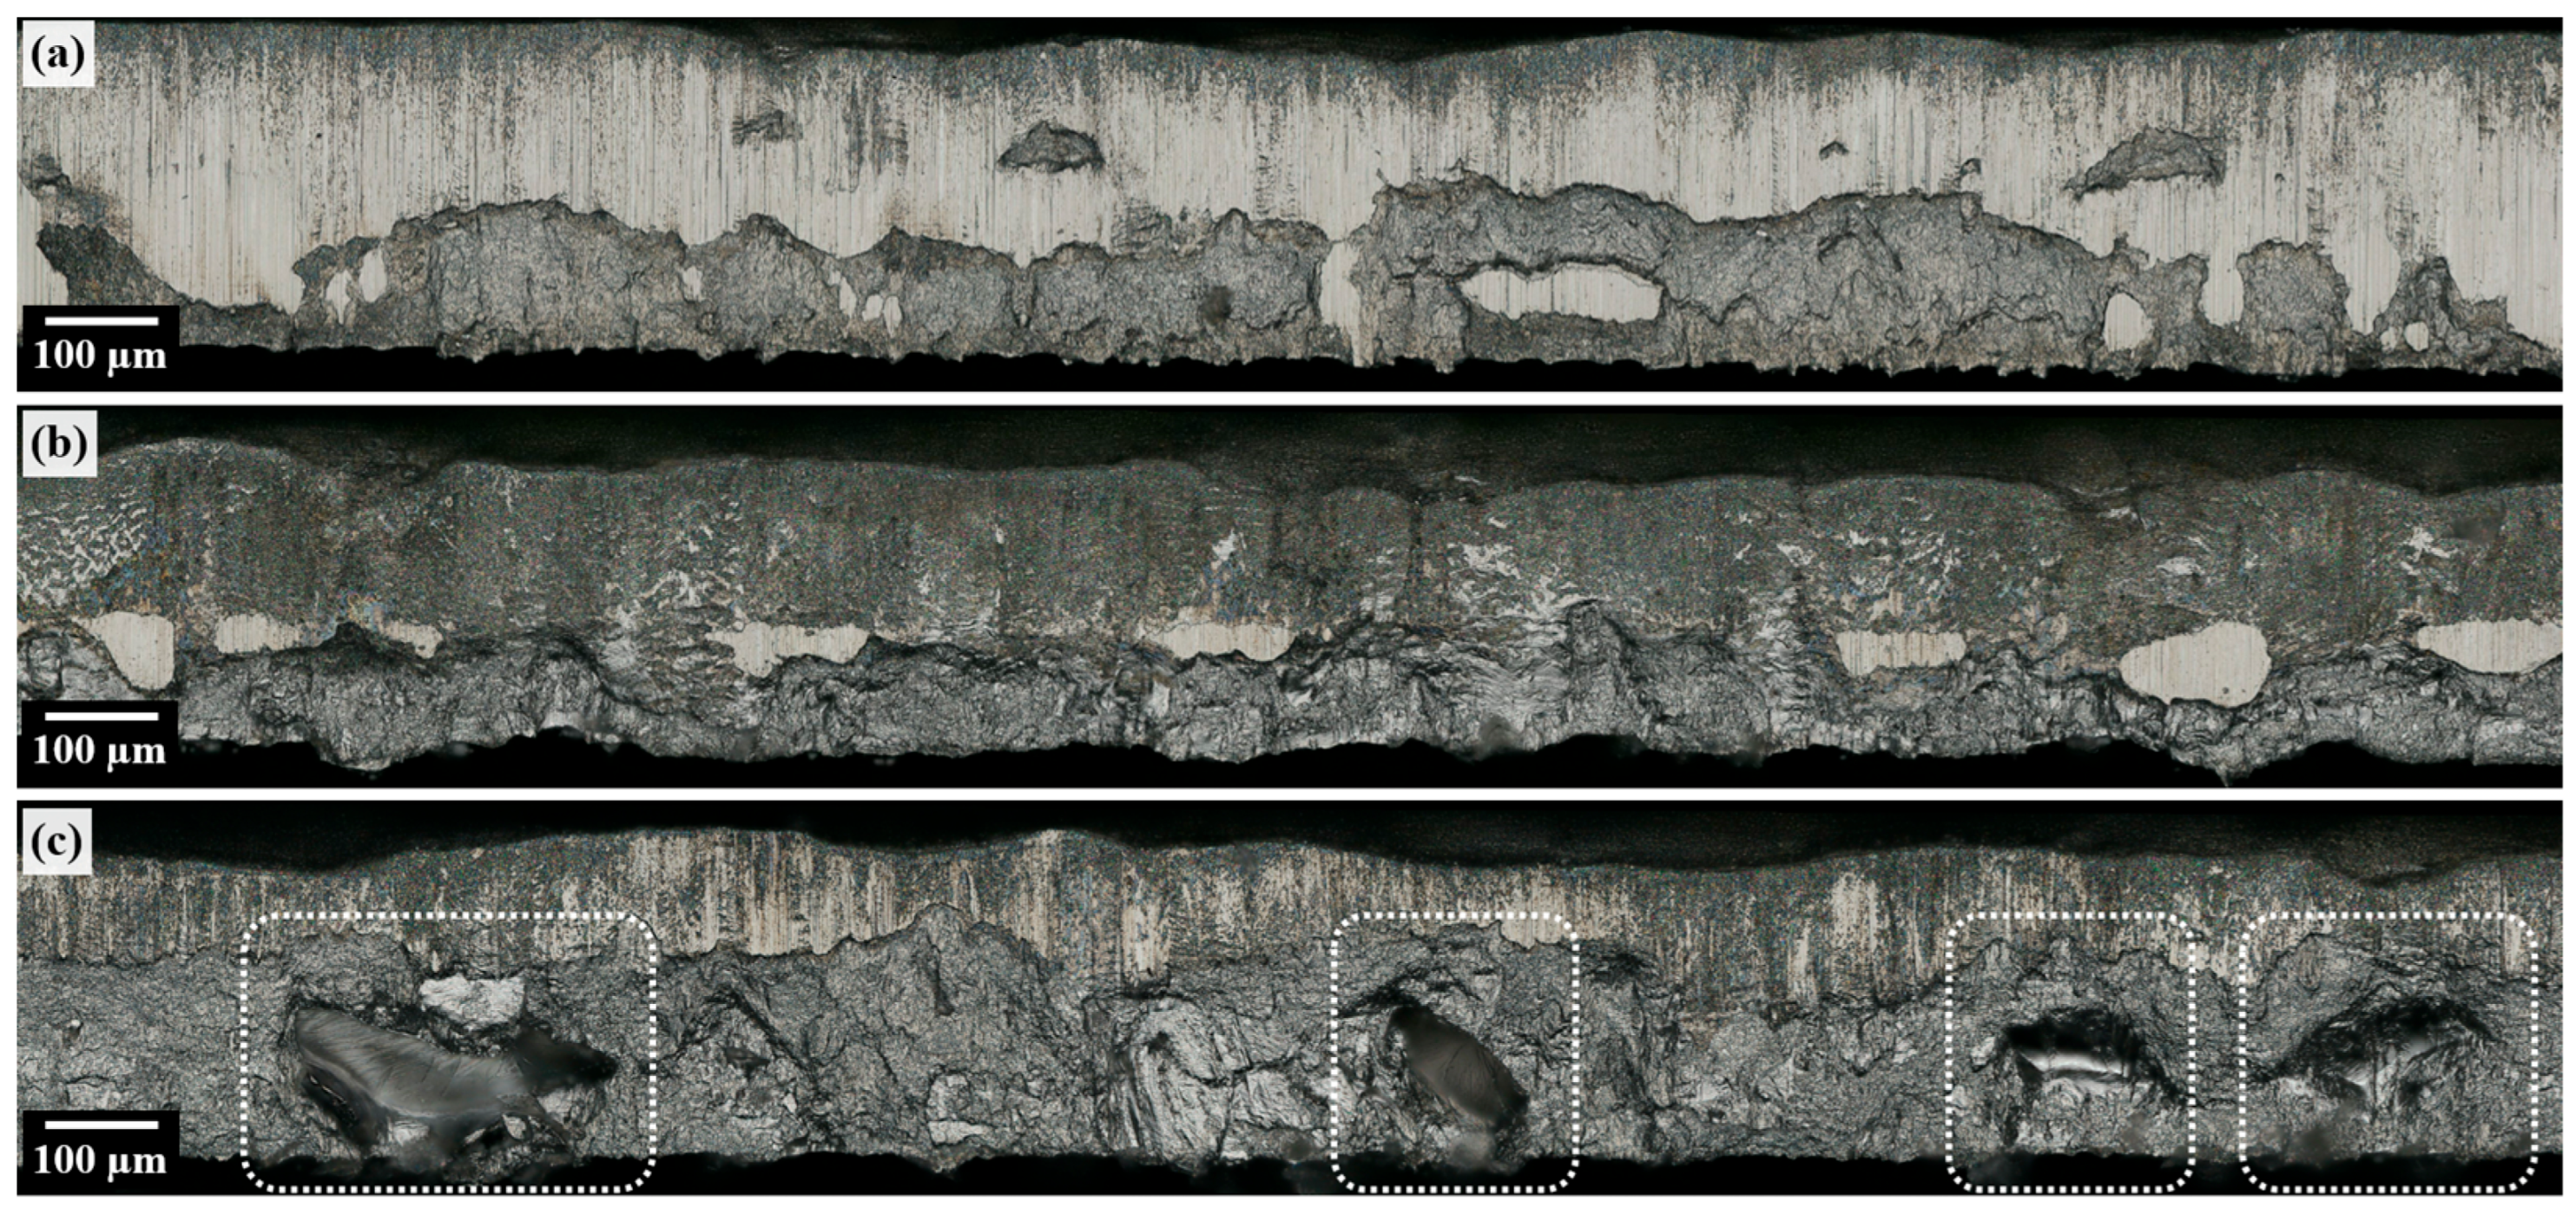
3.1. Influence of SRA on Microstructure

As a result of the heat treatment, specific changes in the microstructure occur at the shear-cut edges. This subsection will show these changes in the microstructure. More detailed information on initially present characteristics in the shear-cut condition is provided in a separate publication [5]. Figure 4 presents micrographs of the recrystallized edge region as a cross-section taken within the sheet plane. A large portion of the induced damage in the near-surface region is removed by the heat treatment at 700 °C. This is a consequence of the recovery processes, in particular local recrystallization, that take place. The newly generated microstructure contains a small grain size and, according to the EBSD image quality map in Figure 4c, does not exhibit any lattice distortions (corresponding to regions with a darker contrast within a grain) in comparison to the underlying base microstructure.
In contrast to the initial state (Figure 4d), the orientations of the newly formed grains at the edges during recrystallization (Figure 4e) do not exhibit a pronounced rolling texture. Instead, a regular distribution of the grains is apparent. In this specific instance, the edge region extends over a depth of approximately 50 µm and the average grain diameter of the newly formed microstructure is less than 20 µm within the area of the shear zone. The smallest grains with sizes of less than 5 µm are observed near the cut surface. Figure 5 characterizes the microstructure based on microsections taken perpendicular to the sheet plane before (left column) and after annealing (right column). Again, most of the strain-hardened regions with high dislocation density disappear due to the heat treatment. The pre-deformed areas at the cut edge are characterized by local recrystallization with newly formed grains that contain very few dislocations. The process is driven by the stored deformation energy of the high dislocation density due to shearing. As a result of SRA, the damaged microstructure that is introduced by shear cutting is largely removed.
The heat treatment causes the hardness to decrease back to the reference level of approximately 3.0 GPa. Furthermore, the shear bands formed during shear cutting mostly disappear. For all variants investigated, the residual stresses at the edges in the rolling direction range around 200 MPa; see Table 3.
After stress relief annealing, the residual stresses are reduced to a negligible level. As an example, for the shear-cutting parameter 35-S, the stresses are now 20 MPa. This results in an overall dislocation-poor and strain-relieved microstructure in the region close to the edge. Below the depleted surface, however, isolated areas with increased dislocation density and large-scale lattice distortions remain; see Figure 6. At such locations, the intensity of the plastic deformation or the associated dislocation density has not been sufficient to cause a complete degradation of the lattice distortions. This is also partly expressed in individual areas with slightly increased hardness values compared to the initial state.
Despite stress relief annealing, some lattice distortions remain in certain areas, particularly around the roll-over zone. Here, the dislocation density is too low to act as a driving force for new grain formation. Nevertheless, a decrease in hardness also occurred due to the recovery processes. In contrast, a fringe with a fine-grained microstructure is observed close to the surface of the shear-cut zone (vertical region). In relation to the shear-cutting parameters, slight differences are observed within the deformed area. Figure 7 shows an example of the highest cutting clearance tested (50 µm) in combination with a worn punching tool (abbreviation: 50-W). Here, the large-area shear bands are clearly visible. Consequently, hardening zones are more extensive, meaning that the recrystallization area is wider when heat treatment is subsequently carried out. However, areas with strong lattice distortions remain, as can be seen in the large grain in Figure 7.
The intensity of local recrystallization and recovery depends, among other things, on the degree of previous strain hardening. It is observed that depending on the shear-cutting parameters and the local characteristics of the cut edge zone, recrystallization depths of up to 150 µm occur. In the case of a worn tool, the recrystallization tends to be more extensive because the cutting process with a worn tool increases the size of the initial hardening zone. In contrast, a sharp cutting tool, in combination with a small cutting clearance, tends to result in a narrower recrystallization zone.

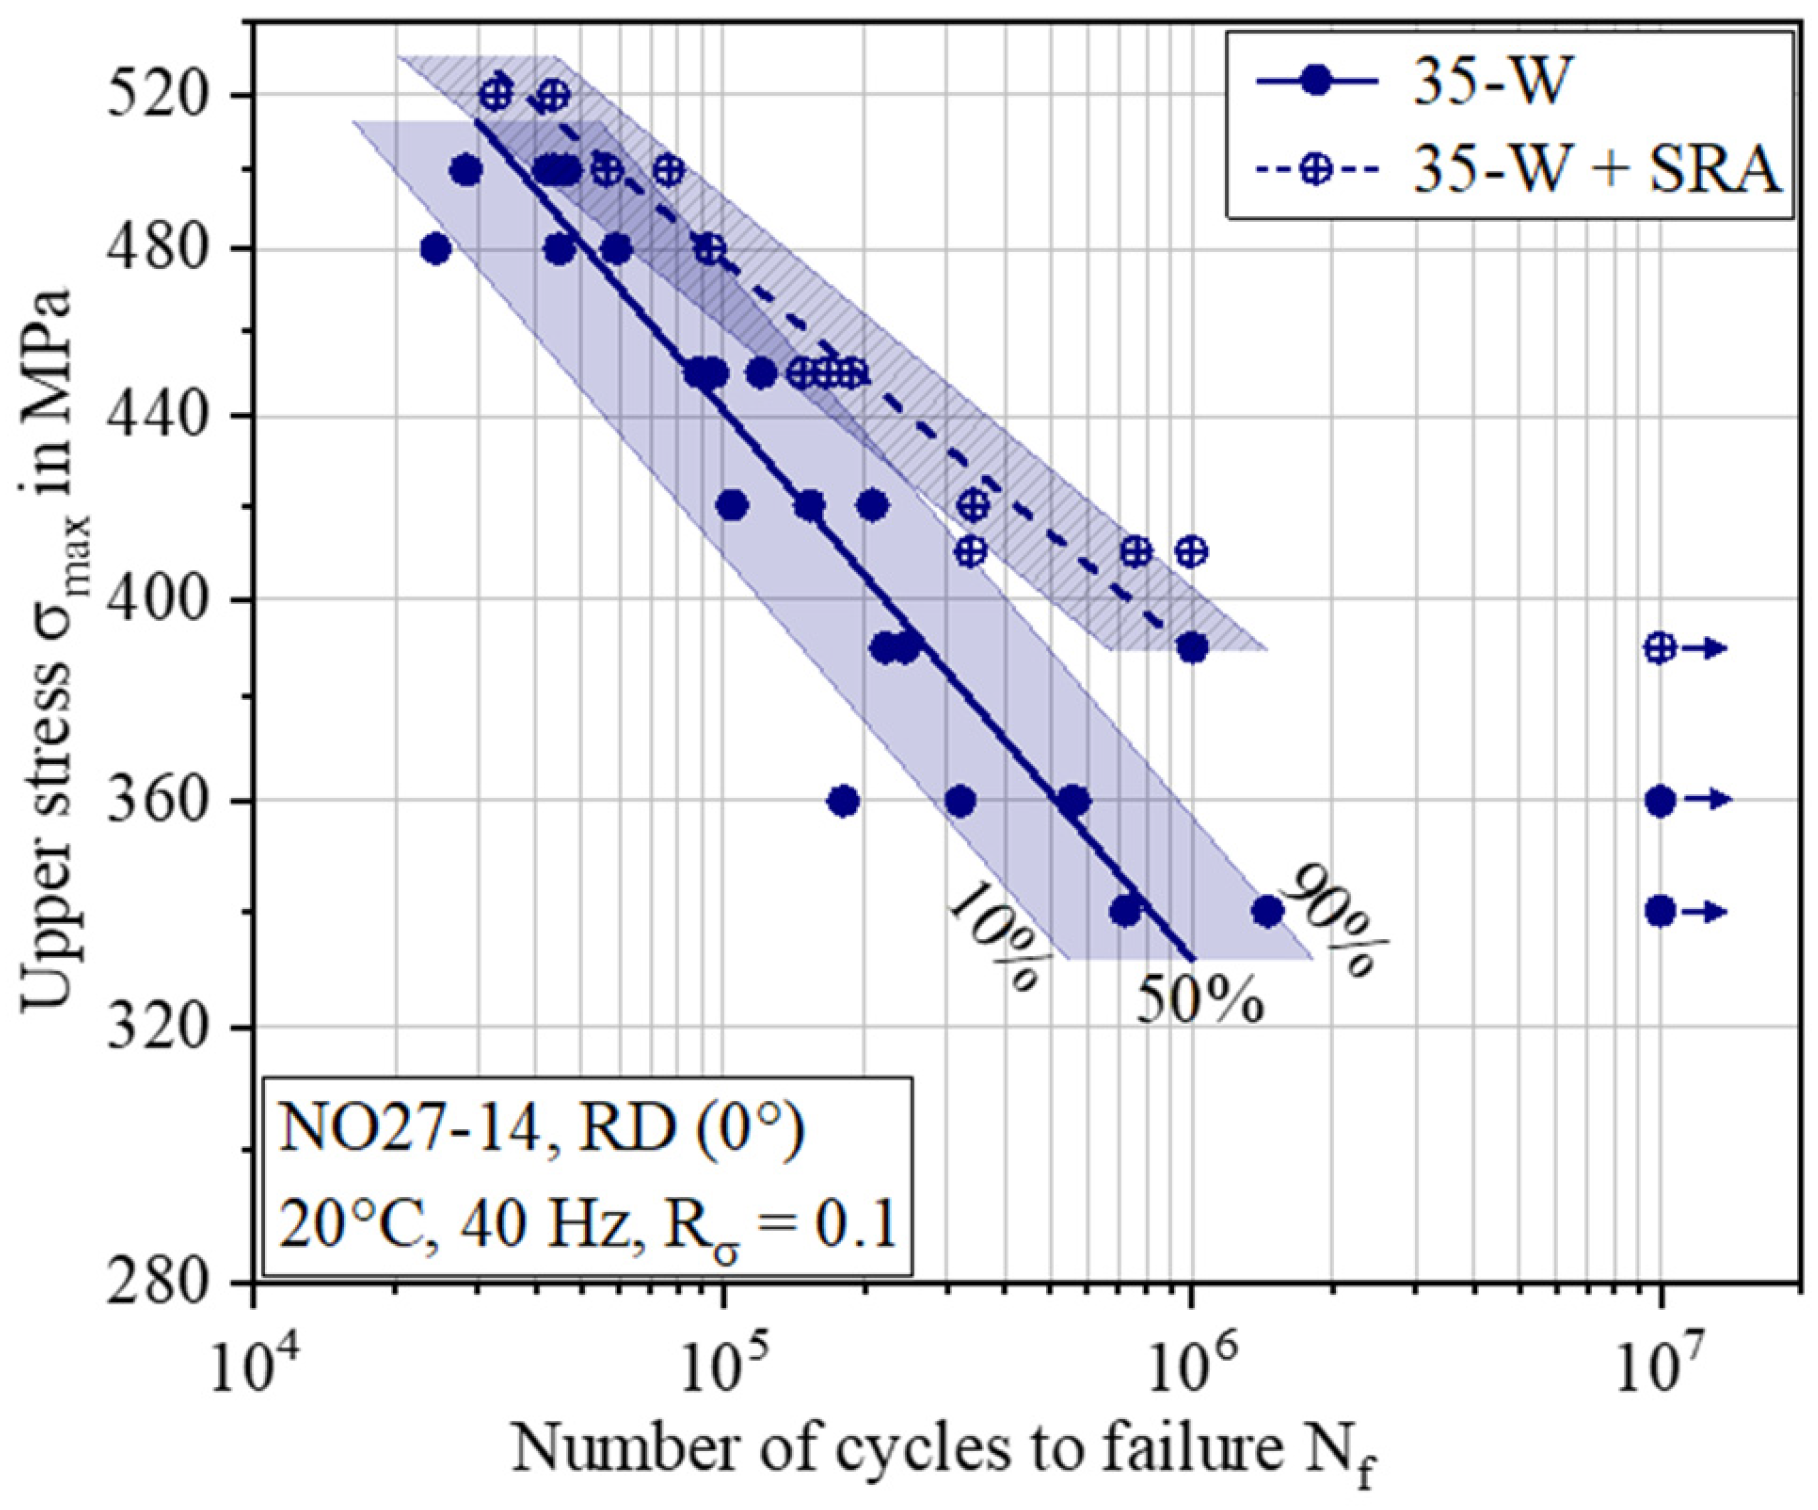
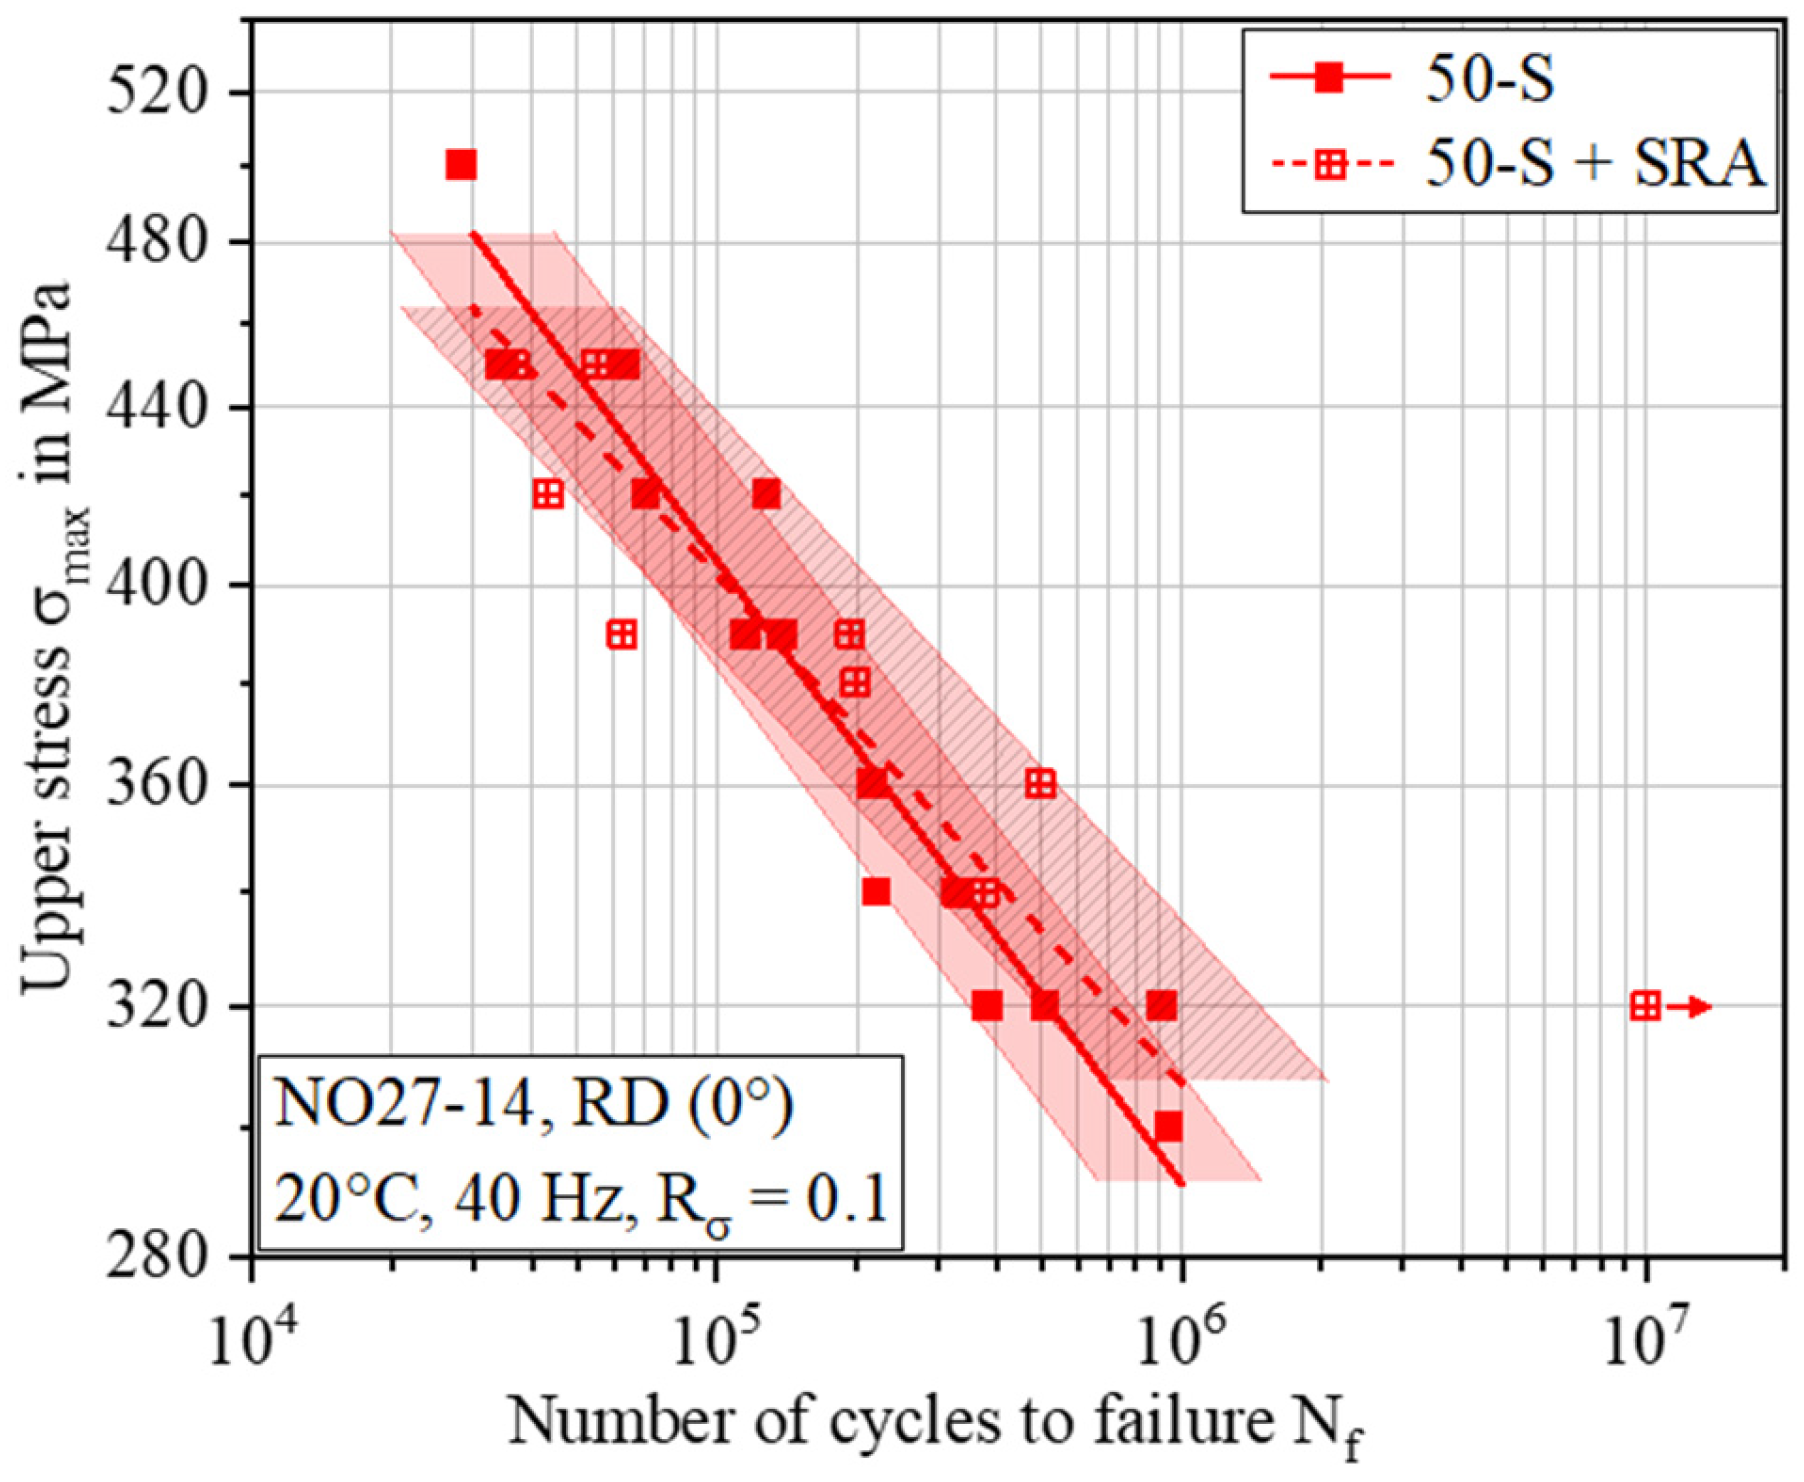
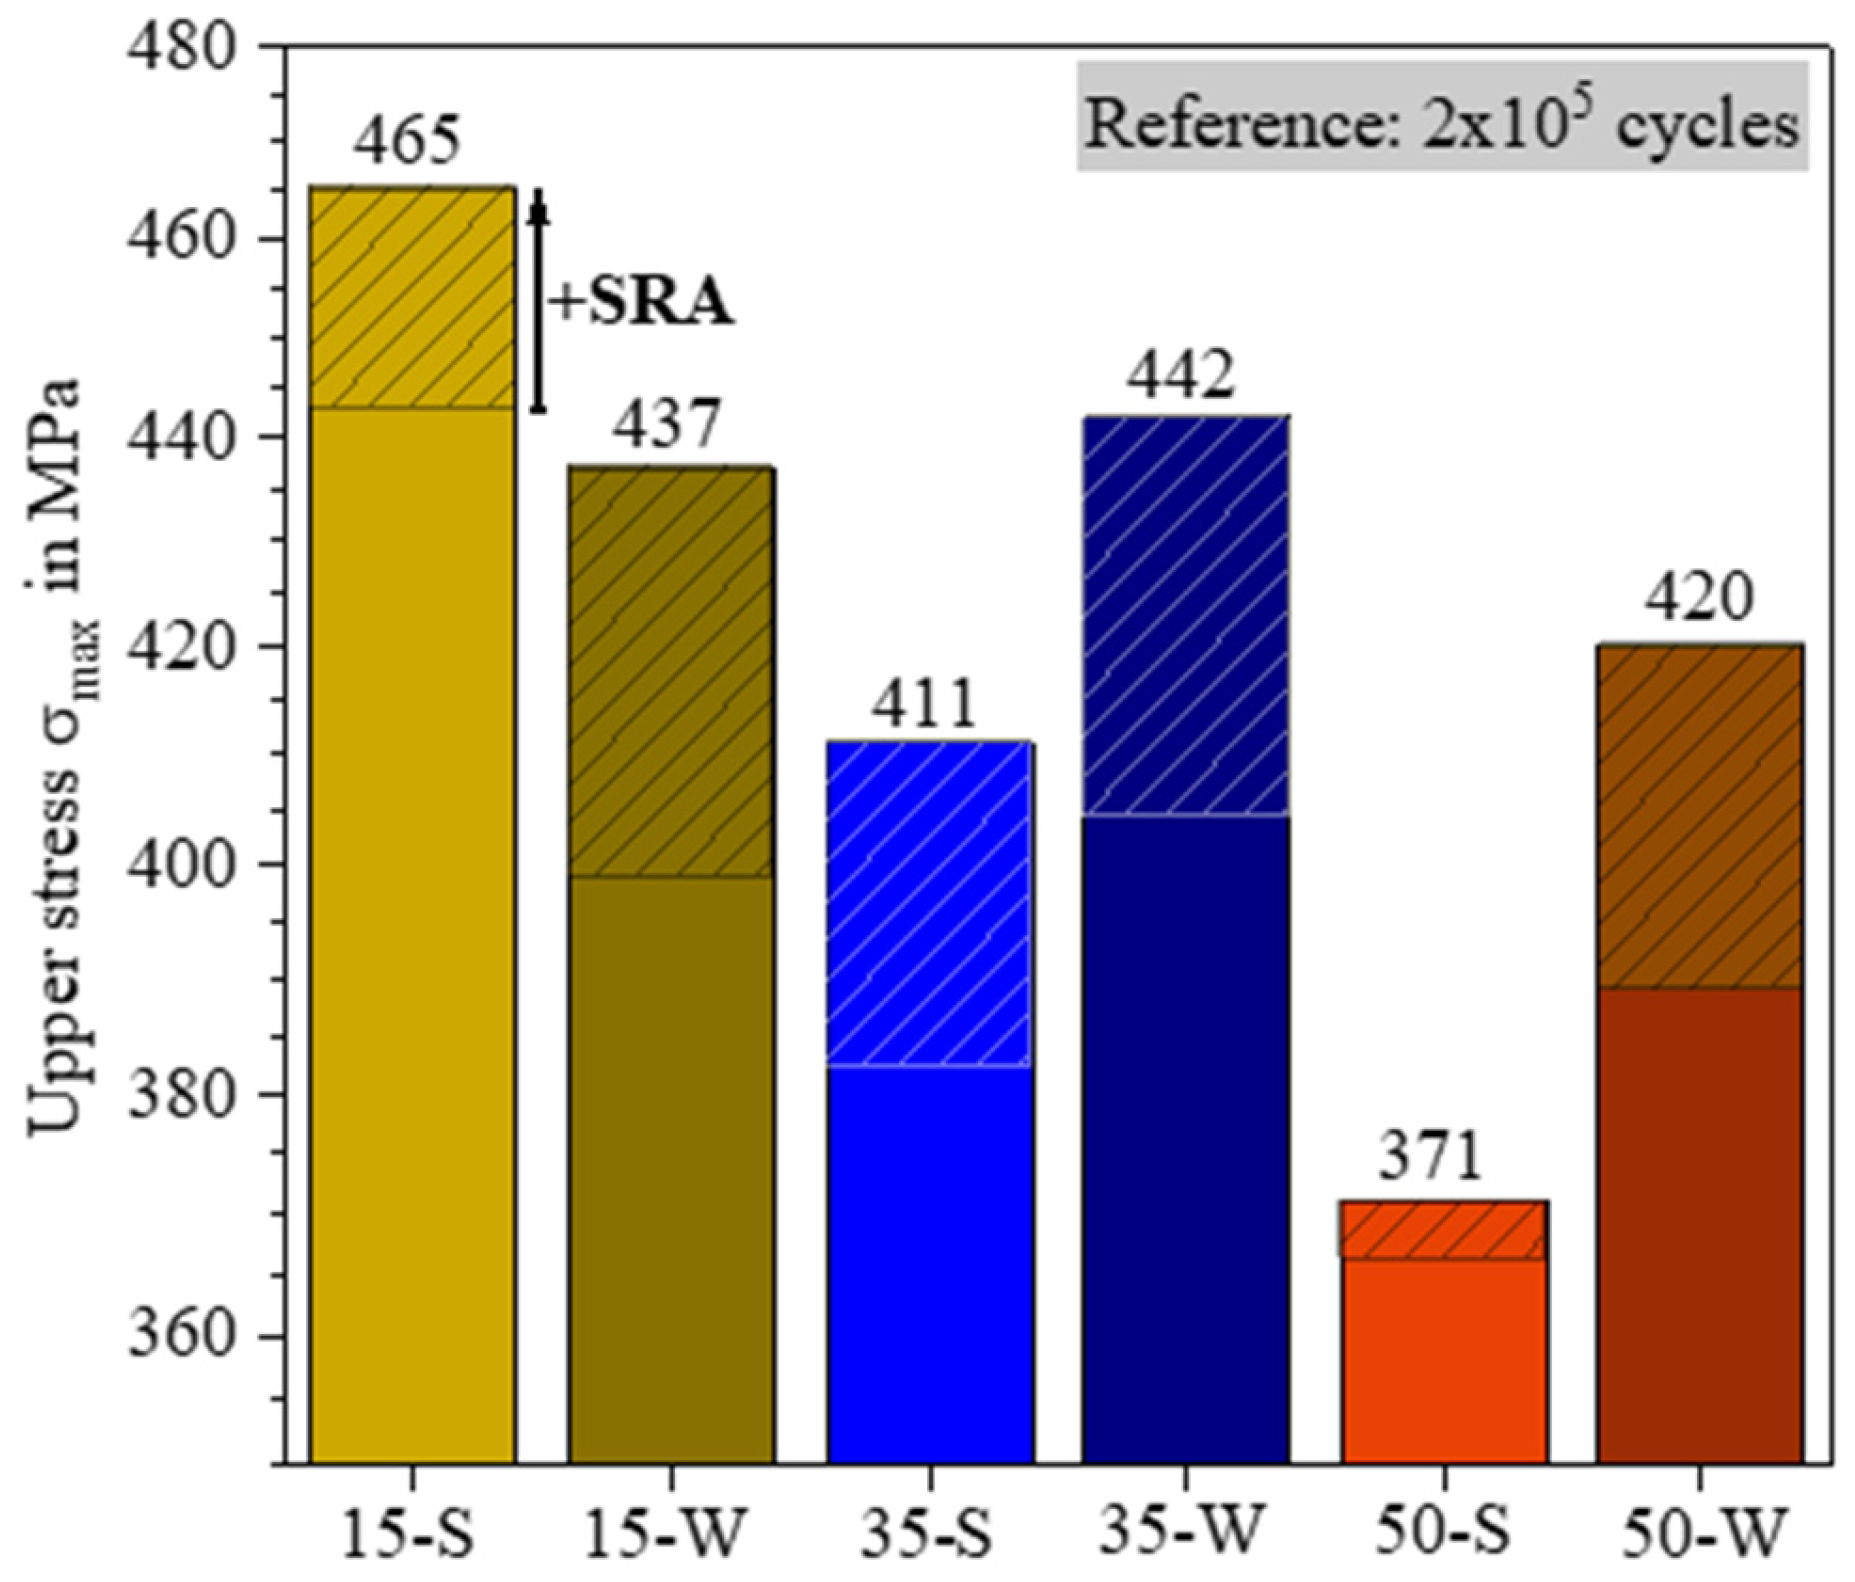
3.2. Influence of SRA on Fatigue Life

This section addresses the implications on the fatigue behavior after heat treatment. The fatigue behavior of the non-oriented electrical steel sheet in general and as a function of the shear-cutting parameters is described in more detail in another publication [5]. In general, cyclic loading is better tolerated by the newly formed, fine-grained microstructure that results from heat treatment. However, the improvement in fatigue strength due to annealing depends on the parameters of shear cutting. This behavior is described in more detail in the following figures.
Figure 8 shows the Wöhler fatigue life curves for a cutting clearance width of 35 µm in combination with a worn edge condition (35-W).
The fatigue strength line is being shifted to higher values due to SRA. The increase in fatigue strength is particularly evident for high cycle numbers. In contrast, at low cycle numbers, like in the range of approximately 500 MPa, the two lines tend to converge. The macroscopic plasticity behavior is dominant for such high upper stresses, while for lower upper stresses, the edge condition exerts a more significant influence. Figure 9 illustrates the fatigue life curves for shear-cut variant 50-S. For this parameter set, no significant improvement is observed, neither in the area of the high upper stresses nor in the area of the low upper stresses, despite heat treatment.
Figure 10 presents the impact of a heat treatment on the upper stress in dependence on all six cutting parameters for a reference cycle number of 2 × 10⁵. The dashed part corresponds to the increase in fatigue strength compared to the edge condition without heat treatment, as demonstrated in a previous publication [5]. Most of the variants show a significant improvement of the tolerable upper stress of up to 40 MPa.
In total, variant 15-S remains the best parameter set although SRA only leads to a moderate improvement in percentage terms of approximately 5%. However, variant 15-S is already at a relatively high level in the shear-cut initial condition compared with the other five variants. For worn cutting edges (darker colors), the highest improvements of about 10% are measured in each case. On the other hand, the lowest fatigue strengths are observed for the shear-cut samples with medium (35 µm) and high (50 µm) cutting clearance combined with sharp edges. An attempt to explain this negligible improvement for the 50-S parameter variant is described in Section 4 by the existence of critical grain breakouts.

4. Discussion

4.1. Differences in SRA Improvement

The potential for a beneficial effect of a heat treatment on the cyclic fatigue strength is demonstrated by the tests conducted within the scope of this study. Despite a reduction in hardness as a consequence of the heat treatment, the fatigue life is positively influenced because a severe strain hardening condition simultaneously weakens the deformation capacity under cyclic loading. This behavior, which is reported in the literature, can thus be transferred to electrical steel sheets [16].
Another positive effect derives from the fine grain, which helps to inhibit the formation of cracks. However, the intensity of the improvement differs depending on the shear-cutting parameters used. Whereas an improvement can be observed for most shear-cutting parameters, in particular the 50-S variant exhibits little impact. This marginal improvement might be explained by the existence of crack critical grain breakouts. The topographic damage in the form of notches and grain breakouts cannot be cured by heat treatment. The presence of the grain breakouts is increased when shear cutting is performed with a high cutting gap width in combination with a sharp punching tool; see Figure 11c.
Here, the appearance of several defects is evident over a relatively small area of the cut edge of approximately 2 mm.
Figure 12 shows such a region after the heat treatment and at an advanced stage of crack initiation. Furthermore, Figure 12b,d examine the microstructure at the cutting plane A-A, while Figure 12c,e present an enlarged area of the latter at the upper right corner. The recrystallized fringe can be considered crack-inhibiting due to its fine-grained and stress-free structure. However, in this case, it appears that the crack initiation started from the intergranular interface. Furthermore, it is noteworthy that the fine-grained and thus crack-inhibiting edge region are not as pronounced at this point, which is why the initial crack formation can occur more easily.
Although the fringe of the newly formed fine grain structure is present, at the position of the incipient crack below the shiny crystalline surface of the grain boundary, there is no fine grain formation. Thus, the microstructure in the region of the notch base is relatively comparable to the condition without heat treatment. Accordingly, it is understandable why no significant improvement in fatigue life is observed for this fatigue specimen.

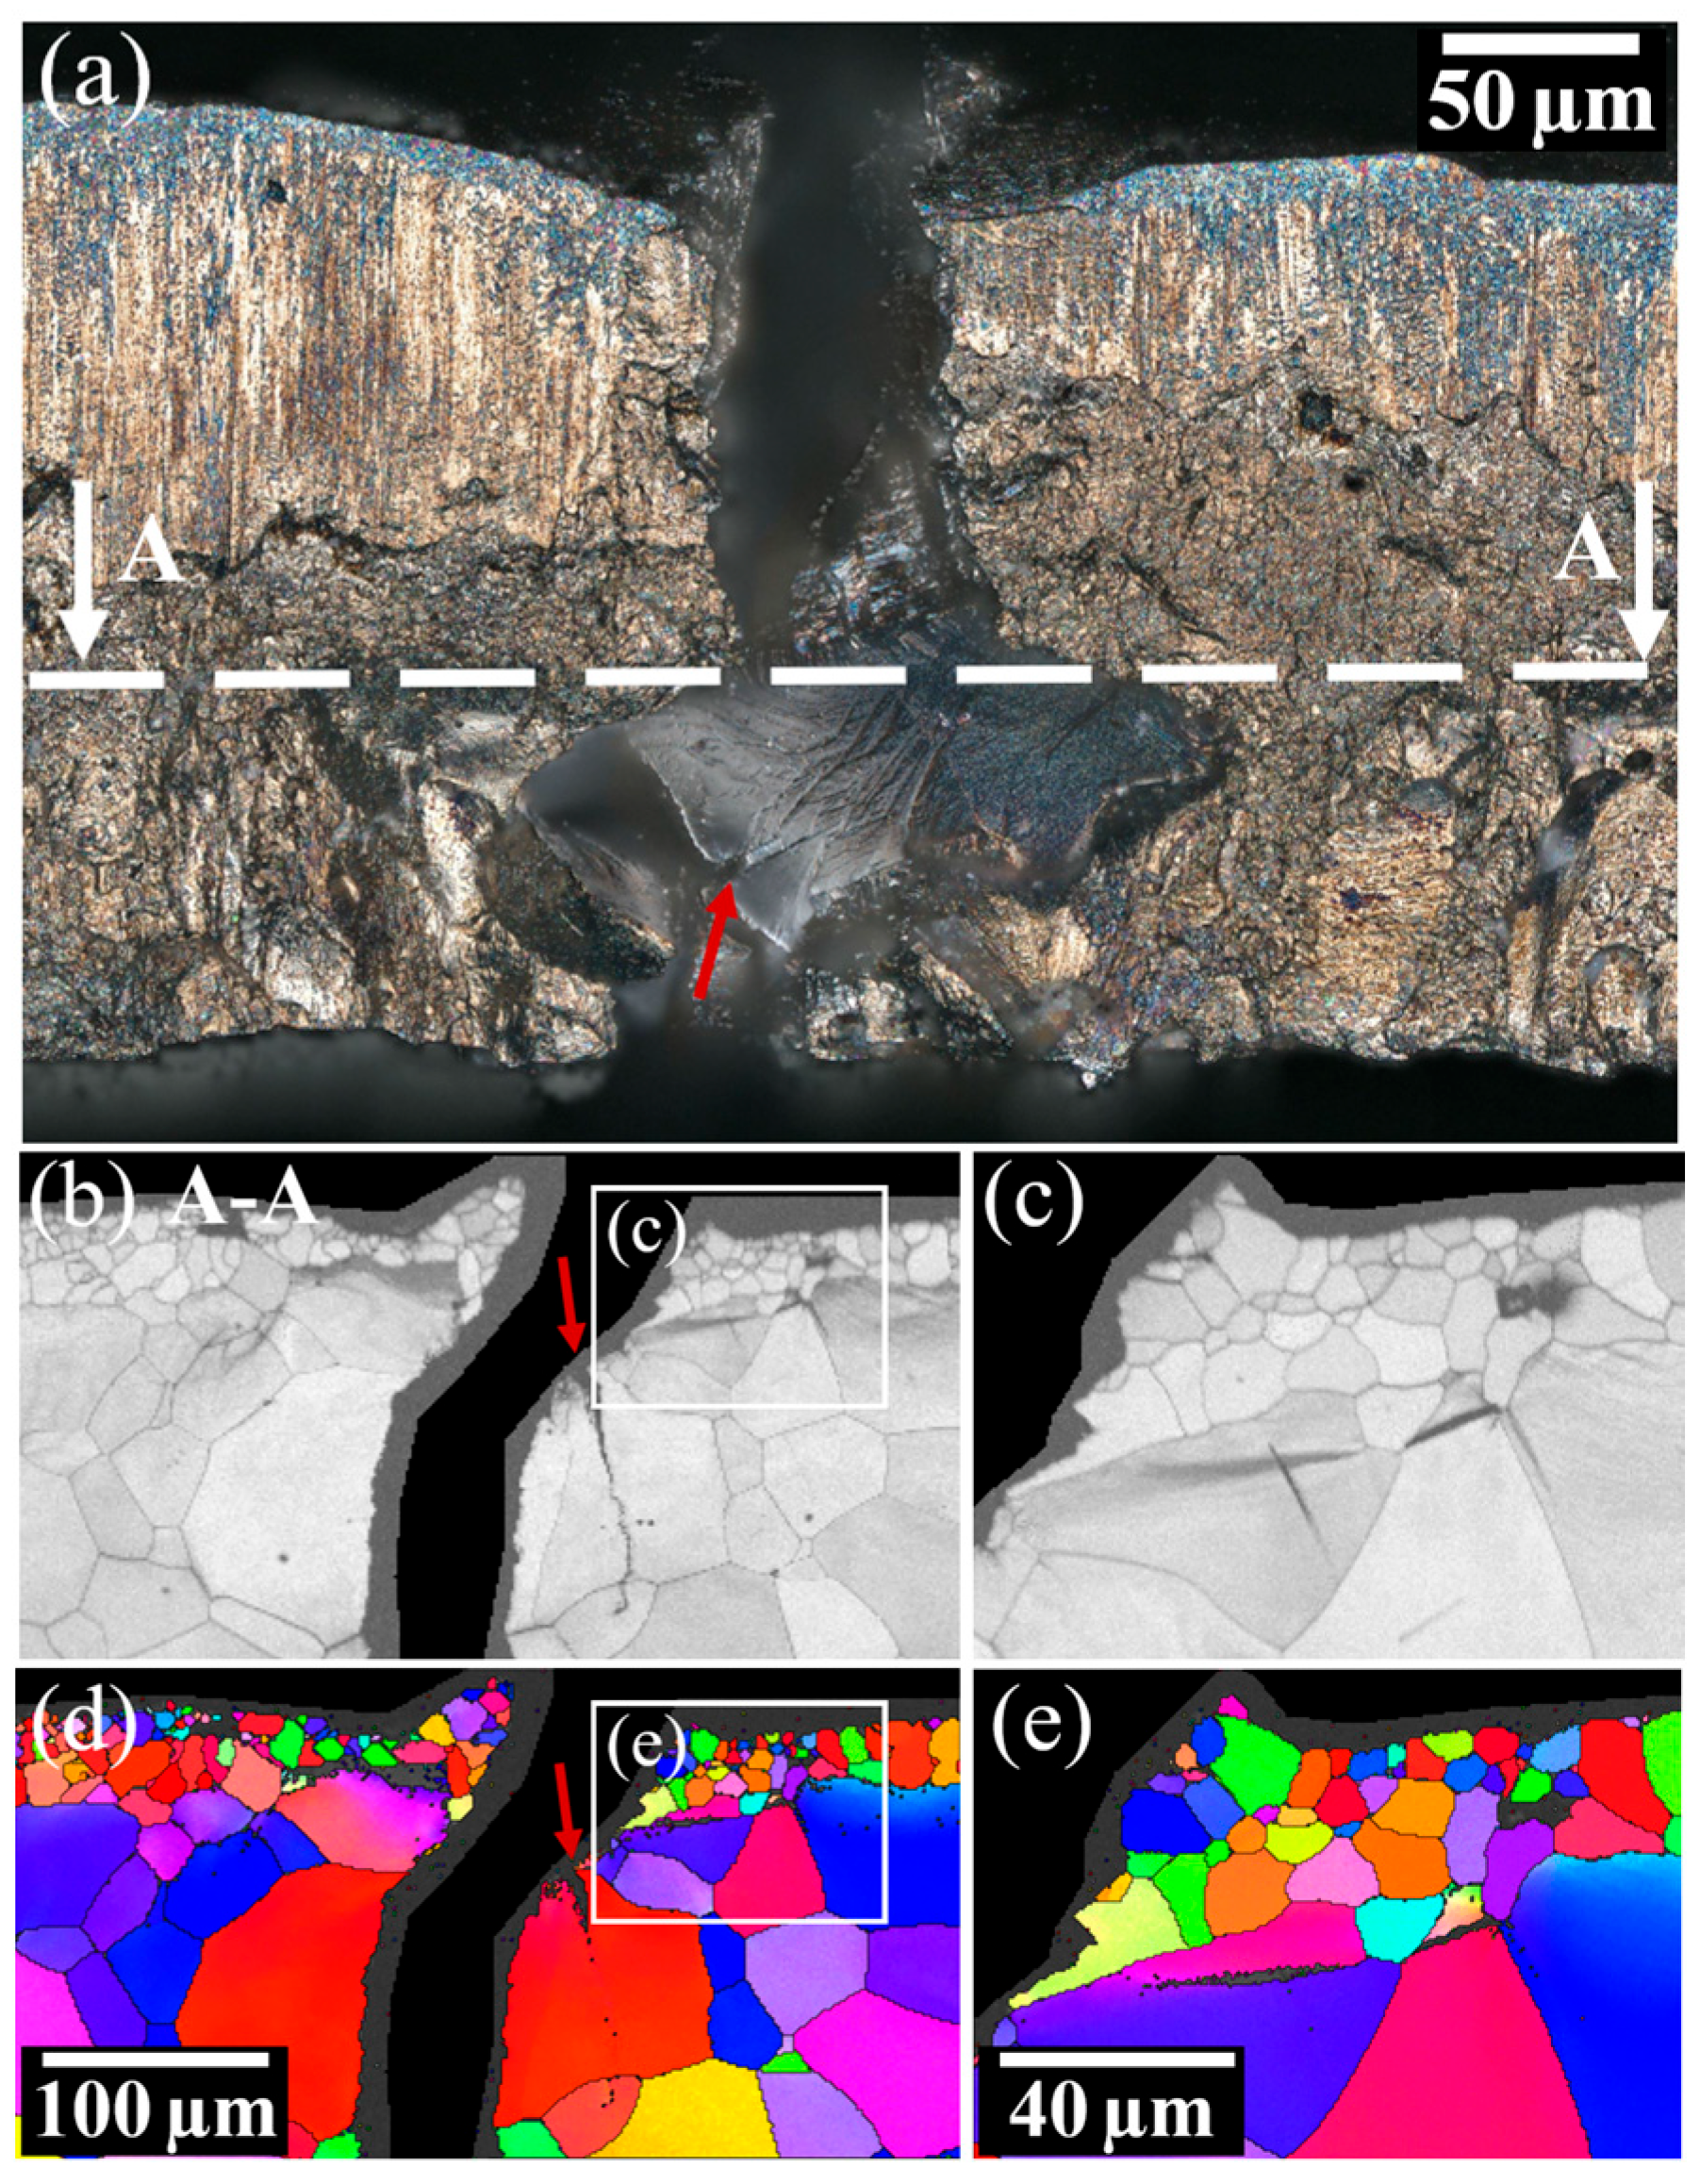
4.2. Microstructural Cause of Grain Debonding

As a next step, Figure 13 discusses the potential cause of the grain breakouts by using two exemplary shear-cut specimens with different characteristics. In addition to the EBSD image quality and the local misorientation angles, the grain orientations are also evaluated on a pixel-by-pixel basis. For this purpose, the associated Schmid factors for the {110}<111> slip system family are calculated based on the known orientation data. These slip systems are considered because alloying of silicon causes the deformation and slip band formation in iron to take place along the {110} planes preferentially [17,18,19]. Furthermore, the tendency for slipping on the {110} planes is favored by the high deformation velocities present during shear cutting [20]. In example 1 (left column), a grain with a high Schmid factor of 0.49 is present in the area of the fracture surface at the cutting edge. Therefore, this corresponds to a favorable orientation for deformation in the vertical direction. This grain orientation gives rise to numerous shear bands, which typically stop at orientation differences at the corresponding grain boundaries.
On the right side of Figure 13, a second example is given. Despite identical shear-cutting parameters, a completely different characteristic is revealed here. In the lower grain, hardly any shear bands are present. With a Schmid factor of 0.36, this is an unfavorable orientation with regard to forming in the punching direction. Therefore, instead of ductile deformation, the grain behaves in a rather brittle manner, and the formation of shear bands is absent. Instead, the deformation concentrates on the grain boundary, which is the nearest weak point, especially the part of the grain boundary perpendicular to the loading direction that experiences deformation, see black and white circles. If such a grain breaks out as a result of this strain localization, an exposed grain boundary is left behind, which, in combination with the geometric notch effect, favors the local formation of a crack. This tendency for intergranular breakouts of grains and grain subregions is also reflected in Figure 13d,f. Here, the grain boundary lies perpendicular to the vertically acting cutting force and features an increasing misorientation angle at the grain boundaries. This indicates the localized deformation of the vertical grain boundary; see the white frame. While crystal orientations with a large deformation capacity (high Schmid factor) can withstand the stresses acting due to their ductility, more unfavorable orientations are “crushed” or cut in a brittle way. Contrary to expectations, the 35-W and 50-W variants achieve higher fatigue life values than the 35-S and 50-S parameter sets. This seems to be caused by the notches that develop because of the orientation-dependent deformation tendency. For 35-S and 50-S, the sharp punching die favors the observed breakouts of whole grains or grain subregions, causing a more severe degradation of fatigue resistance.

5. Conclusions

The effect of a heat treatment in the form of stress relief annealing (SRA) on fatigue behavior is studied in dependence on the shear-cutting parameter for a non-oriented electrical steel. Therefore, two edge conditions and three cutting clearances are compared. After shear cutting, the six edge conditions are subjected to a subsequent heat treatment at 700 °C for 1 h. Thereby, it is found that SRA can significantly improve the fatigue behavior. For the fatigue strength limit set at 106 cycles, an increase between 5% and 18% is observed depending on the edge condition. This is caused by the recrystallization that takes place near the cutting edge and is characterized by the formation of newly formed dislocation-poor and randomly oriented crystals. Accordingly, the high dislocation density and regions with strain hardening are largely eliminated. However, the amount of improvement varies depending on the shear-cutting parameters. For most settings, the finer-grained and relaxed microstructure can delay crack initiation. However, the improvement is weak if critical notches are created by grain breakouts during shear cutting. This is because topographical damage in the form of cutting defects like grain breakouts cannot be compensated for by SRA. Here, despite a fine-grained and stress-relaxed microstructure in the neighboring grains, the formation of cracks occurs with less cycles or load. Consequently, the improvement potential for the shear-cutting edge condition ‘worn’ is higher than ‘sharp’ due to fewer notches being present. This is related to the fact that most of the intense plastic deformation and strain hardening, which has a detrimental effect on fatigue performance, is dissolved due to SRA. On the other hand, with a worn tool, the amount of the newly formed microstructure is more extensive because a worn tool enlarges the hardening zone. Consequently, to fully utilize the benefits of SRA, coarse topographic damage and the formation of critical cutting defects should be minimized as well. In addition to the known benefits for the magnetic properties, this also optimizes the mechanical properties.

Author Contributions

A.G.-B.: Investigation, Writing—Original Draft, Visualization; P.K.: Supervision; M.W.: Conceptualization, Supervision, Funding Acquisition; U.T.: Conceptualization, Supervision, Funding Acquisition. All authors have read and agreed to the published version of the manuscript.

Funding

This study was performed as part of the research project “Schwingfestes Elektroblech” 13FH050PX8 funded by the Federal Ministry of Education and Research (BMBF) and the AUDI AG.

Data Availability Statement

Data will be made available on request.

Conflicts of Interest

The authors declare no conflicts of interest.

References

  1. Knetsch, D.; Funk, M.; Kennerknecht, T.; Eberl, C. Load Data Calculation in Electric Axle Drives and Fatigue Assessment for the Electric Motor Subsystem. Mater. Test. 2014, 7–8, 535–541. [Google Scholar] [CrossRef]
  2. Gao, Y.; Long, R.; Pang, Y.; Lindenmo, M. Fatigue Properties of an Electrical Steel and Design of EV/HEV IPM Motor Rotors for Durability and Efficiency; SAE Technical Paper Series; SAE: Warrendale, PA, USA, 2010. [Google Scholar]
  3. Haefele, P.; Thum, M.; Knerr, T. Life-Time-Assessment for Rotors for Electric Drives. In Proceedings of the Third International Conference on Engineering Science and Innovative Technology (ESIT), Bangkok, Thailand, 19–22 April 2018. [Google Scholar]
  4. Winter, K.; Liao, Z.; Ramanathan, R.; Axinte, D.; Vakil, G.; Gerada, C. How non-conventional machining affects the surface integrity and magnetic properties of non-oriented electrical steel. Mater. Des. 2021, 210, 110051. [Google Scholar] [CrossRef]
  5. Gottwalt-Baruth, A.; Kubaschinski, P.; Waltz, M.; Tetzlaff, U. Influence of shear cutting parameters on the punched edges and fatigue behavior of non-oriented electrical steel sheets. Mater. Sci. Eng. Technol. 2024; to be published. [Google Scholar]
  6. Dehmani, H.; Brugger, C.; Palin-Luc, T.; Mareau, C.; Koechlin, S. High cycle fatigue strength assessment methodology considering punching effects. Procedia Eng. 2013, 213, 691–698. [Google Scholar] [CrossRef]
  7. Alves, E.M.M.; Silveira, C.C.; da Cunha, M.A. Influence of stress relief annealing temperature on the cutting edge microstructure and on the recovery of magnetic properties of grain oriented electrical steel. Mater. Charact. 2020, 166, 110408. [Google Scholar] [CrossRef]
  8. Nunes, C.D.S.; Neto, A.S.; Miranda, V.A.Q.; Matos, L.C.S.; Favarato, L.N.O.; Rocco, D.L. Influence of the cutting process, heat treatment, and maximum magnetic induction on the magnetic properties of highly oriented electrical steels. J. Magn. Magn. Mater. 2021, 537, 168211. [Google Scholar] [CrossRef]
  9. Naumoski, H.; Riedmüller, B.; Minkow, A.; Herr, U. Investigation of the influence of different cutting procedures on the global and local magnetic properties of non-oriented electrical steel. J. Magn. Magn. Mater. 2015, 392, 126–133. [Google Scholar] [CrossRef]
  10. Dehmani, H.; Brugger, C.; Palin-Luc, T.; Mareau, C.; Koechlin, S. Experimental study of the impact of punching operations on the high cycle fatigue strength of Fe–Si thin sheets. Int. J. Fatigue 2016, 82, 721–729. [Google Scholar] [CrossRef]
  11. Kentaro, I.; Tatsuya, O.; Teppei, M.; Masaki, K.; Keisuke, S. Fatigue Life Prediction of Motor Rotor Considering Influence of Die-cutting on Electrical Steel. Trans. Soc. Automot. Eng. Jpn. 2020, 51, 422–427. [Google Scholar]
  12. Nakata, T.; Nakano, M.; Kawahara, K. Effects of Stress Due to Cutting on Magnetic Characteristics of Silicon Steel. IEEE Transl. J. Magn. Jpn. 1992, 7, 453–457. [Google Scholar] [CrossRef]
  13. Gottwalt, A.; Kubaschinski, P.; Waltz, M.; Glatzel, U.; Tetzlaff, U. An experimental setup for fatigue testing of thin electrical steel sheets. Int. J. Fatigue 2022, 162, 106987. [Google Scholar] [CrossRef]
  14. Herbert, E.G.; Pharr, G.M.; Oliver, W.C.; Lucas, B.N.; Hay, J.L. On the Measurement of Stress-Strain Curves by Spherical Indentation. In MRS Proceedings; Materials Research Society: Warrendale, PA, USA, 2000; Volume 649. [Google Scholar]
  15. Beausir, B.; Fundenberger, J.-J. Analysis Tools for Electron and X-Ray Diffraction, ATEX-Software; Université de Lorraine: Metz, France, 2017; Available online: www.atex-software.eu (accessed on 2 November 2023).
  16. Lara, A.; Picas, I.; Casellas, D. Effect of the cutting process on the fatigue behaviour of press hardened and high strength dual phase steels. J. Mater. Process. Technol. 2013, 11, 1908–1919. [Google Scholar] [CrossRef]
  17. Boettner, R.; McEvily, A. Fatigue slip band formation in silicon-iron. Acta Metall. 1965, 9, 937–946. [Google Scholar] [CrossRef]
  18. Heller, M.; Gibson, J.S.K.-L.; Pei, R.; Korte-Kerzel, S. Deformation of µm- and mm-sized Fe2.4wt.%Si single- and bi-crystals with a high angle grain boundary at room temperature. Acta Mater. 2020, 194, 452–463. [Google Scholar] [CrossRef]
  19. Iordache, V. Characterisation of Mechanical Stresses in Ferromagnetic Steels by Using Magnetic Measurements; Université de Technologie de Compiègne: Compiègne, France, 2003. [Google Scholar]
  20. Libovický, S.; Šesták, B. Influence of the Silicon Content on the Crystallography of Slip in Iron—Silicon Alloy Single Crystals. J. Appl. Phys. 1963, 34, 2919–2921. [Google Scholar] [CrossRef]
Figure 1. Stress–strain curve from monotonic tensile test with magnified yield point in rolling direction (RD) of studied electrical steel sheet.
Alloys 03 00017 g001
Figure 2. (a) Specimen geometry of fatigue samples, (b) test setup with anti-buckling device.
Alloys 03 00017 g002
Figure 3. (a) Microscopic image of cut edge from punched electrical steel sheet with indication of different shear zones. (b) Cross-section of cut edge with nanoindentation pattern used.
Alloys 03 00017 g003
Figure 4. EBSD micrographs of cross-sections in the sheet plane of the shear-cut edge after stress relief annealing—(a,b) inverse pole figure maps, (c) an image quality map indicating the stress state: the defect-reduced and fine-grained recrystallized region close to the edge, (d) the inverse pole figure before stress relief annealing showing a slight rolling texture, (e) the inverse pole figure of the recrystallized edge displaying the random orientation within these areas.
Alloys 03 00017 g004
Figure 5. Microstructural comparison for 35-S based on transverse microsections of shear-cut edges before (left column) and after (right column) heat treatment at 700 °C for 60 min. The cutting is performed from top to bottom with a small cutting gap width and a sharp cutting tool. (a,b) EBSD image quality maps, (c,d) EBSD local misorientation, (e,f) nano-hardness mapping, (g,h) the inverse pole figure, (i,j) grain size map.
Alloys 03 00017 g005
Figure 6. A local misorientation map of lattice distortions around the roll-over zone, which persist despite the heat treatment. Near the surface of the shear zone (vertical edge region), the formation of very fine grains occurs.
Alloys 03 00017 g006
Figure 7. The comparison of microstructural features based on traverse microsections of shear-cut edges before (left column) and after (right column) heat treatment for 60 min at 700 °C. The cutting is performed from top to bottom with a large cutting clearance (50 µm) and a worn cutting tool. (a,b) EBSD image quality maps, (c,d) local misorientation maps of grain orientation, (e,f) nano-hardness mapping, (g,h) the EBSD inverse pole figure, (i,j) grain size maps.
Alloys 03 00017 g007aAlloys 03 00017 g007b
Figure 8. Wöhler (S-N) fatigue life curves of stress-controlled fatigue tests for shear-cut specimens with a cutting clearance of 35 µm and a worn tool wear state. The center lines correspond to the Wöhler curves with 50% failure probability. In addition, the range for a failure probability of 10% and 90% is also indicated. The dotted lines and shaded area correspond to fatigue specimens that have undergone heat treatment after shear cutting.
Alloys 03 00017 g008
Figure 9. Wöhler (S-N) fatigue life curves of stress-controlled fatigue tests for shear-cut specimens with a cutting clearance of 50 µm and a sharp tool wear state. The center lines correspond to the Wöhler curves with 50% failure probability. In addition, the range for a failure probability of 10% and 90% is also indicated. The dotted lines and shaded area correspond to fatigue specimens that have undergone heat treatment after shear cutting.
Alloys 03 00017 g009
Figure 10. Upper stress of the Wöhler lines with 50% failure probability at 200,000 cycles. The hatched parts illustrate the increased fatigue strength due to SRA compared to shear cutting without heat treatment.
Alloys 03 00017 g010
Figure 11. (a) Small cutting clearance (15 µm) with sharp tool, (b) high cutting clearance with worn tool wear state, (c) high cutting clearance and sharp tool leading to high amount of grain debonding. White rectangles mark these areas.
Alloys 03 00017 g011
Figure 12. (a) An edge view via an optical microscope of a grain breakout after stress relief annealing and subsequent cyclic loading; (be) an EBSD cross-sectional view of the edge region with advanced crack propagation and a zoom-in on the fine-grained recrystallized zone. This example is created using the parameter 50-S and tested with an upper stress of 390 MPa.
Alloys 03 00017 g012
Figure 13. Implications of grain orientations on the microstructural behavior during shear cutting utilizing two representative examples taken as cross-sections. The cutting direction proceeded from top to bottom. Favorable orientations (high Schmid factor) show evidence of ductile shear bands, while unfavorable orientations (low Schmid factor) exhibit brittle shear and grain breakout. (a,b) Pattern Quality Maps, (c,d) maps of grain orientation spread, (e,f) Schmid factor maps for the slip system family {110}<111>.
Alloys 03 00017 g013
Table 1. Chemical composition of studied electrical steel.
ElementsCMnSiPSAlFe
wt.%0.0070.163.320.010.0021.195.3
Table 2. Monotonic material properties in form of elastic modulus E, Poisson’s ratio ν, yield strength Re, ultimate tensile strength Rm, and elongation at break A, each measured in rolling direction (RD).
E [GPa]ν [-]Re [MPa]Rm [MPa]A [%]
1870.2844754015.3
Table 3. Residual stress state in rolling direction for six different shear-cutting parameter sets before stress relief annealing.
15-S15-W35-S35-W50-S50-W
σYY [MPa]213 ± 35168 ± 54204 ± 49213 ± 48196 ± 43220 ± 50
Disclaimer/Publisher’s Note: The statements, opinions and data contained in all publications are solely those of the individual author(s) and contributor(s) and not of MDPI and/or the editor(s). MDPI and/or the editor(s) disclaim responsibility for any injury to people or property resulting from any ideas, methods, instructions or products referred to in the content.

