Article

Oxide Modified Iron in Electron Beam Powder Bed Fusion—From Processability to Corrosion Properties

1
Institute of Materials Engineering, University of Kassel, 34125 Kassel, Germany
2
Technical and Macromolecular Chemistry, University of Paderborn, 33098 Paderborn, Germany
*
Author to whom correspondence should be addressed.
Alloys 2022, 1(1), 31-53; https://doi.org/10.3390/alloys1010004
Submission received: 17 January 2022 / Revised: 22 February 2022 / Accepted: 24 February 2022 / Published: 7 March 2022

Abstract

:
Additive manufacturing (AM) processes are not solely used where maximum design freedom meets low lot sizes. Direct microstructure design and topology optimization can be realized concomitantly during processing by adjusting the geometry, the material composition, and the solidification behavior of the material considered. However, when complex specific requirements have to be met, a targeted part design is highly challenging. In the field of biodegradable implant surgery, a cytocompatible material of an application-adapted shape has to be characterized by a specific degradation behavior and reliably predictable mechanical properties. For instance, small amounts of oxides can have a significant effect on microstructural development, thus likewise affecting the strength and corrosion behavior of the processed material. In the present study, biocompatible pure Fe was processed using electron powder bed fusion (E-PBF). Two different modifications of the Fe were processed by incorporating Fe oxide and Ce oxide in different proportions in order to assess their impact on the microstructural evolution, the mechanical response and the corrosion behavior. The quasistatic mechanical and chemical properties were analyzed and correlated with the final microstructural appearance.

1. Introduction

In implant surgery, progress in material science and engineering is crucial for a continuous improvement of application adapted implants to finally support a patient’s recovery. Consequently, an understanding of the specific necessities in implant design including strength, surface properties, and chemical behavior on the one hand, and adequate process routes to achieve these properties on the other hand, is required.
Emerging processes allowing the establishment of these specific properties are found in the field of powder bed additive manufacturing (PB-AM), namely, laser powder bed fusion (L-PBF) and electron powder bed fusion (E-PBF). Generally, these technologies are known for unprecedented geometrical and structural design freedom [1,2]. Using PB-AM, e.g., parts being characterized by locally varying density can be realized [3,4,5,6,7,8], aiming to adapt local stiffness and strength and enhance bone regeneration, the latter being of highest interest for numerous medical applications.
The use of Ti-6-4 [6,7,8,9], AISI 316L [10,11], and CoCr-based alloys [6,12] is most common in medical applications. These alloys are characterized by relatively high strength and good corrosion resistance. However, such permanent implants are known to contain certain risks: stress shielding as a result of high stiffness of such alloys in bulk form is known to promote bone resorption and, eventually, an aggravated healing process [6,7,9,13]. This underlines the need for implants with adapted geometries, e.g., filigree lattice structures or materials being characterized by tailored porosity realized by AM. Furthermore, the release of several alloying elements such as nickel, vanadium, and aluminum can be toxic for the organism when exceeding a certain dose [14]. Finally, the implant has to be removed after a given time of application, obviously by means of another surgical intervention. Because of these disadvantages, the use of biodegradable materials for implants has gained significant attention in the recent past [15,16]. In numerous studies, the focus is set on implants that are supposed to support the bone after a fracture. Such implants should slowly degrade while the bone heals. Obviously, the applied component has to possess an adequate surface (i.e., roughness or open porosity) [7,8,12,17], sufficient strength [5,7,18], and well-suited chemical properties [5,18], the latter being most important, since neither the material itself nor its corrosion products must be toxic to the organism.
In such cases, the mechanical behavior, i.e., the relevant performance under monotonic and cyclic loading, has to be evaluated as a function of the steadily changing cross-section of the implant. In other words, the decreasing load-bearing capacity of the implant has to be exactly counterbalanced by the increasing strength of the healing bone. In a such case, the requirements can be summarized as follows:
  • The general chemical composition and any corrosion products must not be toxic for the human body.
  • The degradation rate has to be tailorable to maintain an adequate level of structural integrity for the entire bone healing process.
  • The material, surface, and geometry have to meet all relevant requirements with respect to stiffness and strength, wherein all characteristics have to be adapted to the prevailing quasistatic and cyclic loading scenario.
For biodegradable implants, magnesium and magnesium alloys, among others, have been studied in detail in recent decades [15]. Here, degradation rates have been reported to be too high for specific medical applications [19] and pronounces sensitive to the purity for the pH value of about 7.4 inside the human body [20]. Obviously, a degradation of the implant faster than the bone growth can be detrimental for the healing process. Furthermore, hydrogen and hydroxide are formed as corrosion products, unable to be resorbed from the tissue sufficiently fast enough. Researchers have tried to lower the corrosion rates of Mg implants by alloying aluminum, zinc, and rare earth elements (inter alia Ce, La, and Nd) [21], as well as by using ultrahigh-purity Mg, since high degradation rates seen were attributed to iron-containing precipitates [19]. In the latter study, the degradation rate could be slowed down to 10 µm per year in simulated body fluid (SBF). Recent studies focused on the improvement of the mechanical properties of Mg-Zn alloys, adding cerium oxide nanoparticles (CeO2 NP) in a fraction of up to 1.5 wt % in order to strengthen the matrix, wherein no cytotoxicity to osteoblast cells was found [22]. However, the effect of CeO2 NP on cell viability is discussed contradictorily. Leung et al. [23] reviewed the divergent studies reporting on the toxicity and the protective effect of CeO2 and meticulously probed the effect of the nano oxide on two different bacteria. The results indicated that the interaction of the particles with the observed cells is complex, and the grade of toxicity is highly sensitive to the experimental circumstances, i.e., light, temperature, medium, and particle morphology, among others. Therefore, a reliable conclusion in this field is difficult to make, and feasibility studies focusing on the manifold effects on the material and the application environment are strongly required.
Another approach is seen in Fe-Mn twinning-induced plasticity (TWIP) steels, since their high strength and ductility allow for good structural integrity during degradation [24,25]. Depending on their chemical composition as well as microstructure, these high-Mn steels showed decelerated corrosion rates after a certain timespan due to a barrier effect of adherent and insoluble corrosion products [26,27]. Build orientation studies of L-PBF processed Fe-30 Mn alloy furthermore revealed low orientation dependency regarding the degradation behavior in SBF, being only slightly affected due to grain size and texture influence [28]. Furthermore, there have been attempts to alloy Fe-Mn functional materials with precious metals such as silver in order to achieve an effective cathode, increasing the degradation rate of the specimen [29]. For this purpose, the possibility of in situ alloying using PB-AM is used, as powder of metals that do not dissolve into each other can be previously mixed and processed, leading to a very fine dispersion of a secondary phase. Issues related to this approach are obvious, since sharp-edged microscale Ag residuals may remain in the tissue after the dissolution of the iron implant, probably damaging it or leading to long-time side effects such as argyria [30,31]. However, apart from cost-intensive alloy design, concerns exist regarding toxicity [32] and reduced biocompatibility [33] with increasing Mn contents in these alloys.
In the latest studies, zinc-based alloys have been investigated as potential biodegradable implant materials. Here, apart from mechanical properties being superior in comparison to Mg alloys, the degradation rate is within a tolerable range for the human body [20,34]. However, still, the biological acceptance of this element is seen as problematic. Moreover, as summarized in [35], the tolerance of an organism to Zn is comparably low, whereas the recommended purity is higher in Zn than in Mg or Fe due to typical impurities such as Cu and Cd [20].
Pure Fe, as another promising alternative candidate material, has attracted a large amount of attention in the recent past. In vivo studies revealed that this metal shows no pronounced inflammation reaction or toxicity [27,36,37]. Apart from significantly lower costs in comparison to the aforementioned alloys, essential mechanical properties, i.e., superior quasistatic [20] as well as fatigue strength [5], are met (many implants are subjected to millions of loading cycles). Furthermore, due to the superior strength, a higher potential for realization of adapted filigree structures is given. Cellular structured Fe implants have already been manufactured using PB-AM, being characterized by mechanical properties similar to trabecular bone in rats [4].
Using Fe as implant material, one has to consider the comparably low degradation rate [27,37]. Simplistically, it is possible to set the dwell time of a biodegradable foreign object inside an organism by its initial weight. A common dimension of the degradation rate is distance per year (e.g., millimeter per year). On the basis of this value, one can calculate how long it will take until an implant is completely dissolved under given boundary conditions, or rather, how thick it has to be to dissolve in a given time. Following this strategy, one can create specifically adapted implant structures. Due to the high degree of design freedom, all these features can then be realized by AM, eventually allowing for the adjustment of the degradation time by up- and downscaling of the respective features of the filigree structures. However, in such a simplistic case, the mechanical response of the part is not considered at all. Thus, the design required to adapt the dwell time does not meet the design required for mechanical performance (already in case of the initial, as-built structure). Therefore, the chemical response has to be somehow adjustable by the behavior of the material itself, i.e., independent from the geometrical appearance of the part.
In steel metallurgy, rare earths (RE), as for example lanthanum and cerium, have been used as deoxidizing and desulfurizing agents [38]. The RE oxides and (oxy-)sulfides that have not been transferred to the slag and, eventually, remain in the melt have been found to be efficient grain refiners, since more nucleation sites are present in the melt [39,40]. According to Tuttle [41], the requirements for particles to act as nuclei are as follows:
  • Melting point higher than for the liquid metal.
  • Thermodynamic stability in this environment (i.e., no decomposition or reaction with the melt compounds).
  • Low wetting angle.
  • Low interfacial energy, i.e., lattice parameters similar to the solid material.
Grain refinement can be based on preferred nucleation in the liquid → solid transition, which is referred to as solidification grain refinement through heterogeneous nucleation. Other possibilities for grain refinement are an increased density of nucleation sites during the γ → α transition in steels [42,43,44] and the impediment of growth of γ grains, which is referred to as solid grain refinement [39]. In this regard, numerous models have been proposed to address relevant mechanisms on the crystallographic level, e.g., those reported in [39,40,45,46,47].
Since PB-AM processes are melt-based manufacturing techniques, the effects of several types of nanoparticles (NP) applied to different alloys has also been investigated in this field, and grain boundary strengthening [48,49], precipitation strengthening [50,51], and grain refinement [48,49,52,53] were observed. As the oxide particles are expected to affect local thermal and electrical conductivity, one can also assume that they have an influence on the E-PBF process, since an electron beam is used as primary energy source to melt the raw material. Eventually, such material modifications can have an impact on the processability and on the resulting microstructure, as well as the mechanical and chemical material properties.
In the present study, commercially pure iron (cp Fe) powder was modified in two different ways, i.e., by blending cerium oxide nano particles (CeO2 NP) and oxidized powder. Afterwards, different powder compositions were processed via E-PBF. The modification procedure, powder properties, and finally obtained material conditions were evaluated, with an emphasis on microstructure evolution, corrosion behavior, and mechanical response of the E-PBF manufactured specimens.

2. Materials and Methods

In present work bars of cp Fe obtained from Allied Metals Corp. (ALLIED METALS CORPORATION, Auburn Hills, MI, USA) were atomized by TLS (TLS Technik GmbH, Bitterfeld, Germany) by electron induction gas atomization (EIGA). For powder modifications and specimen processing (detailed in the following), the particle size fraction ranging from 63 to 150 µm was used.

2.1. X-ray Photoelectron Spectroscopy (XPS)

XPS analytical studies were performed by using an Omicron system with a monochromatic Al X-ray source XM 1000. The spot size was about 800 µm. The chamber base pressure was below 4 × 10⁻¹⁰ mbar. Spectra were measured in a range from 0 to 1200 eV with a dwell time of 200 ms, a pass energy of 100 eV, and steps of 0.5 eV. For the elemental spectra, the pass energy was set to 20 eV with steps of 0.1 eV, and all spectra were measured at an angle of 60°. Finally, peak deconvolution and compositional analysis was performed using CasaXPS software package (version 2.3.15). A Lorentz–Gauss cross-product function in combination with Shirley background was utilized as common line-shape, and quantitation of atomic concentrations was carried out using the CasaXPS database of relative sensitivity factors (RSF).

2.2. Modifications

The Fe particles were modified in two different ways. Cerium oxide nanoparticle (CeO2 NP) adsorption was achieved by mixing of Fe powder and an aqueous suspension of CeO2 NP (Sigma-Aldrich, St. Louis, MO, USA) with an average diameter of <25 nm in a drum hoop mixer for 2 h. Drying of the inoculated particles was performed at 35 °C and a reduced pressure of 80 mbar for 48 h. For this modification, the proportions were chosen to form a monolayer of NP on the Fe particles, resulting in a weight fraction of 0.031% CeO2. Thus, the mass fractions used for raw material modification were chosen to obtain one layer covering every powder particle, assuming a homogeneous particle distribution. For this calculation, NP and Fe powder diameters of 25 nm and 120 µm, respectively, as well as their actual densities were used. The second modification was realized by oxidizing the Fe powder per se at 190 °C and 110 mbar oxygen partial pressure for 19 h. On the basis of the pressure difference of the pure oxygen before and after oxidation and the XPS measurements resulting in the reaction to Fe2O3 (see below), the performed thermal treatment led to the formation of an about 30 nm thick α-Fe2O3 shell on the Fe particles with a total weight fraction of 0.045% Fe2O3. These two initial modifications led to an obvious change in the powder appearance, which was visible by means of scanning electron microscopy (SEM) as well as to the naked eye (Figure 1).
The two primary modifications showed a characteristic optical appearance in comparison to the as-atomized Fe powder (see Figure 1). The modified powders were directly processed by E-PBF, these conditions being named [Fe + Fe2O3] and [Fe + CeO2]. By blending the as-atomized Fe powder with the two modifications, seven different powder conditions were prepared in total for subsequent E-PBF processing of solid specimens (cf. Table 1). The nomenclature used in the following always refers to the contents of as-atomized and modified powder, i.e., a mixture composed of 50% weight fraction of as-atomized powder and 50% weight fraction of oxidized powder (named Fe2O3) is referred to as [Fe + Fe2O3] + Fe, 1:2. In the case where a mixture of 25% weight fraction of the initial mixture is further blended with 75% weight fraction of as-atomized Fe, the final composition is referred to as [Fe + Fe2O3] + Fe, 1:4. The same kind of nomenclature applies to the CeO2 modifications.

2.3. Processing

The different Fe powders were then processed using an Arcam A2X E-PBF machine (ARCAM AB, Mölndal, Sweden) using a 50 × 50 mm2 build platform within a build envelop of 70 × 70 mm2. Since any difference with regard to process irregularities, porosity, microstructure, and mechanical as well as corrosive response shall be traced back to the material itself, the process parameters were kept constant for all particular powder compositions and deduced from previously conducted investigations on cp Fe (cf. Table 2) [54,55]. The acceleration voltage of 60 kV was set constant. The temperature evolution was recorded using a thermocouple (type FKI, TC K) attached underneath the build plate.
For corrosion analysis, cylinders of Ø 20 × 40 mm height were manufactured. From these cylinders, smaller specimens were cut out. For all specimens, build direction (BD), transversal direction (TD), and normal direction (ND) were marked (see the schematic in Figure 8). Further, blocks of 10 × 10 × 40 mm3 were built for microstructural analysis and hardness measurement. From these blocks, dog bone-shaped specimens for tensile tests were cut via electrical discharge machining (EDM), preserving a distance of at least 1.5 mm to the block’s borders.

2.4. Microstructural Investigations

The microstructure was analyzed by applying a scanning electron microscope (SEM, Tescan Vega CamScan, Dortmund, Germany) operated at a nominal voltage of 30 kV and equipped with an electron backscatter diffraction (EBSD) detector. For EBSD measurements, the specimens were ground and electrolytically polished using STRUERS A2. Data were compiled using TSL OIM software (version 7). EBSD data were also used for grain size determination via the seven line intercept method. Individual grains were defined as microstructural regions separated by misorientations of >15°.
For X-ray diffraction and pole figure measurements, specimens were polished down to P4000 grit size and then vibro-polished to 0.05 µm. For data collection, a Seifert X-ray diffractometer, equipped with a monochromator and a 5 mm poly capillary collimator, operated at 40 kV and 35 mA applying cobalt-Kα radiation was used, and afterwards, the pole figures for the ⟨1 1 0⟩, ⟨2 0 0⟩, and ⟨2 1 1⟩ peaks were compiled using the Mtex Package [56]. The same specimens were then used for hardness measurements and density determination, the latter being conducted through applying the ImageJ add-on “analyze particles”. For analysis, three 100× as well as three 200× light micrographs per specimen were assessed, considering sections of 140 × 106 mm2 and 70 × 53 mm2, respectively, of which the arithmetic mean value was calculated. For hardness measurements (HV1), a Dura Scan DS70 was used. For each specimen, 21 points were distributed on a rectangle, and the distance between the indents as well as to specimen borders was 0.6 mm. The contact time was 10 seconds.

2.5. Electrochemical Corrosion Properties

For the electrochemical corrosion studies, two specimens per condition were tested, whereas the surfaces were prepared and exposed to the electrolyte on the TD-ND plane, i.e., on a plane perpendicular to BD (cf. Figure 8). The specimens were mechanically polished down to P4000 grit size and then vibro-polished to 0.05 µm. The corrosion behavior was investigated in modified simulated body fluid (m-SBF, cf. Table 3) performing electrochemical impedance spectroscopy (EIS) in a three-electrode configuration. A saturated Ag/AgCl electrode (Red Rod, Radiometer Analytical) served as a reference. As a counter electrode, a carbon rod (Goodfellow, Hamburg, Germany) was used. EIS spectra were recorded from 100 kHz to 0.1 Hz with an AC voltage amplitude of +/−20 mV. During the EIS measurement, the aerated electrolyte was kept at 37 °C. After immersion in the m-SBF, microscopic and spectroscopic analyses were performed after removing weakly adhering products by gentle rinsing with distilled water.

2.6. Mechanical Testing

The quasistatic material response was assessed by testing dog bone-shaped specimens (cf. Figure 9) of 4.5 mm2 cross-section ground to P4000 using an MTS Criterion model 43 in displacement control at a cross-head displacement rate of 2 mm∙min−1. The load was applied alongside built direction (BD). The elongation until 30% was recorded using an extensometer directly attached to the specimen surface, whereas above 30%, the displacement was calculated from the cross-head displacement signal considering the nominal gauge length of the specimen. The engineering stress was calculated from the load cell signal and the original cross-section. Two specimens per condition were tested, and the mean values as well as one curve per condition are shown. Afterwards, the fracture surfaces were investigated using the SEM mentioned above, operated at 10 kV.

3. Results

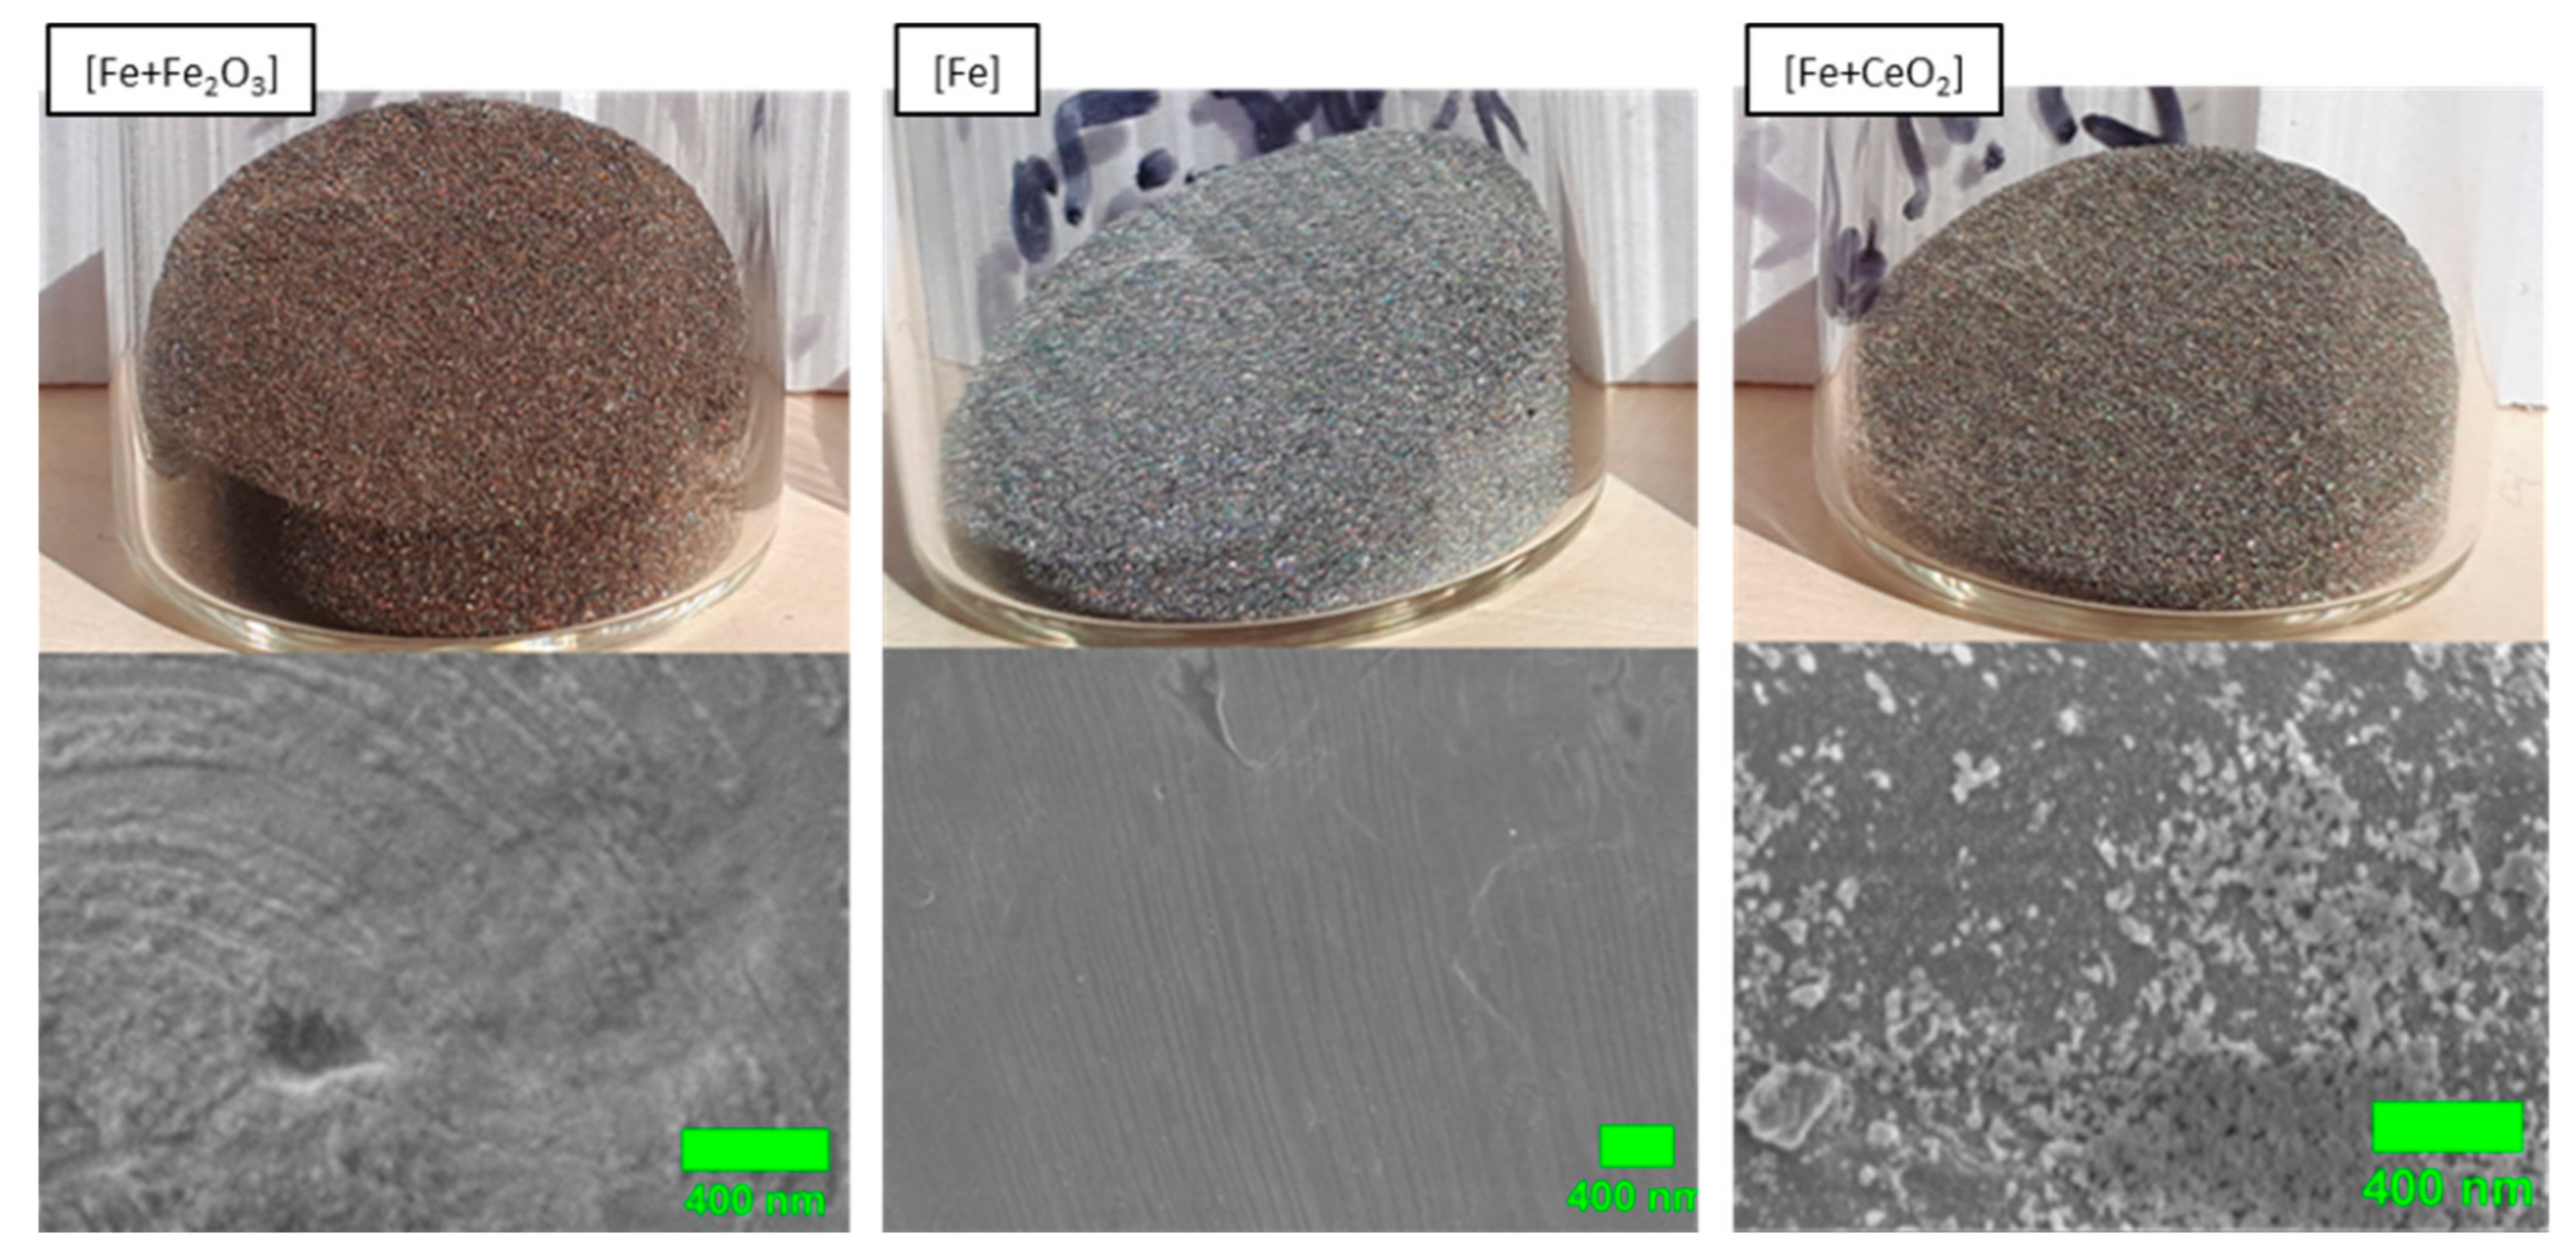
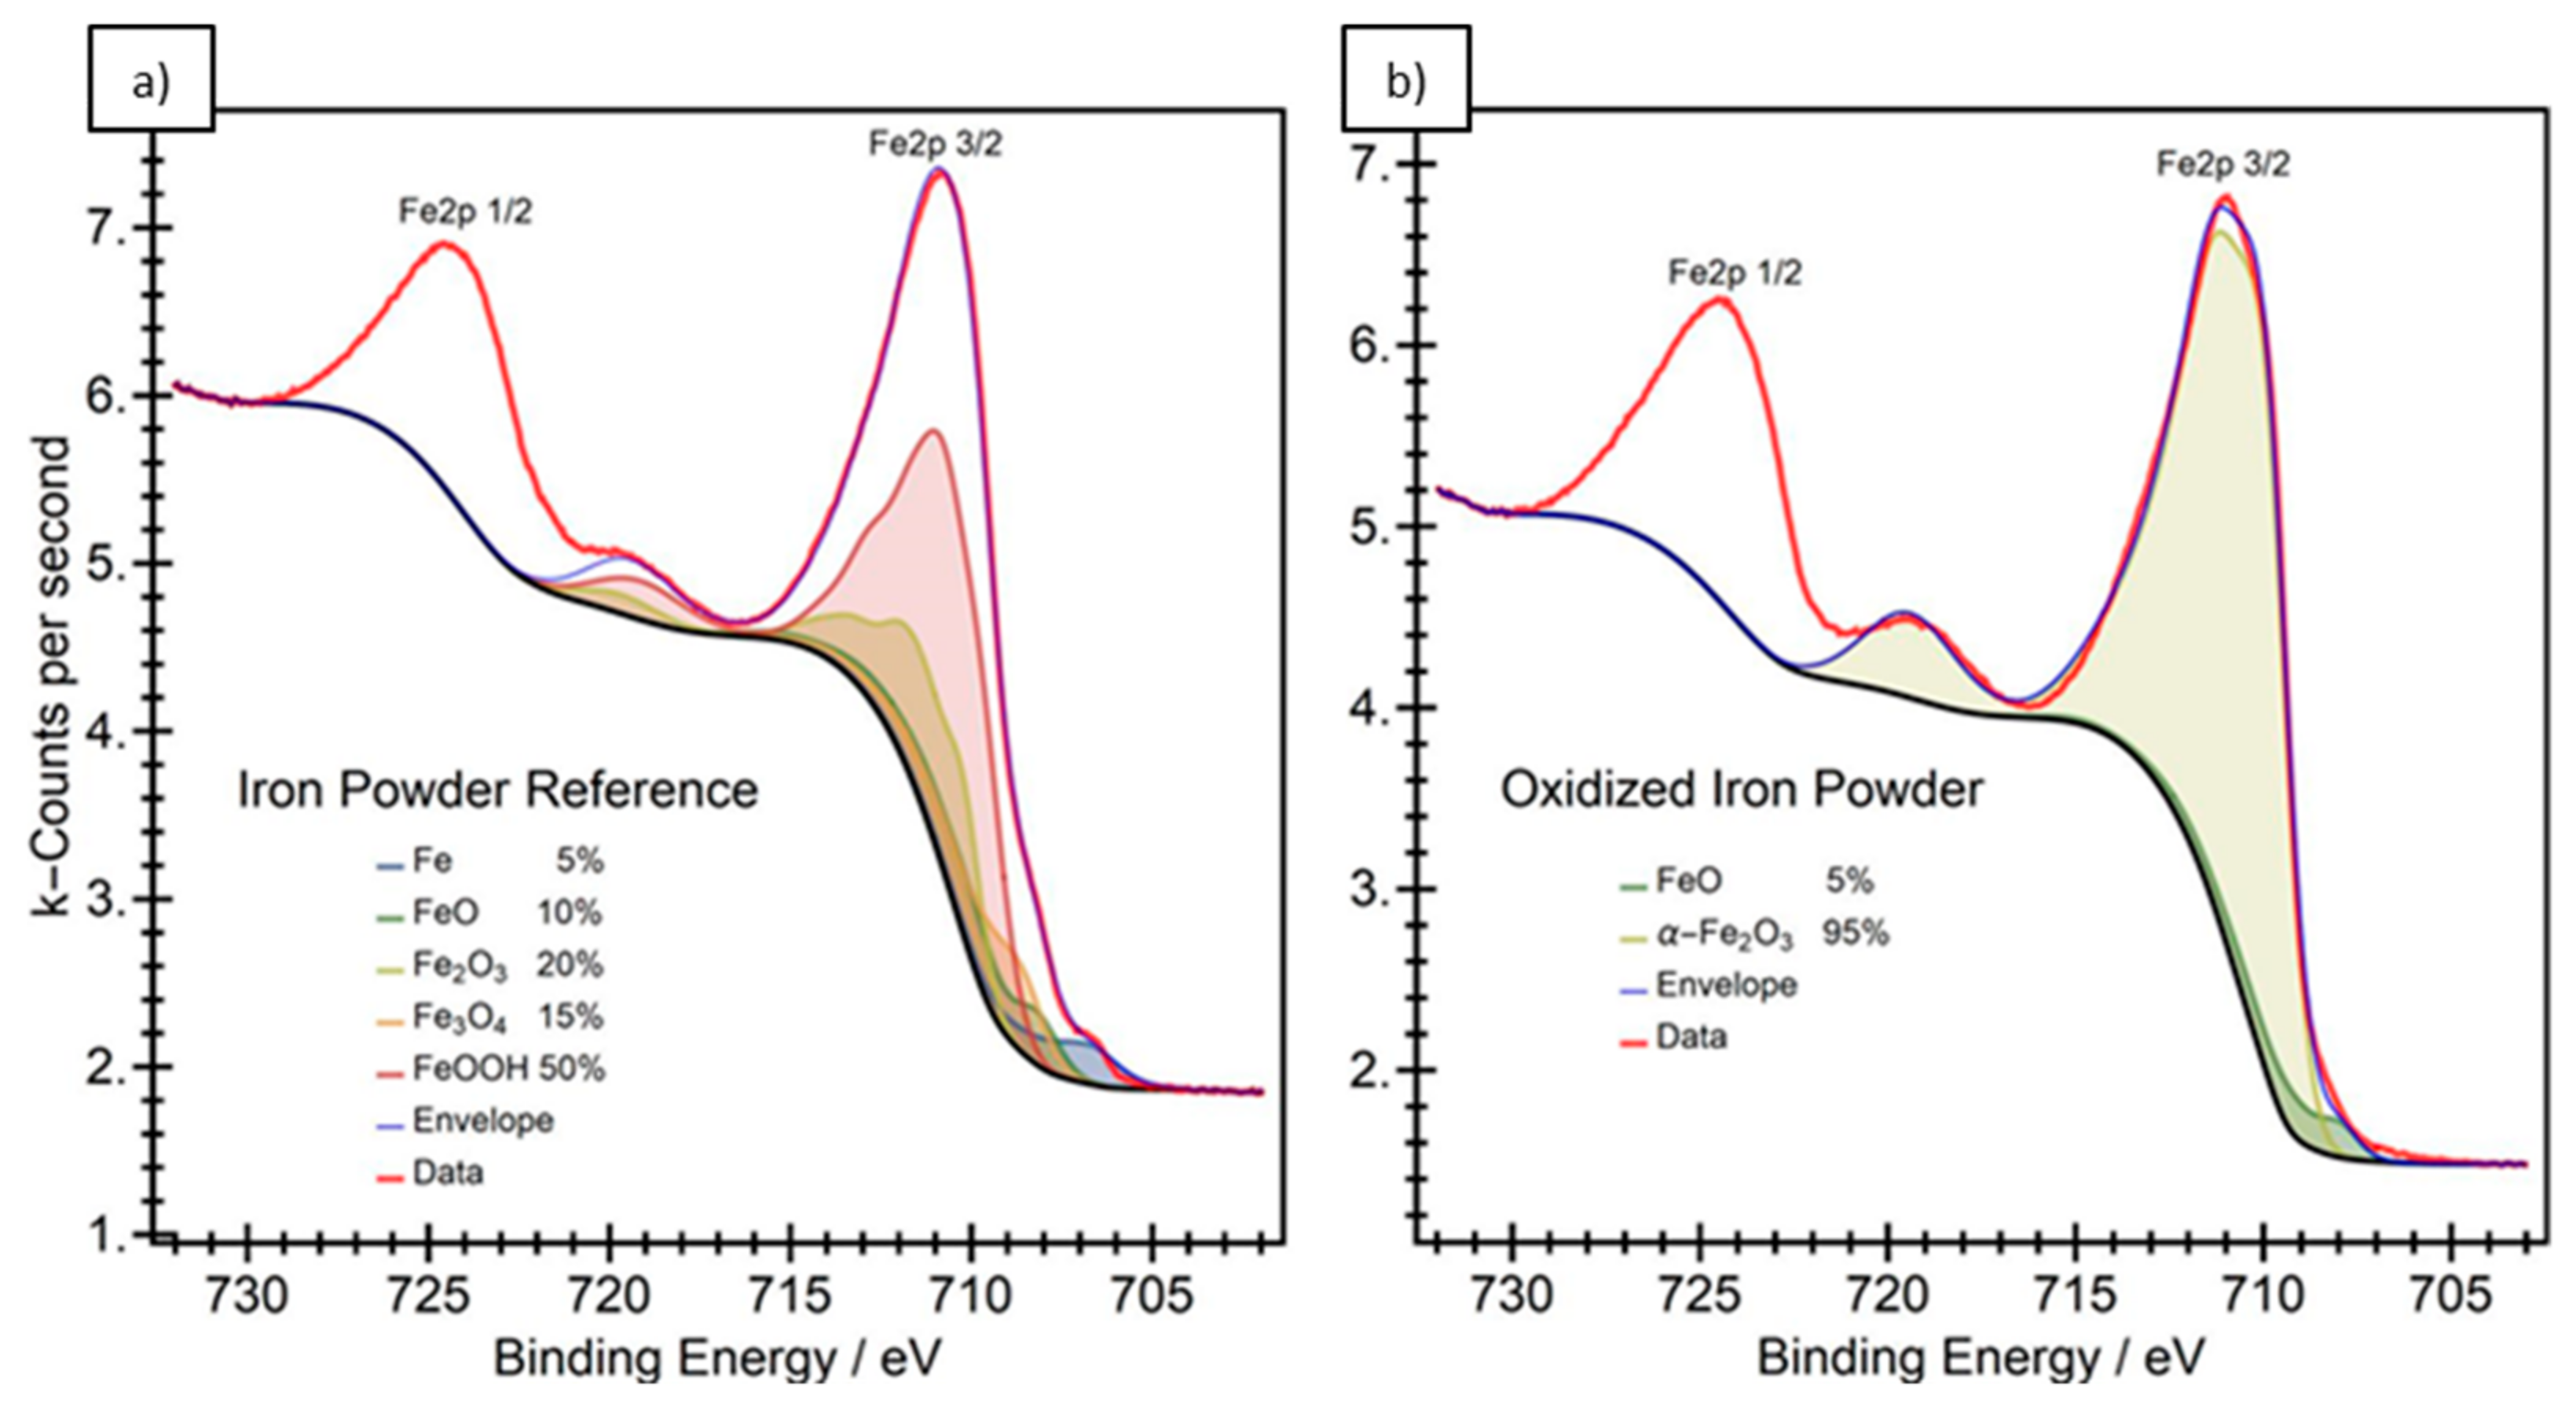
3.1. Particle Surface Structure

Table 4 shows the surface composition of the modified particles in comparison to the non-modified, as-atomized Fe powder determined by means of XPS. The surface composition indicates that both the surface oxidation process and the inoculation with CeO2 NP led to a change in the surface chemistry. The surface coverage with carbon in all cases was in a typical range for ex situ-studied oxide surfaces.
Considering the Fe2O3 initial modification, the comparison of the Fe2p peak before and after oxidation highlights the increase of the surface oxide layer thickness and its change in composition (cf. Figure 2). Prior to the oxidation process, the metallic contributions of Fe, FeII, and FeIII states were able to be detected, whereas after thermal oxidation, mainly the FeIII oxide contribution was observed. For the as-atomized powder, the formation of oxihydroxides was indicated in the XPS spectrum, while for the thermally oxidized powder, the formation of Fe2O3 was mainly seen [58].

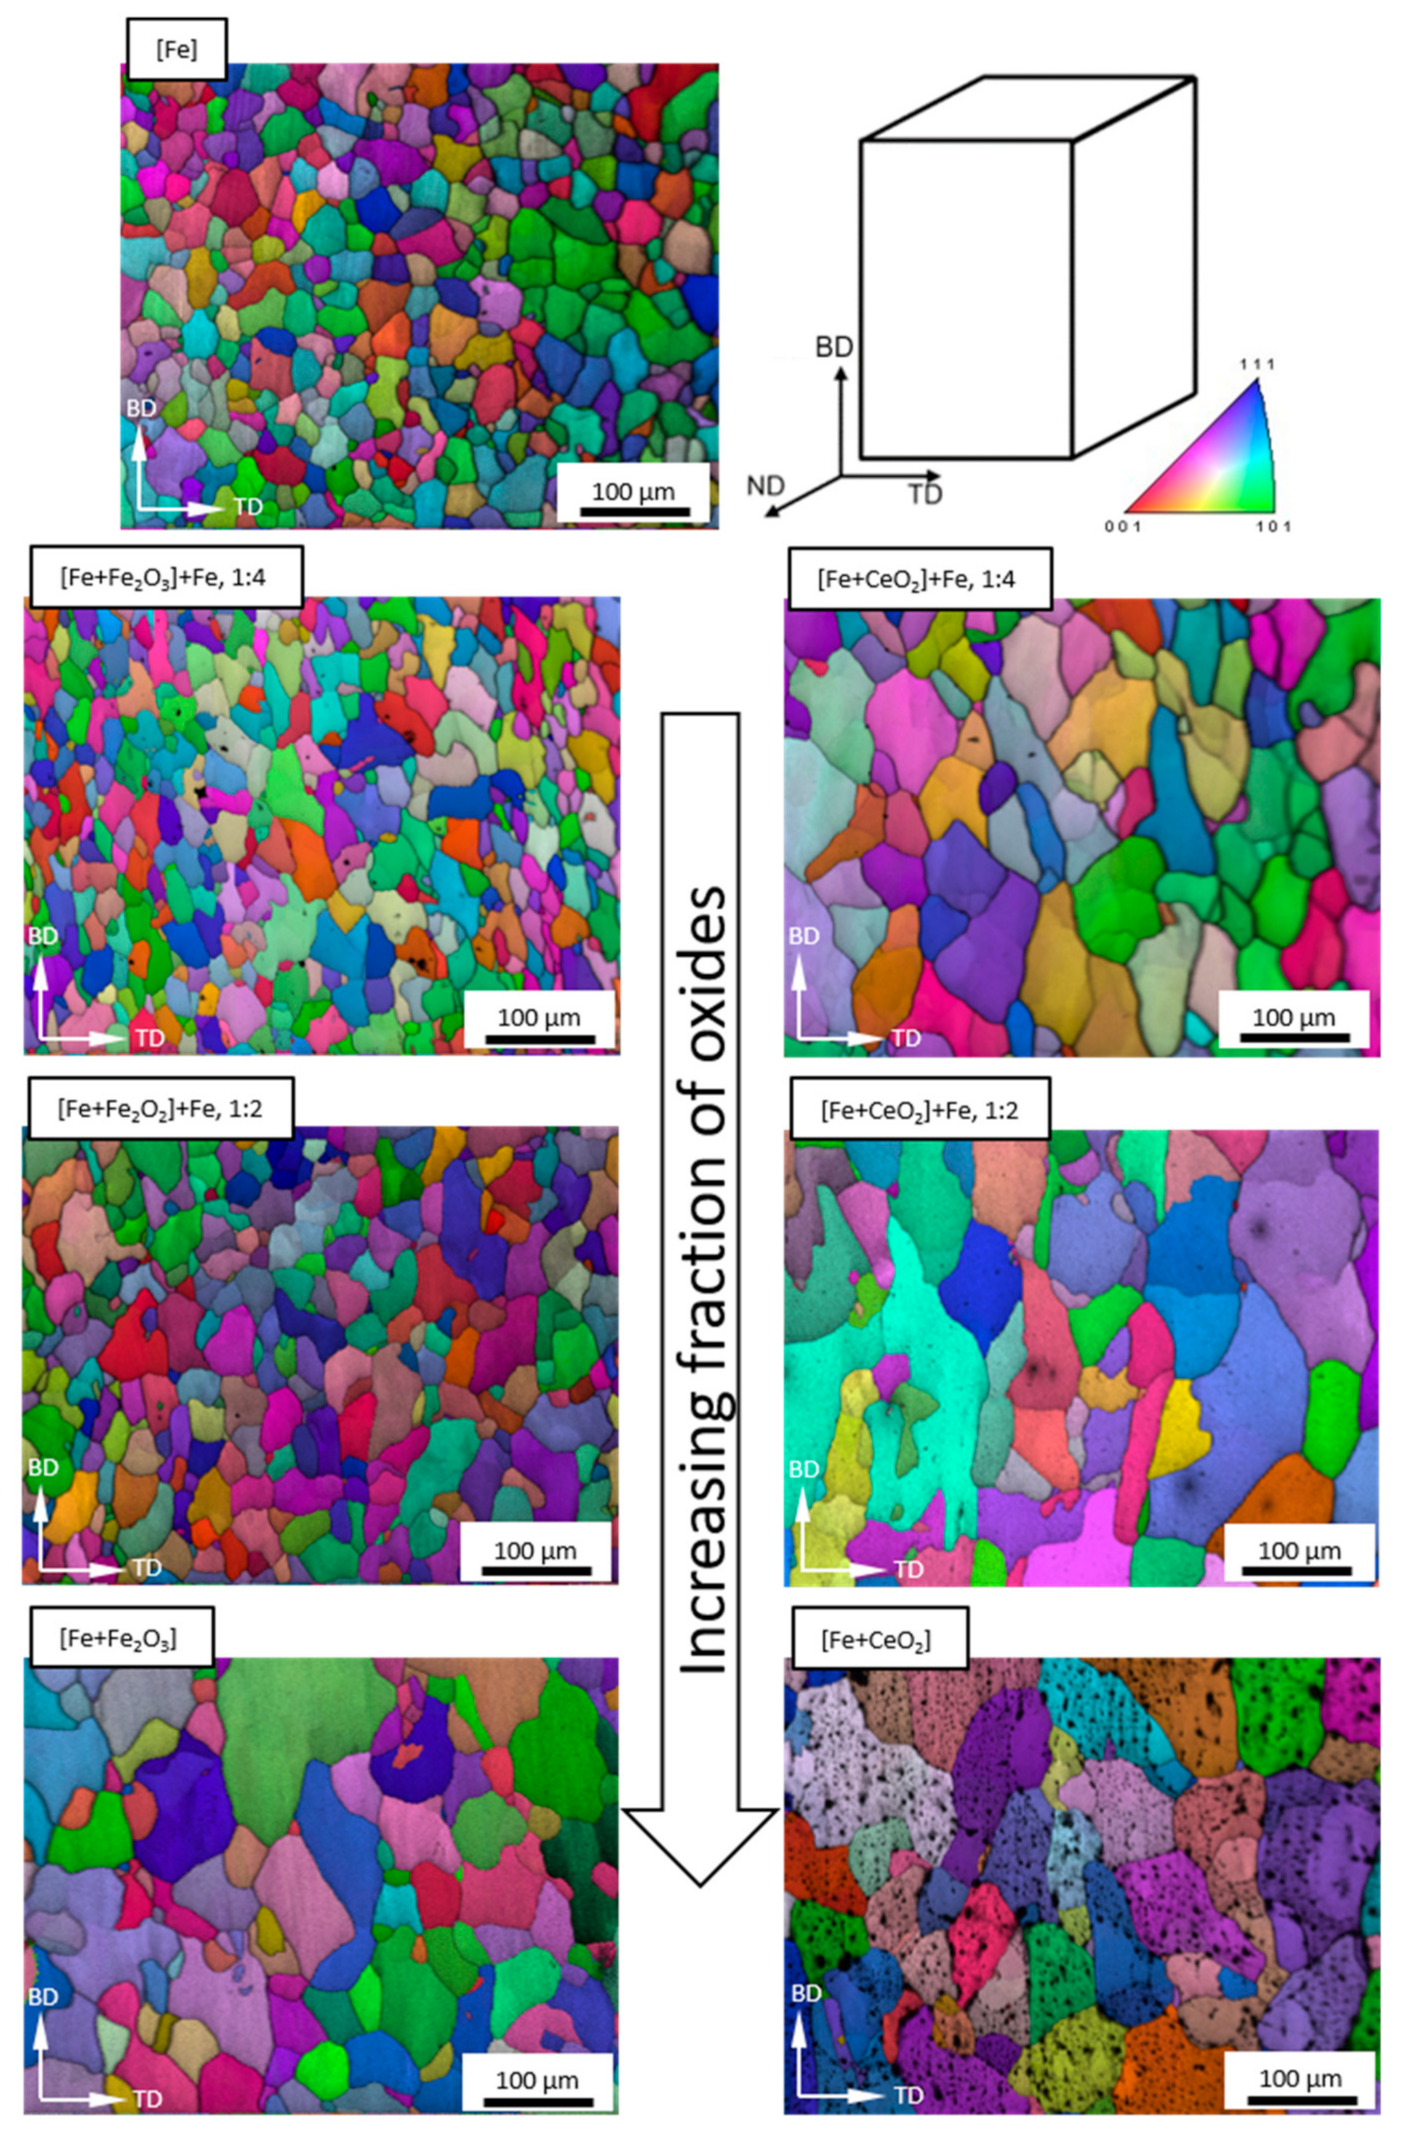
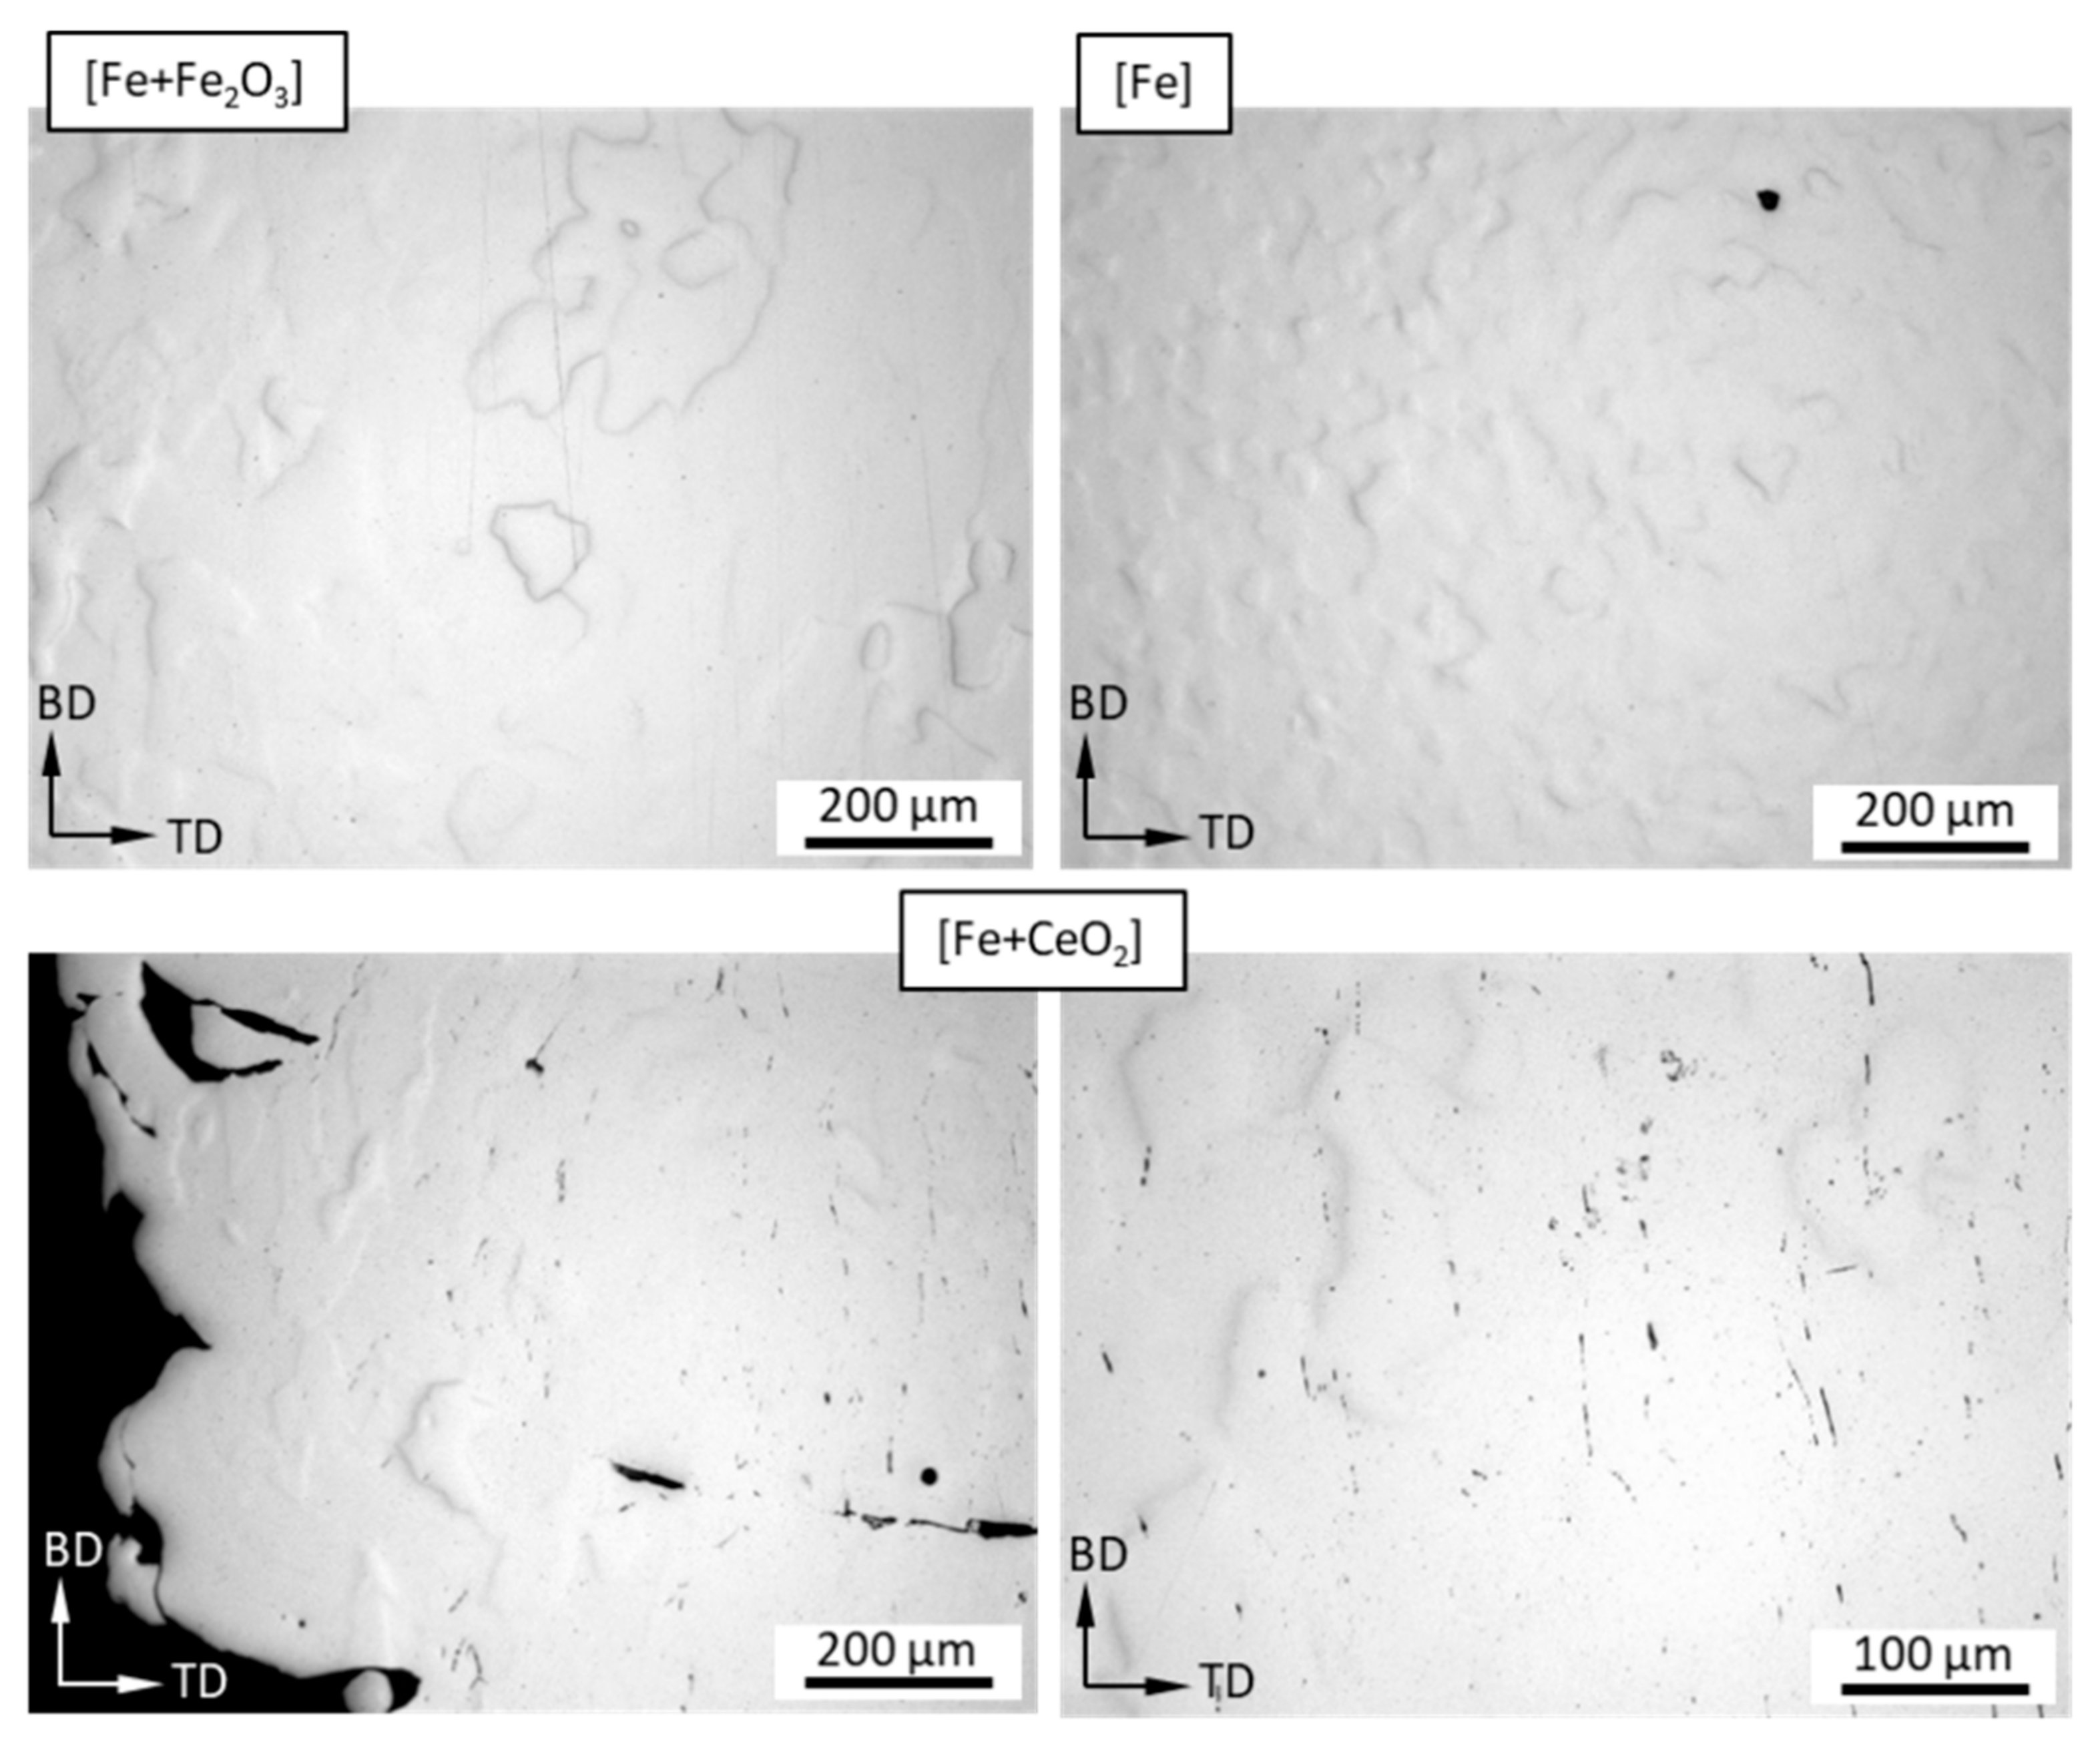
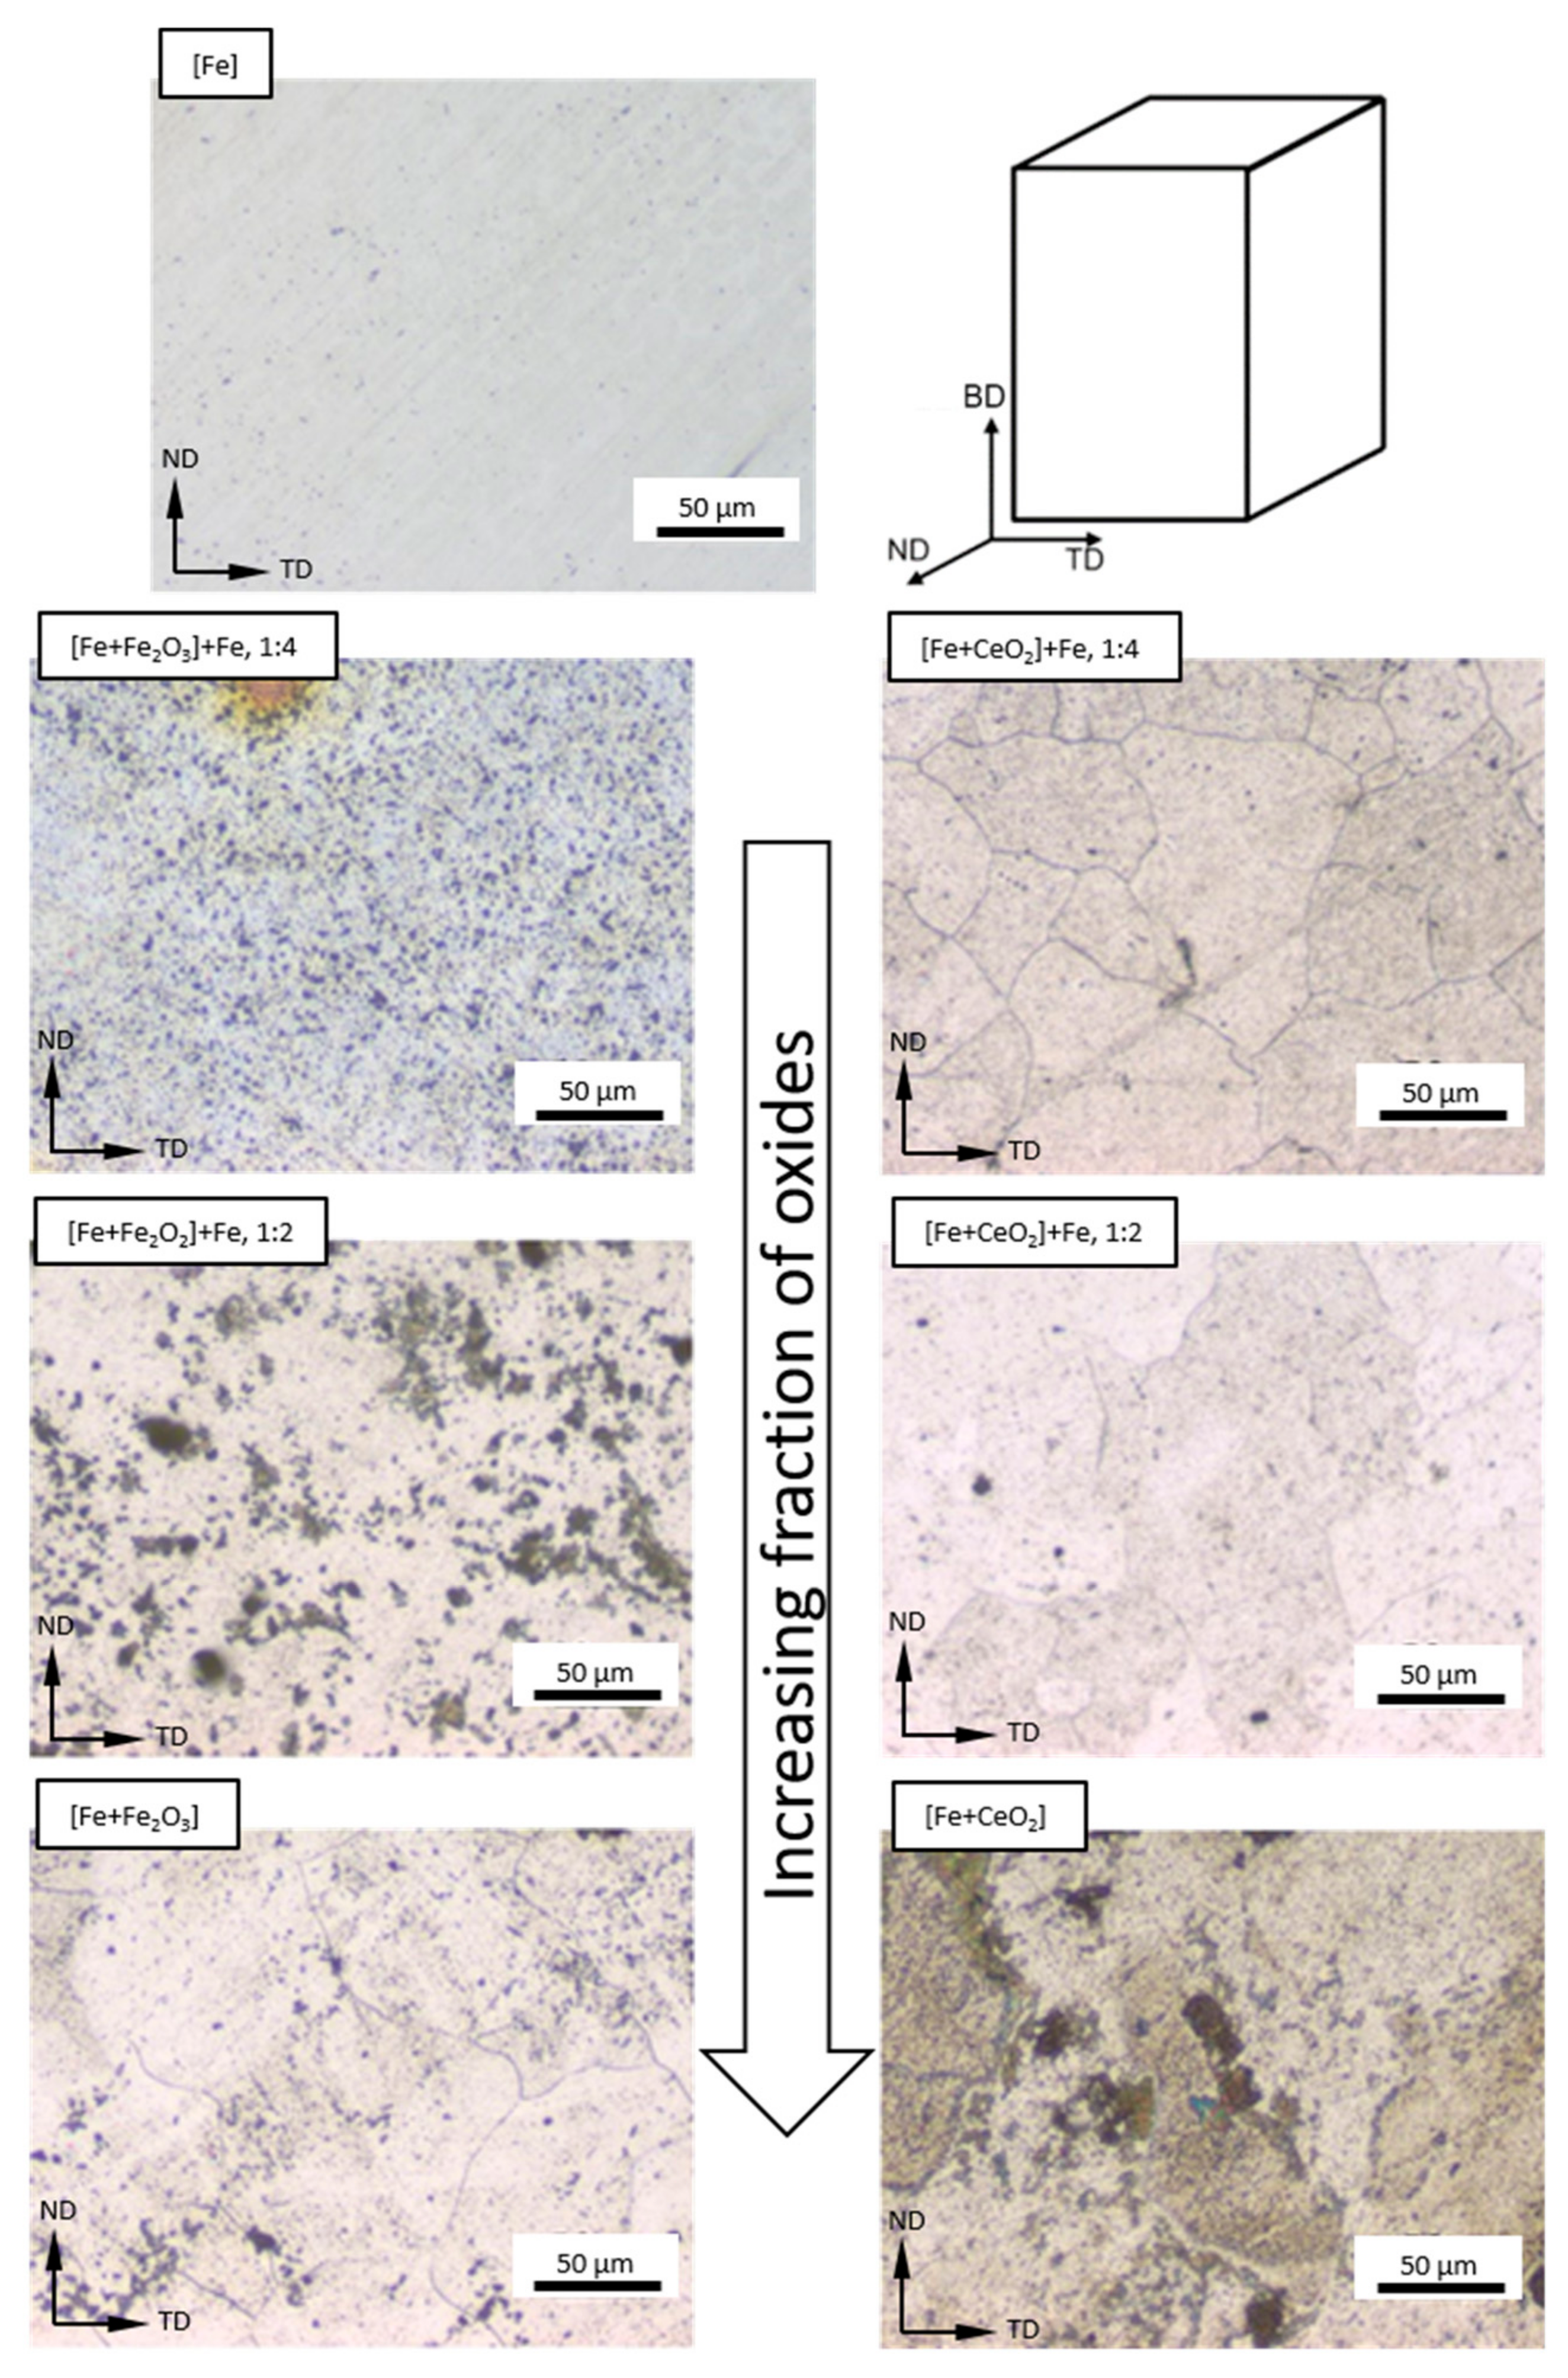
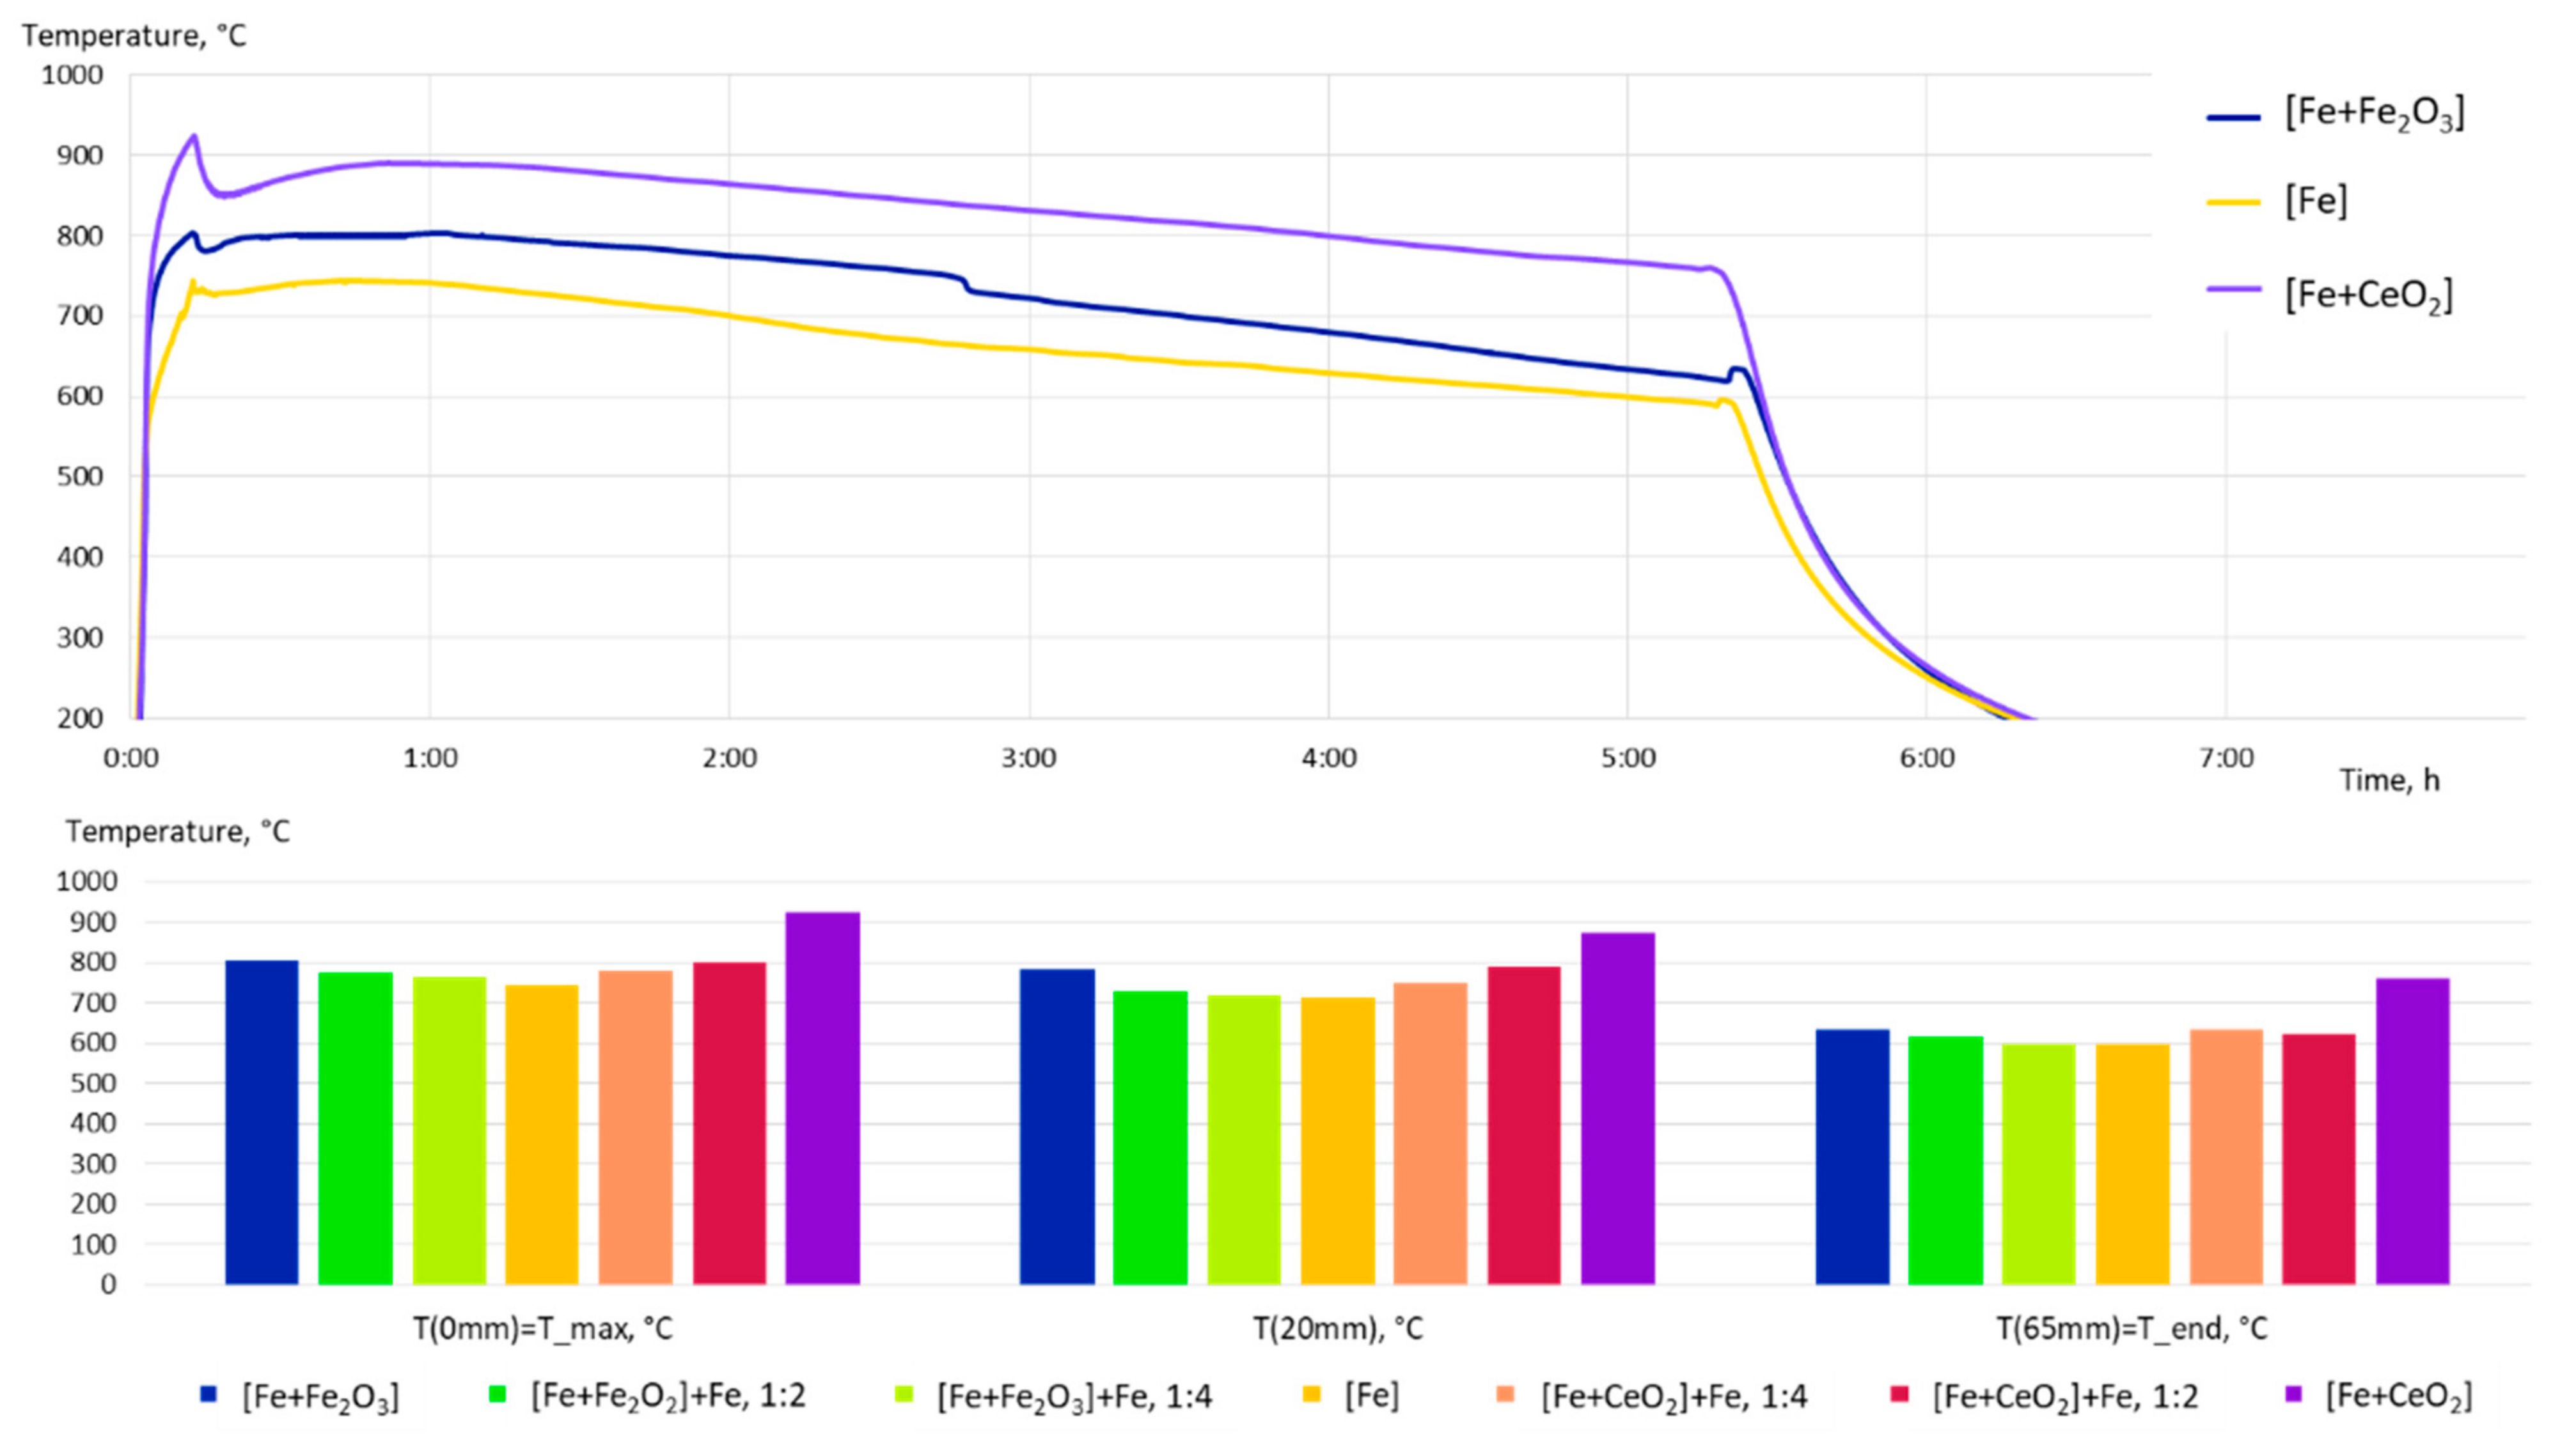
3.2. Microstructure Following E-PBF Processing

The EBSD measurements shown in Figure 3 depict the microstructure of the seven material conditions containing different amounts of Fe2O3 and CeO2. As can be deduced from the pure Fe specimen, the application of the E-PBF processing parameters detailed in the Materials and Methods section (Table 2) hardly promoted any grain elongation alongside the build direction. The grain morphology is homogeneous and globular. Adding oxide particles led to a more heterogeneous grain morphology, wherein grain shapes became more irregular, and, especially in case of the CeO2 modifications (Figure 3, right-hand side), slightly elongated along BD (vertical). For texture analysis, pole figures were measured by XRD (not shown). In this case, high texture intensities were seen.
Focusing on the grain size (cf. also Figure 5b for quantitative assessment), a distinct influence of the individual chemical composition is noticeable. Obviously, the CeO2 modifications are prone to coarsening. On the contrary, a small fraction of Fe2O3 led to slightly smaller grain sizes compared to the as-atomized cp Fe.
From Figure 3, one can also deduce that with increasing CeO2 fraction, the degree of porosity increased likewise, especially in the [Fe + CeO2] condition. The pores were analyzed using optical micrographs of the ground and polished cubes (see representative micrographs shown in Figure 4). In contrast to the Fe- and Fe2O3-modified specimens being characterized by relatively low degrees of porosity, the [Fe + CeO2] specimens showed a variety of defects, most significantly at the highest CeO2 level. As shown in Figure 4, the near surface lack of fusion defects expanded from the AM-specific surface (note that no contour parameters were applied in the present work) and reached deep into the material (see lower left), which underlines the importance of keeping a distance from the build’s borders for further electrochemical and mechanical testing. In the interior of the material, thin defects oriented alongside BD are visible in the [Fe + CeO2] condition.
For quantitative analysis of the porosity of the seven material conditions, the relative density is shown in Figure 5a. It was obvious that E-PBF processing with unchanged parameters led to an increased level of porosity in the CeO2 modified conditions, whereas the conditions with the native oxide layer showed hardly any susceptibility to the formation of defects. Still, it has to be emphasized that even the condition being characterized by lowest relative density reached values of almost 99.5%.

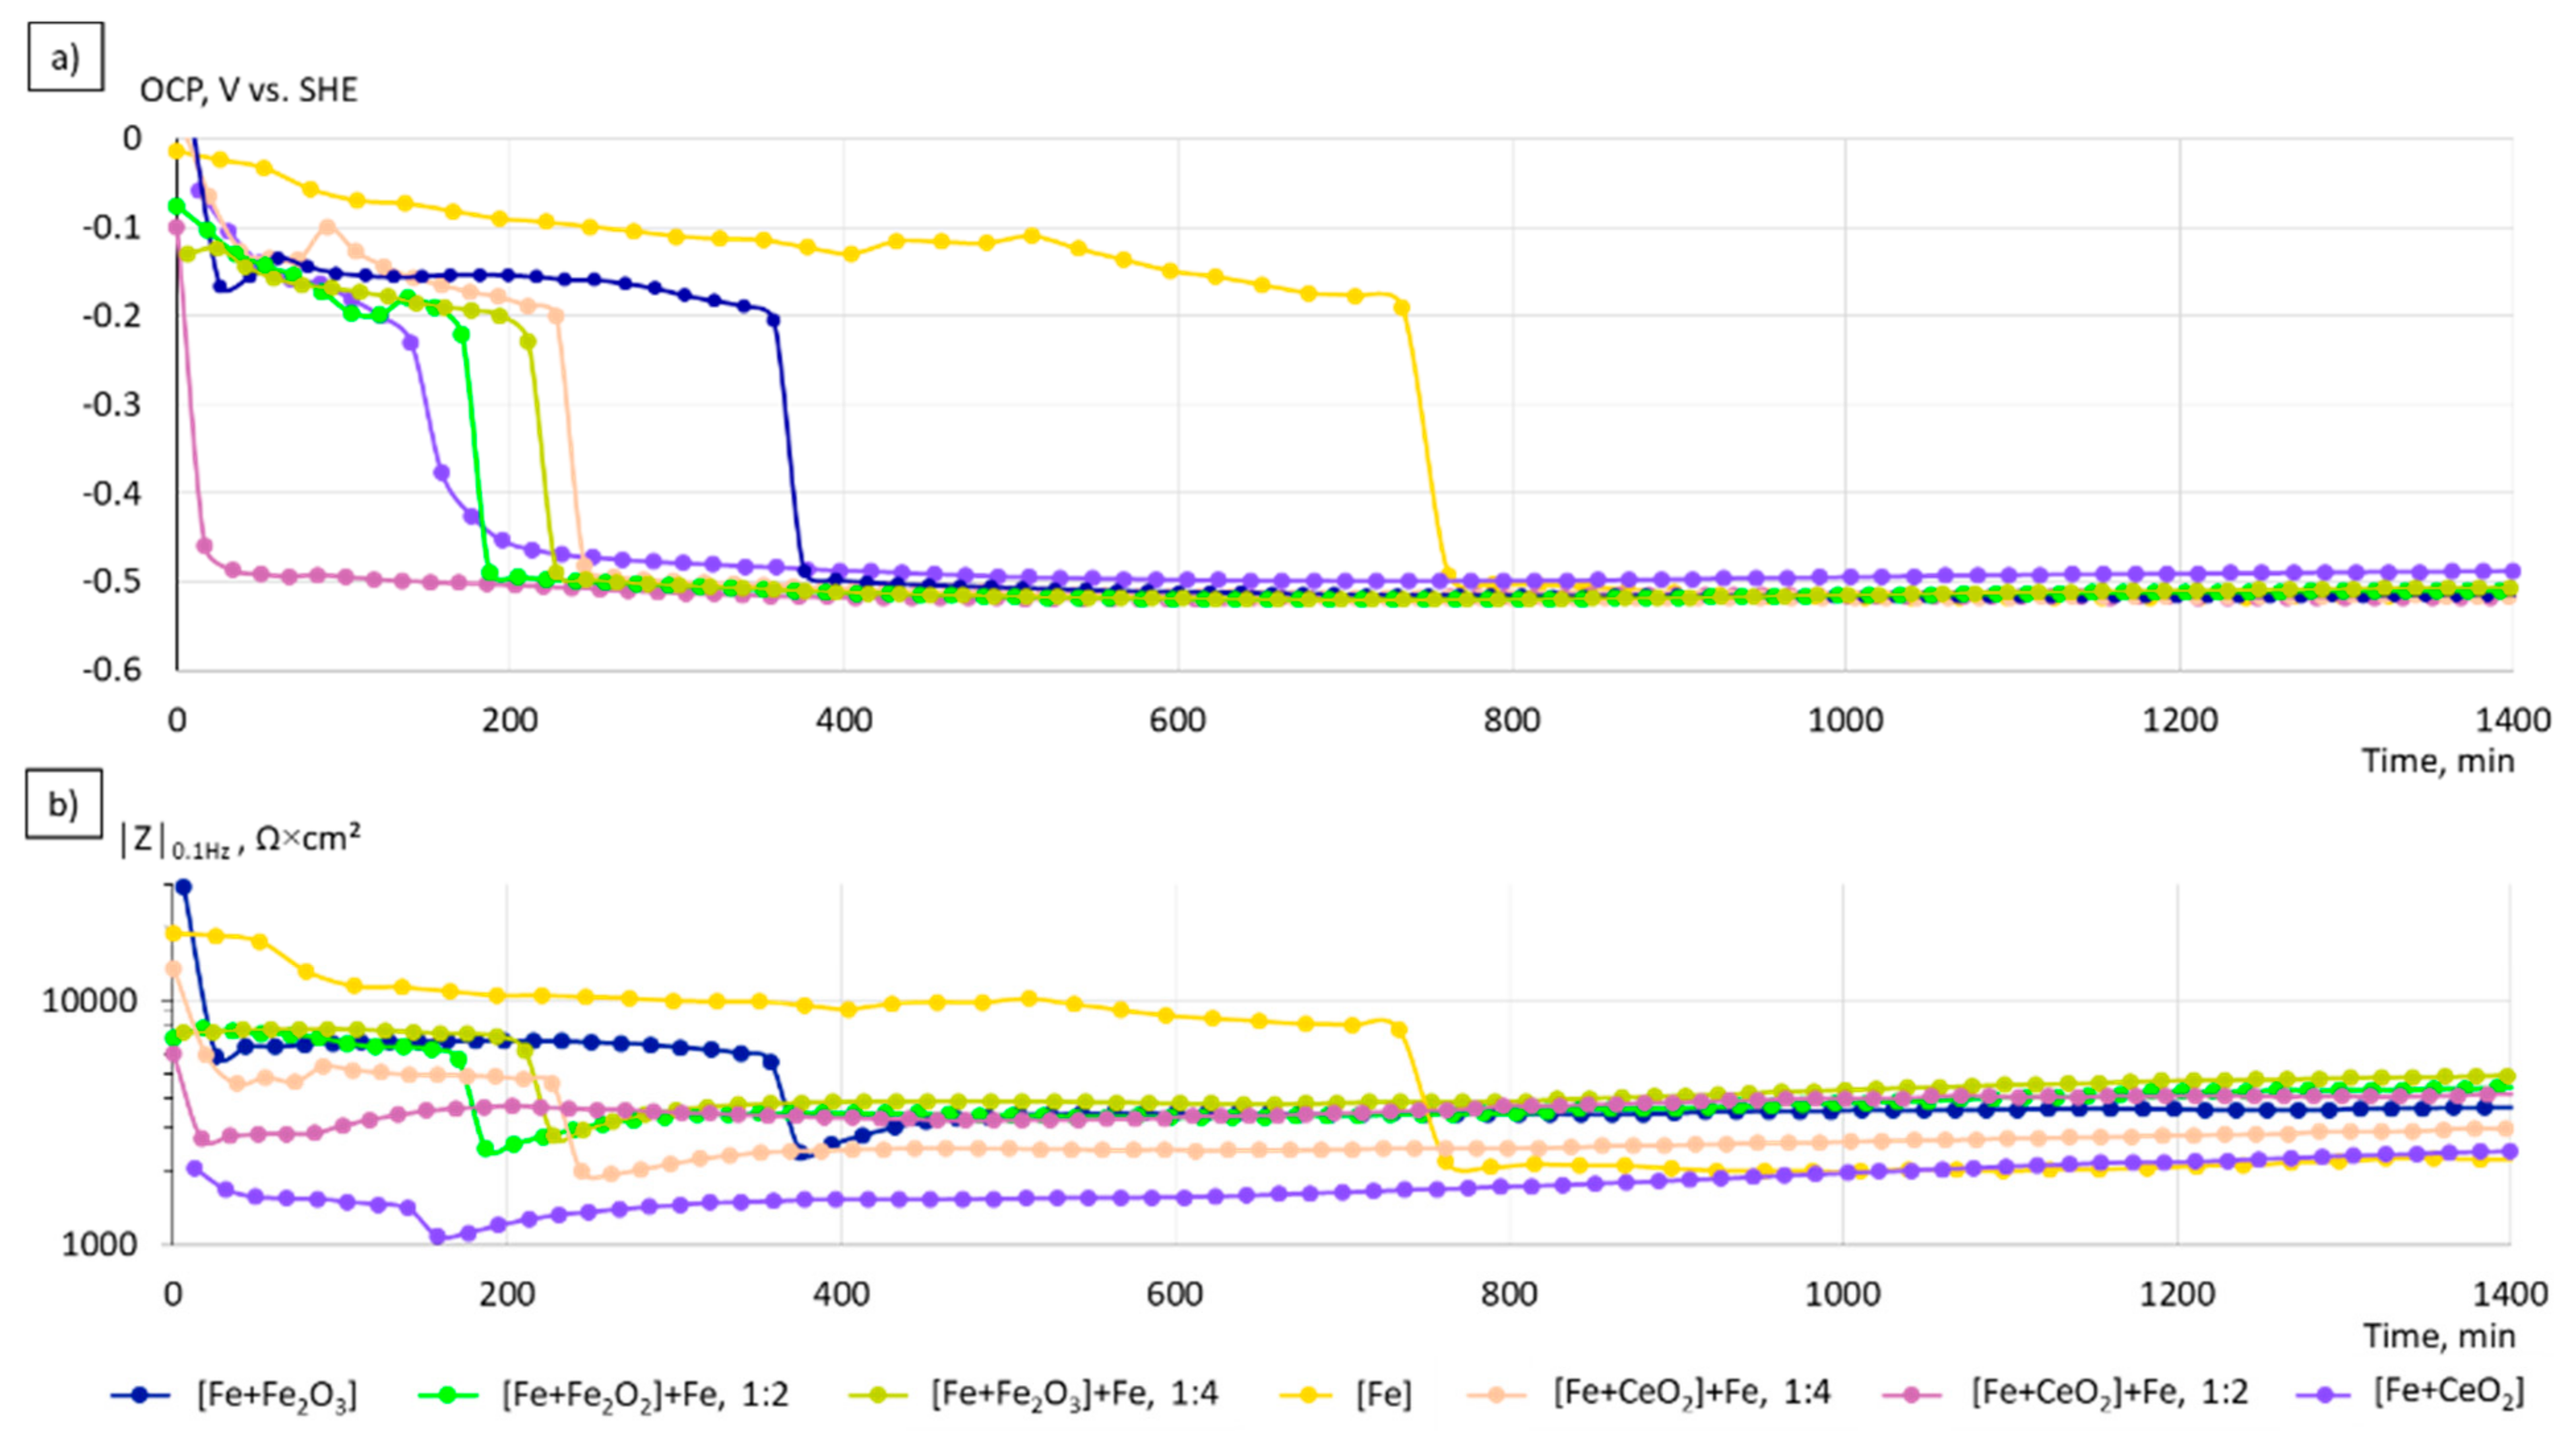
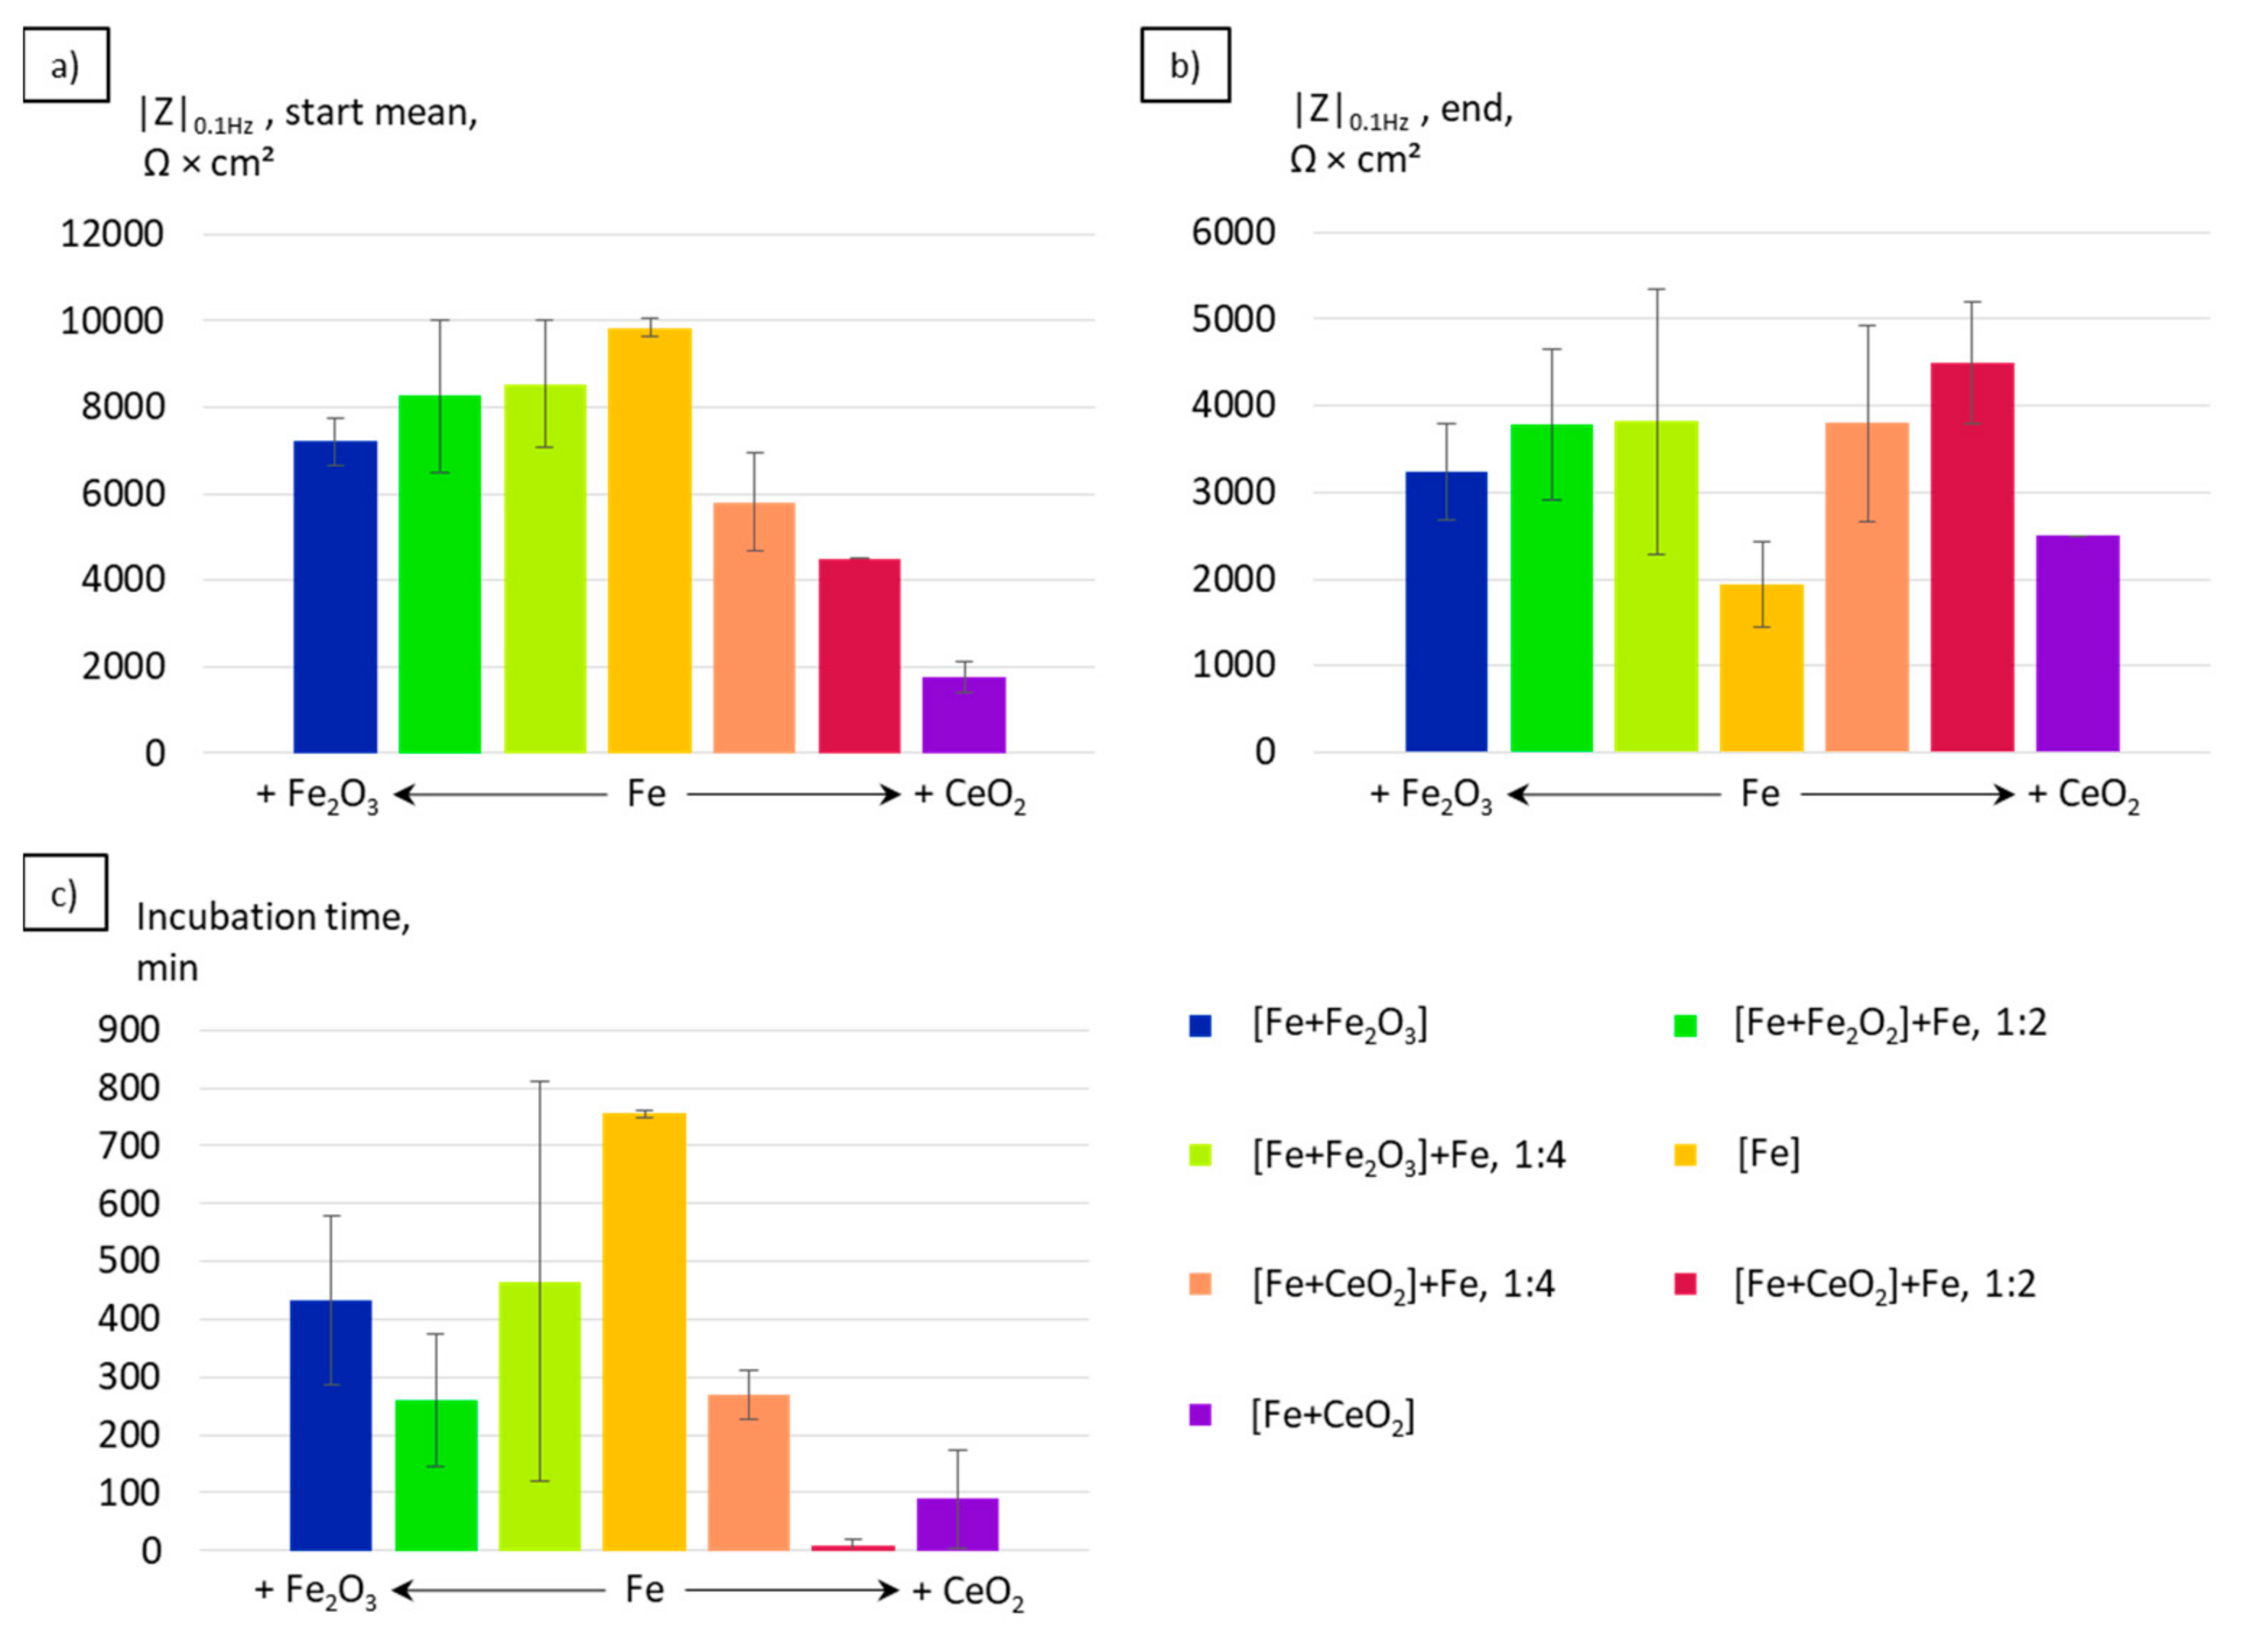
3.3. Electrochemical Corrosion Analysis

Electrochemical analysis of the investigated specimens was performed in m-SBF. Figure 6 shows the development of the open circuit potential (OCP) and the low-frequency impedance of the seven material conditions over 24 h. The corresponding impedance spectra for the different specimens right after immersion (0 min) and after 1435 min of immersion in m-SBF are presented in the Supplementary Materials (Figures S1–S7).
The pure Fe specimen showed an incubation time of about 750 min, as indicated by the steady decline of the OCP in this time range. After this period of time, a sharp drop of the OCP along with a drop in the low-frequency impedance was observed. In case of the modified material conditions, the incubation time was significantly smaller. Here, the [Fe + CeO2] + Fe, 1:2 specimen showed an almost instantaneous reaction. Interestingly, the specimen with highest CeO2 content possessed a very low impedance right from the start of data collection (Figure 6b).
The respective information concerning the impedance values at the beginning and the end of the immersion, as well as the incubation time, are quantitatively analyzed in Figure 7. Again, these results indicate that the incubation time, i.e., the time required for the initiation of significant corrosion rates, can be significantly decreased by the powder modifications. In this case, modification by CeO2 seemed to be very efficient, and incubation times and scatter were well below those values obtained for the Fe2O3 modified conditions.
Obviously, the differences in corrosion kinetics became less pronounced after extended immersion times. From the presented data, it can be concluded that, in particular, the initial corrosion rate in combination with the incubation time were affected by the powder modifications.
The materials loss rates Δd (Table 5) were calculated on the basis of the evaluation of icorr values according to the following formula:
Δ d = i c o r r   M   Δ t ρ   z   F
where M is the molar mass of iron, ρ is the density of iron, z is chosen as 2 (simplification: corrosion current is related to the oxidation of Fe0 to Fe2+), Δt is the time of immersion, and F is the Faraday constant.
It becomes obvious that for all compared specimens, except for Fe + CeO2, the materials loss rate was higher for longer times of immersion. The addition of CeO2 tended to increase the loss rate, at least in the initial phase of the immersion. Most probably, this enhancement of the corrosion rate was based on micro galvanic coupling. Furthermore, the material conditions modified with CeO2 showed the highest corrosion rates in the initial phase of the immersion. After an immersion time of 1435 min, the material loss rates of the different material conditions were almost equal, except for those of pure Fe and Fe + CeO2, which were clearly accelerated. The calculated material loss rates Δd, as shown in Table 5 in millimeters per anno, are in good agreement with reported data for iron in m-SBF solution [60].
Figure 8 displays optical micrographs of the seven conditions after exposure to the electrolyte. Here, a more severe corrosive attack at the surfaces of the specimens processed with modified powder can be seen. Local dark spots on the specimen surfaces indicate the localized presence of corrosion products. In the case of the modifications with the highest content of CeO2, a preferred corrosion attack at grain boundaries was able to be deduced.

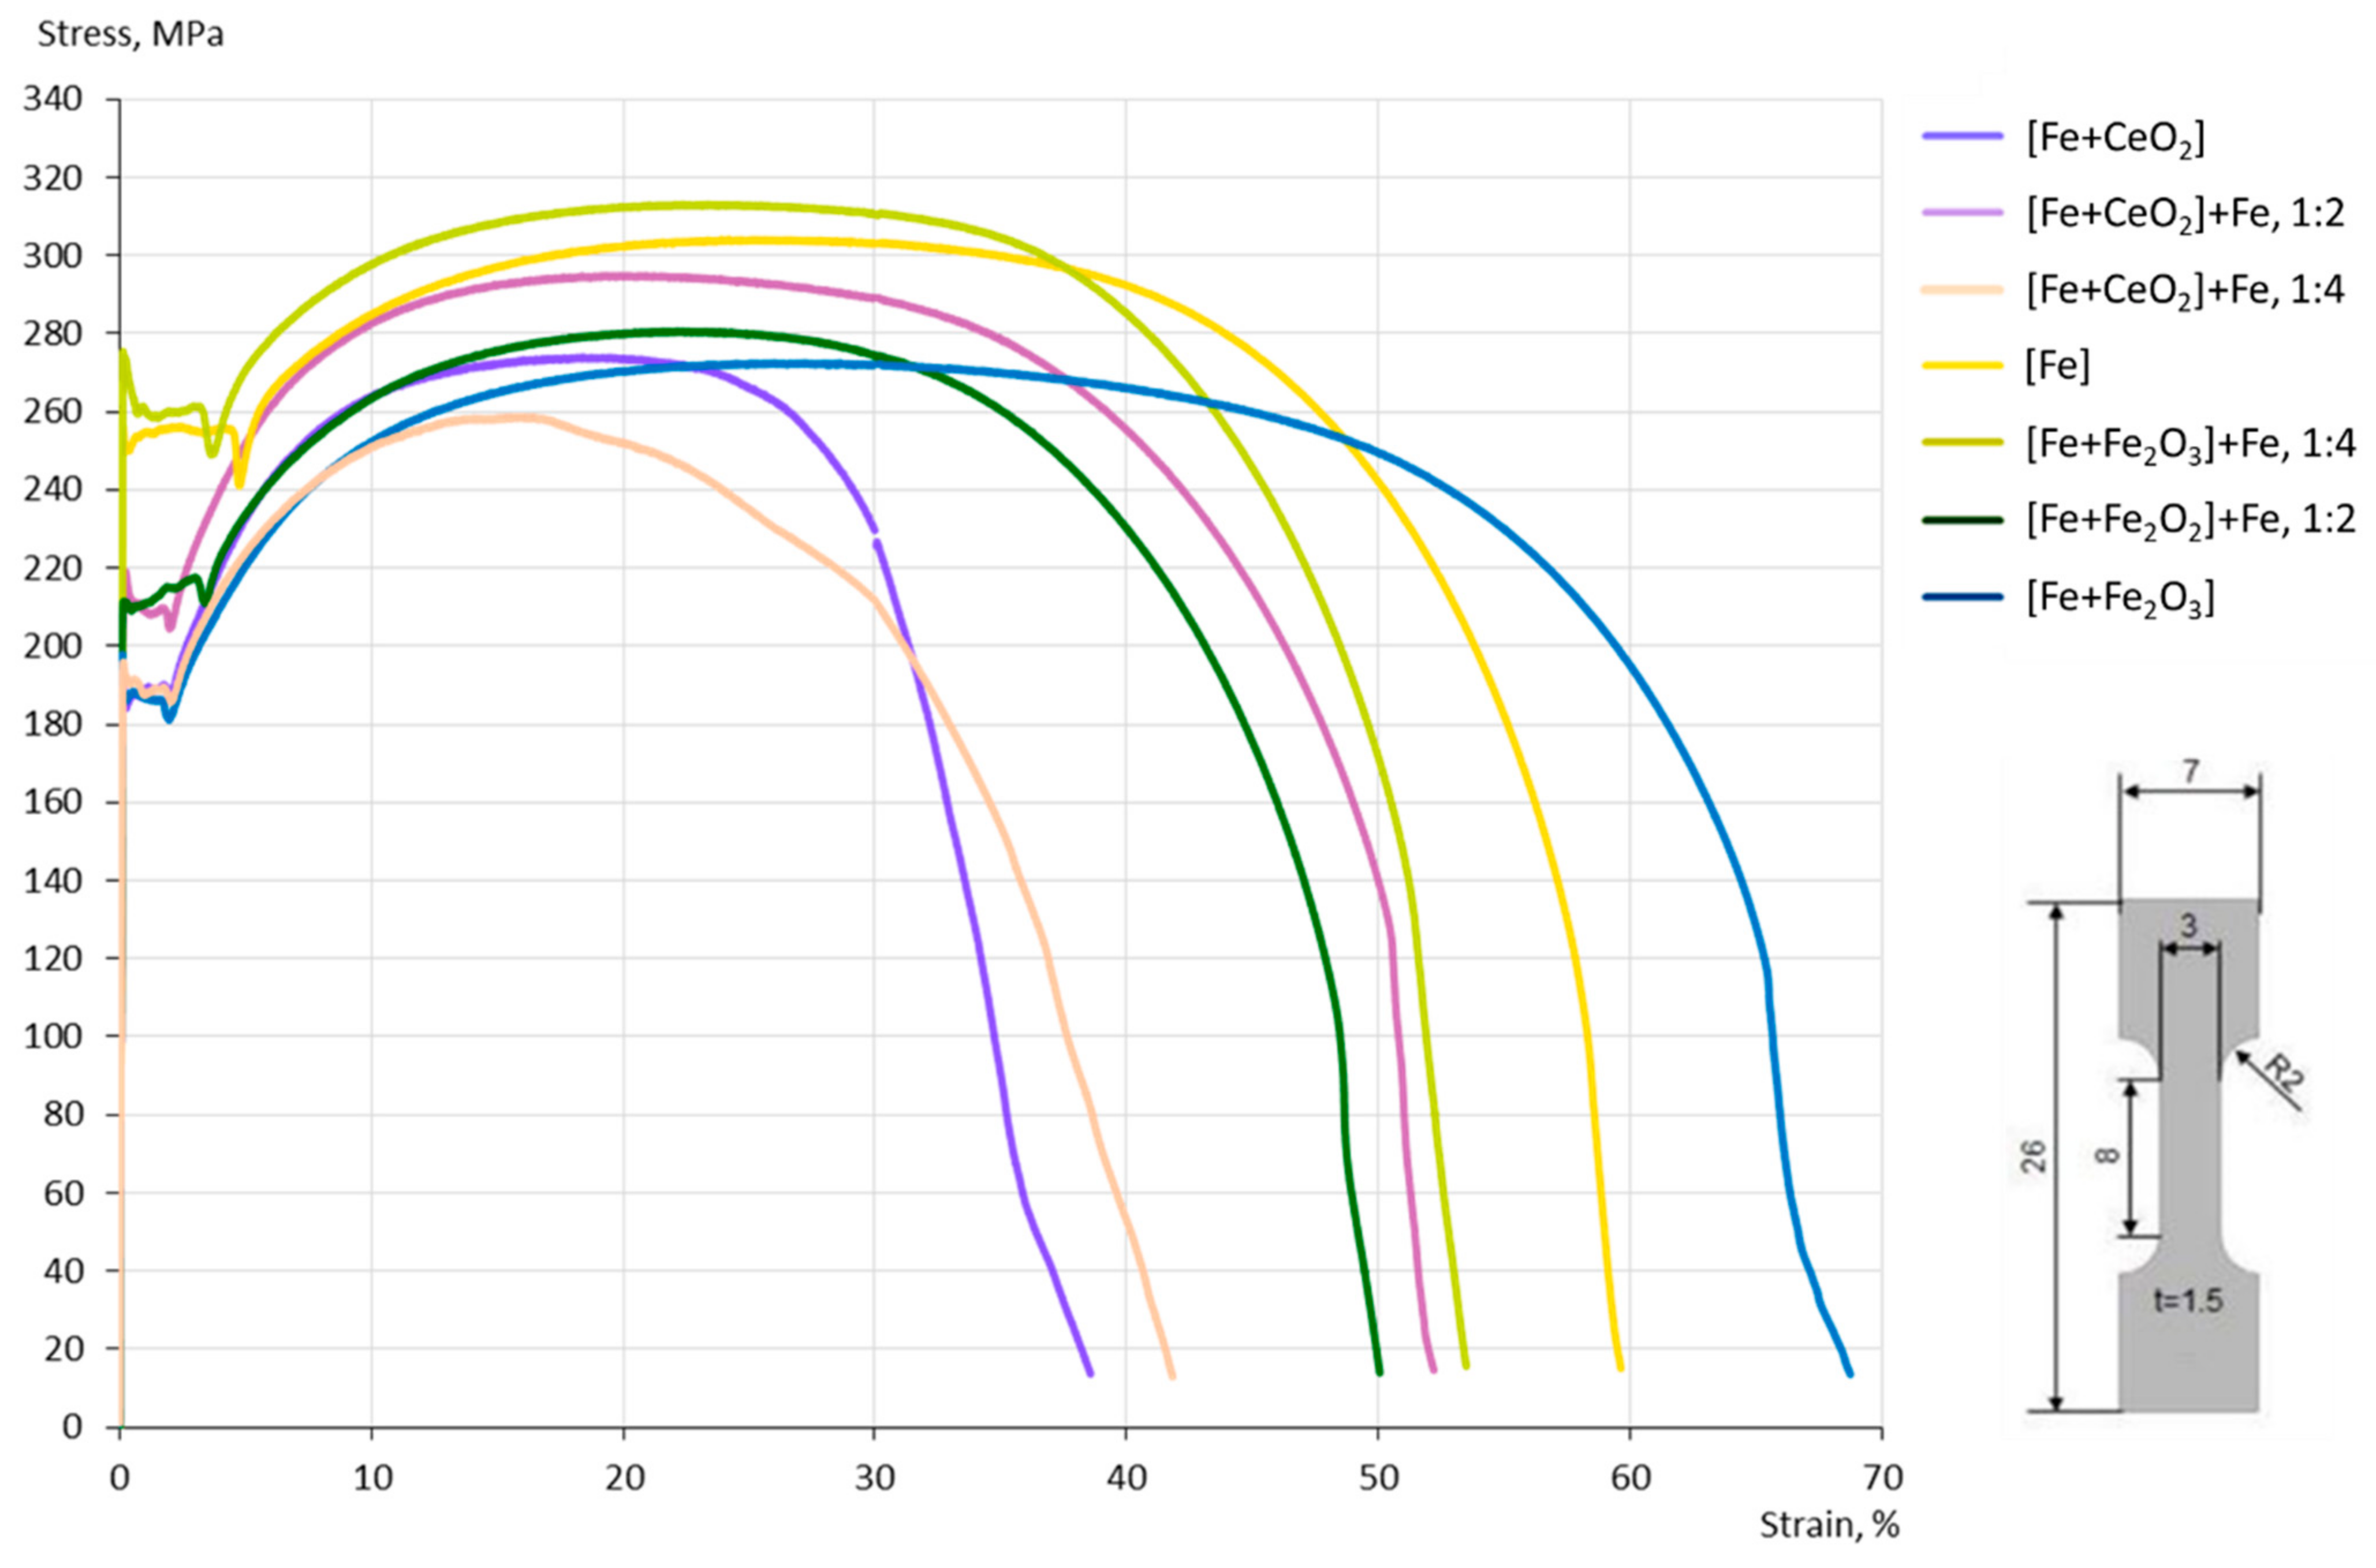
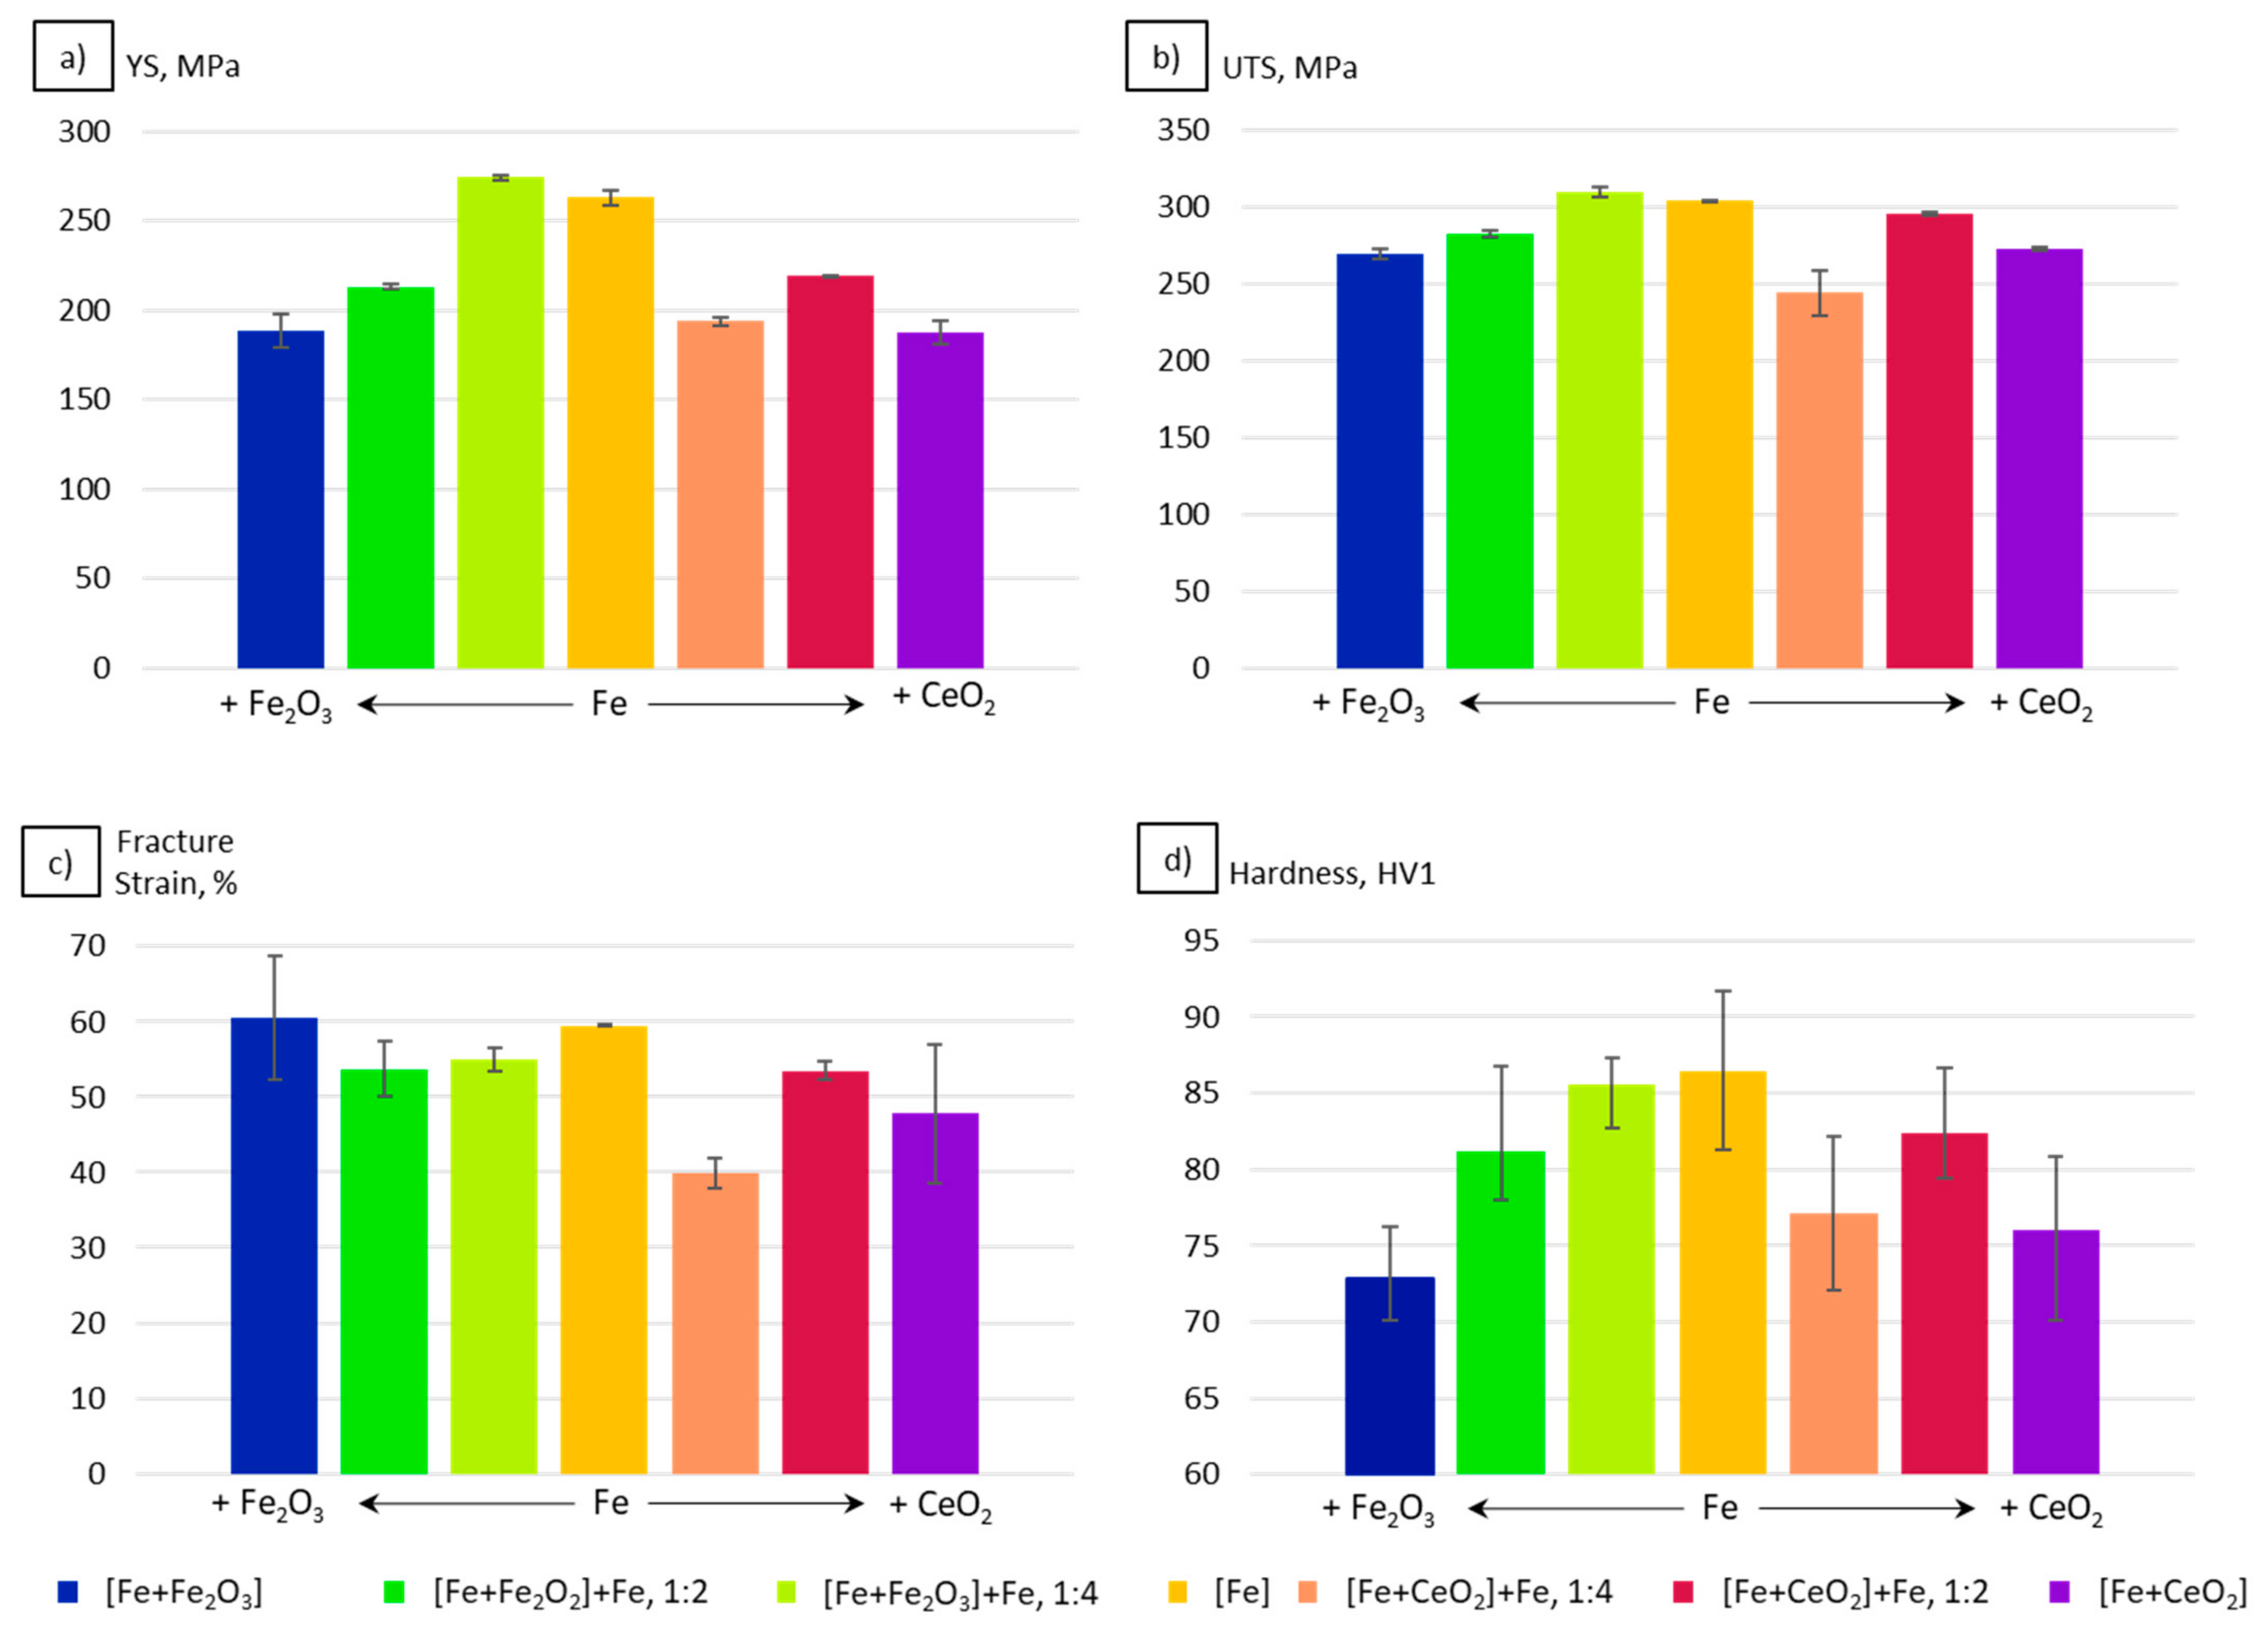
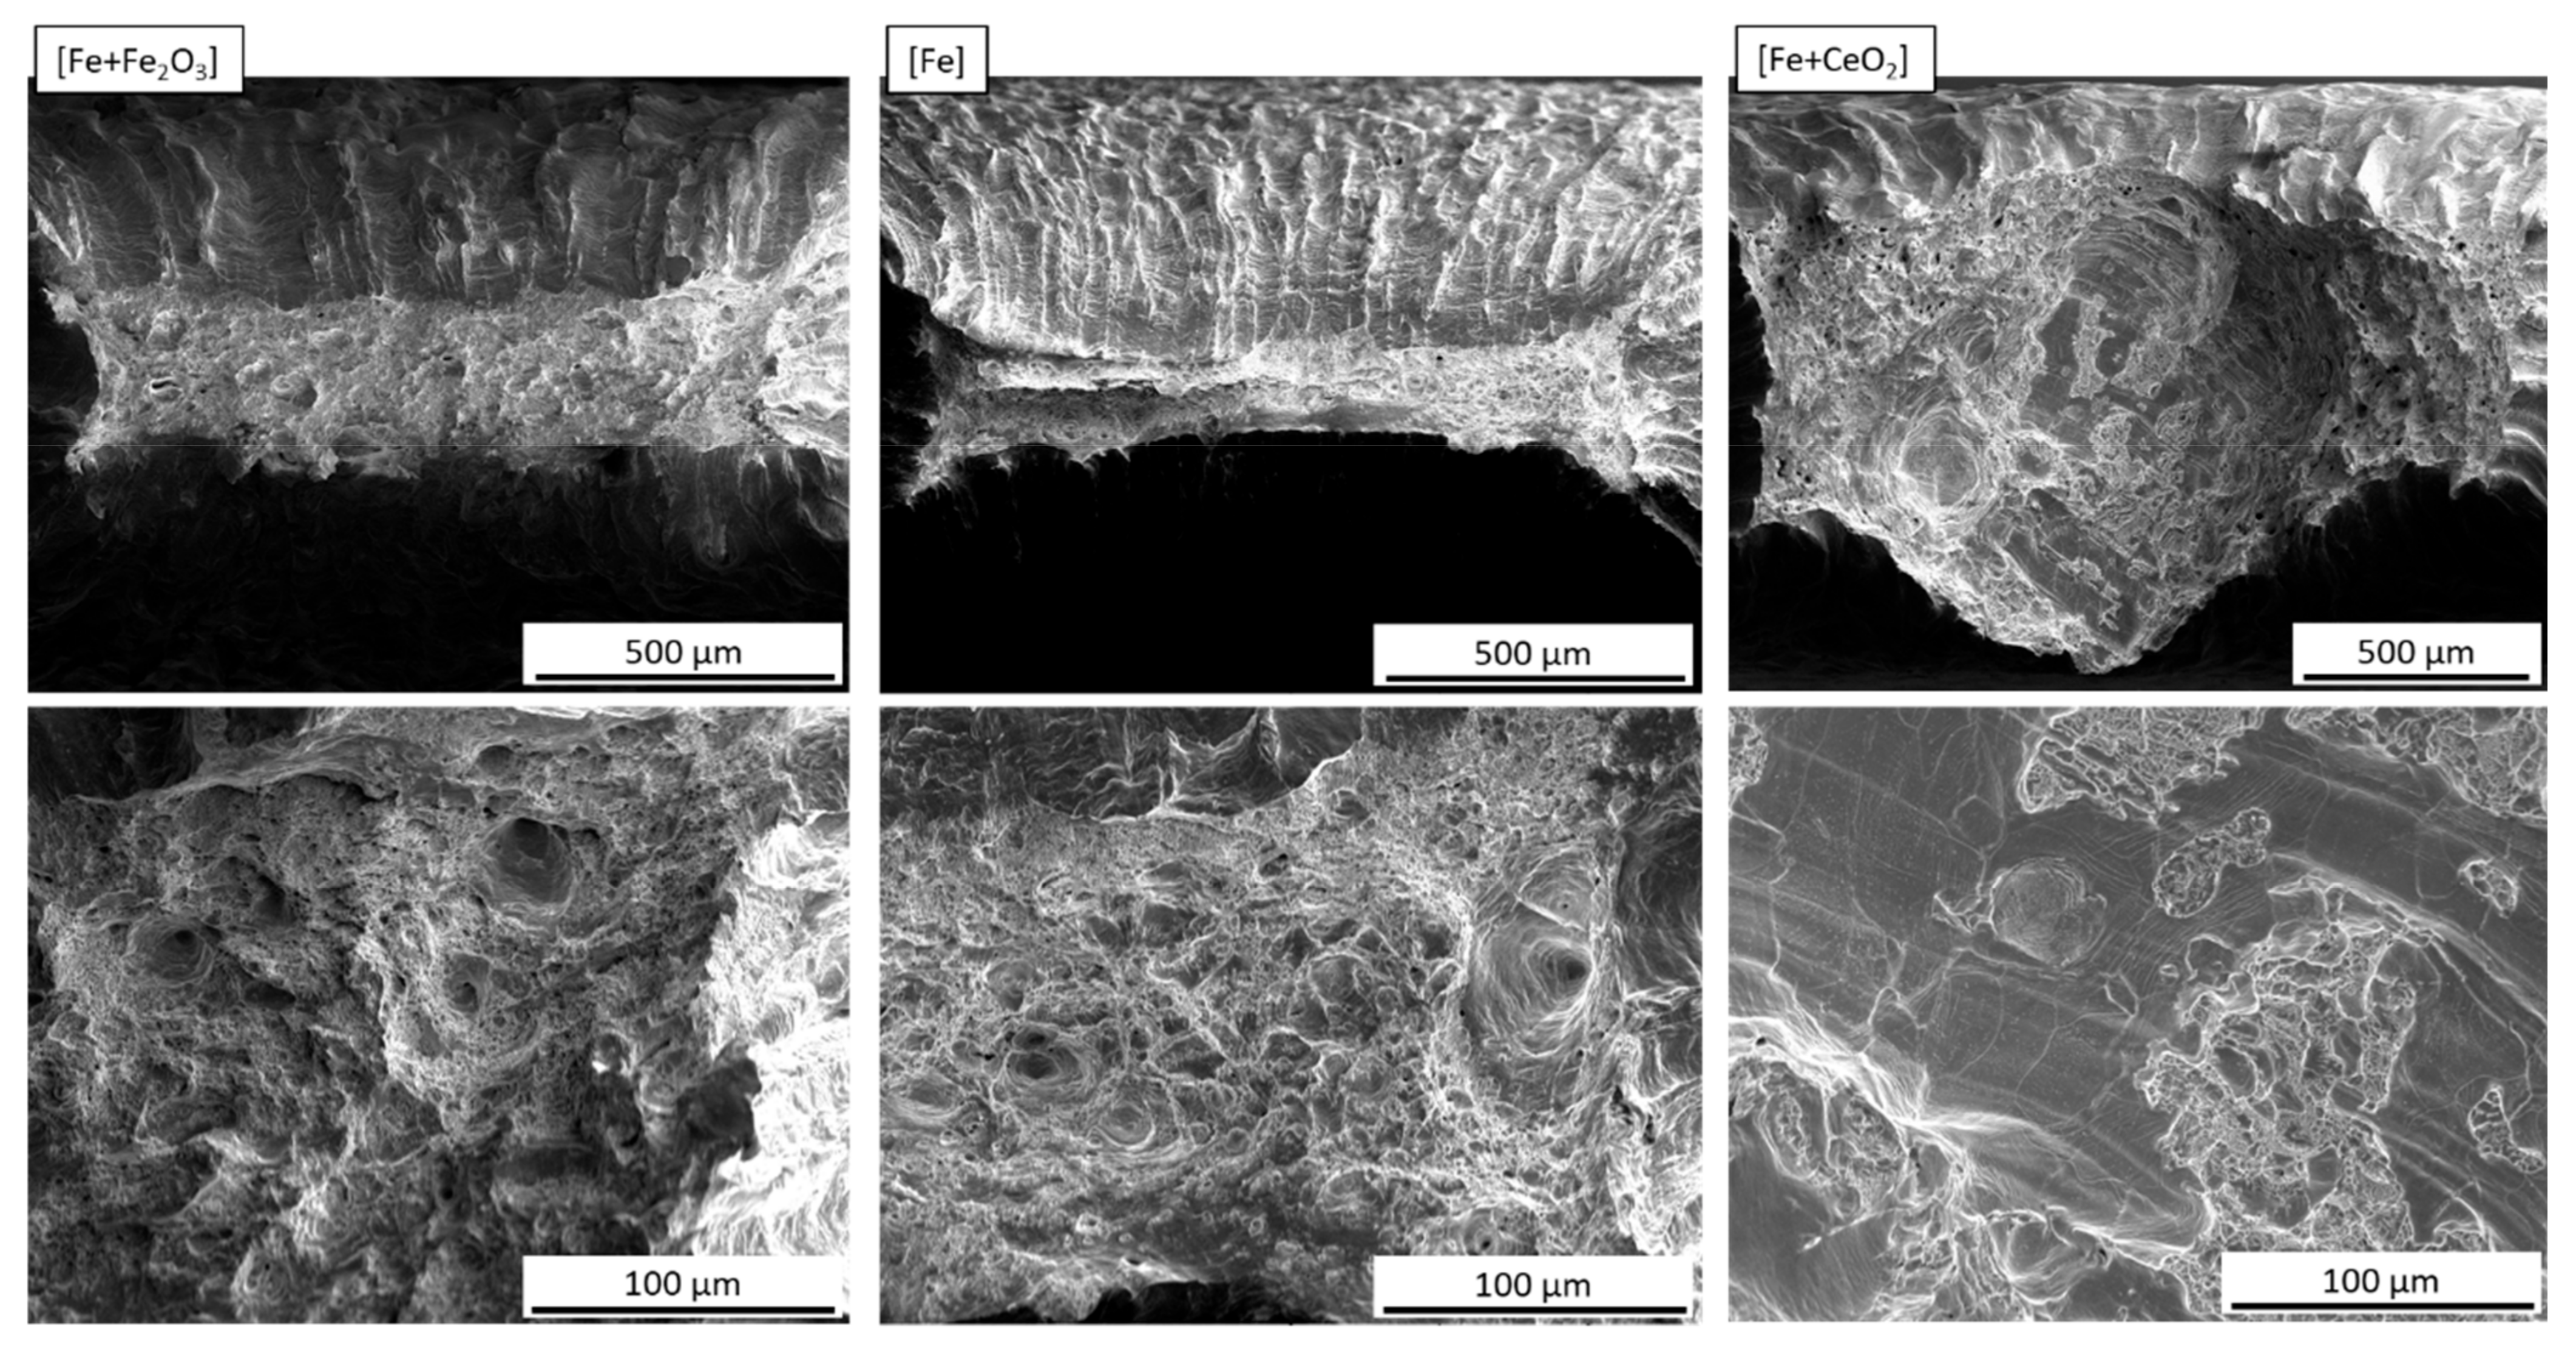
3.4. Mechanical Properties

The tensile tests performed (cf. Figure 9) depict significant differences in the response of the material modifications considered. As can be clearly seen on the basis of the representative curves shown, both initial modifications, i.e., [Fe + Fe2O3] and [Fe + CeO2], tended to a decrease in yield strength (YS) and ultimate tensile strength (UTS). Only the condition being characterized by the lowest fraction of Fe2O3 seemed to show a slightly higher YS and UTS as compared to the as-atomized cp Fe upon processing by E-PBF. Further, already a minor amount of CeO2 significantly lowered the fracture strain. A clear trend of the values with respect to the fraction of oxides was not directly obvious (cf. also Figure 10). It has to be noted that the CeO2-modified specimens primarily failed in the radius of the specimen. The reason for this behavior has not been fully understood so far; however, it is assumed that a higher notch sensitivity is one major influencing factor.
For quantitative assessment, the mean values of two tensile tests as well as the hardness values resulting from 21 indents for each condition are shown in Figure 10. For the Fe2O3 modifications, YS and UTS followed the same trend already revealed for the grain sizes (cf. Figure 5b), i.e., a small amount of Fe2O3 led to slight decrease of grain size and concomitantly to an increase of strength, while in turn, higher fractions of Fe2O3 led to larger grain sizes and decreasing strength. Further, the results for the hardness measurements were in good agreement with YS and UTS, as higher Fe2O3 contents significantly lowered the hardness. On the contrary, the values for the CeO2 modifications did not show a well-defined relationship with the fraction of the CeO2 NP, indicating in turn a complex interplay of several mechanisms and a high influence of the internal defects on the tensile properties. Pores near the specimen surface are known to be much more detrimental than pores inside the specimen volume, eventually leading to pronounced scattering of related values.
To shed light on the contribution of diverse influencing factors and elementary mechanisms, the representative fracture surfaces are shown in Figure 11. Here, a very high ductility and pronounced necking in the E-PBF cp Fe and the Fe2O3-modified specimens is relieved. Obviously, the fracture surface of the [Fe + CeO2] specimen differed significantly from the other material conditions, since large lack of fusion defects dominate the micrograph shown. Consequently, a reduced effective square section had to withstand the applied load. Still, the specimen showed a fracture strain of 39%. Regarding the material at the borders of the defect, necking and thus high ductility of the material can be seen, and therefore the original horizontal dimension of the specimen before loading was 3 mm and afterwards 1.7 mm. Further, although the fraction of CeO2 NP as well as the experimentally determined defect density was much lower in the [Fe + CeO2] + Fe, 1:4 specimens in direct comparison to the [Fe + CeO2] specimens, a reduced strength and fracture strain was seen. Here, the fracture surface (not shown) was also dominated by lack of fusion defects.

4. Discussion

The results presented herein revealed a noticeable influence of the raw material modification via the addition of Fe2O3 and CeO2 NP on the characteristics of the E-PBF-processed specimens. Since the process parameters, i.e., the beam parameters and the plate size used, remained unchanged, the effects described can be traced back solely to the added oxides. The latter lead to noticeable changes on the microstructural evolution during the process, which is particularly visible in the grain size and in the porosity.

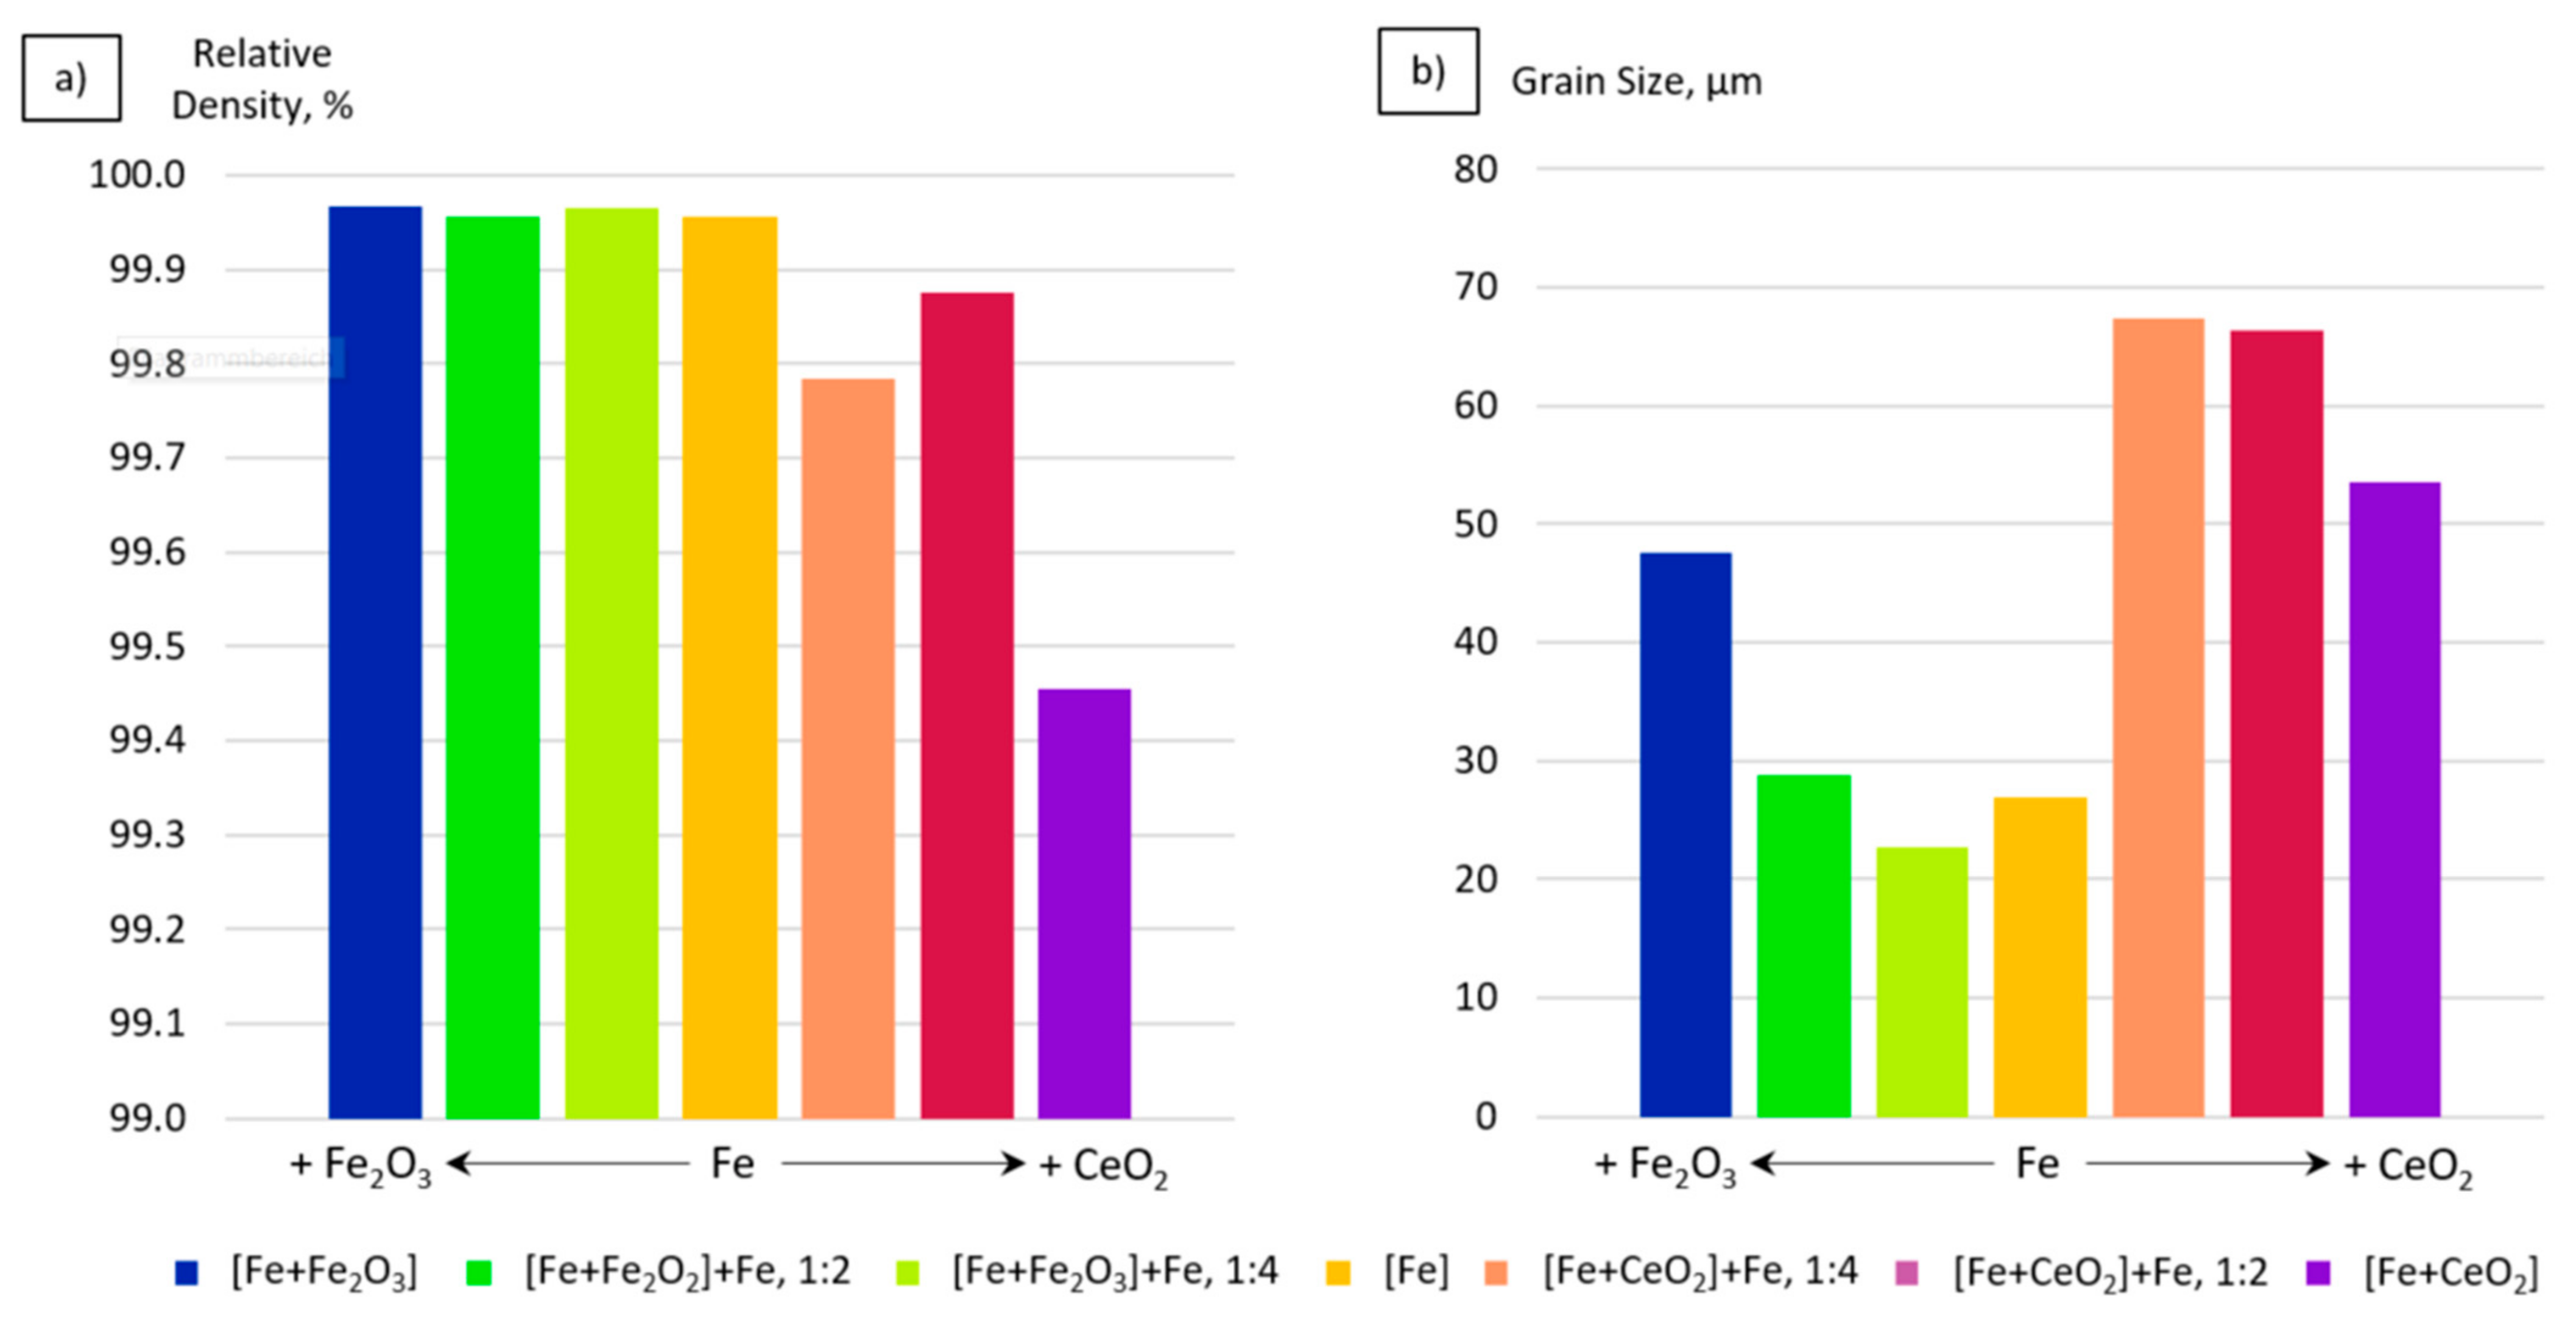
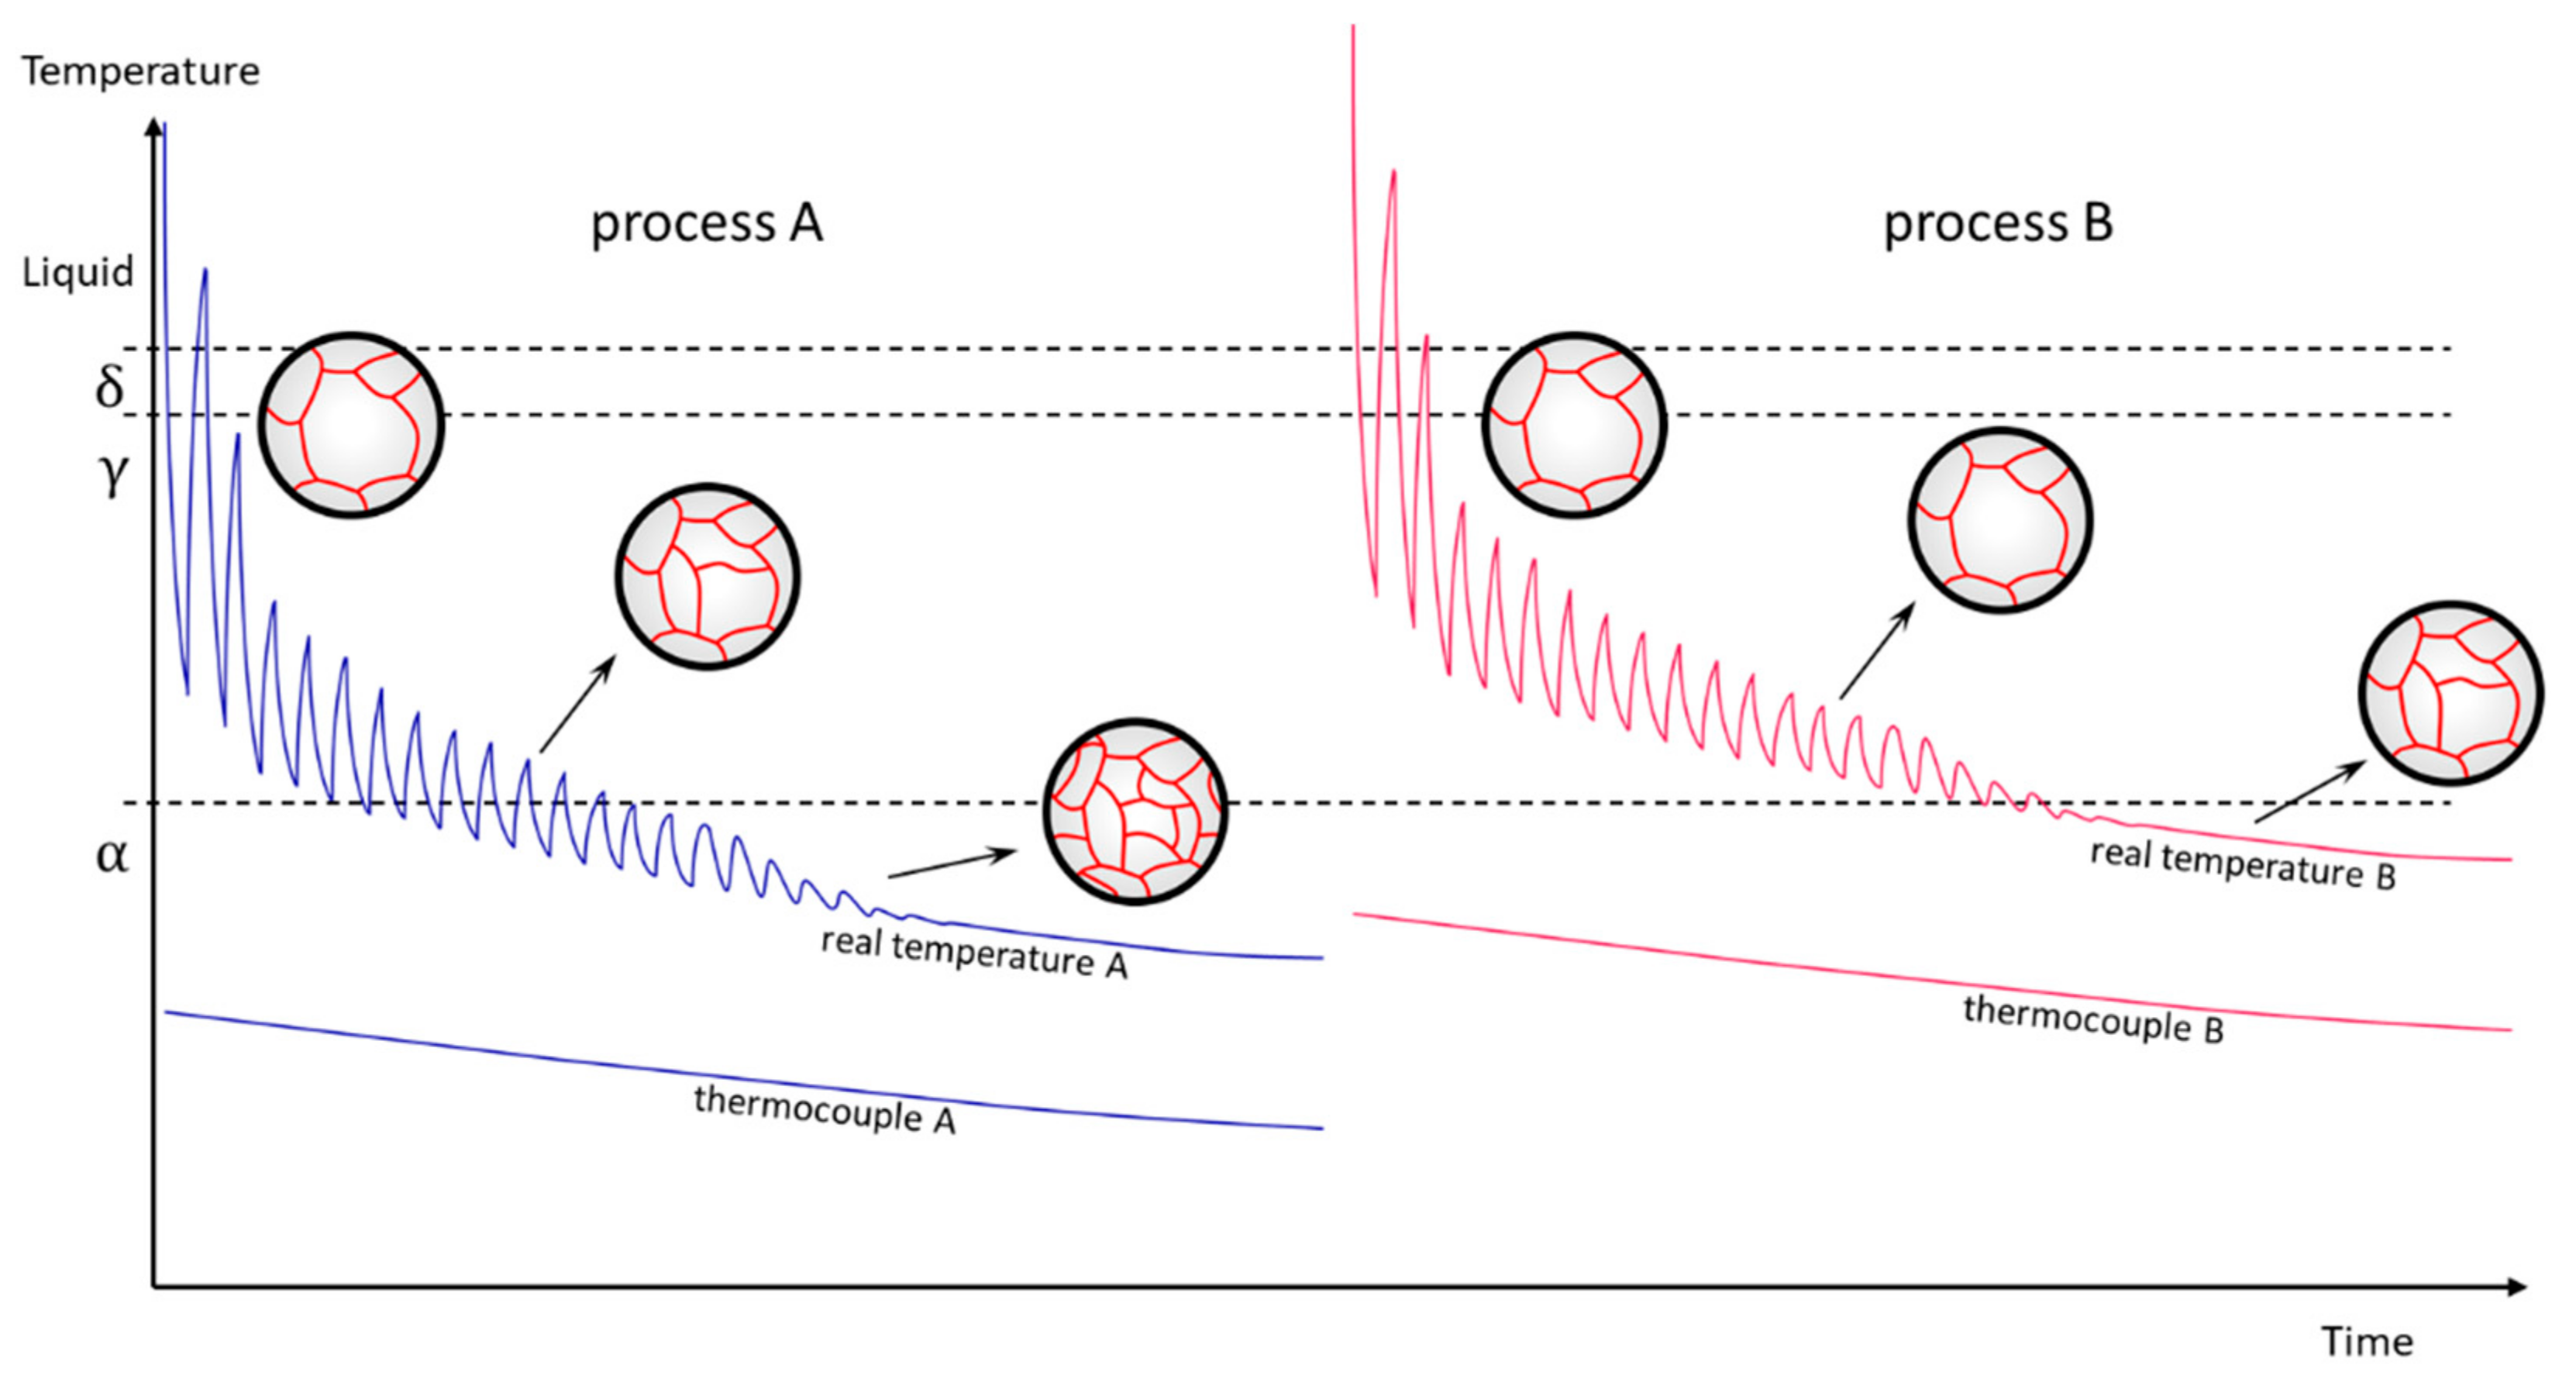
4.1. Porosity and Grain Size Evolution

In the case of the Fe2O3 modifications, porosity seems to be unaffected, since in the observed conditions, the relative density remained above 99.9% for the pure Fe until the maximum Fe2O3 content, i.e., nominally 0.045% in the present study. In the CeO2 modification, a decreasing relative density came along with increasing CeO2 contents. The nature of the present pores is complex (lack of fusions near the surface, BD-oriented cracks in the inner volume; cf. Figure 4), and their origin can have several reasons. Even though the [Fe + CeO2] specimen showed the highest porosity and simultaneously the highest process temperature (cf. Figure 12), keyhole pores stemming from too high energy insertion [61,62] were not present. Rather, lacking layer bonding or lack of fusion defects are supposed to stem from low energy density [63] (the melting point is about 2000 °C for the CeO2), whereas a combination of intergranular carbides and residual stresses during cooling have been found to lead to BD-oriented cracks in L-PBF of a Ni-based superalloy [64]. Although the E-PBF process is known to result in very low residual stresses, the presence of these defects indicates an inappropriate parameter set for this modification. However, the origin of these defects as well as the processing route have to be discussed deeply in future studies.
In both the modification with Fe2O3 and with CeO2, the grain size increased. In the case of Fe2O3 modifications, [Fe + Fe2O3] + Fe. 1:4 showed a slightly lower grain size than the cp Fe, whereas adding higher proportions of the oxide led to larger grain sizes. In contrast, small amounts of CeO2 resulted in a dramatic increase in grain size (≈27 µm in Fe and ≈67 µm in [Fe + CeO2] + Fe, 1:4, cf. Figure 5), which in turn slightly decreased with higher proportions of CeO2 (≈54 µm in [Fe + CeO2]). A high amount of CeO2 NP in a metal melt pool can probably provide for suitable nucleants and lead to grain refinement. In this context, diverse oxides, nitrides, carbides [49,50], and cerium oxides [41,65,66] have already been investigated in their role as grain refiners in the solidification behavior of steels. Furthermore, the increasing number of pores can also act as nucleants for new grains [67], resulting in smaller grain sizes.
In order to shed light on the grain size evolution, different driving forces contributing to the formation of grains and their appearance have to be discussed at this point. Both the thermal level of the E-PBF process as well as the evolution of defects will affect the overall as-built microstructure. The temperature profiles of the pure Fe and the modifications with highest proportions of Fe2O3 and CeO2 are depicted in Figure 12. It is important to note that the temperature is recorded with a thermo couple attached underneath the built plate, which means that only the global temperature level can be recorded, and the diagrams depicted are for comparison purposes only. The actual temperature at or near to the melt pool cannot be detected in this way, being much higher and serrated as a consequence of the repeated energy insertion (cf. Figure 13) [68,69]. However, different temperature levels over the process time were obvious: With the same process parameters, the temperature at the start of the process for pure Fe was ≈750 °C, whereby the [Fe + Fe2O3] and the [Fe + CeO2] experienced higher process temperatures of ≈800 °C and ≈900 °C at the start, respectively.
The addition of Fe2O3 and CeO2 to the pure Fe therefore led to an increase of the process temperatures using the same process parameters for all material conditions (Figure 12). However, as stated above, with higher proportions of CeO2, the grain size decreases depending on the quantity of nucleants, i.e., the CeO2 NP or, more likely, the pores. The increased thermal level during the build process most probably stems from the addition of CeO2 NP, eventually due to a change in the electrical resistivity and thermal conductivity. In addition to this, with higher amounts of the CeO2 NP, the porosity likewise increases. Thus, the higher thermal level and the increased defect density counteract each other in terms of grain size evolution. Furthermore, Lejček et al. [70] discussed in detail how subsequent α ↔ γ phase transformations during L-PBF processing of cp Fe lead to a fragmentation of initially columnar solidified grains. Similar observations were made by Günther et al. [68], who analyzed E-PBF-processed Cr–Mn–Ni steel, and by Körner et al. [69] regarding E-PBF-processed Ti-6-4. As already discussed in further studies, the resulting microstructure of E-PBF-processed cp Fe can differ significantly as a function of the process temperature level [55]. So, for example, at low process temperatures, the material experiences only few phase transformation events during melting until it remains in the α phase region. This results in a coarse-grained microstructure with a high amount of subgrains [54]. In turn, allowing a slightly higher temperature in the E-PBF process, one can realize a higher number of phase transformation events, leading to a significant grain refinement [55]. Two model processes, i.e., process A and B, are schematically illustrated in Figure 13. The temperature path corresponding to “process A” is similar to that of “process B”; however, it is located at a slightly lower thermal level. Initially, coarse grains may be formed while solidifying, mainly following the temperature gradient and epitaxy. The temperature decreases rapidly since the heat dissipates into the surrounding material. In the subsequent layers, the observed volume increment is melted again (instead, lacking layer bonding would be the result). The serrated temperature profile in Figure 13 is further created by the energy inserted from above layers. However, since the heat insertion occurs further away from the thermocouple position, the peaks become less pronounced and the true temperature converges to the global temperature, which in turn is better represented by the thermocouple’s signal. Following this route, the real temperature A passes the α ↔ γ phase transition line several times. Thereby, inter- and intragranular stresses emerge from concomitant volume changes due to the phase transformation, leading in turn to the formation of dislocation entanglements and subgrain structures. From these subgrain structures, more stable high-angle grain boundaries can be formed when recrystallization is facilitated in the γ phase regime. As this effect occurs several times during build process A, a relatively fine-grain structure can result. In contrast, if the process temperature lays higher, e.g., due to higher electrical resistance or lower thermal conductivity in the [Fe + CeO2] presented, the pronounced temperature cycling does not proceed in the direct vicinity the α ↔ γ phase transition. As a consequence, only a few γ → α phase transformations take place, and thus coarse grains dominate the final microstructure. However, in terms of the microstructures and the studies focusing on the so-called intrinsic heat treatment presented herein [68], the following picture emerges: Using the same parameters, primarily the thermal level in the process rises with the amount of Fe2O3 and CeO2 modifications. In Figure 13, this can be represented by temperature path B. At significantly higher process temperatures, there may also be a higher potential for grain growth, while the pure Fe is processed at a thermal regime in which multiple phase transformations provoke a grain refinement. In the case of the modifications with high CeO2 proportions, grain nucleation at NP as well as defects contribute to a slight grain refinement. Nevertheless, at the given process temperature, the grain coarsening is predominant in comparison to the pure Fe. While the grain nucleation at NP appears to be negligible in the regarded proportions, the two prevailing and conflicting driving forces are the reduction of grain boundary energy at elevated temperatures on the one side, and the grain refinement through multiple phase transformation on the other.
In order to quantify each individual contribution, future studies regarding even higher amounts of CeO2 using different parameter settings will have to reveal the role as well as the remaining of the NP after E-PBF processing more systematically. Thus, the thermal history as well as the evolution of the porosity have to be regarded, particularly with adjusted process parameters. For the material conditions presented herein, the most effective way for grain refinement is still supposed to be a multiple phase transformation. As a function of specimen number and geometry, melting parameters, and heating surface, inter alia, the E-PBF process can be steered into thermal realms in which the subsequent melting leads to the described effect, and hence to a sudden grain refinement [55].

4.2. Electrochemical Properties

The results of the electrochemical corrosion analysis indicate that the initial stage of the corrosion process can be accelerated by the powder surface oxidation studied herein, as well as by the inoculation with CeO2 NP. In the case of the Fe2O3 modification, both the increase in the grain size and local potential difference between oxide and metallic phases might contribute to the higher corrosion rate. In addition, for the CeO2-modified specimens, the increased porosity is likely to further contribute to the accelerated corrosion reactions.
Figure 6 and Figure 7 show that the pure Fe sample exhibited the highest incubation time after immersion in m-SBF. Both, the OCP as well as the low-frequency impedance values, dropped only after about 750 min of immersion time. The faster initiation of the corrosion reactions in the case of the incorporated Fe2O3 and CeO2 NP can be explained by defect triggered localized corrosion processes. However, the differences in corrosion kinetics between the studied material conditions became smaller over extended immersion times (cf. Figure 7b), which was most probably due to the formation of protective surface layers composed of corrosion products. This scale formation on the material surfaces may limit the overall corrosion rate and, eventually, diminish differences in interfacial and local reactivity of the different specimens. These conclusions can be supported by the microscopic images of the specimens after the exposure (Figure 8).

4.3. Mechanical Properties

The mechanical properties of the Fe2O3 modifications were in good agreement with the evolution of the grain sizes and the internal defects. The smaller grain size of the [Fe + Fe2O3] + Fe, 1:4 specimen met the increase in YS and UTS, following the Hall–Petch relation [71], whereas in the conditions with higher Fe2O3 content, the tensile strength decreased due to increasing grain size. In the material modifications with CeO2, the grain size and the porosity interacted. Even minor CeO2 contents can lead to significantly reduced strength and ductility. Still, specimens with CeO2 NP can show improved mechanical properties (cf. Figure 9). Here, it must be considered that severely notched specimens were probed, i.e., the CeO2 NP conditions feature a relatively high defect density. As detailed above, despite a drastically reduced square section, the [Fe + CeO2] specimen still showed good ductility, which can be traced back to an enhanced damage tolerance. The YS (194 MPa) and UTS (274 MPa) of the [Fe + CeO2] specimen were at the same level as the values for the [Fe + Fe2O3] specimen, the latter being characterized by a smaller grain size and higher relative density. This comparison points out that further strengthening mechanisms have to be active in the CeO2 NP modifications; however, in these conditions the defect density leads to scattering of properties. This rationale can be further underlined by the higher hardness values of the [Fe + CeO2] specimen compared to the [Fe + Fe2O3] specimen. Thus, in these material conditions, the CeO2 NP seem to promote an effective dispersion strengthening. However, assessment of the final distribution of the CeO2 NP in the material as well as the respective contribution to matrix strengthening is beyond the scope of present work and has to be addressed in future studies, in which fully dense Fe specimens including even higher amounts of CeO2 NP have to be manufactured through applying an adapted parameter setting.
In summary, the present study demonstrated that tailoring the properties of Fe components via E-PBF is possible in a wide range. Varying the type of oxide particles and concomitantly the process temperature affects the grain size and defect density, finally allowing for tailoring the mechanical properties and corrosion response. In the present study, the parameters used to manufacture specimens of the seven material conditions via E-PBF were kept constant to gain a first insight in the material behavior. Concerning the mechanical behavior, the modifications with Fe2O3 followed the Hall–Petch relation. Moreover, despite the presence of different types of defects in the specimens modified with CeO2, sufficient structural strength and excellent damage tolerance were found to prevail. It can be assumed that an inhomogeneous pore size and distribution are responsible for the incoherent stress–strain curves and scatter in all mechanical as well as chemical investigations. Therefore, process parameters leading to fully dense material with an increased fraction of CeO2 particles have to be identified in order to be able to implement defined pores of homogeneous size and distribution afterwards. This will allow for direct design of E-PBF-manufactured, CeO2-modified Fe specimens with a defined porosity that still maintain good structural integrity due to the superior damage tolerance.
This provides for a further degree of freedom, i.e., to directly tailor the corrosion properties (appropriately designed to meet the demands of biodegradable implants) and, finally, will promote good mechanical properties, even in partly corroded conditions.

5. Conclusions

The present study focused on the effects of Fe2O3 and CeO2 NP modifications on cp Fe processed via E-PBF, applying constant process parameters. Grain refinement in consequence of the use of the oxides acting as nucleation sites could not be clearly observed, since the cp Fe is already characterized by relatively small grains induced by intrinsic heat treatment and multiple phase transformations during layer-wise production. Only the material with lowest content of Fe2O3 showed slightly lower grain sizes as compared to cp Fe. Material modifications with CeO2 are characterized by significant grain coarsening in comparison to the pure Fe. Only minor decrease in grain sizes with increasing CeO2 contents was seen, which is rationalized by the higher number of defects being present in this material condition. Microstructural changes mainly concern the grain size but not the texture and are primarily attributed to the differing thermal developments of the material experiences. From the presented findings, the following conclusions can be drawn:
  • The grain size evolution mainly followed the temperature evolution during E-PBF processing. The use of CeO2 NP resulted in a severe microstructure coarsening, which could be primarily traced back to higher process temperatures. Grain refinement induced by oxides was hardly seen. The smallest grain sizes after E-PBF processing were found in the pure Fe and in the Fe2O3 modification with the lowest fraction of oxides.
  • For the Fe2O3 modifications, the resulting grain sizes were in perfect agreement with the mechanical properties. According to the Hall–Petch relation hardness, UTS and YS increased with decreasing grain sizes.
  • In the case of the CeO2-modified conditions, the mechanical properties showed more pronounced scatter, which can be attributed to the higher number of defects. Still, relatively high strength as well as excellent damage tolerance were found in these modifications. This characteristic will allow for manufacturing material modifications featuring a defined porosity and predictable properties.
  • The corrosion kinetics correlated well to the change in the chemical composition and the microstructure of the manufactured specimens. The increase of the grain size, the formation of local galvanic elements due to the incorporation of oxide phases, and the creation of pores in the case of CeO2-modified particles contribute to the overall increased corrosion rates in the initial phase of immersion.

Supplementary Materials

The following supporting information can be downloaded at: https://www.mdpi.com/article/10.3390/alloys1010004/s1, Figures S1–S7 show the EIS data for the seven specimens right after immersion (0 min) and after 1435 min of immersion in m-SBF.

Author Contributions

C.J.J.T.: conceptualization, investigation, visualization, writing—original draft, writing—review and editing. P.K.: conceptualization, writing—review and editing. J.H.: investigation, visualization, writing—original draft. M.V.: investigation, visualization. C.E.: investigation, visualization. S.K.: investigation, visualization. G.G.: conceptualization, methodology, validation, writing—review and editing, supervision, project administration, funding acquisition. T.N.: conceptualization, methodology, validation, writing—review and editing, supervision, project administration, funding acquisition. All authors have read and agreed to the published version of the manuscript.

Funding

This work was supported by Deutsche Forschungsgemeinschaft (DFG) under grant number 413259151.

Institutional Review Board Statement

Not applicable.

Informed Consent Statement

Not applicable.

Data Availability Statement

The data presented in this study are available on request from the corresponding author.

Conflicts of Interest

The authors declare no conflict of interest.

References

  1. DebRoy, T.; Wei, H.L.; Zuback, J.S.; Mukherjee, T.; Elmer, J.W.; Milewski, J.O.; Beese, A.M.; Wilson-Heid, A.; De, A.; Zhang, W. Additive manufacturing of metallic components—Process, structure and properties. Prog. Mater. Sci. 2018, 92, 112–224. [Google Scholar] [CrossRef]
  2. Oliveira, J.P.; LaLonde, A.D.; Ma, J. Processing parameters in laser powder bed fusion metal additive manufacturing. Mater. Des. 2020, 193, 108762. [Google Scholar] [CrossRef]
  3. Ahmadi, S.M.; Hedayati, R.; Li, Y.; Lietaert, K.; Tümer, N.; Fatemi, A.; Rans, C.D.; Pouran, B.; Weinans, H.; Zadpoor, A.A. Fatigue performance of additively manufactured meta-biomaterials: The effects of topology and material type. Acta Biomater. 2018, 65, 292–304. [Google Scholar] [CrossRef] [PubMed] [Green Version]
  4. Li, Y.; Jahr, H.; Lietaert, K.; Pavanram, P.; Yilmaz, A.; Fockaert, L.I.; Leeflang, M.A.; Pouran, B.; Gonzalez-Garcia, Y.; Weinans, H.; et al. Additively manufactured biodegradable porous iron. Acta Biomater. 2018, 77, 380–393. [Google Scholar] [CrossRef] [PubMed]
  5. Li, Y.; Lietaert, K.; Li, W.; Zhang, X.-Y.; Leeflang, M.A.; Zhou, J.; Zadpoor, A.A. Corrosion fatigue behavior of additively manufactured biodegradable porous iron. Corros. Sci. 2019, 156, 106–116. [Google Scholar] [CrossRef]
  6. Murr, L.E. Open-cellular metal implant design and fabrication for biomechanical compatibility with bone using electron beam melting. J. Mech. Behav. Biomed. Mater. 2017, 76, 164–177. [Google Scholar] [CrossRef]
  7. Schouman, T.; Schmitt, M.; Adam, C.; Dubois, G.; Rouch, P. Influence of the overall stiffness of a load-bearing porous titanium implant on bone ingrowth in critical-size mandibular bone defects in sheep. J. Mech. Behav. Biomed. Mater. 2016, 59, 484–496. [Google Scholar] [CrossRef]
  8. Wieding, J.; Lindner, T.; Bergschmidt, P.; Bader, R. Biomechanical stability of novel mechanically adapted open-porous titanium scaffolds in metatarsal bone defects of sheep. Biomaterials 2015, 46, 35–47. [Google Scholar] [CrossRef]
  9. Fromme, P.; Blunn, G.W.; Aston, W.J.; Abdoola, T.; Koris, J.; Coathup, M.J. The effect of bone growth onto massive prostheses collars in protecting the implant from fracture. Med. Eng. Phys. 2017, 41, 19–25. [Google Scholar] [CrossRef]
  10. Özbek, I.; Konduk, B.A.; Bindal, C.; Ucisik, A.H. Characterization of borided AISI 316L stainless steel implant. Vacuum 2002, 65, 521–525. [Google Scholar] [CrossRef]
  11. Hryniewicz, T.; Rokosz, K.; Filippi, M. Biomaterial Studies on AISI 316L Stainless Steel after Magnetoelectropolishing. Materials 2009, 2, 129–145. [Google Scholar] [CrossRef] [Green Version]
  12. Shah, F.A.; Omar, O.; Suska, F.; Snis, A.; Matic, A.; Emanuelsson, L.; Norlindh, B.; Lausmaa, J.; Thomsen, P.; Palmquist, A. Long-term osseointegration of 3D printed CoCr constructs with an interconnected open-pore architecture prepared by electron beam melting. Acta Biomater. 2016, 36, 296–309. [Google Scholar] [CrossRef] [PubMed] [Green Version]
  13. Harun, W.; Kamariah, M.; Muhamad, N.; Ghani, S.; Ahmad, F.; Mohamed, Z. A review of powder additive manufacturing processes for metallic biomaterials. Powder Technol. 2018, 327, 128–151. [Google Scholar] [CrossRef]
  14. Okazaki, Y.; Gotoh, E. Comparison of metal release from various metallic biomaterials in vitro. Biomaterials 2005, 26, 11–21. [Google Scholar] [CrossRef] [PubMed]
  15. Witte, F. The history of biodegradable magnesium implants: A review. Acta Biomater. 2010, 6, 1680–1692. [Google Scholar] [CrossRef]
  16. Yusop, A.H.; Bakir, A.A.; Shaharom, N.A.; Abdul Kadir, M.R.; Hermawan, H. Porous biodegradable metals for hard tissue scaffolds: A review. Int. J. Biomater. 2012, 2012, 641430. [Google Scholar] [CrossRef] [PubMed] [Green Version]
  17. Geetha, M.; Singh, A.K.; Asokamani, R.; Gogia, A.K. Ti based biomaterials, the ultimate choice for orthopaedic implants—A review. Prog. Mater. Sci. 2009, 54, 397–425. [Google Scholar] [CrossRef]
  18. Schinhammer, M.; Hänzi, A.C.; Löffler, J.F.; Uggowitzer, P.J. Design strategy for biodegradable Fe-based alloys for medical applications. Acta Biomater. 2010, 6, 1705–1713. [Google Scholar] [CrossRef]
  19. Hofstetter, J.; Martinelli, E.; Weinberg, A.M.; Becker, M.; Mingler, B.; Uggowitzer, P.J.; Löffler, J.F. Assessing the degradation performance of ultrahigh-purity magnesium in vitro and in vivo. Corros. Sci. 2015, 91, 29–36. [Google Scholar] [CrossRef]
  20. Liu, Y.; Zheng, Y.; Chen, X.-H.; Yang, J.-A.; Pan, H.; Chen, D.; Wang, L.; Zhang, J.; Zhu, D.; Wu, S.; et al. Fundamental Theory of Biodegradable Metals—Definition, Criteria, and Design. Adv. Funct. Mater. 2019, 29, 1805402. [Google Scholar] [CrossRef]
  21. Witte, F.; Kaese, V.; Haferkamp, H.; Switzer, E.; Meyer-Lindenberg, A.; Wirth, C.J.; Windhagen, H. In vivo corrosion of four magnesium alloys and the associated bone response. Biomaterials 2005, 26, 3557–3563. [Google Scholar] [CrossRef] [PubMed]
  22. Kujur, M.S.; Manakari, V.; Parande, G.; Prasadh, S.; Wong, R.; Mallick, A.; Gupta, M. Development of rare-earth oxide reinforced magnesium nanocomposites for orthopaedic applications: A mechanical/immersion/biocompatibility perspective. J. Mech. Behav. Biomed. Mater. 2021, 114, 104162. [Google Scholar] [CrossRef] [PubMed]
  23. Leung, Y.H.; Yung, M.M.N.; Ng, A.M.C.; Ma, A.P.Y.; Wong, S.W.Y.; Chan, C.M.N.; Ng, Y.H.; Djurišić, A.B.; Guo, M.; Wong, M.T.; et al. Toxicity of CeO2 nanoparticles—The effect of nanoparticle properties. J. Photochem. Photobiol. B 2015, 145, 48–59. [Google Scholar] [CrossRef] [PubMed]
  24. Hufenbach, J.; Kochta, F.; Wendrock, H.; Voß, A.; Giebeler, L.; Oswald, S.; Pilz, S.; Kühn, U.; Lode, A.; Gelinsky, M.; et al. S and B microalloying of biodegradable Fe-30Mn-1C—Effects on microstructure, tensile properties, in vitro degradation and cytotoxicity. Mater. Des. 2018, 142, 22–35. [Google Scholar] [CrossRef]
  25. Hufenbach, J.; Sander, J.; Kochta, F.; Pilz, S.; Voss, A.; Kühn, U.; Gebert, A. Effect of Selective Laser Melting on Microstructure, Mechanical, and Corrosion Properties of Biodegradable FeMnCS for Implant Applications. Adv. Eng. Mater. 2020, 22, 2000182. [Google Scholar] [CrossRef]
  26. Hermawan, H.; Purnama, A.; Dube, D.; Couet, J.; Mantovani, D. Fe-Mn alloys for metallic biodegradable stents: Degradation and cell viability studies. Acta Biomater. 2010, 6, 1852–1860. [Google Scholar] [CrossRef]
  27. Kraus, T.; Moszner, F.; Fischerauer, S.; Fiedler, M.; Martinelli, E.; Eichler, J.; Witte, F.; Willbold, E.; Schinhammer, M.; Meischel, M.; et al. Biodegradable Fe-based alloys for use in osteosynthesis: Outcome of an in vivo study after 52 weeks. Acta Biomater. 2014, 10, 3346–3353. [Google Scholar] [CrossRef]
  28. Otto, M.; Pilz, S.; Gebert, A.; Kühn, U.; Hufenbach, J. Effect of Build Orientation on the Microstructure, Mechanical and Corrosion Properties of a Biodegradable High Manganese Steel Processed by Laser Powder Bed Fusion. Metals 2021, 11, 944. [Google Scholar] [CrossRef]
  29. Niendorf, T.; Brenne, F.; Hoyer, P.; Schwarze, D.; Schaper, M.; Grothe, R.; Wiesener, M.; Grundmeier, G.; Maier, H.J. Processing of New Materials by Additive Manufacturing: Iron-Based Alloys Containing Silver for Biomedical Applications. Met. Mat Trans. A 2015, 46, 2829–2833. [Google Scholar] [CrossRef]
  30. Berger, P.; Ricco, J.B.; Liqui Lung, P.; Moll, F.L. Localized argyria caused by metallic silver aortic grafts: A unique adverse effect. Eur. J. Vasc. Endovasc. Surg. 2013, 46, 565–568. [Google Scholar] [CrossRef] [Green Version]
  31. Glehr, M.; Leithner, A.; Friesenbichler, J.; Goessler, W.; Avian, A.; Andreou, D.; Maurer-Ertl, W.; Windhager, R.; Tunn, P.-U. Argyria following the use of silver-coated megaprostheses: No association between the development of local argyria and elevated silver levels. Bone Jt. J. 2013, 95, 988–992. [Google Scholar] [CrossRef] [PubMed]
  32. Drynda, A.; Hassel, T.; Bach, F.W.; Peuster, M. In vitro and in vivo corrosion properties of new iron-manganese alloys designed for cardiovascular applications. J. Biomed. Mater. Res. 2015, 103, 649–660. [Google Scholar] [CrossRef] [PubMed]
  33. Schinhammer, M.; Gerber, I.; Hänzi, A.C.; Uggowitzer, P.J. On the cytocompatibility of biodegradable Fe-based alloys. Mater. Sci. Eng. C Mater. Biol. Appl. 2013, 33, 782–789. [Google Scholar] [CrossRef]
  34. Bowen, P.K.; Drelich, J.; Goldman, J. Zinc exhibits ideal physiological corrosion behavior for bioabsorbable stents. Adv. Mater. 2013, 25, 2577–2582. [Google Scholar] [CrossRef] [PubMed]
  35. Yuan, W.; Xia, D.; Wu, S.; Zheng, Y.; Guan, Z.; Rau, J.V. A review on current research status of the surface modification of Zn-based biodegradable metals. Bioact. Mater. 2022, 7, 192–216. [Google Scholar] [CrossRef] [PubMed]
  36. Waksman, R.; Pakala, R.; Baffour, R.; Seabron, R.; Hellinga, D.; Tio, F.O. Short-term effects of biocorrodible iron stents in porcine coronary arteries. J. Interv. Cardiol. 2008, 21, 15–20. [Google Scholar] [CrossRef]
  37. Peuster, M.; Hesse, C.; Schloo, T.; Fink, C.; Beerbaum, P.; von Schnakenburg, C. Long-term biocompatibility of a corrodible peripheral iron stent in the porcine descending aorta. Biomaterials 2006, 27, 4955–4962. [Google Scholar] [CrossRef]
  38. Pan, F.; Zhang, J.; Chen, H.-L.; Su, Y.-H.; Kuo, C.-L.; Su, Y.-H.; Chen, S.-H.; Lin, K.-J.; Hsieh, P.-H.; Hwang, W.-S. Effects of Rare Earth Metals on Steel Microstructures. Materials 2016, 9, 417. [Google Scholar] [CrossRef] [Green Version]
  39. Ji, Y.; Zhang, M.-X.; Ren, H. Roles of Lanthanum and Cerium in Grain Refinement of Steels during Solidification. Metals 2018, 8, 884. [Google Scholar] [CrossRef] [Green Version]
  40. Li, M.; Li, J.; Qiu, D.; Zheng, Q.; Wang, G.; Zhang, M.-X. Crystallographic study of grain refinement in low and medium carbon steels. Philos. Mag. 2016, 96, 1556–1578. [Google Scholar] [CrossRef]
  41. Tuttle, R. Understanding the Mechanism of Grain Refinement in Plain Carbon Steels. Inter Met. 2013, 7, 7–16. [Google Scholar] [CrossRef]
  42. Thewlis, G. Effect of cerium sulphide particle dispersions on acicular ferrite microstructure development in steels. Mater. Sci. Technol. 2006, 22, 153–166. [Google Scholar] [CrossRef]
  43. Koseki, T.; Thewlis, G. Overview Inclusion assisted microstructure control in C–Mn and low alloy steel welds. Mater. Sci. Technol. 2005, 21, 867–879. [Google Scholar] [CrossRef]
  44. Grong, O.; Matlock, D.K. Microstructural development in mild and low-alloy steel weld metals. Int. Met. Rev. 1986, 31, 27–48. [Google Scholar] [CrossRef]
  45. Ali, Y.; Qiu, D.; Jiang, B.; Pan, F.; Zhang, M.-X. Current research progress in grain refinement of cast magnesium alloys: A review article. J. Alloys Compd. 2015, 619, 639–651. [Google Scholar] [CrossRef]
  46. Kelly, P.M.; Zhang, M.-X. Edge-to-edge matching—The fundamentals. Met. Mat Trans. A 2006, 37, 833–839. [Google Scholar] [CrossRef]
  47. Zhang, M.-X.; Kelly, P.M. Edge-to-edge matching model for predicting orientation relationships and habit planes—The improvements. Scr. Mater. 2005, 52, 963–968. [Google Scholar] [CrossRef]
  48. AlMangour, B.; Grzesiak, D.; Yang, J.-M. Rapid fabrication of bulk-form TiB2/316L stainless steel nanocomposites with novel reinforcement architecture and improved performance by selective laser melting. J. Alloys Compd. 2016, 680, 480–493. [Google Scholar] [CrossRef]
  49. AlMangour, B.; Grzesiak, D.; Jenn-MingYang. Selective laser melting of TiC reinforced 316L stainless steel matrix nanocomposites: Influence of starting TiC particle size and volume content. Mater. Des. 2016, 104, 141–151. [Google Scholar] [CrossRef]
  50. Boegelein, T.; Dryepondt, S.N.; Pandey, A.; Dawson, K.; Tatlock, G.J. Mechanical response and deformation mechanisms of ferritic oxide dispersion strengthened steel structures produced by selective laser melting. Acta Mater. 2015, 87, 201–215. [Google Scholar] [CrossRef] [Green Version]
  51. Gao, R.; Zeng, L.; Ding, H.; Zhang, T.; Wang, X.; Fang, Q. Characterization of oxide dispersion strengthened ferritic steel fabricated by electron beam selective melting. Mater. Des. 2016, 89, 1171–1180. [Google Scholar] [CrossRef]
  52. Zhai, W.; Zhu, Z.; Zhou, W.; Nai, S.M.L.; Wei, J. Selective laser melting of dispersed TiC particles strengthened 316L stainless steel. Compos. Part B Eng. 2020, 199, 108291. [Google Scholar] [CrossRef]
  53. Martin, J.H.; Yahata, B.D.; Hundley, J.M.; Mayer, J.A.; Schaedler, T.A.; Pollock, T.M. 3D printing of high-strength aluminium alloys. Nature 2017, 549, 365–369. [Google Scholar] [CrossRef]
  54. Torrent, C.; Wackenrohr, S.; Richter, R.; Sobrero, C.E.; Degener, S.; Krooß, P.; Maier, H.J.; Niendorf, T. On the microstructural and cyclic mechanical properties of pure iron processed by electron beam melting. Adv. Eng. Mater. 2021, 23, 2100018. [Google Scholar] [CrossRef]
  55. Torrent, C.J.J.; Krooß, P.; Niendorf, T. On the Impact of Build Envelope Sizes on E-PBF Processed Pure Iron. Met. Mater Trans. B 2021. [Google Scholar] [CrossRef]
  56. Bachmann, F.; Hielscher, R.; Schaeben, H. Texture analysis with MTEX- Free and open source software toolbox. Solid State Phenom. 2010, 160, 63–68. [Google Scholar] [CrossRef] [Green Version]
  57. Oyane, A.; Kim, H.-M.; Furuya, T.; Kokubo, T.; Miyazaki, T.; Nakamura, T. Preparation and assessment of revised simulated body fluids. J. Biomed. Mater. Res. A 2003, 65, 188–195. [Google Scholar] [CrossRef]
  58. Grosvenor, A.P.; Kobe, B.A.; Biesinger, M.C.; McIntyre, N.S. Investigation of multiplet splitting of Fe 2p XPS spectra and bonding in iron compounds. Surf. Interface Anal. 2004, 36, 1564–1574. [Google Scholar] [CrossRef]
  59. Laschuk, N.O.; Easton, E.B.; Zenkina, O.V. Reducing the resistance for the use of electrochemical impedance spectroscopy analysis in materials chemistry. RSC Adv. 2021, 11, 27925–27936. [Google Scholar] [CrossRef]
  60. Ulum, M.F.; Caesarendra, W.; Alavi, R.; Hermawan, H. In-Vivo Corrosion Characterization and Assessment of Absorbable Metal Implants. Coatings 2019, 9, 282. [Google Scholar] [CrossRef] [Green Version]
  61. Cordero, Z.C.; Meyer, H.M.; Nandwana, P.; Dehoff, R.R. Powder bed charging during electron-beam additive manufacturing. Acta Mater. 2017, 124, 437–445. [Google Scholar] [CrossRef] [Green Version]
  62. King, W.E.; Barth, H.D.; Castillo, V.M.; Gallegos, G.F.; Gibbs, J.W.; Hahn, D.E.; Kamath, C.; Rubenchik, A.M. Observation of keyhole-mode laser melting in laser powder-bed fusion additive manufacturing. J. Mater. Processing Technol. 2014, 214, 2915–2925. [Google Scholar] [CrossRef]
  63. Tammas-Williams, S.; Zhao, H.; Léonard, F.; Derguti, F.; Todd, I.; Prangnell, P.B. XCT analysis of the influence of melt strategies on defect population in Ti–6Al–4V components manufactured by Selective Electron Beam Melting. Mater. Charact. 2015, 102, 47–61. [Google Scholar] [CrossRef]
  64. Marchese, G.; Basile, G.; Bassini, E.; Aversa, A.; Lombardi, M.; Ugues, D.; Fino, P.; Biamino, S. Study of the Microstructure and Cracking Mechanisms of Hastelloy X Produced by Laser Powder Bed Fusion. Materials 2018, 11, 106. [Google Scholar] [CrossRef] [PubMed] [Green Version]
  65. Li, H.; McLean, A.; Rutter, J.W.; Sommerville, I.D. Influence of rare earth metals on the nucleation and solidification behavior of iron and 1045 steel. Metall. Trans. B 1988, 19, 383–395. [Google Scholar] [CrossRef]
  66. HAO, F.; LIAO, B.; LI, D.; DAN, T.; REN, X.; YANG, Q.; LIU, L. Effects of rare earth oxide on hardfacing metal microstructure of medium carbon steel and its refinement mechanism. J. Rare Earths 2011, 29, 609–613. [Google Scholar] [CrossRef]
  67. Ding, X.; Koizumi, Y.; Aoyagi, K.; Kii, T.; Sasaki, N.; Hayasaka, Y.; Yamanaka, K.; Chiba, A. Microstructural control of alloy 718 fabricated by electron beam melting with expanded processing window by adaptive offset method. Mater. Sci. Eng. A 2019, 764, 138058. [Google Scholar] [CrossRef]
  68. Günther, J.; Brenne, F.; Droste, M.; Wendler, M.; Volkova, O.; Biermann, H.; Niendorf, T. Design of novel materials for additive manufacturing—Isotropic microstructure and high defect tolerance. Sci. Rep. 2018, 8, 1298. [Google Scholar] [CrossRef] [Green Version]
  69. Körner, C. Additive manufacturing of metallic components by selective electron beam melting—A review. Int. Mater. Rev. 2016, 61, 361–377. [Google Scholar] [CrossRef] [Green Version]
  70. Lejček, P.; Roudnická, M.; Čapek, J.; Dvorský, D.; Drahokoupil, J.; Šimek, D.; Čížek, J.; Svora, P.; Molnárová, O.; Vojtěch, D. Selective laser melting of pure iron: Multiscale characterization of hierarchical microstructure. Mater. Charact. 2019, 154, 222–232. [Google Scholar] [CrossRef]
  71. Hansen, N. Hall–Petch relation and boundary strengthening. Scr. Mater. 2004, 51, 801–806. [Google Scholar] [CrossRef]
Figure 1. Initial Fe2O3 (left) and CeO2 (right) modifications and gas-atomized Fe powder (middle). Photographs and SE micrographs of one representative particle surface for each condition are shown in the upper and lower rows, respectively.
Alloys 01 00004 g001
Figure 2. XPS of the Fe2p peak of the as-atomized Fe powder (a); after oxidation (b).
Alloys 01 00004 g002
Figure 3. EBSD inverse pole figure (IPF) maps for all seven material conditions considered. The fraction of oxides increased downwards, and the respective condition is mentioned in the upper left of every IPF map. Color coding following the standard triangle shown in the upper right is always for BD. Surface areas probed and step sizes in all cases were equal. The black spots are an indication of localized defects being present. See the main text for details.
Alloys 01 00004 g003
Figure 4. Optical micrographs of the defects inside the built cubes; conditions with maximum CeO2 and Fe2O3 content as well as pure Fe.
Alloys 01 00004 g004
Figure 5. Relative density (a) and grain sizes (b) of the seven material conditions considered. Relative density was analyzed on the basis of optical micrographs; for assessment of grain size, EBSD data were used as a basis (see the Materials and Methods section).
Alloys 01 00004 g005
Figure 6. Time dependence of the free corrosion potentials (a); the impedance at 0.1 Hz (b) as a function of the immersion time.
Alloys 01 00004 g006
Figure 7. Comparison of the low-frequency impedance values at the start (a), at the end (b), and at the incubation time (c) of the seven material conditions considered.
Alloys 01 00004 g007
Figure 8. Optical micrographs of the seven material conditions after 24 h corrosion in m-SBF. The fraction of oxides increased downwards. See text for details.
Alloys 01 00004 g008
Figure 9. Stress–strain response of the seven conditions considered and schematic of the specimen geometry used in the tensile tests.
Alloys 01 00004 g009
Figure 10. Quantitative comparison of the results obtained by mechanical testing: YS (a), UTS (b), fracture strain (c), and hardness values (d). See text for details.
Alloys 01 00004 g010
Figure 11. SEM images of fracture surfaces after the quasistatic tensile tests of [Fe + Fe2O3], Fe, and [Fe + CeO2], which showed fracture strains of 69%, 59%, and 39%, respectively.
Alloys 01 00004 g011
Figure 12. Temperature profiles of the different E-PBF-processed material conditions, recorded underneath the built plate.
Alloys 01 00004 g012
Figure 13. Schematic illustration of the grain size evolution in dependence of the thermal level.
Alloys 01 00004 g013
Table 1. Powder compositions used for E-PBF processing. The final nominal weight fractions of Fe2O3 and CeO2 are provided.
[Fe + Fe2O3][Fe + Fe2O3] + Fe, 1:2[Fe + Fe2O3] + Fe, 1:4Fe[Fe + CeO2] + Fe, 1:4[Fe + CeO2] + Fe, 1:2[Fe + CeO2]
0.045%0.022%0.011%-0.008%0.016%0.031%
Table 2. Parameters used for E-PBF processing of the seven powder compositions.
StrategyPreheatMelt
Meander, 90°I = 15 mAI = 12.25 mA
Hatch onlyv = 12,000 mm/sv = 4000 mm/s
Layer = 0.05 mm12 repetitionshatch = 0.08 mm
Table 3. Composition of the m-SBF buffer for electrochemical measurements, data from [57].
ReagentsProviderQualityProportion
NaClVWRp.a.5.403 g/L
NaHCO3VWRp.a.0.504 g/L
Na2CO3VWRp.a.0.426 g/L
KClMerckp.a.0.225 g/L
K2HPO4*3 H2OMerckp.a.0.230 g/L
MgCl*6 H2OMerckp.a.0.311 g/L
C8H18N2O4SRothp.a.17.892 g/L
CaCl2Merckp.a.0.293 g/L
Na2SO4Merckp.a.0.072 g/L
Table 4. XPS results for the surface composition of the analyzed initial powders.
Analyzed PowderC 1sO 1sFe2p3/2Ce 4d
Iron powder44.445.89.8-
Oxidized powder39.649.011.4-
CeO2 modified43.546.18.32.1
Table 5. Material loss calculated on the basis of the evaluation of icorr data. icorr values were calculated from EIS data on the basis of the fitting of the spectra by an equivalent circuit with electrolyte resistance and a parallel arrangement of charge transfer resistance and double layer capacitance, data from [59].
Material Condition0 min1435 min
i corr ,   A c m 2 d ,   m m a n n o i corr ,   A c m 2 d ,   m m a n n o
[Fe + Fe2O3]2.3 × 10−72.7 × 10−36.2 × 10−67.2 × 10−2
[Fe + Fe2O3] + Fe, 1:12.4 × 10−62.8 × 10−25.1 × 10−65.9 × 10−2
[Fe + Fe2O3] + Fe, 1:41.9 × 10−62.2 × 10−24.6 × 10−65.3 × 10−2
[Fe]5.2 × 10−76.0 × 10−31.0 × 10−51.2 × 10−1
[Fe + CeO2] + Fe, 1:49.6 × 10−71.1 × 10−27.7 × 10−68.9 × 10−2
[Fe + CeO2] + Fe, 1:13.4 × 10−63.9 × 10−25.4 × 10−66.3 × 10−2
[Fe + CeO2]1.0 × 10−51.2 × 10−11.0 × 10−51.2 × 10−1
Publisher’s Note: MDPI stays neutral with regard to jurisdictional claims in published maps and institutional affiliations.

