1. Introduction
To achieve a sustainable electric power supply, the use of thermoelectric generators is a possible method to increase the energy efficiency in various applications by directly converting heat (waste) to electrical energy [
1]. Thermoelectric materials have been intensely studied in recent decades, and promising candidates have been found for different applications [
2]. The performance of a thermoelectric material is defined by the three central thermoelectric quantities, namely, the Seebeck coefficient
α, the electrical conductivity
σ, and the open-circuited entropy conductivity
Λ, which is related to the heat conductivity
λ =
T · Λ via the absolute temperature [
3,
4,
5,
6]. In the context of this work, thermal conductivity is used as a general term that can be expressed either by the heat conductivity
λ or by the more fundamental entropy conductivity
Λ. From these thermoelectric quantities, the power factor
σα2, which can be used to calculate the maximum achievable power, and the figure of merit
f =
zT, which is used to calculate the maximum energy conversion efficiency, can be determined according to Equation (1) [
3,
4,
6]. By using the entropy conductivity
Λ in Equation (1), the dimensionless figure of merit appears in a more concise form only containing the material parameters and it is not explicitly a function of the absolute temperature
T, but implicitly, since all material parameters are temperature-dependent.
Thermoelectric materials are conventionally designed to maximize the figure of merit
zT and thus the energy conversion efficiency. For example, these can be achieved by nanostructuring or doping of promising materials [
7,
8,
9]. For near room-temperature energy conversion, Bi
2Te
3 shows the most advanced properties [
10,
11], but is characterized by major drawbacks: the toxicity of telluride compounds and the poor thermal stability. Consequently, various alternatives such as oxides [
12,
13,
14] or intermetallic phases such as Zintl [
15,
16] or half-Heusler phases [
17,
18,
19] are widely investigated. However, the focus on maximizing the figure of merit
zT is questionable [
2,
20], as the electrical power output of the material is determined by the power factor and not by the figure of merit
zT [
21]. As a result, recent considerations have shown that to achieve a high electrical power output for high-temperature applications with a constant thermal gradient, a high power factor can be equally or more important than a high efficiency [
2,
20]. A promising approach towards thermoelectric material development is to focus on a material with a high electrical conductivity, such as one of the infrequently considered metal alloys, and then attempt to gradually improve the Seebeck coefficient and lower the thermal conductivity while maintaining high electrical conductivity to achieve a very high power factor. In
Figure 1, Ioffe plots of type I (power factor vs. electrical conductivity) and type II (entropy conductivity vs. electrical conductivity) are displayed for comparison of common thermoelectric materials. Here, all relevant material parameters can be displayed in a concise form, giving a direct comparison and including information about the figure of merit due to the utilization of the entropy conductivity
Λ instead of the heat conductivity
λ. In these plots, the thermoelectric properties are displayed as a function of their material parameters and rather than the absolute temperature
T. This corresponds to the concise form of the figure of merit by utilization of the entropy conductivity. The aforementioned Bi
2Te
3 compounds show a very good power factor of 30 to 50 µW·cm
−1·K
−2 [
10,
22]. Additionally, half-Heusler compounds such as FeNb
0.88Hf
0.12Sb [
23] have been shown to reach a very high power factor of approximately 40 to 60 µW·cm
−1·K
−2 [
19,
23] and good
zT values, and they are among the most advanced materials in the field. However, within the Ioffe plots, another promising material from the group of metal alloys can be identified, when a high power output is the main goal: Cu-Ni alloys. This elemental combination has been widely used in thermoelements as constantan (Cu-Ni-Mn) due to its properties and stability at elevated temperatures. It is characterized simultaneously by a very high power factor up to 100 µW·cm
−1·K
−2 (see
Figure 1a) and a high thermal conductivity, showing potential for high-temperature applications where power output may be more relevant than conversion efficiency [
24,
25]. Cu-Ni alloys are especially promising candidates due to the resonant levels in their electronic structure, resulting in a remarkably high Seebeck coefficient [
26]. Furthermore, Cu-Ni alloys show a strong deviation of the empirical Wiedemann–Franz relation, which is especially promising to be utilized for thermoelectric energy conversion [
27]. Another major advantage of such alloys is that they consist of inexpensive and nontoxic elements, are characterized by a good thermal and mechanical stability, and they can be produced via large-scale metallurgic processes. The only drawback is the high thermal conductivity, which leads to a relatively low conversion efficiency (see
Figure 1b). However, especially for high-temperature applications with low-cost heat sources, e.g., in the automotive sector or solar heat, and when a constant temperature gradient can be maintained, e.g., active cooling, the thermal conductivity plays a subordinate role and a high power factor is highly advantageous [
2,
20,
28].
In this study, the above approach was employed, and the thermoelectric properties of Cu-Ni-based alloys were investigated. To date, only a few studies have investigated Cu-Ni alloys for thermoelectric purposes. Some researchers tried to alter the material at the nanoscale by incorporating carbon nanotubes or Al
2O
3 nanoparticles into the alloy [
24,
29]. In both cases, the thermal conductivity could be significantly lowered, resulting in an increased
zT up to 0.35 at 800 K [
29]. However, the incorporation also strongly reduced the electrical conductivity and therefore the power factor. Nanostructured and nanotwinned Cu-Ni alloys were also investigated and were found to reach an exceptionally high power factor up to 100 µW·cm
−1·K
−2 at 900 K and a figure of merit of 0.18 [
25,
30]. Shimizu et al. presented a Cu/Cu-Ni thin film thermoelectric generator on a polyimide substrate; this film attained a remarkable power output of 21 µW at a temperature difference of 70 K [
31].
The approach of this study was to alter the structure of the metal on the atomic level by alloying Cu-Ni with heavier elements to beneficially influence the power factor and simultaneously reduce the thermal conductivity via long-range phonon scattering. Specifically, Sn and W were chosen as metals; they are both heavier than Ni and Cu but have quite different properties. While Sn has a low melting point of 505 K [
32] and mixes well with Cu (bronzen), W has a much higher melting point of 3695 K [
32] and is not incorporated in the matrix [
33]. The degree to which these different properties influence the resulting microstructure and the thermoelectric properties was studied. All alloys have been prepared from metal nanopowders via arc melting, in contrast to our previous report [
34] that presented the idea of Cu-Ni alloys from larger flakes resulting in more inhomogeneous distribution and inferior thermoelectric properties. By this, the influence of the utilization of nanopowders as well as the results of alloying with Sn and W are investigated.
2. Materials and Methods
If not mentioned otherwise, all metals were obtained from commercial vendors at 99.9% purity or higher and are used without further purification. Cu, Sn, and W nanopowders (average diameter less than 100 nm) were obtained from IoLiTec Nanomaterials (Heilbronn, Germany), and Ni (average diameter less than 100 nm) was obtained from Sigma-Aldrich (Taufkirchen, Germany). These powders were stored and processed under an inert gas (argon) atmosphere in a glove box. Metallic precursor mixtures were prepared by mixing, agitating, and shaking under argon with the stoichiometric ratios listed in
Table 1. The resulting powders were pressed into discs using a hydraulic press; they were subsequently arc-melted in a copper crucible to form ingots by means of an EWM TETRIX 521 CLASSIC activArc TIG welding machine (EWM, Mündersbach, Germany) that was operated for 30 s with a current of 150 A and an argon flow of 5 L·min
−1.
For the measurement of the Seebeck coefficient and the electrical conductivity, rod-shaped samples (3 mm diameter and 10 mm length) were cut with a Sodick AD325L wire electrical discharge machine (EDM, Sodick Deutschland GmbH, Düsseldorf-Lichtenbroich, Germany) unit. The microstructure and composition were characterized by X-ray diffraction (XRD, Bruker D8 Advance with Cu-Kα radiation, Bruker AXS GmbH, Karlsruhe, Germany) of the polished alloys and by field-emission scanning electron microscope (FE-SEM, ZEISS Supra 55 VP, Carl Zeiss Microscopy Deutschland GmbH, Oberkochen, Germany) of polished cross-sections. The electron microscope was additionally equipped with an energy-dispersive X-ray spectrometer (EDXS System Quantax from Bruker, Bruker AXS GmbH, Karlsruhe, Germany). The electrical conductivity σ was determined with a custom-made measurement cell with an ELITE thermal system and KEITHLEY 2100 digital multimeters (Keithly Instruments, Solon, OH, USA). The Seebeck coefficient α was measured using a ProbotStat A apparatus from NORECS AS (Haslevollen, Norway). The density was then determined at room temperature by using the Archimedes method with isopropanol as solvent. The thermal diffusivity was measured using a light flash analyzer (Netzsch LFA 467 HT, Netzsch-Gerätebau GmbH, Selb, Germany) from room temperature to 600 K. The heat capacity was calculated using the Dulong-Petit law.
3. Results and Discussion
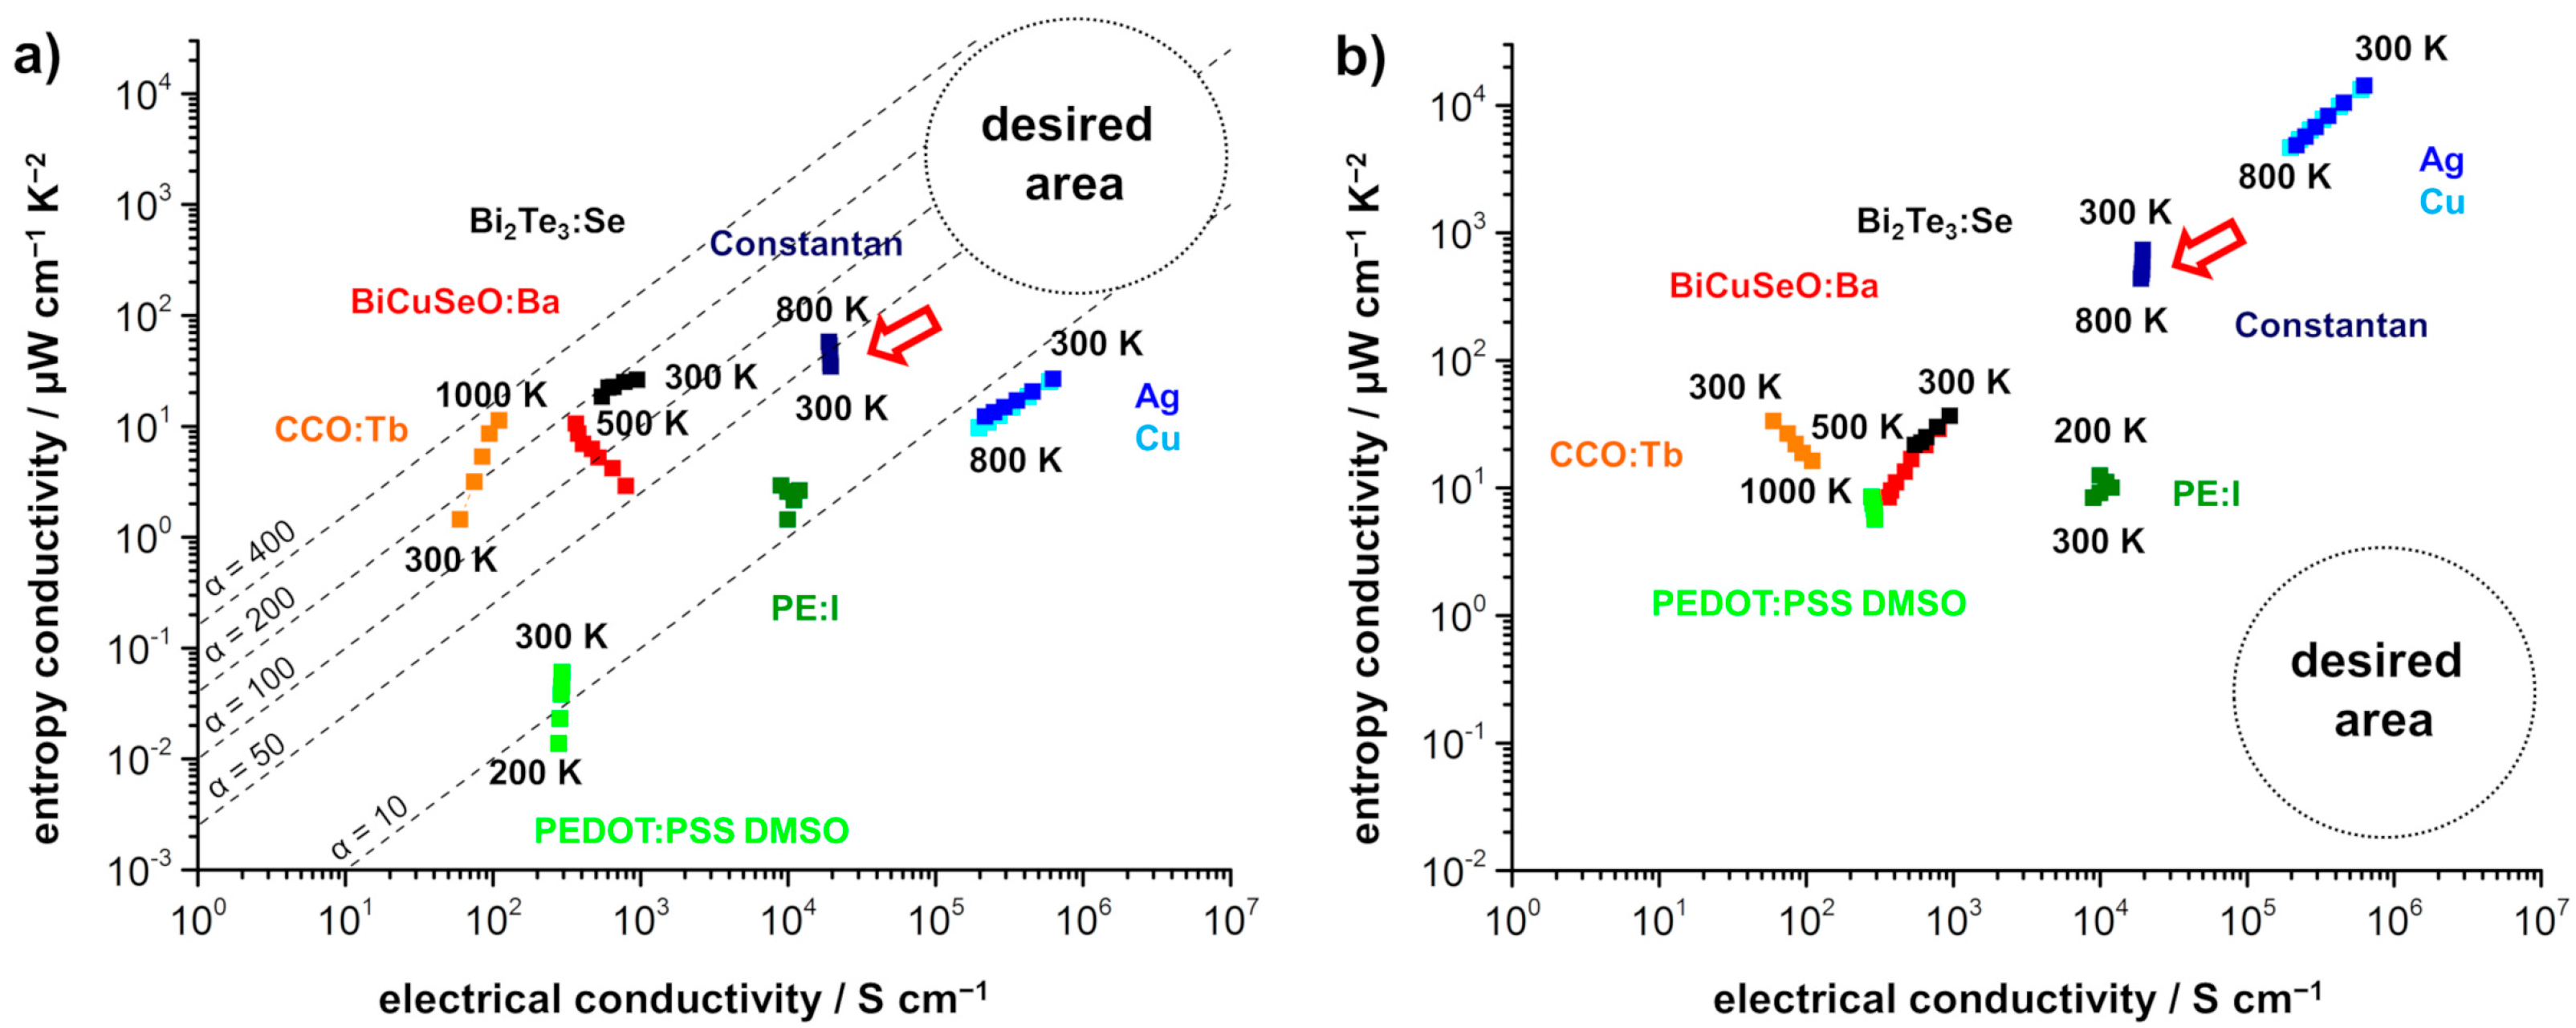
XRD patterns of the Cu-Ni-based alloys are shown in
Figure 2. For the Cu50Ni50 sample, good agreement with the literature data for Cu-Ni alloys is apparent. Small additional reflections marked with an asterisk correspond to minor NiO impurities, most likely due to the utilization of nanopowders, which are especially susceptible to oxidation due to their high surface area. This impurities can be identified for all Sn-alloyed samples, but cannot be identified for the 5 at.% and the 10 at.% W samples. For the Sn-alloyed samples, the observed 111 and 200 Cu-Ni reflections are shifted towards lower angles as indicated by vertical dashed lines. This can be explained by an incorporation of the Sn atoms into the Cu-Ni matrix, resulting in a larger lattice parameter. With increasing amount of Sn, this shift to lower angles becomes more apparent (
Figure 2a). Additionally, no pure Sn inclusion can be identified. In the W-alloyed samples, the Cu-Ni reflections are not shifted, as again indicated by vertical dashed lines, and additional reflections can be observed for the 10 at.% W sample, which match the reflections expected for pure W from the literature (
Figure 2b). This indicates that W is not incorporated into the matrix, but forms a separate phase, which is in good agreement with the much higher melting point and the previous results of the flake-based samples [
34]. As a result, Sn seems to be at least partly incorporated into the matrix, while tungsten primarily forms inclusion. For the alloys, changed ratios of the intensities of the 111 and 200 reflections can be detected, e.g., shown in the Sn2 sample, which is based on a preferred orientation due to directed solidification in the arc-melting process. This has been reported before for arc-melted Cu-Ni alloys [
25,
30] but with minor influence on the thermoelectric properties due to the isotropic fcc crystal structure [
30].
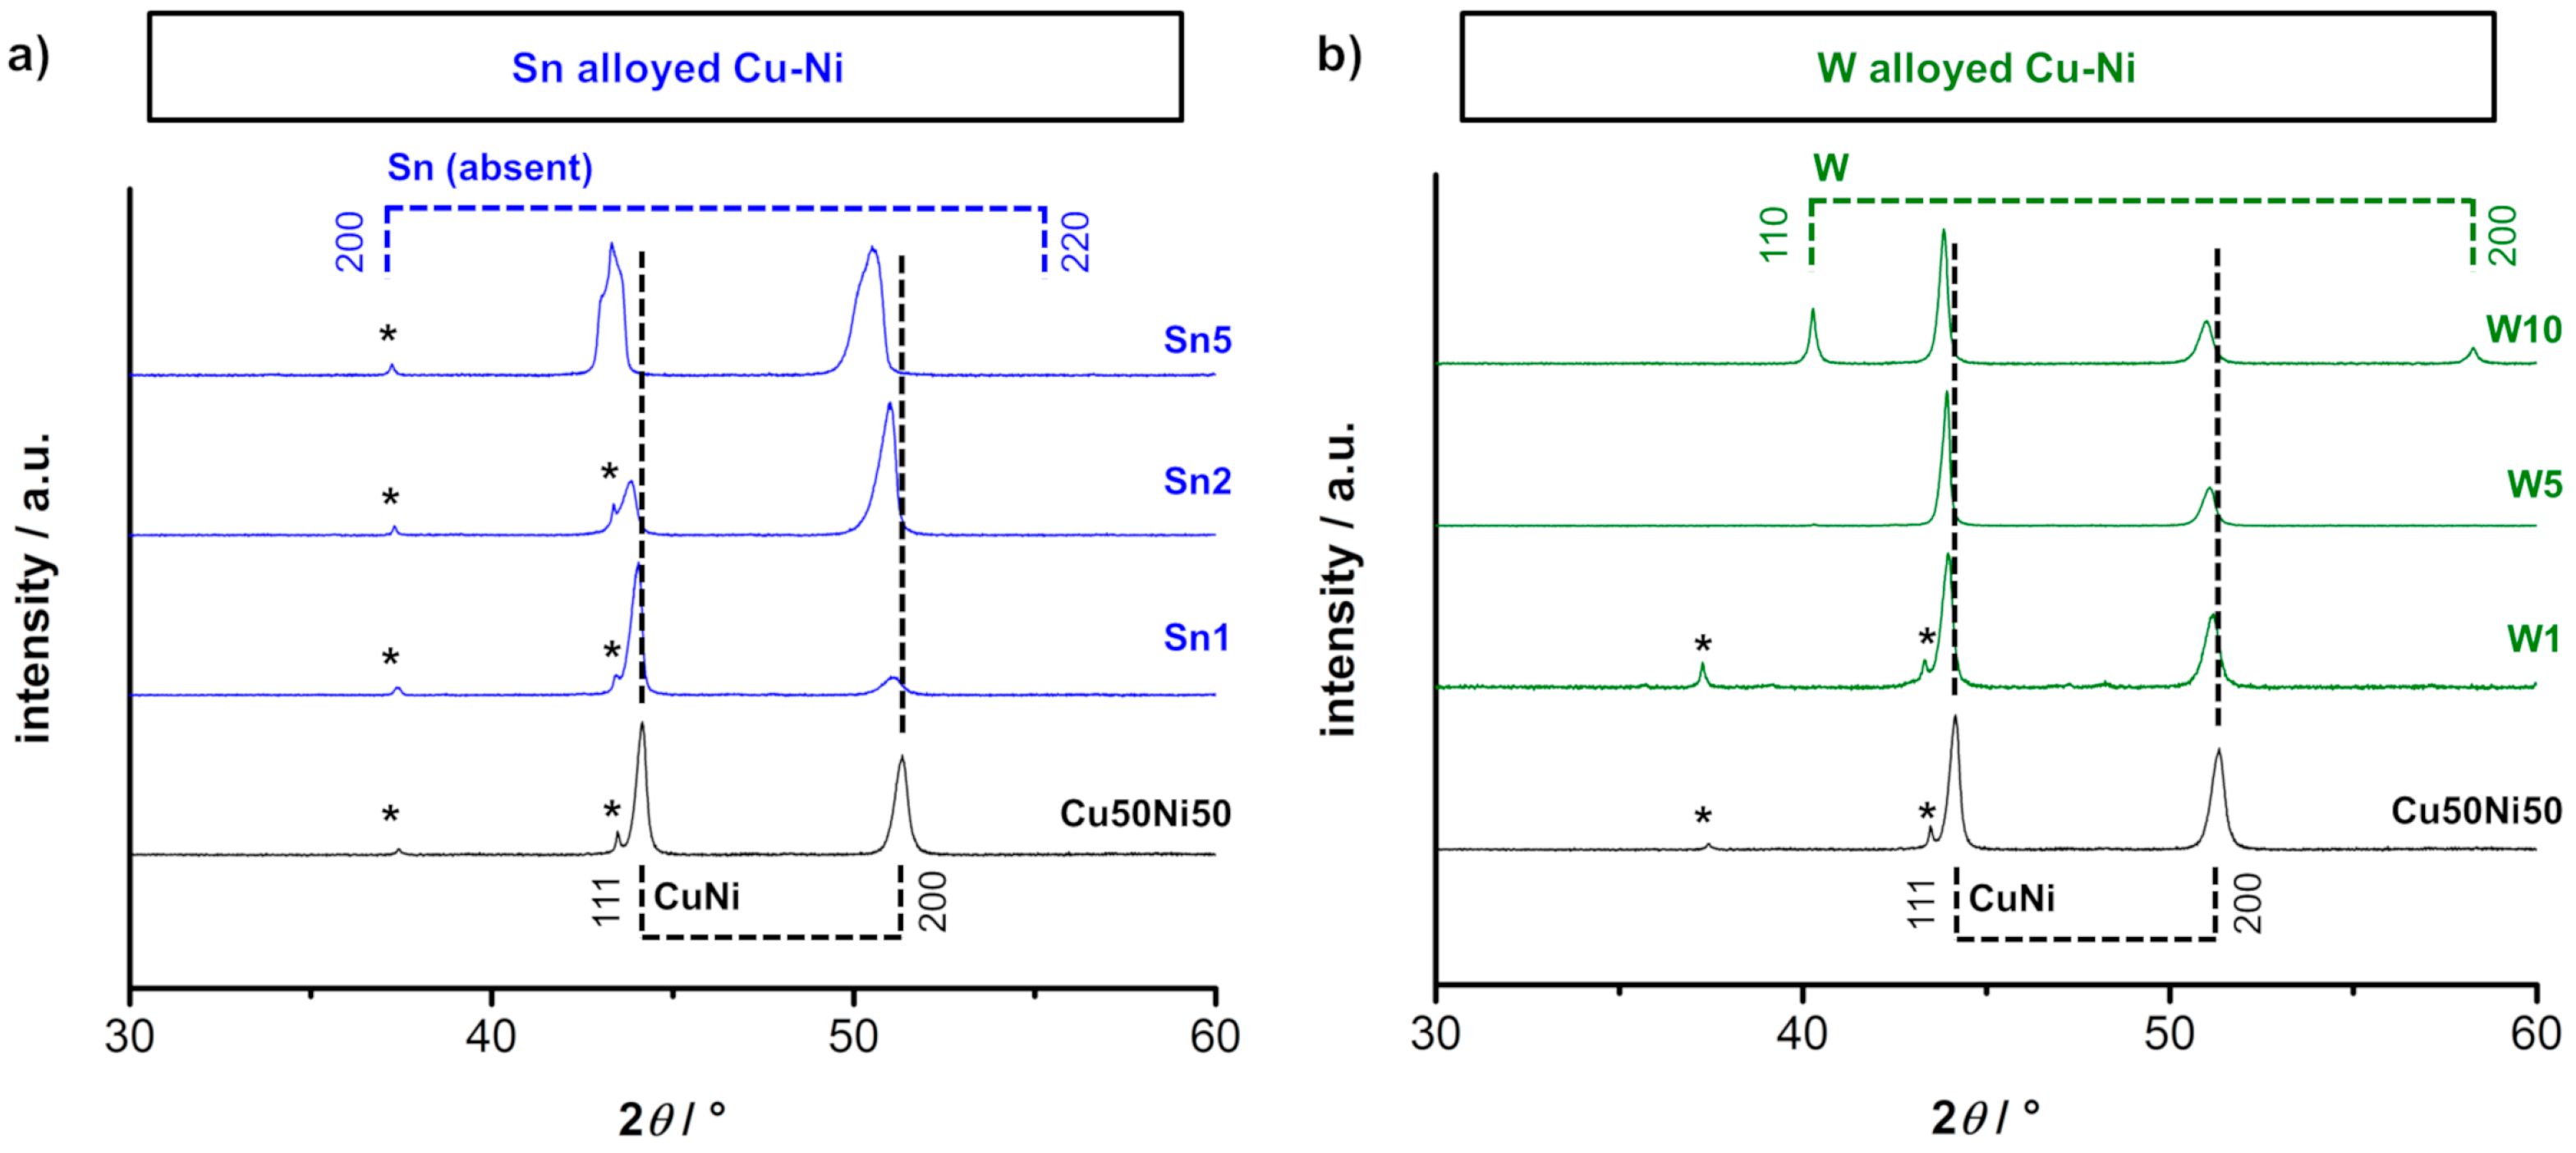
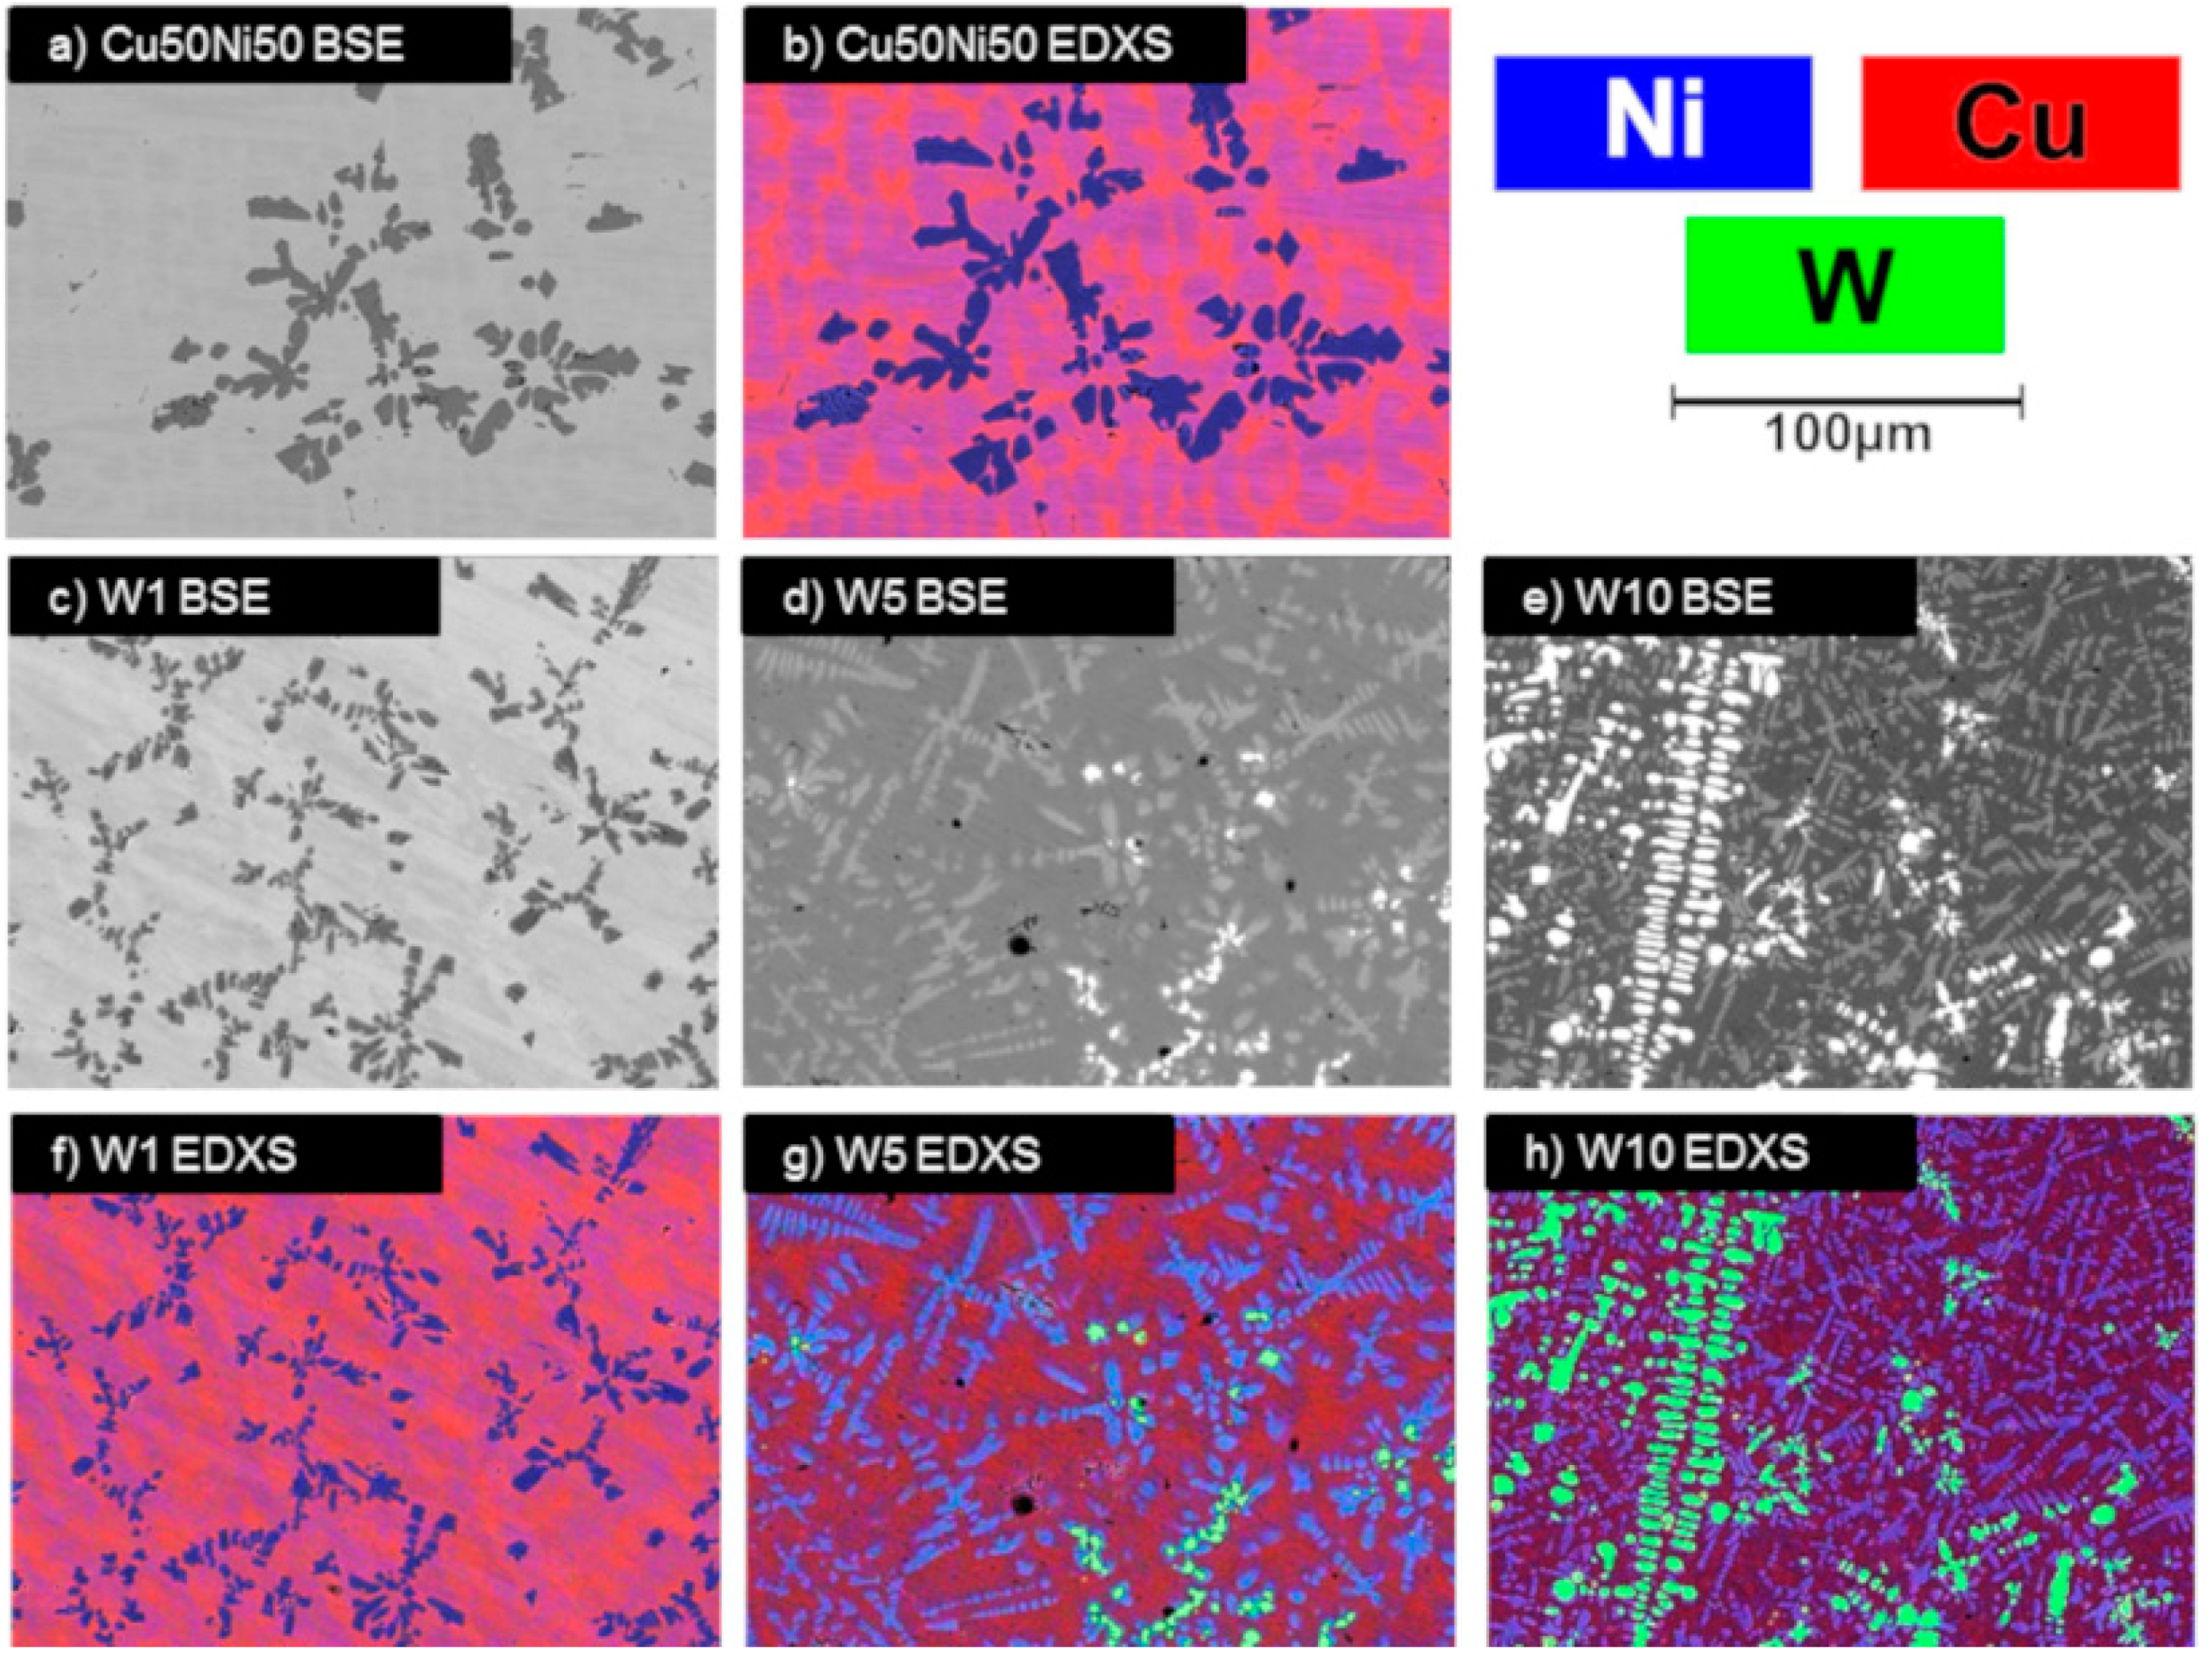
Backscattered electron (BSE) micrographs and EDXS elemental mappings for Cu, Ni, Sn, and W of the Cu50Ni50 sample and the Sn-alloyed samples are shown in
Figure 3. The BSE micrograph of the Cu50Ni50 sample shows a mostly homogeneous distribution and some darker spots indicating lighter elements such as oxygen. Alongside the small impurities found in the XRD pattern, this could be caused by NiO inclusions. Within the EDXS mapping, the mostly purple coloration is assumed to indicate a relatively homogenous distribution of Ni (blue) and Cu (red). This shows a significantly improved elemental distribution due to the utilization of nanopowders, compared to the large flake-based samples [
34]. However, some areas with increased Cu or Sn concentrations are still recognizable. On closer inspection, it is noticeable that Sn mixes preferentially with Cu (reddish-turquoise spots), while there is less mixing of Ni and Sn (blueish-magenta spots). This indicates that on a macroscopic scale, Sn is at least partly incorporated into the Cu-Ni matrix. Additionally, small lighter spots are recognizable within the BSE micrographs, which correspond to Sn-rich areas according to the EDXS elemental analysis. Although the XRD patterns show that Sn is incorporated into the structure, some additional small Sn-rich spots are also formed. Hence, Sn seems to be partly incorporated and partly separated in another phase. This is most likely the result of two factors: First, the mixture of the nanopowders was prepared by mixing, agitating, and shaking under inert gas. This may not result in a homogeneous mixture on the nanoscale and may be improved by dispersing the powders in an organic solvent with a subsequent drying step or via a bottom-up synthesis. Second, the relatively short time of the arc-melting compared to annealing the alloys for several hours does not allow the molten particles much time for better distribution and incorporation. The Sn-alloyed samples also exhibit dark blue, Ni-rich spots. Here, a beginning dendritic growth of this inclusion becomes apparent, which has been reported for NiO before [
35,
36,
37]. It is assumed, that the formation of NiO is also a result of the utilization of nanopowders, which are susceptible to oxidation due to their high surface area.
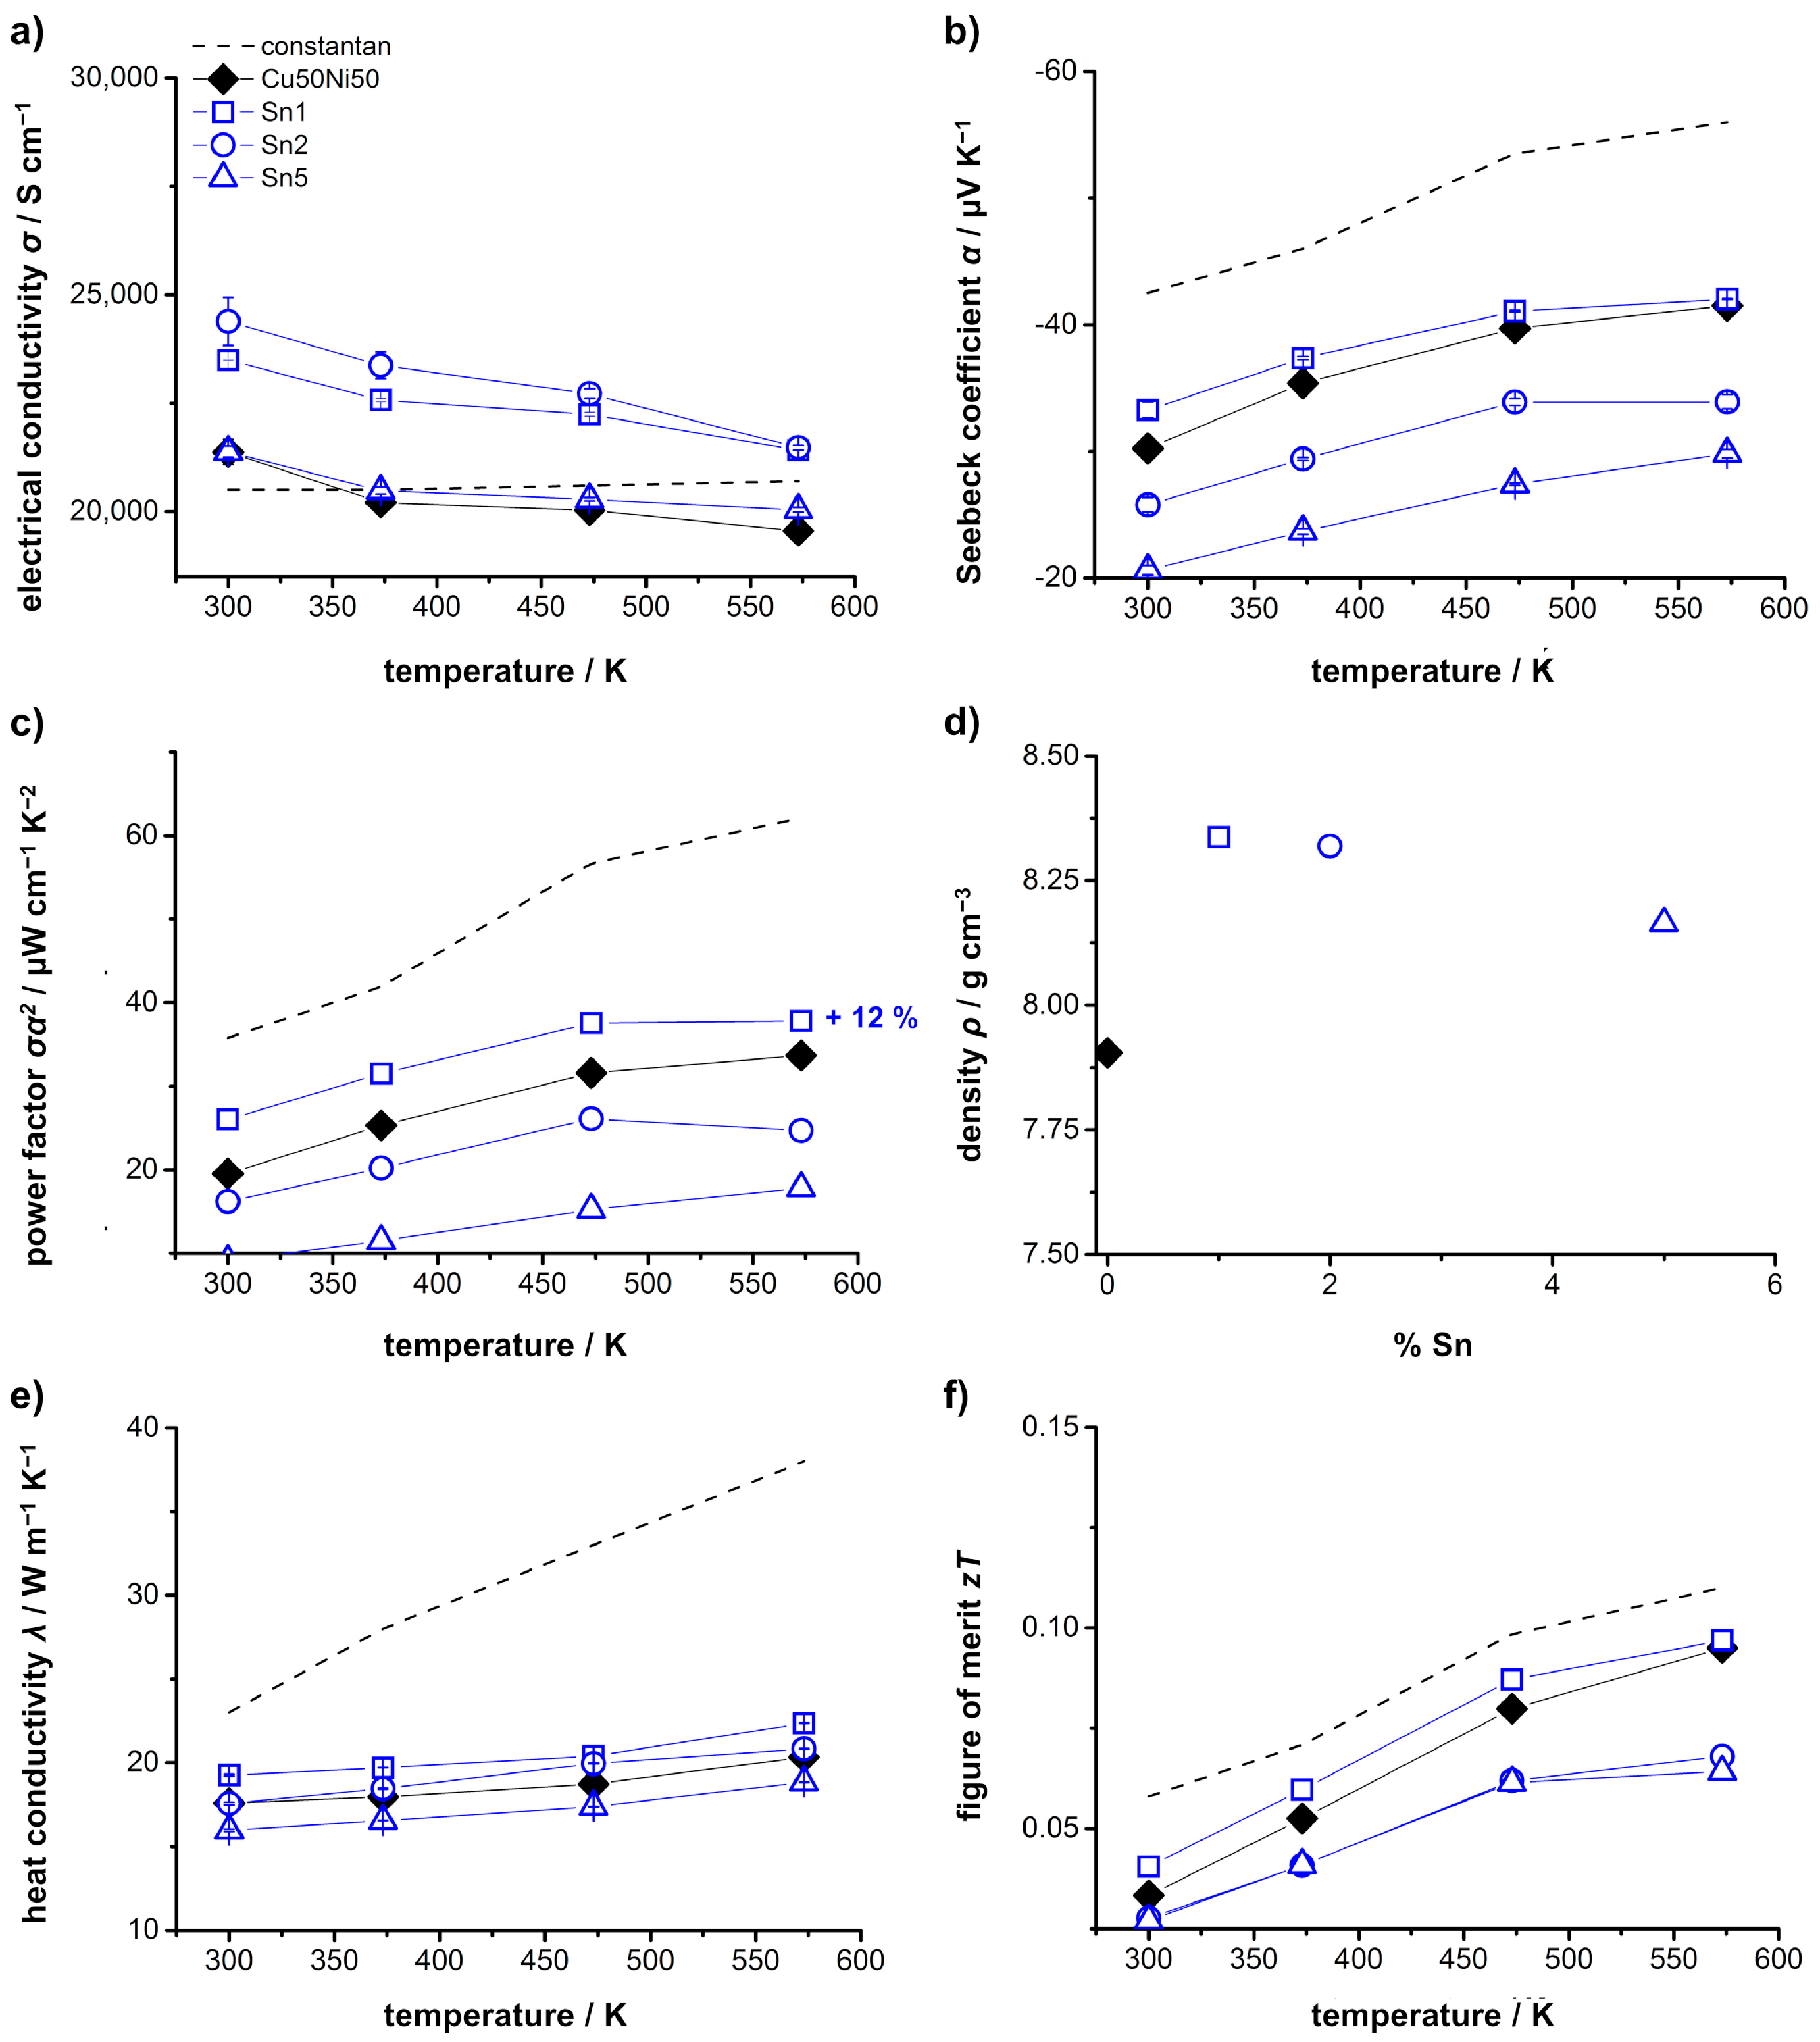
The measured temperature-dependent thermoelectric properties of the Sn-alloyed samples are shown in
Figure 4. Here, an additional comparison to the constantan alloy (Cu
56Ni
42Mn
2) reported from Mao et al. [
25] was chosen (dashed lines), as they also used a top-down approach via ball-milling with subsequent arc-melting, resulting in the best comparability. In the following, this literature sample for comparison is referred to as constantan. The Cu50Ni50 sample shows a similar electrical conductivity compared to constantan around 20,000 S·cm
−1 with weak temperature dependence. After alloying with 1 at.% Sn (Sn1), an increased electrical conductivity between 23,500 and 21,500 S·cm
−1 could be reached (
Figure 4a). For 2 at.% Sn (Sn2), the electrical conductivity is again slightly increased, up to 24,500 S·cm
−1 at 300 K. Afterwards, it decreases with increasing amount of Sn, equaling the Cu50Ni50 sample with 5 at.% Sn, as further Sn addition forms more and more inclusions. All prepared samples show a more metallic behavior, with a decreasing electrical conductivity with increasing temperature. The higher electrical conductivity of the Sn1 and Sn2 samples is assumed to be a result of the incorporation of the Sn into the matrix, which directly influences the charge carrier concentration. The Seebeck coefficient of the Sn1 sample is slightly higher compared to Cu50Ni50 and then also shows a slightly decreasing behavior with increasing amounts of Sn (
Figure 4b). The resulting power factor (
Figure 4c) of 38 µW·cm
−1·K
−2 at 573 K for the Sn1 sample is therefore about 12% higher compared to the Cu50Ni50, surpassing the aforementioned half-Heusler compounds, which usually show a power factor around 20 to 30 µW·cm
−1·K
−2 in this temperature region [
19]. Compared to constantan, however, the resulting power factor is lower due to the diminished Seebeck coefficient. The density of the metal alloys (
Figure 4d) increases as a result of the Sn inclusion for the Sn1 sample and also shows a decreasing behavior with increasing amounts of Sn. The values for the heat conductivity of the Sn-alloyed samples are shown in
Figure 4e. With 1 at.% Sn, the heat conductivity is slightly higher compared to the Cu50Ni50 sample, due to the much higher electrical conductivity. With increasing amounts of Sn, the heat conductivity decreases as expected, as a result of the decreasing electrical conductivity and long-range phonon scattering at the inclusions. Compared to constantan, the samples are characterized by a significantly lower thermal conductivity, probably also due to the utilization of nanopowders. Finally, the resulting figure of merit is displayed in
Figure 4f. As a result of the increased electrical conductivity, the
zT of the Sn1 sample is slightly higher compared to the Cu50Ni50, but slightly lower compared to constantan, reaching a
zT value up to 0.09 at 573 K. The
zT value of the Cu50Ni50 is therefore also slightly lower compared to constantan, as it is characterized by a lower Seebeck coefficient, which is not fully compensated by the lower thermal conductivity.
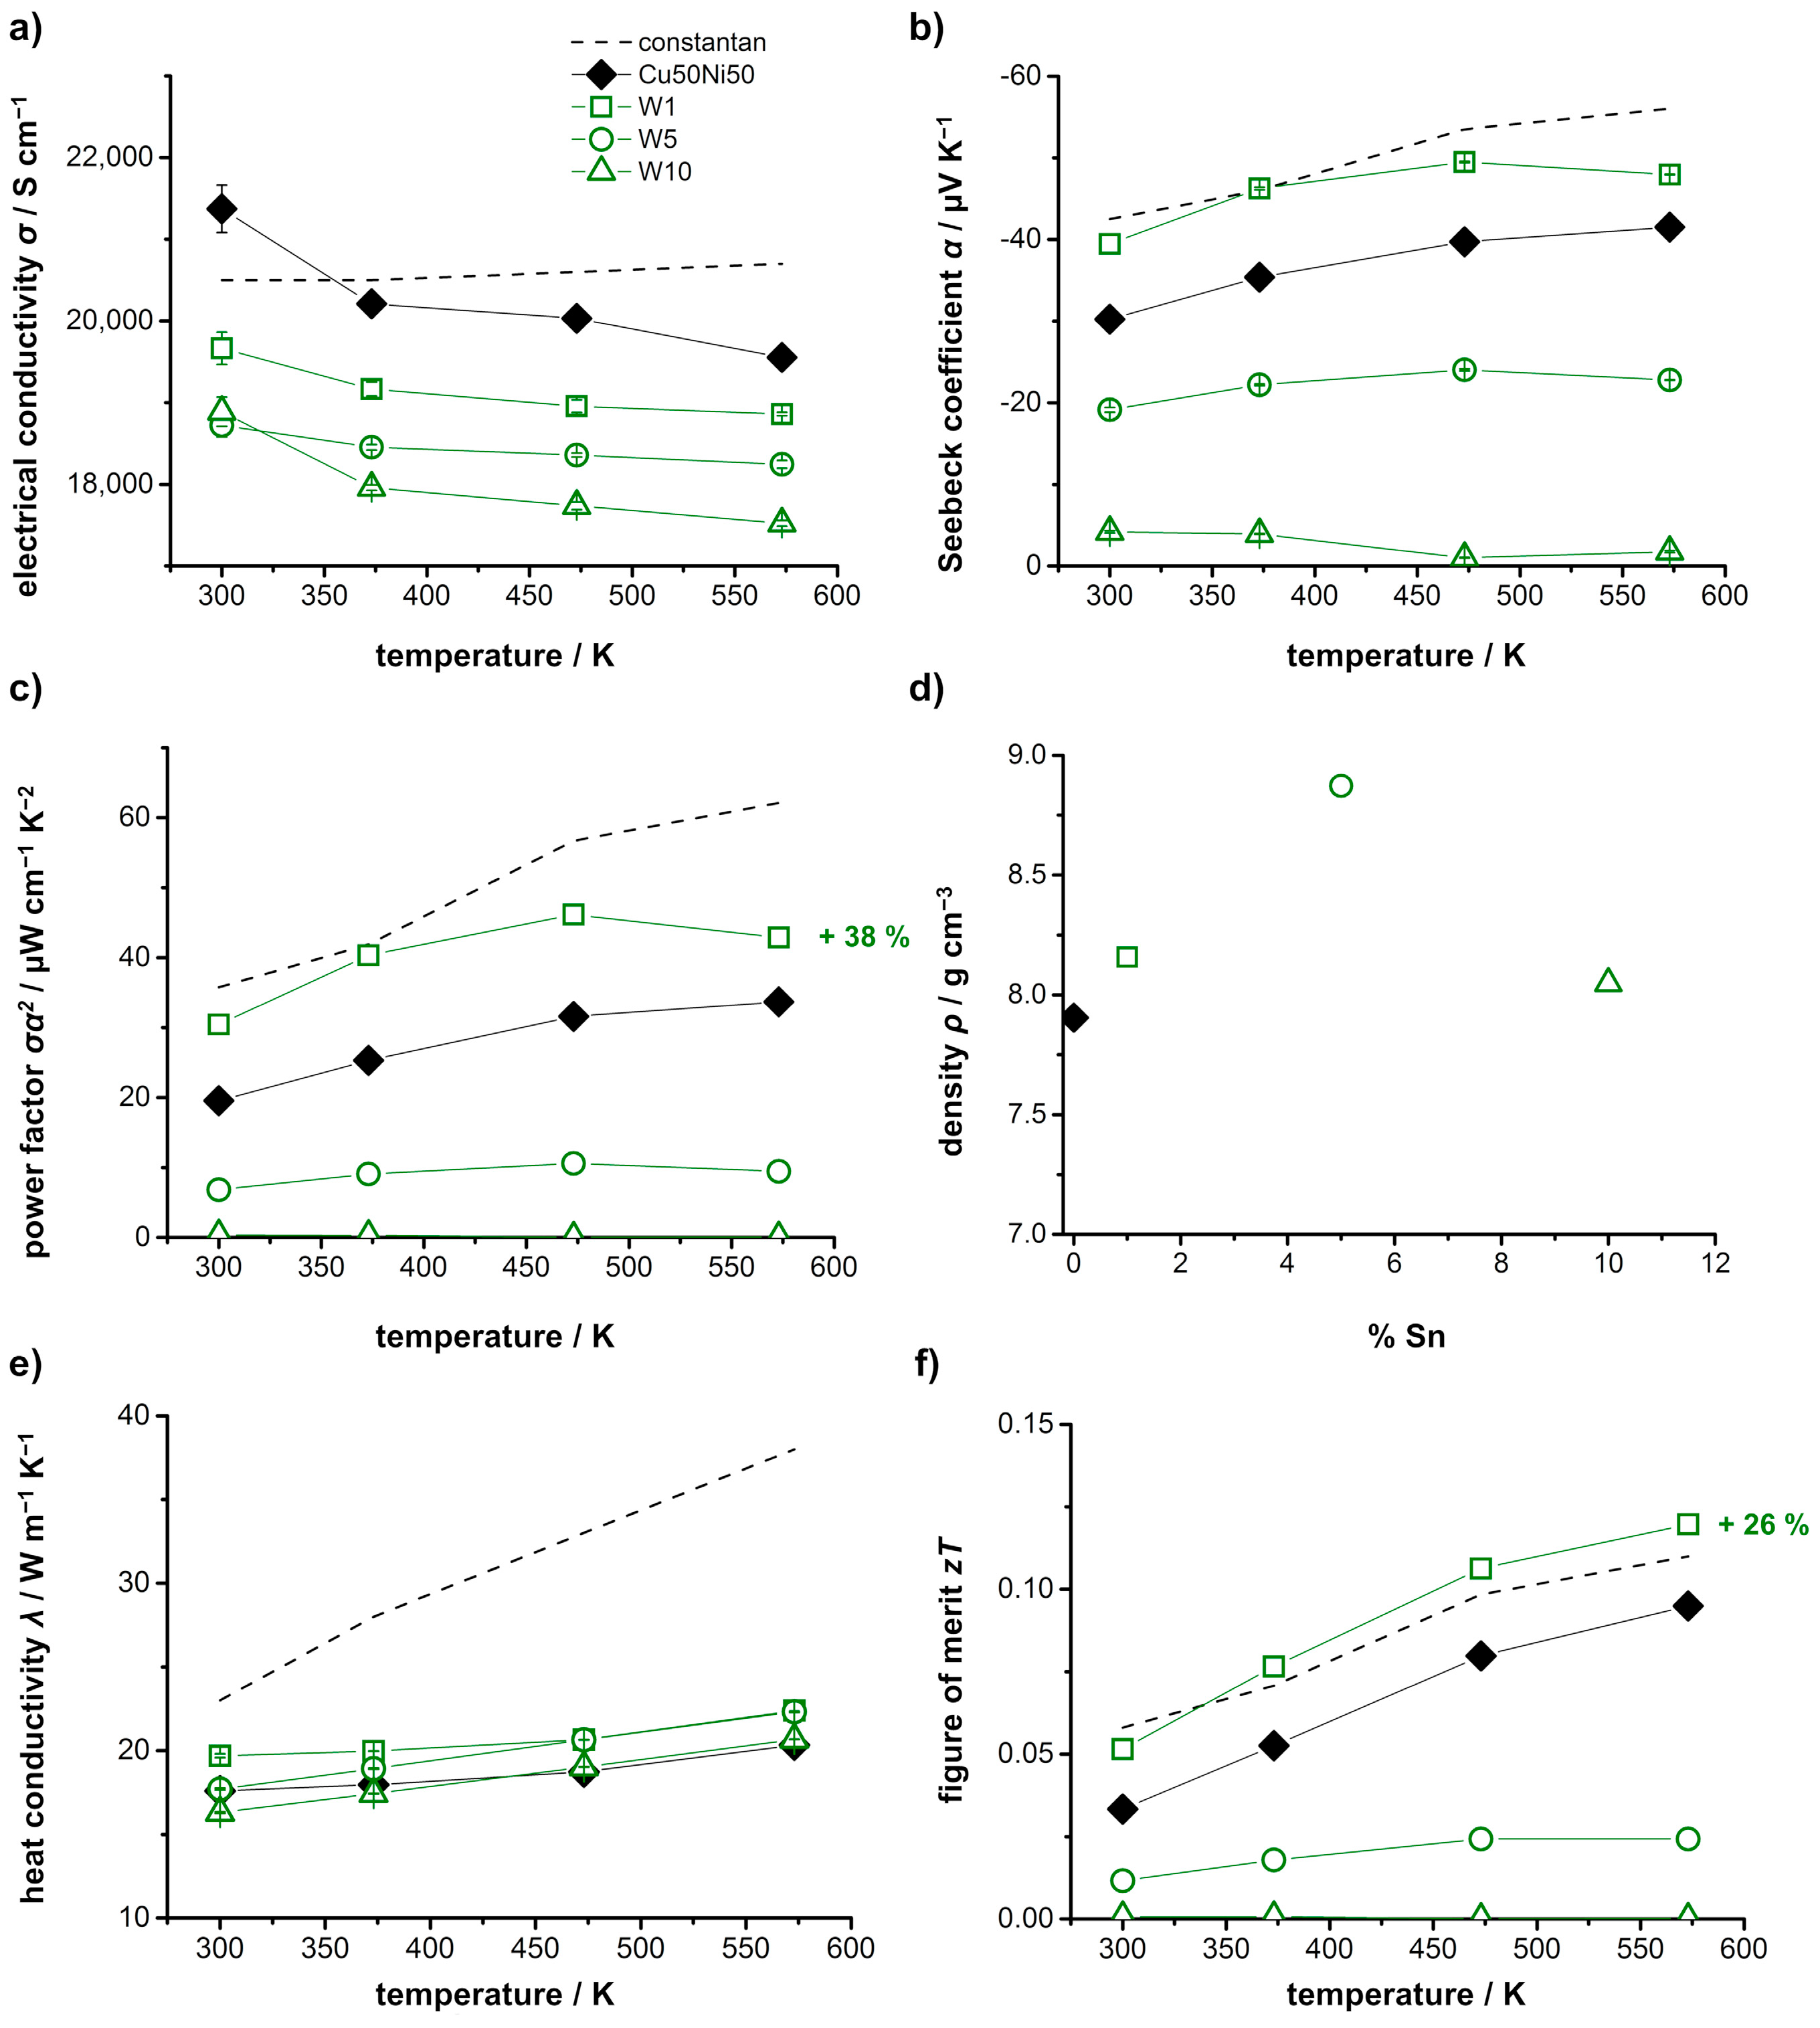
SEM microstructural analyses of the W-alloyed Cu-Ni samples are shown in
Figure 5. The distribution of Cu and Ni is analogous to the Sn-alloyed samples and again NiO inclusions can be seen in all samples. In accordance to the discussion of the XRD patterns, the W seems to be not incorporated into the matrix and can be clearly identified as lighter spots in the BSE micrographs. With increasing amount of W, more of these spots become apparent. This is confirmed by the EDXS elemental mappings of these samples, where sharply defined green spots are recognizable; they also show that W forms its own pure phase and is not part of the matrix.
The measured temperature-dependent thermoelectric properties of the W-alloyed samples are shown in
Figure 6. A comparison to constantan is again shown via dashed lines. The electrical conductivity slightly decreases as a result of the W inclusions and with increasing amount of W (
Figure 6a). The Seebeck coefficient of the W1 sample is slightly higher compared to the Cu50Ni50 sample and similar to constantan (
Figure 6b). However, with increasing amount of W, the Seebeck coefficient shows the same decrease as in the Sn samples. As a result, the power factor (
Figure 6c) of the W1 sample is also higher compared to the Cu50Ni50 sample (about 38%), due to the higher Seebeck coefficient, but decreases with increasing amount of W. This behavior is analogous to the Sn-alloyed samples; however, here the increased power factor is a result of a higher Seebeck coefficient, while in the Sn-alloyed samples it is based on a higher electrical conductivity. Compared to constantan, the power factor is slightly lower. The values of the sample density also show a similar behavior as the Sn-alloyed samples; first it shows an increase up to 5 at.% and then decreases to the value of the Cu50Ni50 sample (
Figure 6d). The measured heat conductivity again decreases with increasing amounts of W, as expected, due to the decreasing electrical conductivity and long-range phonon scattering due to the inclusions (
Figure 6e). Here, the alloying with 1 at.% W results in a figure of merit of approximately 0.12 at 573 K, corresponding to an increase of about 26% compared to the Cu50Ni50 sample. (
Figure 6f).
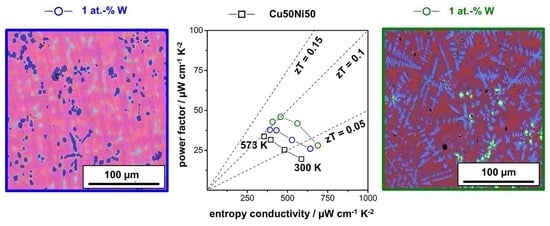
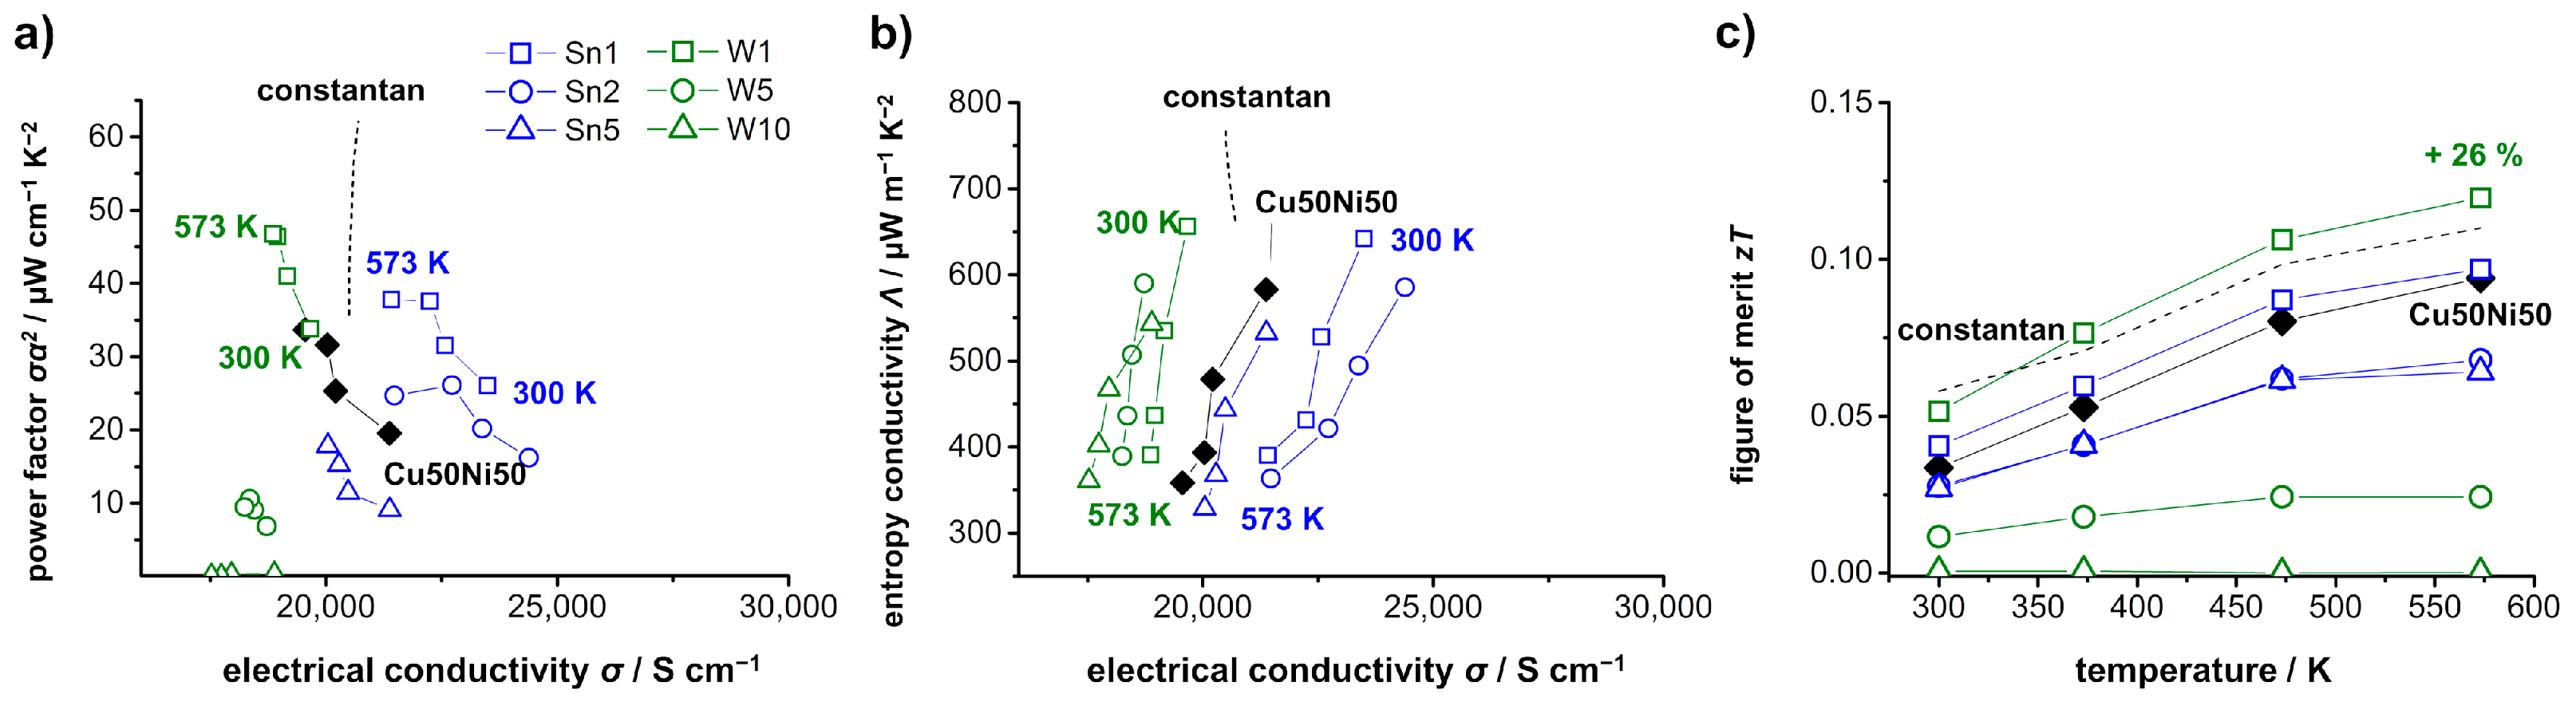
Figure 7 summarizes the measured thermoelectric properties of the Sn-alloyed and W-alloyed Cu-Ni samples. In the type I Ioffe plot (
Figure 7a), the power factor of the samples is shown as a function of the electrical conductivity. Both, the Sn1 and W1 sample exhibit a higher power factor compared to the Cu50Ni50 sample, but slightly lower values compared to the reported ones for constantan. The Sn-alloyed samples show a strong increase in the electrical conductivity, most likely due to the incorporation of the Sn into the matrix and the consequent influence on the charge carrier concentration. The W-alloyed samples are characterized by a higher Seebeck coefficient, but a decreased electrical conductivity as it is not incorporated and primarily forms inclusions. In the type II Ioffe plot (
Figure 7b), the entropy conductivity is displayed as a function of the electrical conductivity. All prepared samples have a lower thermal conductivity compared to constantan, which is based on the alloying with Sn and W resulting in enhanced phonon scattering, especially at the inclusions, and on the utilization of nanopowders. With increasing amounts of Sn and W, the thermal conductivity further decreases slightly. The resulting figure of merit of all prepared samples is shown in
Figure 7c. For W-alloying, the respective sample with 1 at.% is characterized by an increased
zT value of 0.12, while the Sn-alloying resulted in similar
zT value of 0.09.
Overall, Cu-Ni alloys containing Sn and W could be prepared. Due to the utilization of nanopowders, the distribution within the alloys could be significantly improved compared to large flake-based samples [
34]. However, the distribution and homogeneity of the Sn and W can still be further enhanced, as both can still be identified as inclusions, although especially Sn should be incorporated in the Cu-Ni matrix. To improve this, other or multiple melting steps or additional annealing steps could be applied. Additionally, formation of NiO impurities could be found (see
Figure 2,
Figure 3 and
Figure 5), which also might influence the resulting thermoelectric properties. Generally, these impurities should lead to a reduced electrical conductivity, due to the insulating character of NiO, but simultaneously also to a lower thermal conductivity. Here, the latter has been found for all investigated alloys. For the electrical conductivity, however, the expected decrease can be identified for the W-alloyed sample, while alloying with small amount of Sn shows an increase in electrical conductivity, due to the incorporation of Sn into the matrix. If these impurities can be avoided, the thermoelectric properties and especially the power factor may be improved even further. In general, alloying with only small amounts, namely, 1 at.% Sn or W, shows a beneficial behavior. For these samples, a higher power factor of 38 and 47 µW·cm
−1·K
−2 and
zT values of 0.09 and 0.12 were determined, respectively, corresponding to an increase of approximately 12 and 38% in the power factor compared to the Cu50Ni50 sample and 26% increase in the figure of merit for the W-alloyed sample. Here, alloying with Sn resulted mainly in an increase in electrical conductivity, while alloying with W resulted in an increase of the Seebeck coefficient. This proves the potential of utilizing nanopowders, as a preparation from large metal flakes did not result in improved properties [
34]. Compared to other works, Kang et al. [
30] also prepared constantan with a nominal composition of Cu
56Ni
42Mn
2 doped with 0.25 at.% Zr via ball milling and induction melting, resulting in similar values to constantan for the undoped samples and increased values for Zr-doped samples with a power factor of 80 µW·cm
−1·K
−2 and a peak
zT of 0.22 at 800 K after aging. Yuan et al. [
29] prepared a Cu
55Ni
45Se/carbon nanotube hybrid material via ball milling and annealing, resulting in a
zT value of 0.35 at 873 K, strongly increased by the inclusion of the carbon nanotubes, which leads to a drastically lowered thermal conductivity. Here, the results of this work are slightly lower, but show the beneficial characteristics by alloying with other elements and the utilization of nanopowders, which could be consequently combined with other concepts. These results underline the potential of these mostly overlooked materials; by alloying with other metals, the thermoelectric properties can be further enhanced and may even reach a moderate figure of merit
zT, under maintaining a high power factor within an inexpensive, nontoxic, and easily obtainable material.


 ,
, 


