Abstract
This study aims to compare the effect of corticosteroid injection (CSI) followed by therapeutic ultrasound (TUS) with that of extracorporeal shock wave therapy (ESWT) in patients with chronic plantar fasciitis (PF) and to explore the impact of a sedentary lifestyle and obesity on treatment outcomes. Female patients with PF were randomly allocated to receive ESWT (group A, n = 25) or CSI + TUS (group B, n = 25). Interventions: Group A received four once-weekly sessions of ESWT (2000 shocks, 2.5 bar pressure, 10.0 Hz frequency). Group B received a local injection of 40 mg triamcinolone acetonide with 2 mL 1% xylocaine, followed by three sessions of TUS per week for two weeks. Pain visual analog scale (VAS pain), plantar fasciitis pain and disability scale (PFPDS), and fascia thickness using musculoskeletal ultrasound were all measured at baseline, 4 weeks, and 12 weeks after the end of treatment. VAS pain and PFPDS improved significantly in both groups after 4 and 12 weeks. In the ESWT group, the pain improved significantly more at 12 weeks (p = 0.004). In obese patients (BMI > 29.9 kg/m2), ESWT gave more long-term pain relief at 12 weeks follow-up. In both the ESWT and CSI + TUS groups, after 12 weeks, the VAS pain improved more in patients with a sedentary daily life than in those with active life (p = 0.021 and p = 0.014, resp.), as well as the PFPDS (p = 0.014 and p = 0.019, resp.). Plantar fascia thickness decreased in both groups at 12 weeks. In both groups, improvements in function (PFPDS) correlated significantly with decreased plantar fascia thickness at 4 and 12 weeks. In the CSI + TUS group only, the decrease in plantar fascia thickness was correlated with pain improvement at both follow-up visits. Echogenicity changed from hypoechoic to iso- or hyperechoic and improved significantly in both groups at 12 weeks follow-up, but changes were not different between the groups (p = 0.208). Both CSI + TUS and ESWT are effective treatments for female patients with chronic plantar fasciitis resulting in pain relief and improved function and fascia thickness. ESWT gave more pain relief at 12 weeks follow-up. CSI + TUS is effective as a rapid and short-term modality for relieving PF pain. According to previous studies, the addition of TUS does not appear to make CSI much more effective.
1. Introduction
Plantar fasciitis (PF) is the most common cause of heel pain in adults seen in primary care, resulting in more than 600,000 outpatient visits annually in the USA alone [1,2,3]. The lifetime prevalence of PF is 10%. It affects people of all ages, but occurrences peak in patients between 40 and 60 years, with most patients who develop PF being overweight [4]. In 29% of cases, the condition is bilateral [5]. Annually, the cost of treatments for PF in the USA is estimated to be between USD 192 and USD 376 million [6]. The prevalence of PF with pain in the past month in the USA was estimated at 0.85%, higher in women (1.19%) than in men (0.47%), in people between 45 and 64 years (1.33%) than those aged 18–44 (0.53%), and higher in people with obesity (1.48%) than in people with a body mass index < 25 (0.29%) [7]. In Saudi Arabia, among 270 patients with heel pain in primary health care clinics, 156 (57.8%) had PF. Of these, 56.4% were men, two-thirds were obese (66.7%), and many had wrong shoes (58.3%). Most had a sedentary lifestyle (89.7%) [2].
The plantar fascia is a band of connective tissue supporting the arch of the foot between the calcaneus and metatarsal heads. Above and interlaced with the plantar fascia is the flexor digitorum brevis muscle with a tendon attached to the calcaneus. PF is an enthesopathy with degenerative pathological changes that are partially reversible [4]. Despite the fact that it is such a common disorder, the exact etiology of PF is still unclear and includes chronic inflammation, degeneration, microtrauma of the plantar fascia, overuse syndrome, entrapment of the lateral plantar nerve, heel spurs, heel pad atrophy, and seronegative arthritis-induced inflammation [8].
The diagnosis of PF is based on a patient’s medical history and physical examination. Patients usually present with plantar heel pain when bearing weight, particularly when getting up in the morning (first step pain) or after a period of rest; then, the pain severity decreases over a few minutes and increases as the feet continue to bear the body weight [9]. Imaging studies with ultrasound (US), X-rays, or magnetic resonance imaging (MRI) are not needed for diagnosis, only when other causes of the pain are suspected. The diagnosis can easily be confirmed with US, as people with PF are likely to have a thickened plantar fascia (normal 2–3 mm) associated with fluid collection. Thickness values > 4.0 mm (about 0.16 inch) are diagnostic of PF when combined with reduced echogenicity, loss of definition of the borders of the fascia distal to the anteroinferior border of the calcaneus, or both [10]. Plantar fascia thickness values, as measured with US, have also been used to measure the effectiveness of treatments, showing a significant correlation between decreased plantar fascia thickness and symptom improvement [11].
Treatment modalities of PF include rest, heel cushions, non-steroidal anti-inflammatory drugs (NSAIDs), local corticosteroid injection (CSI), physiotherapy with stretching exercises, extracorporeal shock wave therapy (ESWT), and laser therapy. They may often take from 6 months to 1 year to have effect [12]. In most patients, the condition resolves over time with adequate treatment. However, PF can become chronic and debilitating. Given the high secondary cost of chronic immobility due to PF, active treatment of chronic PF is warranted in patients who do not respond to conservative treatment [4]. In a prospective pilot study, Yildiz et al. compared intensive physiotherapy, home-based exercise, and insole treatment. Pain and function, as well as quality of life, improved moderately in all groups. There was no significant difference between the groups after 6 weeks of treatment [13]. If a patient’s heel pain persists for more than two months, chronic PF is suspected, and in those cases, both ESWT and CSI are effective, but CSI is the first choice as it is more cost-effective [14]. ESWT may enhance wound healing and has been shown to be effective as a treatment of plantar fasciitis since the 1990s [15], with success rates ranging from 34% to 88% [16,17,18].
Several trials have evaluated the effect of CSI with and without lidocaine for PF treatment in comparison with placebo and found a significant difference in pain reduction in favor of prednisolone after one month [19,20]. On the other hand, a Cochrane study concluded that local CSI might slightly reduce heel pain for up to one month but not for a longer period when compared with placebo or no treatment [21]. Local CSI is a potent way to reduce inflammation and enhance the recovery process, but it does not replace the need for supportive shoes, foot orthoses, calf stretching, and other physical measures. In patients with prolonged intractable symptoms, surgery may be performed [8]. Therapeutic ultrasound (TUS) suppresses and hyper-stimulates the nociceptors, which may block the gate-control system [22]. TUS raises tissue temperature as well as metabolism and makes tissues softer. It increases blood circulation and the permeability of cell membranes and modulates molecular structures and protein production. All these factors may speed tissue recovery [23].
For this reason, we chose to add TUS after CSI, expecting to increase the effect of CSI in a pilot study. We are not aware of any previous studies applying TUS after corticosteroid injection in PF. The aim of the current orientating randomized trial was to evaluate the effect of treating chronic PF patients with CSI combined with TUS on pain, functioning, and thickness of the plantar fascia and to explore the impact of obesity and a sedentary lifestyle on treatment outcomes. We compared the effect of CSI + TUS with those obtained with ESWT treatment. We chose a twelve-week follow-up duration as we expected to observe the largest effect during the first three months after treatment [21].
2. Materials and Methods
2.1. Patients
This randomized controlled trial was carried out at the Rheumatology and Rehabilitation Department of the Faculty of Medicine, Suez Canal University, Ismailia, Egypt. From August 2019 to February 2020, female outpatients (n = 52) over 18 years with chronic PF were invited to participate. Participating patients signed informed consent. Only female patients were seen at this clinic; therefore, we did not include male patients.
2.2. Inclusion Criteria
All patients fulfilled the criteria classifying people with heel pain in the category of plantar fasciitis according to the International Statistical Classification of Diseases and Related Health Problems (ICD): pain in the plantar medial heel region on palpation; pain most noticeably with initial steps after a period of inactivity but also worse following prolonged weight-bearing; and pain often precipitated by a recent increase in weight-bearing activity [24]. All had a history of more than 3 months of unsuccessful conservative medical treatment, including exercises, insoles, and orthoses.
2.3. Exclusion Criteria
Female patients younger than 18 years were excluded, as well as those with heel pain due to fracture or previous surgery, inflammatory arthritis, seronegative spondyloarthritis, or traumatic heel pain. Patients were also excluded when there was a contraindication to ESWT or TUS, such as neoplasia, current or previous infections of the affected area (cellulitis, skin ulceration at area of therapy application), a history of epilepsy, coagulopathies, sensory neuropathy, diabetes mellitus, cardiac pacemaker, and pregnancy. Patients with major psychiatric disorders were excluded. Patients were also excluded if they had received peritendinous injections (local anesthetic and/or corticosteroids) administered in the affected foot before enrollment or if they had already received ESWT or CSI followed by TUS in the affected foot.
2.4. Methods
2.4.1. Assessments
All baseline assessments were performed immediately prior to the first treatment intervention. The primary outcome measures were VAS pain and PFPDS.
Pain was measured at baseline, at 4 weeks, and 12 weeks after the end of treatment using a visual analog scale (VAS pain). All patients were asked to mark the severity of their heel pain on a one-centimeter graded 10 cm line, with 0 indicating no pain and 10 indicating the worst pain imaginable.
Pain/disability/functioning was assessed with the plantar fasciitis pain and disability scale (PFPDS) [25]. The PFPDS was filled in at baseline, at 4 weeks, and 12 weeks after the end of treatment. The PFPDS includes a series of key questions that relate to symptoms and control questions for PF. It also includes a visual analog scale and questions to measure the effect that pain has on activities of daily living.
Musculoskeletal ultrasound (MSKUS) evaluation of the plantar fascia was performed at the initial assessment, 4 weeks after starting the treatment program, and after 3 months for all patients by the same physician (MAH). Plantar fascia thickness, echogenicity, and fibrillar pattern were assessed using high-resolution equipment (SONOACERS5, Samsung Medison) with a multi-frequency (5–12 MHz) linear transducer. Patients were examined in the prone position with the foot hanging over the examination table, knee extended, and ankle in 90° dorsiflexion. The linear probe was placed in the longitudinal plane over the planter aspect of the hindfoot, with an adequate amount of gel placed in between. Images were taken in a plane medial to the middle line at the point of plantar fascia origin from the medial tubercle of the calcaneus bone. The thickness of the plantar fascia was measured from the base of the medial calcaneal tubercle, where a bright echogenic line was easily visible [26]. A perpendicular measurement was then taken to the top of the plantar fascia image, where the most inferior border of the plantar fascia was discernable from fat. Features assessed by MSKUS for this study were plantar fascia thickness and echogenicity. PF was diagnosed when the thickness exceeded 4 mm, echogenicity was reduced, or both [10].
Active and sedentary life and BMI measurements were performed at baseline by MAH.
During the intervention sessions and at the follow-ups, the patients were monitored for potential side effects, including skin redness, exacerbation of the pain, and rupture of the plantar fascia.
2.4.2. Randomization and Sample Size
All included patients were randomly allocated to groups A and B. We chose a three-month trial duration, as we expected the maximum improvement of the treatments during the first three months [21]. We aimed for a minimum of 25 patients in each group, as this would give us at least 80% power to detect a large between-group difference (d = 0.80) in symptoms as statistically significant (two-sided α = 0.05) using an independent t-test or non-parametric Mann–Whitney U test as calculated with G*Power 3.1.9.7 [27].
2.4.3. Interventions
All patients had been treated unsuccessfully for at least three months. They were allowed to continue measures such as exercises and ortheses, but no new measures were taken during the study period.
Group A was treated with ESWT, as described by Mardani et al. [18]. Before the treatment, the point of maximal tenderness was clinically located by the clinician, and the US coupling gel was applied to smoothen the wave transmission between the ESWT head and the skin. Radial shock waves (2.5 bar pressure, 10.0 Hz frequency, 2000 shocks) were transmitted to the areas of the painful heel, calcaneal insertion of the plantar fascia, and myofascial junction at the heel dorsum [28]. None of the patients was anesthetized. We chose to conduct four sessions of ESWT at one-week intervals, as that was the custom in our unit.
Group B was treated with CSI followed by TUS sessions. Patients were put in a lateral decubitus position with the affected foot down. The point of maximal tenderness was identified, and we marked the needle insertion site based on it. The skin was disinfected with alcohol swabs. The injection was performed with a 24-gauge needle connected to a 3 mL syringe filled with 1 mL (40 mg) of triamcinolone acetonide and 2 mL of 1% xylocaine. The needle was inserted at the medial foot landmark perpendicular to the skin [29]. The delivery procedure was standardized, and all injections were performed by the same experienced doctor (NHAM). After the CSI, subjects received 6 sessions for 2 weeks (3 sessions per week) of TUS. TUS (SONO PULS 434) was applied using the head of a US probe (frequency 3 MHz) that was placed in direct contact with the skin via a transmission coupling gel. The US treatment took 5 min. During treatment, the head of the TUS probe was kept in a constant circular motion. If kept in constant motion, the patient should feel no discomfort at all.
The patients in groups A and B were recommended to take complete rest, sit in a chair or bed, and not perform household chores for 48 h (about 2 days) after treatment and to limit weight-bearing over the injected area. During this period, they were recommended to apply cold therapy two times a day for 10 min each time [30]. Obviously, we could not control whether they actually did so.
2.4.4. Statistical Analysis
Data were analyzed using IBM SPSS software package version 20.0 (Armonk, NY, USA: IBM Corp). Categorical data were described using numbers and percentages; continuous data were described using range (minimum and maximum), mean and standard deviation, and median and interquartile range (IQR). The Shapiro–Wilk test was used to verify the normality of the distribution of the continuous variables. Chi-square tests were used to compare categorical variables between the two groups. Fisher’s Exact or Monte Carlo correction was applied when more than 20% of the cells had an expected count of less than 5. Independent t-tests were used to compare normally distributed continuous variables between the two studied groups. p-values were based on a two-tailed analysis. Non-parametric Mann–Whitney U tests were used for non-normally distributed continuous variables. Within-group changes were tested using paired t-tests or Wilcoxon signed-rank tests. The significance of the obtained results was set at the 5% level. Bonferroni correction was used in case of more than 2 comparisons.
2.4.5. Ethics
The study was performed according to the World Medical Association Declaration of Helsinki. The medical ethics committee of the faculty of Medicine at the Suez Canal University, Egypt, approved the present study (Number 4059, 17 December 2019). All patients agreed to participate in the study after being informed about the aim of the study, examination steps, and the application of treatment modalities, and each patient signed informed consent. All patients were able to understand the informed consent form.
3. Results
3.1. Patients
A total of 52 female patients with proven chronic PF were invited to participate in the study. Two of them dropped out during follow-up; therefore, 50 were included (25 patients in each treatment group) in the per-protocol analysis. There were no refusals. The mean age of the patients was 45.4 ± 10.8 years (range 26 to 61 years) in the ESWT group and 40.0 ± 7.3 years (range 29 to 55 years) in the CSI + TUS group.
Demographic data and baseline clinical characteristics are listed in Table 1 and Table 2. No statistically significant differences between the two study groups were found regarding body mass index (BMI), activity, occupation, or symptom duration before treatment. Many patients were obese (BMI > 29.9 kg/m2); 22 in group A and 17 in group B.

Table 1.
Comparison between the two studied groups according to medical history.
Table 2.
Comparison between the two studied groups according to clinical examination.
3.2. Treatment Effects
Pain and function. The VAS pain score improved significantly after 4 weeks and 12 weeks in both groups, and there was a significant difference in the decrease between the two groups at 12 weeks follow-up (p = 0.004). Group A (ESWT) improved more than group B (CSI + TUS), as shown in Table 3.
Table 3.
Comparison between the two studied groups according to Pain VAS.
Functioning, pain, and disability, as measured with the PFPDS, improved in both groups at 12 weeks follow-up, but the difference between the two groups was not statistically significant (p = 0.105), as shown in Table 4.
Table 4.
Comparison between the two studied groups according to plantar fasciitis pain and disability scale (PFPDS).
Fascia thickness and echogenicity. All patients had an increased plantar fascia thickness (3.50–8.0 mm) at baseline when measured with MSKUS, and all had hypo-echogenicity. There was a significant difference in the reduction of the plantar fascia thickness between the two groups at 4 weeks follow-up in favor of CSI + TUS (p = 0.004, Table 5), as also shown in Figure A1 and demonstrated in ultrasound images in Figure A2 and Figure A3. At the 12-week follow-up, plantar fascia thickness was significantly higher in the CSI + TUS group (p = 0.012), with an insignificant difference in the decrease between both groups (p = 0.216).
Table 5.
Comparison between the two studied groups according to plantar fascia thickness (PF thickness).
In group A (ESWT), the decrease in plantar fascia thickness correlated significantly positively with function (PFPDS) at both follow-up visits (p = 0.038 and p = 0.025) (Figure A4). The decrease in plantar fascia thickness did not correlate significantly with pain improvement at both follow-up visits (Figure A5). In group B (CSI + TUS), the decrease in plantar fascia thickness correlated positively with pain improvement at both follow-up visits (p = 0.025 and p < 0.001; Two-tailed analysis. Figure 1). The decrease in plantar fascia thickness also correlated significantly with PFPDS improvement at both follow-up visits (p = 0.015 and p < 0.001; Figure 2).
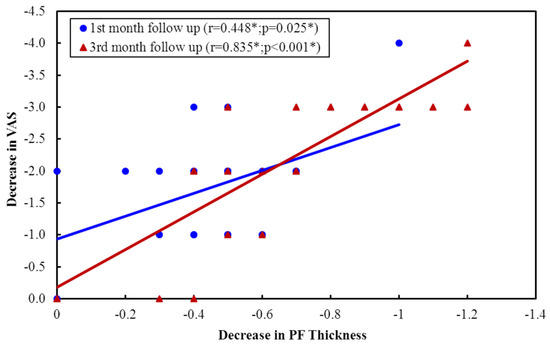
Figure 1.
Correlation between decreases in PF thickness with pain VAS improvement in CSI group.
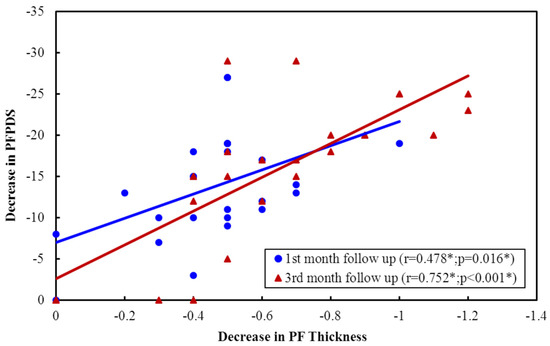
Figure 2.
Correlation between decreases in PF thickness with PFPDS improvement in CSI group.
Echogenicity change (Figure A2 and Figure A3) from hypoechoic to iso- or hyperechoic was statistically significant in both groups at 12-week follow-up, but no significant difference was found between the groups (p = 0.208; Table A1).
Obesity. We compared the effects of ESWT and CSI + TUS in obese patients. ESWT gave more long-term pain relief at 12 weeks follow-up. The fascia thickness, on the other hand, was significantly more reduced in the CSI + TUS group at the 1-month follow-up (p = 0.003; Table 6) but no longer at the 3-month follow-up. Most patients were obese, so a comparison with patients with normal BMI was not conducted.
Table 6.
Pain (VAS), PFPDS, and fascia thickness in obese patients (BMI ≥ 29.9 Kg/m2) in ESWT and CSI + TUS groups.
Sedentary life. In Group A (ESWT)) the pain in patients with a sedentary daily life improved more than in those with an active life. At 12 weeks, the VAS pain in the sedentary patients was reduced by 4 points (SD 2–6) and in more active patients by 3 points (SD 0–9; p = 0.021). There was no difference between groups regarding PFPDS or fascia thickness (Table A2). In group B (CSI + TUS) in sedentary patients, the pain VAS also decreased significantly more than in active patients at 12 weeks follow-up (p = 0.014). In sedentary patients, after three months, the functioning (PFPDS) improved more than in active patients (p = 0.019; Table 7).
Table 7.
Sedentary vs. Active patients, Relation regarding Pain (VAS), PFPDS and fascia thickness in CSI + TUS (n = 25).
3.3. Side Effects
No bruising or swelling was seen in either group. Mild local tenderness was seen in some patients after ESWT that faded away within 3–4 days. In group B (CSI + TUS), some patients mentioned temporary local pain at the injection site that subsided within 2–3 days.
4. Discussion
The aim of our pilot study was to study the effect of treating chronic PF patients with CSI combined with TUS and compare that with the well-studied ESWT treatment. All patients had complaints for more than six months, and all had been treated in vain with conservative measures such as exercises or in-soles. No patients with acute PF who had improved within six months were included.
ESWT. Most previous studies regarding treatment with ESWT were placebo-controlled trials [31]. ESWT for PF has shown a success rate of 34% to 88%, and the number of treatments may differ, mostly one treatment during three weeks [16,17,18]. Cinar et al. studied ESWT in 23 PF patients and 21 controls; all participants received home exercises with orthotic support. After three months, both groups improved significantly regarding the American Orthopedic Foot and Ankle Society (AOFAS) score (p < 0.001) and 12 min walking (p = 0.04), but ESWT did not have an additive benefit [32].
EWST compared with CSI. Previous studies comparing ESWT with CSI for PF had varying outcomes on different machines, energy levels, and treatment protocols [21,28]. In a Cochrane study, five trials were found comparing local steroid injection with ESWT [21]. To our knowledge, there are no studies where PF patients were treated with corticosteroid injection followed by TUS. In our study, the pain VAS score improved significantly in both groups at both follow-up times, and ESWT proved superior to CSI + TUS in pain relief at 12 weeks follow-up.
In contrast to our findings, Lai et al. found that the pain improvement with ESWT was lower than with CSI (p < 0.001) at 4 and 12 weeks in patients with chronic plantar fasciitis [33]. Porter and Shadbolt also found, in 132 PF patients, that VAS pain scores three months after CSI treatment (1.48; 0–7) were significantly lower than in both ESWT (3.69; 0–8) and controls (3.58; 2–5) [34]. At 12 months, the pain scores after both CSI (0.84; 0–7) and ESWT (0.84; 0–4) were significantly lower than in controls (2.42; 1–4), but there was no difference anymore between CSI and ESWT. They concluded that CSI had similar or somewhat higher efficacy than ESWT and was more cost-effective [34].
The findings of Saber et al. were comparable with ours. They treated 60 PF patients (27 males, 33 females) with either local steroid injection or a high dose of ESWT. After 3 months, a significant improvement was seen in both groups regarding plantar fascia thickness and the Mayo clinical scoring system (pain, functioning) [35], with ESWT being superior, although statistically non-significant. Despite this, they advised CSI as it attains improvement quicker and is more cost-effective [28]. Grecco et al. compared radial shock waves with conventional physiotherapy for PF. Pain and functional abilities were assessed before treatment, immediately after, and 12 months after treatment. Pain and function improved with both treatments. The improvement with shock wave therapy was faster, which corresponds with our results [36].
Yucel compared CSI with ESWT in 60 patients with chronic PF. After three months, there was no difference in VAS pain between the two treatments (p > 0.05). A successful therapeutic response was seen in 27 of 33 (92%) patients in the ESWT group and in 23 of 27 (85%) of those treated with CSI. As CSI was cost-effective compared to ESTW, this was their first treatment choice. Their findings are compatible with ours [14]. Finally, Ugurlar studied the effect of ESWT, platelet-rich plasma injection, local CSI, and prolotherapy in 158 patients with chronic PF [37]. CSI was more effective after three months regarding pain and ESWT at six months. Some effect was seen in prolotherapy and platelet-rich plasma within 3 to 12 months. After 36 months, there was no difference between the four groups [37]. These findings are also compatible with ours.
We decided, for theoretical reasons, to study the addition of TUS to CSI as we expected that it would improve the effect of CSI. To our knowledge, only three trials have been conducted with TUS in PF, with the first being of low quality. For that reason, Katzap et al. decided to perform a double-blind, placebo-controlled clinical trial dividing 54 PF patients into an intervention (n = 26) and control (n = 28) group. Both groups did self-performed stretching exercises, combined with TUS in the therapeutic group and sham US in the controls. Both groups improved equally, showing no additive effect of TUS [38]. Comparing our findings of CSI + TUS with those with CSI alone suggests that the addition of TUS did not make CSI more effective.
Obesity. In our study, most patients were obese (22/25 in group A and 17/25 in group B). In these obese patients, ESWT gave more long-term pain relief at 12 weeks follow-up. We have no clear explanation for this finding. Saber et al. found a positive correlation between BMI and PF thickness pre-treatment in both groups. Overloading may result in chronic stretching and local pressure resulting in PF [28].
Sedentary lifestyle. In our study, the pain at 12 weeks follow-up had improved more after both ESWT (p = 0.021) and after CSI + TUS (p = 0.014) than in those with an active lifestyle. This may be explained by the local rest resulting from sitting too much. The same holds true for functioning as measured with PFPDS (p = 0.019). We did not find other studies regarding this topic.
Function/disability. In our study, functioning as measured with PFPDS improved significantly in both groups at both follow-up times but was not significantly different in both groups (p = 0.105). Only a few studies measured function or disability as an outcome. Eslamian et al. treated patients with 5 sessions of radial ESWT with 2000 shock waves/session of 0.2 mJ/mm 2 (n = 20) or with a single injection of local methylprednisolone (n = 20). Pain VAS, functional abilities assessed using the foot function index (FFI), and satisfaction were evaluated before treatment and at 4 and 8 weeks after treatment [30]. Significant improvements in pain were found throughout the study in both groups (p < 0.001), and, similar to our study, the ESWT group had a higher pain reduction. However, unlike our study, the difference in pain between the two groups was not significant [30].
Kiter assessed the function using the rearfoot score of the American Orthopedic Foot and Ankle Society among 44 patients after treatment with injections of 1 mL 2% prilocaine alone or combined with autologous blood or with 40 mg methylprednisolone acetate and found improvements in all groups, but no difference between groups [39].
Plantar fascia thickness and echogenicity. Consistent with our results, Saber et al. in 2012 found a significant reduction in plantar fascia thickness after both ESWT and CSI and no significant difference between the groups [28]. Ulusoy et al. found that the thickness of the plantar fascia decreased significantly on MRI in all 3 groups (low-level laser therapy, therapeutic US therapy, and ESWT) [40], which is consistent with our results. Lai et al. evaluated the thickness of the plantar fascia with US before and at the 4th and 12th week after ESWT and CSI. They observed a greater increase in plantar fascia thickness after ESWT than after the CSI group in the 4th week (p = 0.048), decreasing gradually but not to the baseline in the 12th week, which is inconsistent with our results. They predicted it would decrease continuously, as Hammer reported at 6 months after ESWT [33]. Fabrikant et al. found that CSI combined with biomechanical correction diminished plantar fascia thickness as shown on ultrasound. Their study also revealed that improvement in symptomatic complaints was associated with a reduction in plantar fascia thickness, which is in accordance with our findings [41].
In our study, in the patients treated with CSI followed by TUS, there was a significant positive correlation between the decrease in plantar fascia thickness and pain VAS improvement at both follow-up visits and also between the decrease in plantar fascia thickness and PFPDS improvement. This is in agreement with Moustafa et al., who found significant positive correlations between plantar fascia thickness after CSI with pain VAS score before and after treatment (p < 0.05) [26].
Salehi et al. showed in 20 PF patients and controls that ultrasonography is a reliable method to measure plantar fascia thickness and echogenicity. They found that in PF patients, the plantar fascia is not only affected at its insertion but also in other points remote from the insertion. Ultrasonography has a good diagnostic value in therapy and research of patients with plantar fasciitis [42].
In our study, the echogenicity change from hypoechoic to iso- or hyperechoic was statistically significant in both groups at the 12-week follow-up, but no significant difference between both groups was found (p = 0.208). Moustafa et al. also found a statistically significant reduction in the number of feet with hypo-echogenicity of the plantar fascia after dexamethasone injection by two different modalities (p < 0.05) [26].
Our study had some limitations. Only female patients were included, and we cannot extend our findings to male patients. Ideally, we would have compared ESWT with the effect of standard CSI with US and a control group receiving CSI and sham US, but that would have required a very large number of PF patients which was not feasible given the lack of funding. Shock wave therapy (ESWT) has been studied extensively against placebo [32], so it was considered appropriate to compare CSI + TUS with this established treatment. It is obvious we hoped to find a strongly increased effect by the combination of CSI with the US, but that was clearly not the case.
The strengths of our study are that it is the first study regarding the effect of CSI + TUS. We measured not only the effect on pain but also on functioning and disability and on the thickness of the proximal plantar fascia, as measured with diagnostic ultrasound at baseline and 4 weeks and 12 weeks after the end of treatment. We also explored the associations between obesity and a sedentary lifestyle with the effects of the different treatments. Moreover, this is a study from a developing country, which may be of special interest as these people tend to wear sandals, slippers, or no shoes at all.
5. Take Home Message
- (a)
- ESWT and CSI + TUS both work fairly well in the treatment of plantar fasciitis, but for some patients (obese, sedentary), ESWT appears preferable.
- (b)
- Based on previous studies comparing ESTW and CSI, the addition of TUS does not appear to make CSI much more effective.
- (c)
- Diagnostic ultrasound may be useful to objectively document PF thickness (not hypogenicity) in addition to self-reported complaints.
Author Contributions
Conceptualization, N.H.A.M. and N.K.E.S.; Methodology, N.H.A.M., N.K.E.S. and M.A.H. Software, validation and formal analysis N.K.E.S., M.A.H. and P.M.t.K.; Investigation, data curation and resources, N.H.A.M. and N.K.E.S.; Writing—original draft preparation, N.H.A.M., N.K.E.S. and M.A.H.; Writing—review and editing, J.J.R., N.H.A.M. and P.M.t.K.; Supervision, N.K.E.S. and J.J.R.; Visualization, N.H.A.M., N.K.E.S. and M.A.H. All authors have read and agreed to the published version of the manuscript.
Funding
This research received no external funding.
Institutional Review Board Statement
The medical ethics committee of the faculty of Medicine at Suez Canal University, Egypt, approved the present study (Number 4059, 17 December 2019).
Informed Consent Statement
Informed consent was obtained from all subjects involved in the study.
Data Availability Statement
Data can be requested from Dr. Nashwa K El Shaaraway.
Acknowledgments
The authors thank the patients for their cooperation.
Conflicts of Interest
The authors declare no conflict of interest. All authors declare no competing financial interest regarding this study.
Abbreviations
| AOFAS | American Orthopedic Foot and Ankle Society |
| BMI | Body Mass Index |
| CSI | Corticosteroid injection |
| ESWT | Extracorporeal shock wave therapy |
| FFI | Food Function Index |
| IQR | interquartile range |
| MSKUS | Musculoskeletal ultrasound |
| NSAIDS | Non-steroidal anti-inflammatory drugs |
| PF | Plantar fasciitis |
| PFPDS | Plantar fasciitis pain/disability scale |
| TUS | Therapeutic ultrasound |
| US | Ultrasound |
| VAS | Visual analog scale |
Appendix A

Figure A1.
Comparison between the two studied groups according to plantar fascia thickness (PF thickness).
Figure A1.
Comparison between the two studied groups according to plantar fascia thickness (PF thickness).


Figure A2.
(A–C): plantar fascia thickness and echogenicity before, after 4 weeks, and 12 weeks follow-up (ESWT). (A). Plantar fascia thickness (0.53 cm) and echogenicity (hypoechoic) before ESWT; Ankles are in 90 dorsiflexion;. Images obtained just medial to the midline, at the proximal end of the plantar fascia, distal to its origin, from the medial tubercle of the calcaneus; Thickness of the plantar fascia was measured from the base of the medial calcaneal tubercle, where a bright echogenic line was easily visible. (B). Plantar fascia thickness (0.51 cm) and echogenicity (hypoechoic) after 4 weeks. (C). Plantar fascia thickness (0.48 cm) and echogenicity (hypo-echoic) after 12 weeks.


Figure A3.
(A–C): plantar fascia thickness and echogenicity before, after 4 weeks, and 12 weeks follow-up (CSI followed by therapeutic US). (A). Plantar fascia thickness (0.55 cm) and echogenicity (hypoechoic) before CSI injection followed by therapeutic US; Ankles in 90° dorsiflexion; Images obtained just medial to the midline, at the proximal end of the plantar fascia, distal to its origin, from the medial tubercle of the calcaneus; Thickness of the plantar fascia was measured from the base of the medial calcaneal tubercle, where a bright echogenic line was easily visible. (B). Plantar fascia thickness (0.44 cm) and echogenicity (hypoechoic) after 4 weeks. (C). Plantar fascia thickness (0.41 cm) and echogenicity (hypoechoic) after 12 weeks.


Figure A4.
Correlation between decreases in PF thickness with the decrease in PFPDS in ESWT Group.
Figure A4.
Correlation between decreases in PF thickness with the decrease in PFPDS in ESWT Group.


Figure A5.
Correlation between decreases in PF thickness with Pain VAS improvement in ESWT group.
Figure A5.
Correlation between decreases in PF thickness with Pain VAS improvement in ESWT group.

Table A1.
Comparison between the two studied groups according to Echogenicity.
Table A1.
Comparison between the two studied groups according to Echogenicity.
| ECHO | ESWT (n = 25) | CSI + TUS (n = 25) | χ2 | p | ||
|---|---|---|---|---|---|---|
| No. | % | No. | % | |||
| Baseline | ||||||
| HYPO | 25 | 100.0 | 25 | 100.0 | – | – |
| ISO or hyper | 0 | 0.0 | 0 | 0.0 | ||
| 1st month follow up | ||||||
| HYPO | 24 | 96.0 | 25 | 100.0 | 1.020 | FEp = 1.000 |
| ISO or hyper | 1 | 4.0 | 0 | 0.0 | ||
| 3rd month follow up | ||||||
| HYPO | 16 | 64.0 | 20 | 80.0 | 1.587 | 0.208 |
| ISO or hyper | 9 | 36.0 | 5 | 20.0 | ||
χ2: Chi-square test; FE: Fisher’s Exact. p: p-value for comparing between the studied groups.
Table A2.
Sedentary vs. Active patients, Relation regarding Pain (VAS), PFPDS and fascia thickness in ESWT (n = 25).
Table A2.
Sedentary vs. Active patients, Relation regarding Pain (VAS), PFPDS and fascia thickness in ESWT (n = 25).
| Activity | U | p | |||
|---|---|---|---|---|---|
| Sedentary (n = 11) | Active (n = 14) | ||||
| Decrease in pain VAS | 1st month follow up | ||||
| Min.–Max. | 0.0–6.0 | 0.0–6.0 | 58.500 | 0.317 | |
| Mean ± SD. | 2.55 ± 1.51 | 2.07 ± 1.59 | |||
| Median | 3.0 | 2.0 | |||
| 3rd month follow up | |||||
| Min.–Max. | 2.0–6.0 | 0.0–9.0 | 35.000 * | 0.021 * | |
| Mean ± SD. | 4.0 ± 1.18 | 2.86 ± 2.14 | |||
| Median | 4.0 | 3.0 | |||
| Decrease in PFPDS | 1st month follow up | ||||
| Min.–Max. | 0.0–19.0 | 0.0–21.0 | 75.000 | 0.936 | |
| Mean ± SD. | 11.82 ± 5.62 | 11.14 ± 5.91 | |||
| Median | 11.0 | 13.0 | |||
| 3rd month follow up | |||||
| Min.–Max. | 16.0–25.0 | 0.0–28.0 | 70.500 | 0.727 | |
| Mean ± SD. | 20.82 ± 3.25 | 18.93 ± 7.22 | |||
| Median | 22.0 | 19.50 | |||
| Decrease in PF Thickness | 1st month follow up | ||||
| Min.–Max. | −0.10–3.0 | −0.20–0.60 | 75.500 | 0.936 | |
| Mean ± SD. | 0.47 ± 0.87 | 0.26 ± 0.21 | |||
| Median | 0.20 | 0.30 | |||
| 3rd month follow up | |||||
| Min.–Max. | 0.20–3.0 | 0.20–1.70 | 65.500 | 0.536 | |
| Mean ± SD. | 0.89 ± 0.77 | 0.87 ± 0.46 | |||
| Median | 0.60 | 0.80 | |||
U: Mann–Whitney test; p: p-value for association between different categories. *: Statistically significant at p ≤ 0.05.
References
- Cole, C.; Seto, C.; Gazewood, J. Plantar Fasciitis: Evidence-Based Review of Diagnosis and Therapy. Am. Fam. Physician 2005, 72, 2237–2242. [Google Scholar] [PubMed]
- Goweda, R.A.; Alfalogy, E.H.; Filfilan, R.N.; Hariri, G.A. Prevalence and risk factors of Plantar Fasciitis among patients with heel pain attending primary health care centers of Makkah, Kingdom of Saudi Arabia. J. High Inst. Public Health 2015, 45, 71–75. [Google Scholar] [CrossRef]
- Riddle, D.L.; Schappert, S.M. Volume of ambulatory care visits and patterns of care for patients diagnosed with plantar fasciitis: A national study of medical doctors. Foot Ankle Int. 2004, 25, 303–310. [Google Scholar] [CrossRef]
- Orchard, J. Plantar fasciitis. BMJ 2012, 345, e6603. [Google Scholar] [CrossRef]
- Furey, J.G. Plantar fasciitis. The painful heel syndrome. J. Bone Jt. Surg. Am. 1975, 57, 672–673. [Google Scholar] [CrossRef]
- Tong, K.B.; Fauria, J. Economic burden of plantar fasciitis treatment in the United States. Am. J. Orthop. 2010, 39, 227–317. [Google Scholar] [PubMed]
- Nahin, R.L. Prevalence and Pharmaceutical Treatment of Plantar Fasciitis in United States Adults. J. Pain 2018, 19, 885–896. [Google Scholar] [CrossRef]
- Hanada, M.; Takahashi, M.; Matsuyama, Y. The effect of extracorporeal shock wave therapy for the treatment of plantar fasciitis regarding middle-aged patients’ activity level and pain localization. Shock Waves 2019, 29, 321–326. [Google Scholar] [CrossRef]
- Yin, M.; Ma, J.; Xu, J.; Li, L.; Chen, G.; Sun, Z.; Liu, Y.; He, S.; Ye, J.; Mo, W. Use of artificial neural networks to identify the predictive factors of extracorporeal shock wave therapy treating patients with chronic plantar fasciitis. Sci. Rep. 2019, 9, 4207. [Google Scholar] [CrossRef]
- Hossain, M.; Makawana, N. “Not Plantar Fasciitis”: The differential diagnosis and management of heel pain syndrome. Orthop. Trauma 2011, 25, 198–206. [Google Scholar] [CrossRef]
- Mahowald, S.; Legge, B.; Grady, J. The correlation between plantar fascia thickness and symptoms of plantar fasciitis. J. Am. Podiatr. Med. Assoc. 2011, 101, 385–389. [Google Scholar] [CrossRef]
- Goff, J.D.; Crawford, R. Diagnosis, and treatment of plantar fasciitis. Am. Fam. Physician 2011, 84, 676–682. [Google Scholar]
- Yildiz, S.; Sumer, E.; Zengin, H.Y.; Bek, N. Intensive physiotherapy versus home-based exercise and custom-made orthotic insoles in patients with plantar fasciitis: Pilot study. Foot 2022, 51, 101906. [Google Scholar] [CrossRef] [PubMed]
- Yucel, I.; Ozturan, K.E.; Demiraran, Y.; Degirmenci, E.; Kaynak, G. Comparison of high dose extracorporeal shockwave therapy and intralesional corticosteroid injection in the treatment of plantar fasciitis. J. Am. Podiatr. Med. Assoc. 2010, 100, 105–110. [Google Scholar] [PubMed]
- Ogden, J.A.; Alvarez, R.G. Extracorporeal shockwave therapy for chronic proximal plantar fasciitis. Clin. Orthop. Relat. Res. 2001, 387, 47–59. [Google Scholar] [CrossRef] [PubMed]
- Akinoglu, B.; Köse, N.; Kirdi, N.; Yakut, Y. Comparison of the Acute Effect of Radial Shock Wave Therapy and Ultrasound Therapy in the Treatment of Plantar Fasciitis: A Randomized Controlled Study. Pain. Med. 2017, 18, 2443–2452. [Google Scholar] [CrossRef] [PubMed]
- Purcell, R.L.; Schroeder, I.G.; Keeling, L.E.; Formby, P.M.; Eckel, T.T.; Shawen, S.B. Clinical Outcomes After Extracorporeal Shock Wave Therapy for Chronic Plantar Fasciitis in a Predominantly Active-Duty Population. J. Foot Ankle Surg. 2018, 57, 654–657. [Google Scholar] [CrossRef]
- Mardani-Kivi, M.; Mobarakeh, M.K.; Hassanzadeh, Z.; Mirbolook, A.; Asadi, K.; Ettehad, H.; Hashemi-Motlagh, K.; Saheb-Ekhtiari, K.; Fallah-Alipour, K. Treatment outcomes of corticosteroid injection and extracorporeal shock wave therapy as two primary therapeutic methods for acute plantar fasciitis: A prospective randomized clinical trial. J. Foot Ankle Surg. 2015, 54, 1047–1052. [Google Scholar] [CrossRef]
- Ball, E.M.; McKeeman, H.M.; Patterson, C.; Burns, J.; Yau, W.H.; Moore, O.A.; Benson, C.; Foo, J.; Wright, G.D.; Taggart, A.J. Steroid injection for inferior heel pain: A randomised controlled trial. Ann. Rheum. Dis. 2013, 72, 996–1002. [Google Scholar] [CrossRef]
- Abdihakin, M.; Wafula, K.; Hasan, S.; Macleod, J. Randomized controlled trial of steroid injection in the management of plantar fasciitis. SA Orthop. J. 2012, 11, 33–38. [Google Scholar]
- David, J.A.; Sankarapandian, V.; Christopher, P.R.H.; Chatterjee, A.; Macaden, A.S. Injected corticosteroids for treating plantar heel pain in adults. Cochrane Database Syst. Rev. 2017, 6, CD009348. [Google Scholar] [CrossRef] [PubMed]
- Santamato, A.; Beatrice, R.; Micello, M.F.; Fortunato, F.; Panza, F.; Bristogiannis, C.; Cleopazzo, E.; Macarini, L.; Picelli, A.; Baricich, A.; et al. Power Doppler Ultrasound Findings before and after Focused Extracorporeal Shock Wave Therapy for Achilles Tendinopathy: A Pilot Study on Pain Reduction and Neovascularization Effect. Ultrasound Med. Biol. 2019, 45, 1316–1323. [Google Scholar] [CrossRef] [PubMed]
- Schon, L.C.; Baxter, D.E. Neuropathies of the foot and ankle in athletes. Clin. Sports Med. 1990, 9, 489–509. [Google Scholar] [CrossRef] [PubMed]
- McPoil, T.G.; Martin, R.L.; Cornwall, M.W.; Wukich, D.K.; Irrgang, J.J.; Godges, J.J. Heel pain-Plantar fasciitis: Clinical practice guidelines linked to the international classification of function, disability, and health from the Orthopaedic Section of the American Physical Therapy Association. J. Orthop. Sports Phys. Ther. 2008, 38, A1–A18. [Google Scholar] [CrossRef]
- Willis, B.; Lopez, A.; Perez, A.; Sheridan, L.; Kalish, S. Pain scale for plantar fasciitis. Foot Ankle Online J. 2009, 2, 3. [Google Scholar] [CrossRef]
- Moustafa, A.M.; Hassanein, E.; Foti, C. Objective assessment of corticosteroid effect in plantar fasciitis: Additional utility of ultrasound. Muscles Ligaments Tendons J. 2016, 5, 289–296. [Google Scholar] [CrossRef]
- Faul, F.; Erdfelder, E.; Lang, A.-G.; Buchner, A. G*Power 3: A flexible statistical power analysis program for the social, behavioral, and biomedical sciences. Behav. Res. Methods 2007, 39, 175–191. [Google Scholar] [CrossRef] [PubMed]
- Saber, N.; Diab, H.; Nassar, W.; Razaak, H.A. Ultrasound guided local steroid injection versus extracorporeal shockwave therapy in the treatment of plantar fasciitis. Alex. J. Med. 2012, 48, 35–42. [Google Scholar] [CrossRef]
- Young, C.C.; Rutherford, D.S.; Niedfeldt, M.W. Treatment of plantar fasciitis. Am. Fam. Physician 2001, 63, 467–474. [Google Scholar]
- Eslamian, F.; Shakouri, S.K.; Jahanjoo, F.; Hajialiloo, M.; Notghi, F. Extra Corporeal Shock Wave Therapy Versus Local Corticosteroid Injection in the Treatment of Chronic Plantar Fasciitis, a Single Blinded Randomized Clinical Trial. Pain. Med. 2016, 17, 1722–1731. [Google Scholar] [CrossRef]
- Thomson, C.E.; Crawford, F.; Murray, G.D. The effectiveness of extra corporeal shock wave therapy for plantar heel pain: A systematic review and meta-analysis. BMC Musculoskelet. Disord. 2005, 6, 19. [Google Scholar] [CrossRef]
- Cinar, E.; Saxena, S.; Akkurt, H.E.; Uygur, F. Extracorporeal shockwave therapy in the management of plantar fasciitis: A randomized controlled trial. Foot 2020, 44, 101679. [Google Scholar] [CrossRef] [PubMed]
- Lai, T.W.; Ma, H.L.; Lee, M.S.; Chen, P.M.; Ku, M.C. Ultrasonography and clinical outcome comparison of extracorporeal shock wave therapy and corticosteroid injections for chronic plantar fasciitis: A randomized controlled trial. J. Musculoskelet. Neuronal Interact. 2018, 18, 47–54. [Google Scholar] [PubMed]
- Porter, M.D.; Shadbolt, B. Intralesional corticosteroid injection versus extracorporeal shock wave therapy for plantar fasciopathy. Clin. J. Sport. Med. 2005, 15, 119–124. [Google Scholar] [CrossRef] [PubMed]
- Wen-hong, L.; Chin-Jung, H.; Horng-Chaung, H.; Kuo-Fung, T. Clinical application of extracorporeal shock wave therapy in treatment of plantar fasciitis. Mid-Taiwan J. Med. 2006, 11, 230–235. [Google Scholar]
- Grecco, M.V.; Brech, G.C.; Greve, J.M. One-year treatment follow-up of plantar fasciitis: Radial shockwaves vs. conventional physiotherapy. Clinics 2013, 68, 1089–1095. [Google Scholar] [CrossRef] [PubMed]
- Uğurlar, M.; Sönmez, M.M.; Uğurlar, Ö.Y.; Adıyeke, L.; Yıldırım, H.; Eren, O.T. Effectiveness of Four Different Treatment Modalities in the Treatment of Chronic Plantar Fasciitis During a 36-Month Follow-Up Period: A Randomized Controlled Trial. J. Foot Ankle Surg. 2018, 57, 913–918. [Google Scholar] [CrossRef]
- Katzap, Y.; Haidukov, M.; Berland, O.M.; Itzhak, R.B.; Kalichman, L. Additive Effect of Therapeutic Ultrasound in the Treatment of Plantar Fasciitis: A Randomized Controlled Trial. J. Orthop. Sports Phys. Ther. 2018, 48, 847–855. [Google Scholar] [CrossRef]
- Kiter, E.; Celikbas, E.; Akkaya, S.; Demirkan, F.; Kiliç, B.A. Comparison of injection modalities in the treatment of plantar heel pain: A randomized controlled trial. J. Am. Podiatr. Med. Assoc. 2006, 96, 293–296. [Google Scholar] [CrossRef]
- Ulusoy, A.; Cerrahoglu, L.; Orguc, S. Magnetic Resonance Imaging and Clinical Outcomes of Laser Therapy, Ultrasound Therapy, and Extracorporeal Shock Wave Therapy for Treatment of Plantar Fasciitis: A Randomized Controlled Trial. J. Foot Ankle Surg. 2017, 56, 762–767. [Google Scholar] [CrossRef]
- Fabrikant, J.M.; Park, T.S. Plantar fasciitis (fasciosis) treatment outcome study: Plantar fascia thickness measured by ultrasound and correlated with patient self-reported improvement. Foot 2011, 21, 79–83. [Google Scholar] [CrossRef] [PubMed]
- Salehi, S.; Shadmehr, A.; Olyaei, G.; Bashardoust Tajali, S.; Mir, S.M.; Sobhani, V. Ultrasonographic measurements of plantar fascia thickness and echogenicity in individuals with and without plantar fasciitis: Reliability and group differences. Foot 2021, 49, 101849. [Google Scholar] [CrossRef] [PubMed]


Disclaimer/Publisher’s Note: The statements, opinions and data contained in all publications are solely those of the individual author(s) and contributor(s) and not of MDPI and/or the editor(s). MDPI and/or the editor(s) disclaim responsibility for any injury to people or property resulting from any ideas, methods, instructions or products referred to in the content. |
© 2023 by the authors. Licensee MDPI, Basel, Switzerland. This article is an open access article distributed under the terms and conditions of the Creative Commons Attribution (CC BY) license (https://creativecommons.org/licenses/by/4.0/).