Abstract
Carotenoids are a class of highly hydrophobic compounds synthesized by plants in limited quantities. This study explores the potential for increasing the production yield of lycopene, a typical carotenoid compound, through engineered Escherichia coli. Given that lycopene biosynthesis occurs within microbial hosts and it is subsequently stored within lipid membranes, this study focuses on the impact of inducing membrane vesicles on lycopene yield by expressing monoglycosyldiacylglycerol synthase (MGS) or diglucosyldiacylglycerol synthase (DGS) from Acholeplasma laidlawii and inserting the upstream isopentenol utilization pathway (IUP) into the chromosome. The effect of MGS and DGS on lipid production in the cell was quantified. The results show that inserting the IUP into the chromosome increased the specific lycopene yield by 2.1-fold compared to the plasmid-based system when using a PproD constitutive promoter and by 2.0-fold when using the inducible Ptrc promoter. The expression of MGS and DGS resulted in a small increase of 31% and 33% (w/w) lipid content, respectively. When expressed in lycopene producing strains, the lycopene content decreased in the IUP strains but increased in the negative control strain expressing only the native MEP pathway from undetectable levels to 0.34 ± 0.08 mg/g.
1. Introduction
Isoprenoids are a large and diverse category of natural compounds, consisting of more than 50,000 unique molecules produced across kingdoms [1]. These secondary metabolites are naturally present in low concentrations but have a variety of important industrial applications, such as in pharmaceuticals, fragrances, flavours, cosmetics, pigments, and pesticides [1]. Carotenoids are one class of C40 isoprenoids that comprise pigment compounds with high antioxidant properties [2]. Even with very efficient extraction and purification procedures, natural production cannot keep up with market demand [3]. Chemical synthesis methods have been proposed to ameliorate this, but these methods typically involve complex reactions that produce lower quality products and environmentally damaging waste [3]. However, carotenoid production using biomanufacturing processes is still more costly than chemical synthesis due to low productivities, and this limits the uptake of these natural products by end-users [2]. As the first pigmented product in the carotenoid biosynthesis pathway, lycopene has received significant attention to increase the specific yield and productivity of this molecule [4]. In E. coli, yields have varied between 5 and 200 mg/g and largely depend on the genetic modifications, the type of cultivation used (batch, fed-batch), and the media employed (rich, waste feedstocks, minimal salt media) [4].
Because of this, synthetic biology and metabolic engineering approaches are being developed to increase productivity.
All isoprenoids are synthesized by the successive condensation of the five-carbon precursors isopentenyl diphosphate (IPP) and dimethylallyl diphosphate (DMAPP) [5]. These precursors are typically produced through either the eukaryotic mevalonate (MVA) pathway or the prokaryotic 2-C-methyl-D-erythritol-4-phosphate (MEP) pathway [5]. Both pathways are difficult to engineer due to their reliance on central carbon metabolism [6]. These pathways are highly regulated, compete with vital cellular processes for starting materials, require multiple cofactors, and use oxygen-sensitive enzymes [6].
The isopentenol utilization pathway (IUP) was invented to solve some of the challenges with precursor synthesis [6]. This pathway uses two successive phosphorylation reactions to convert isoprenol and/or prenol into IPP and DMAPP via a promiscuous choline kinase (CK) from Saccharomyces cerevisiae, followed by an isopentenyl phosphate kinase (IPK) from Arabidopsis thaliana. In addition, an isopentenyl-pyrophosphate-delta isomerase (IDI) is included to interconvert IPP and DMAPP, to balance their relative concentrations. This pathway increases isoprenoid production by more than 17-fold, separates isoprenoid synthesis from central carbon metabolism, and only relies on a single cofactor, ATP [6].
Carotenoids are highly hydrophobic, and they are stored in membranes during heterologous production [3]. This further complicates their synthesis, as overproduction reduces membrane fluidity, killing the cells and placing an upper limit on yield [3]. One proposed solution is to increase the capacity of the membrane by remodelling it through the expression of monoglycosyldiacylglycerol synthase (MGS) or diglucosyldiacylglycerolsynthase (DGS) from Acholeplasma laidlawii [7,8]. In E. coli, the overproduction of MGS or DGS fills the cytoplasm with membrane vesicles [7]. The exact mechanism of vesicle formation by these enzymes is not known, but MGS is thought to bind the inner leaflet of the membrane bilayer and change the lipid packing density [7]. This difference in density between the two monolayers is thought to create bends in the membrane that are pinched off, forming a vesicle. MGS causes the production and insertion of a foreign glucolipid into the membrane, causing changes to the overall lipid composition, but DGS does not result in the accumulation of this exogenous glycolipid and is still capable of forming intracellular membrane vesicles [7].
Some attempts to engineer the membrane of E. coli have yielded modest increases in lycopene and β-carotene production, although increasing the intracellular lipid contents in the lipid bodies of oleaginous yeasts has resulted in more promising results than those in bacterial systems [9]. In previous works, mgs expression resulted in a modest 12% increase in lycopene production in a strain overexpressing the enzyme of the MEP by chromosomal insertion [10]. The overexpression of enzymes in the diglyceride-3-phosphate synthesis pathway (plsB, plsC, dgkA) in addition to the expression of mgs resulted in a further 13% increase in specific lycopene production [10]. In another work, the hydrophobic polymer polyhydroxybutyrate (PHB) was produced in E. coli with the goal of creating a hydrophobic sink for lycopene storage; however, while lycopene was localized preferentially in the PHB bodies, there was no reported increase in lycopene production [11].
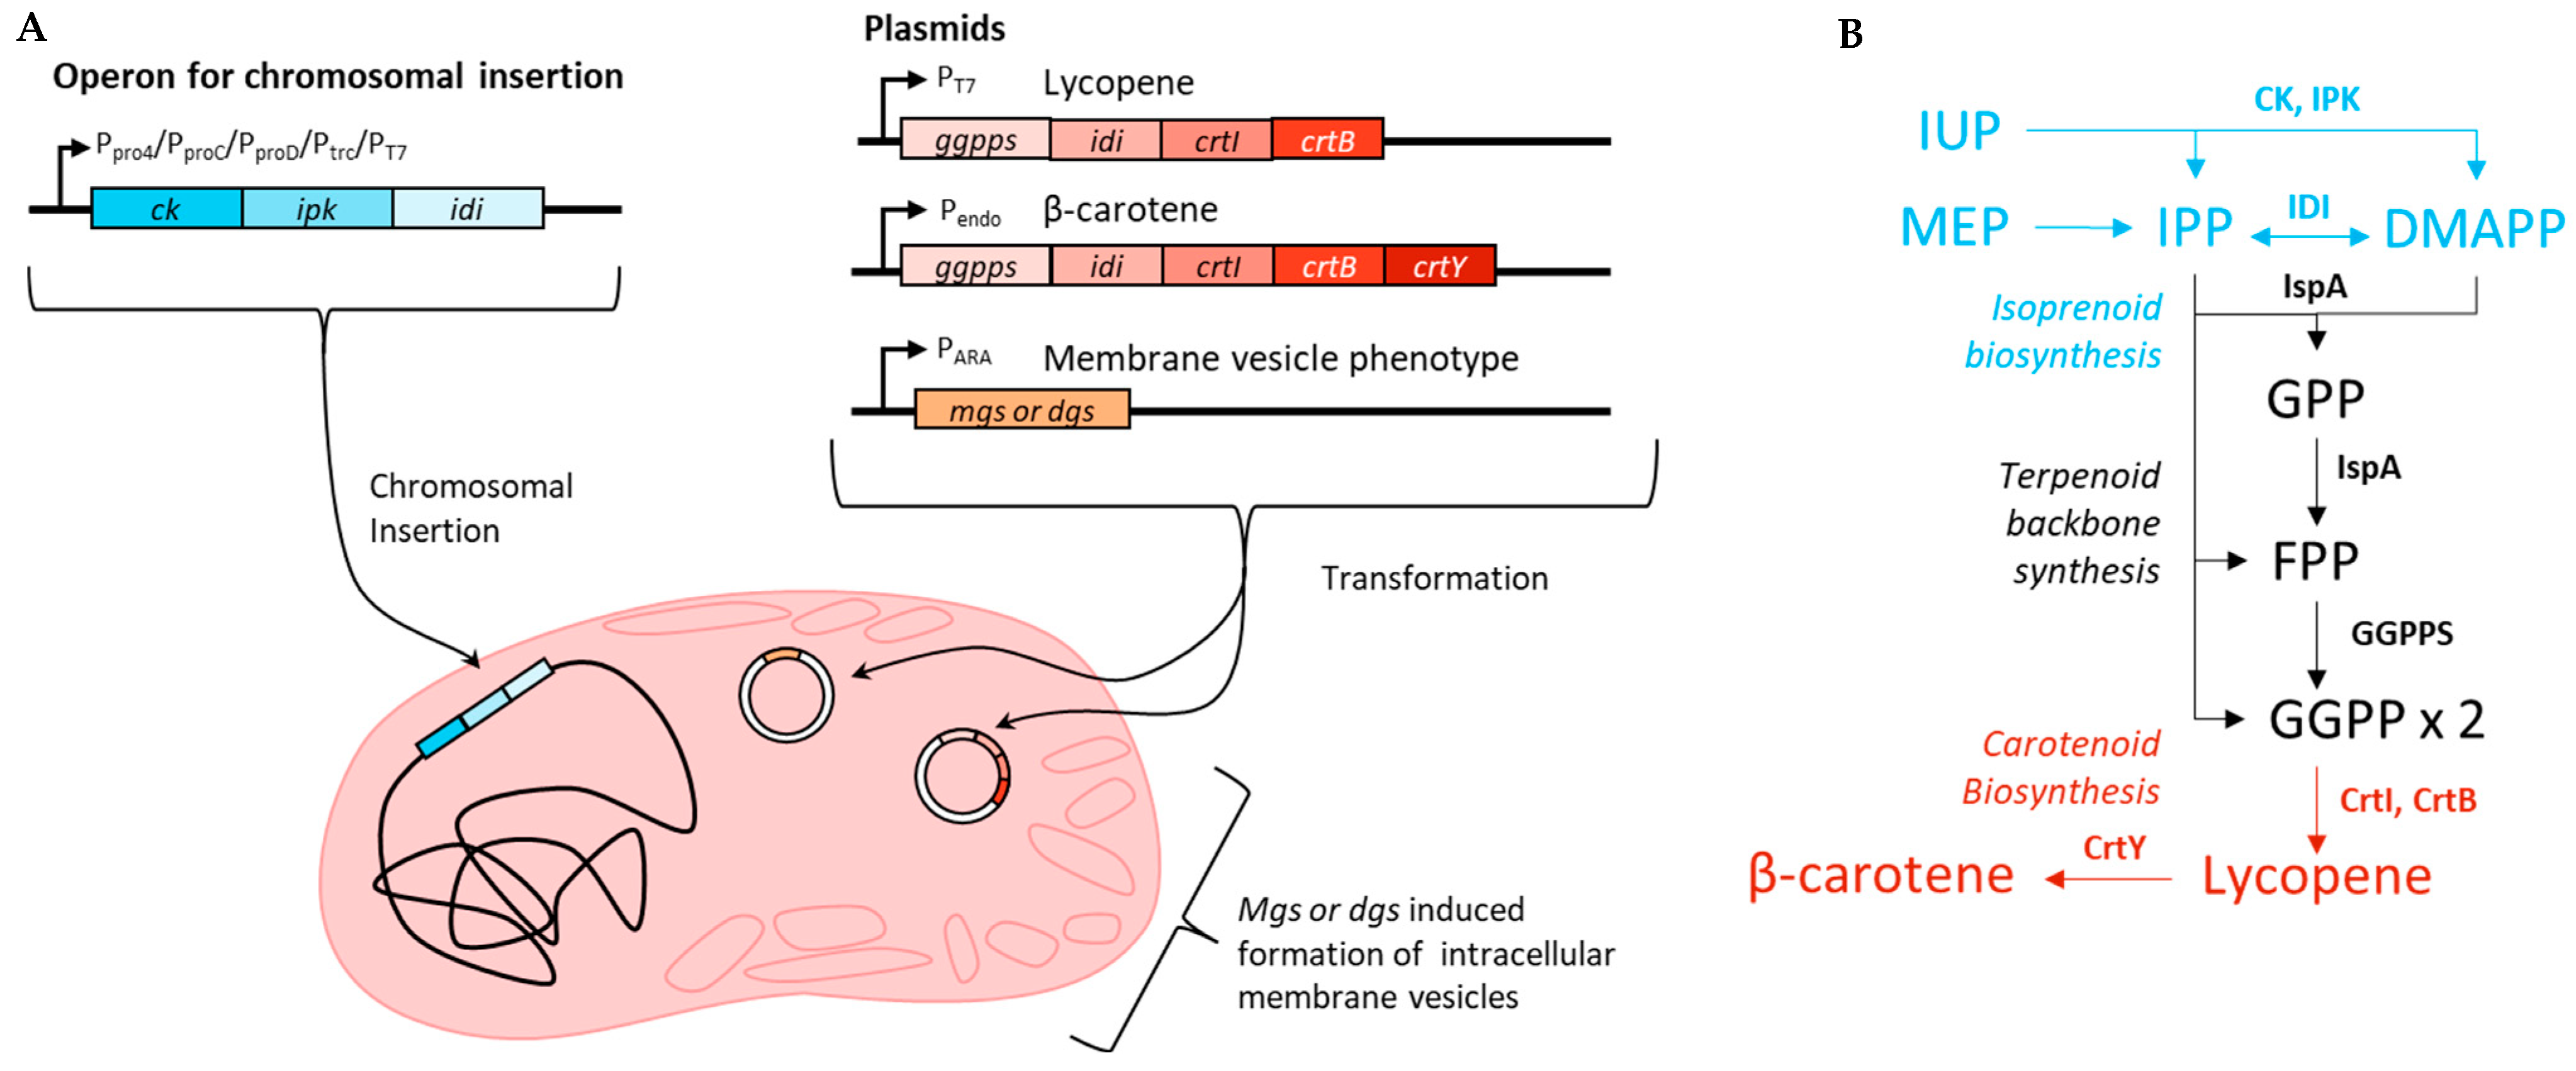
In this study, the IUP was inserted into the chromosome of E. coli MG1655 (DE3) with different promoters varying in strength, and the specific yield of lycopene was compared (Figure 1). The effect of mgs and dgs expression on the lipid content on a dry basis was also assessed in the wildtype strain. The production of lycopene or β-carotene along with mgs or dgs in wildtype, plasmid-based IUP, and chromosomal IUP strains was compared.

Figure 1.
(A) Strategy for membrane engineering and overexpression of lycopene or β-carotene using the IUP. The IUP was inserted into the chromosome near the arabinose operon of E. coli using the different promoters listed. Either lycopene or β-carotene was expressed from a plasmid using either an inducible T7 promoter or the endogenous promoter for β-carotene from P. agglomerans. MGS or DGS was expressed using an arabinose promoter on a separate plasmid. (B) Biosynthesis of lycopene and β-carotene from the universal isoprenoid precursors IPP and DMAPP from the endogenous MEP pathway or the artificial IUP.
2. Results
2.1. Construction of IUP Strains
The expression of heterologous proteins from the chromosome increases the genotype stability and reduces the metabolic burden of maintaining extrachromosomal DNA compared to plasmid-based systems [12]. It also eliminates the need for antibiotics to maintain the plasmid, which is too expensive to use on a large scale [13]. When there is only a single copy of the insert, the promoter strength will play an important role in the expression of the heterologous genes. Alternatively, the genes can be inserted multiple times to improve the expression level [14]. Five strains of E. coli expressing the IUP under the control of constitutive (pro4, proC, proD) and inducible promoters (trc, T7) with varying strengths were created using a CRISPR-cas9/λ red system [15]. The integration of the IUP between yabP and rulA was confirmed by colony PCR and sequencing (Figure A1). The strains were then transformed with p5T7-lycipi-ggpps which results in the production of the carotenoid lycopene that can be quantified using UV/Vis spectroscopy.
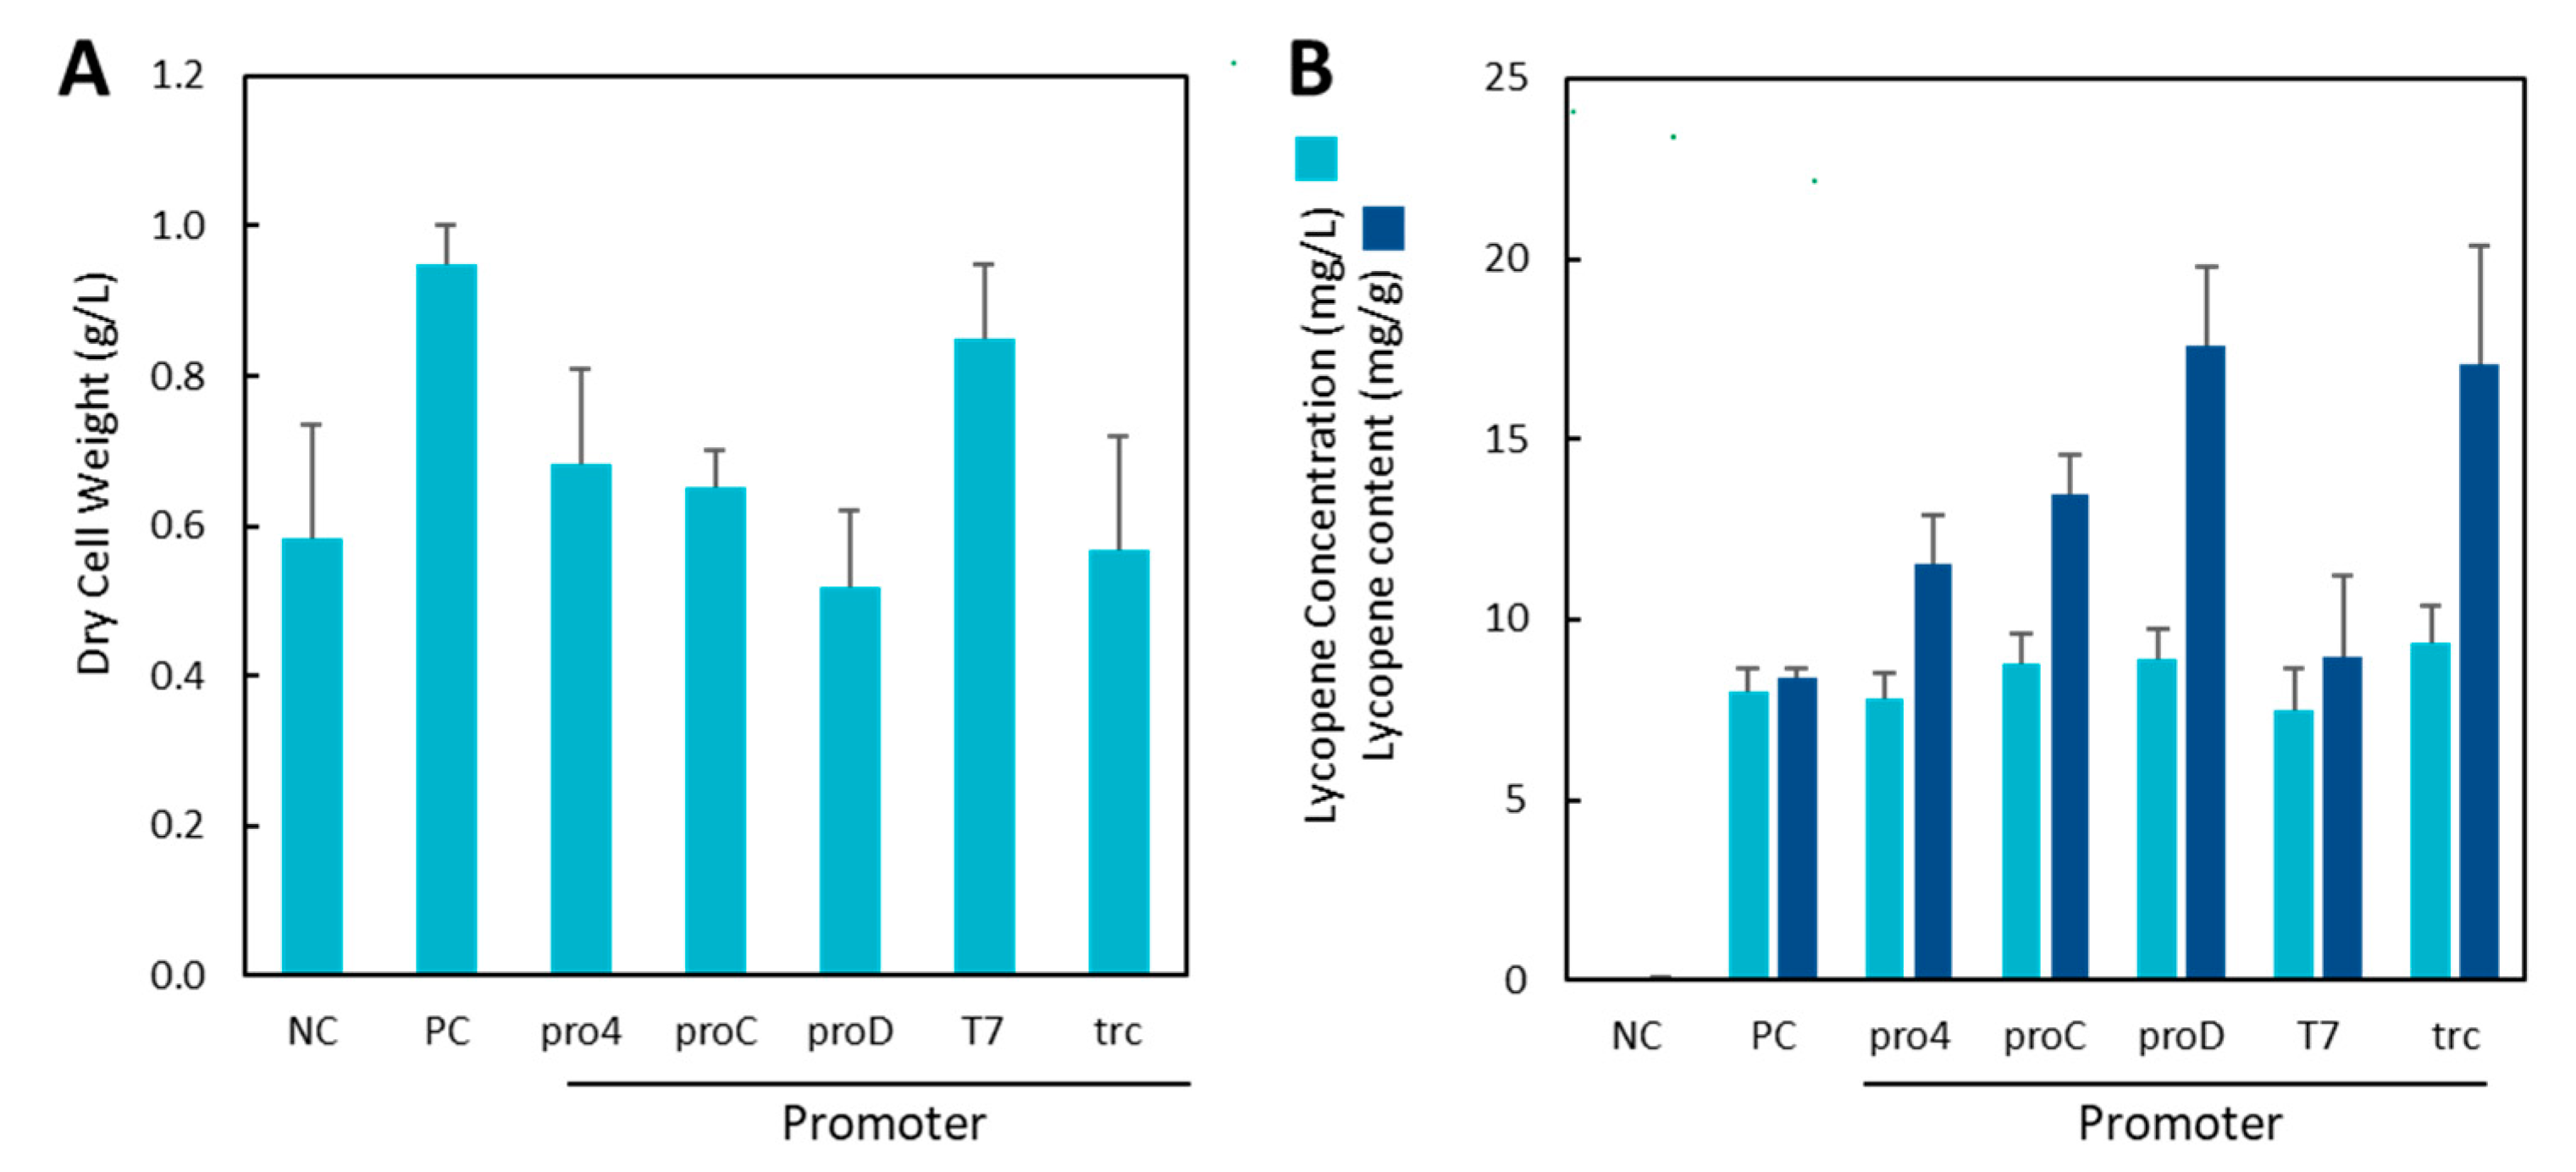
The initial results show that the integration of the IUP in the chromosome resulted in high levels of lycopene production in M9 minimal media using every promoter (Figure 2). Interestingly, lycopene titres were consistently in the range of 7.4–9.4 mg/L regardless of the promoter used, and there were no statistical differences between strains (p > 0.05 compared to positive control). However, when the dry cell weights of each strain were accounted for, there were significant differences. The proC and proD strains exhibited significantly lower growth than the plasmid-based PC (p < 0.01, two-tailed t-test, n = 3), as did the trcIUP strain (p < 0.05, two-tailed t-test, n = 3). As a result of the lower growth rates, the lycopene contents of the cells (specific yield) varied significantly, and the integration of the IUP in the chromosome had a positive effect on lycopene production (Figure 2B—dark bars). The best producers were the trcIUP and proDIUP strains making 17.1 ± 3.2 mg/g and 17.6 ± 2.2 mg/g of lycopene, respectively. This is a 2-fold increase in lycopene content compared to the positive control (8.4 ± 0.3 mg/g).

Figure 2.
Dry cell weight (A) and lycopene production (B) in plasmid and chromosomal IUP systems 24 h after induction with 0.1 mM IPTG and 25 mM isoprenol. Light bars represent the lycopene titre (mg/L), and dark bars represent the lycopene content (mg/g). PC represents the positive control plasmid-based IUP strain, and the negative control (NC) is wildtype MG1655(DE3) without the IUP.
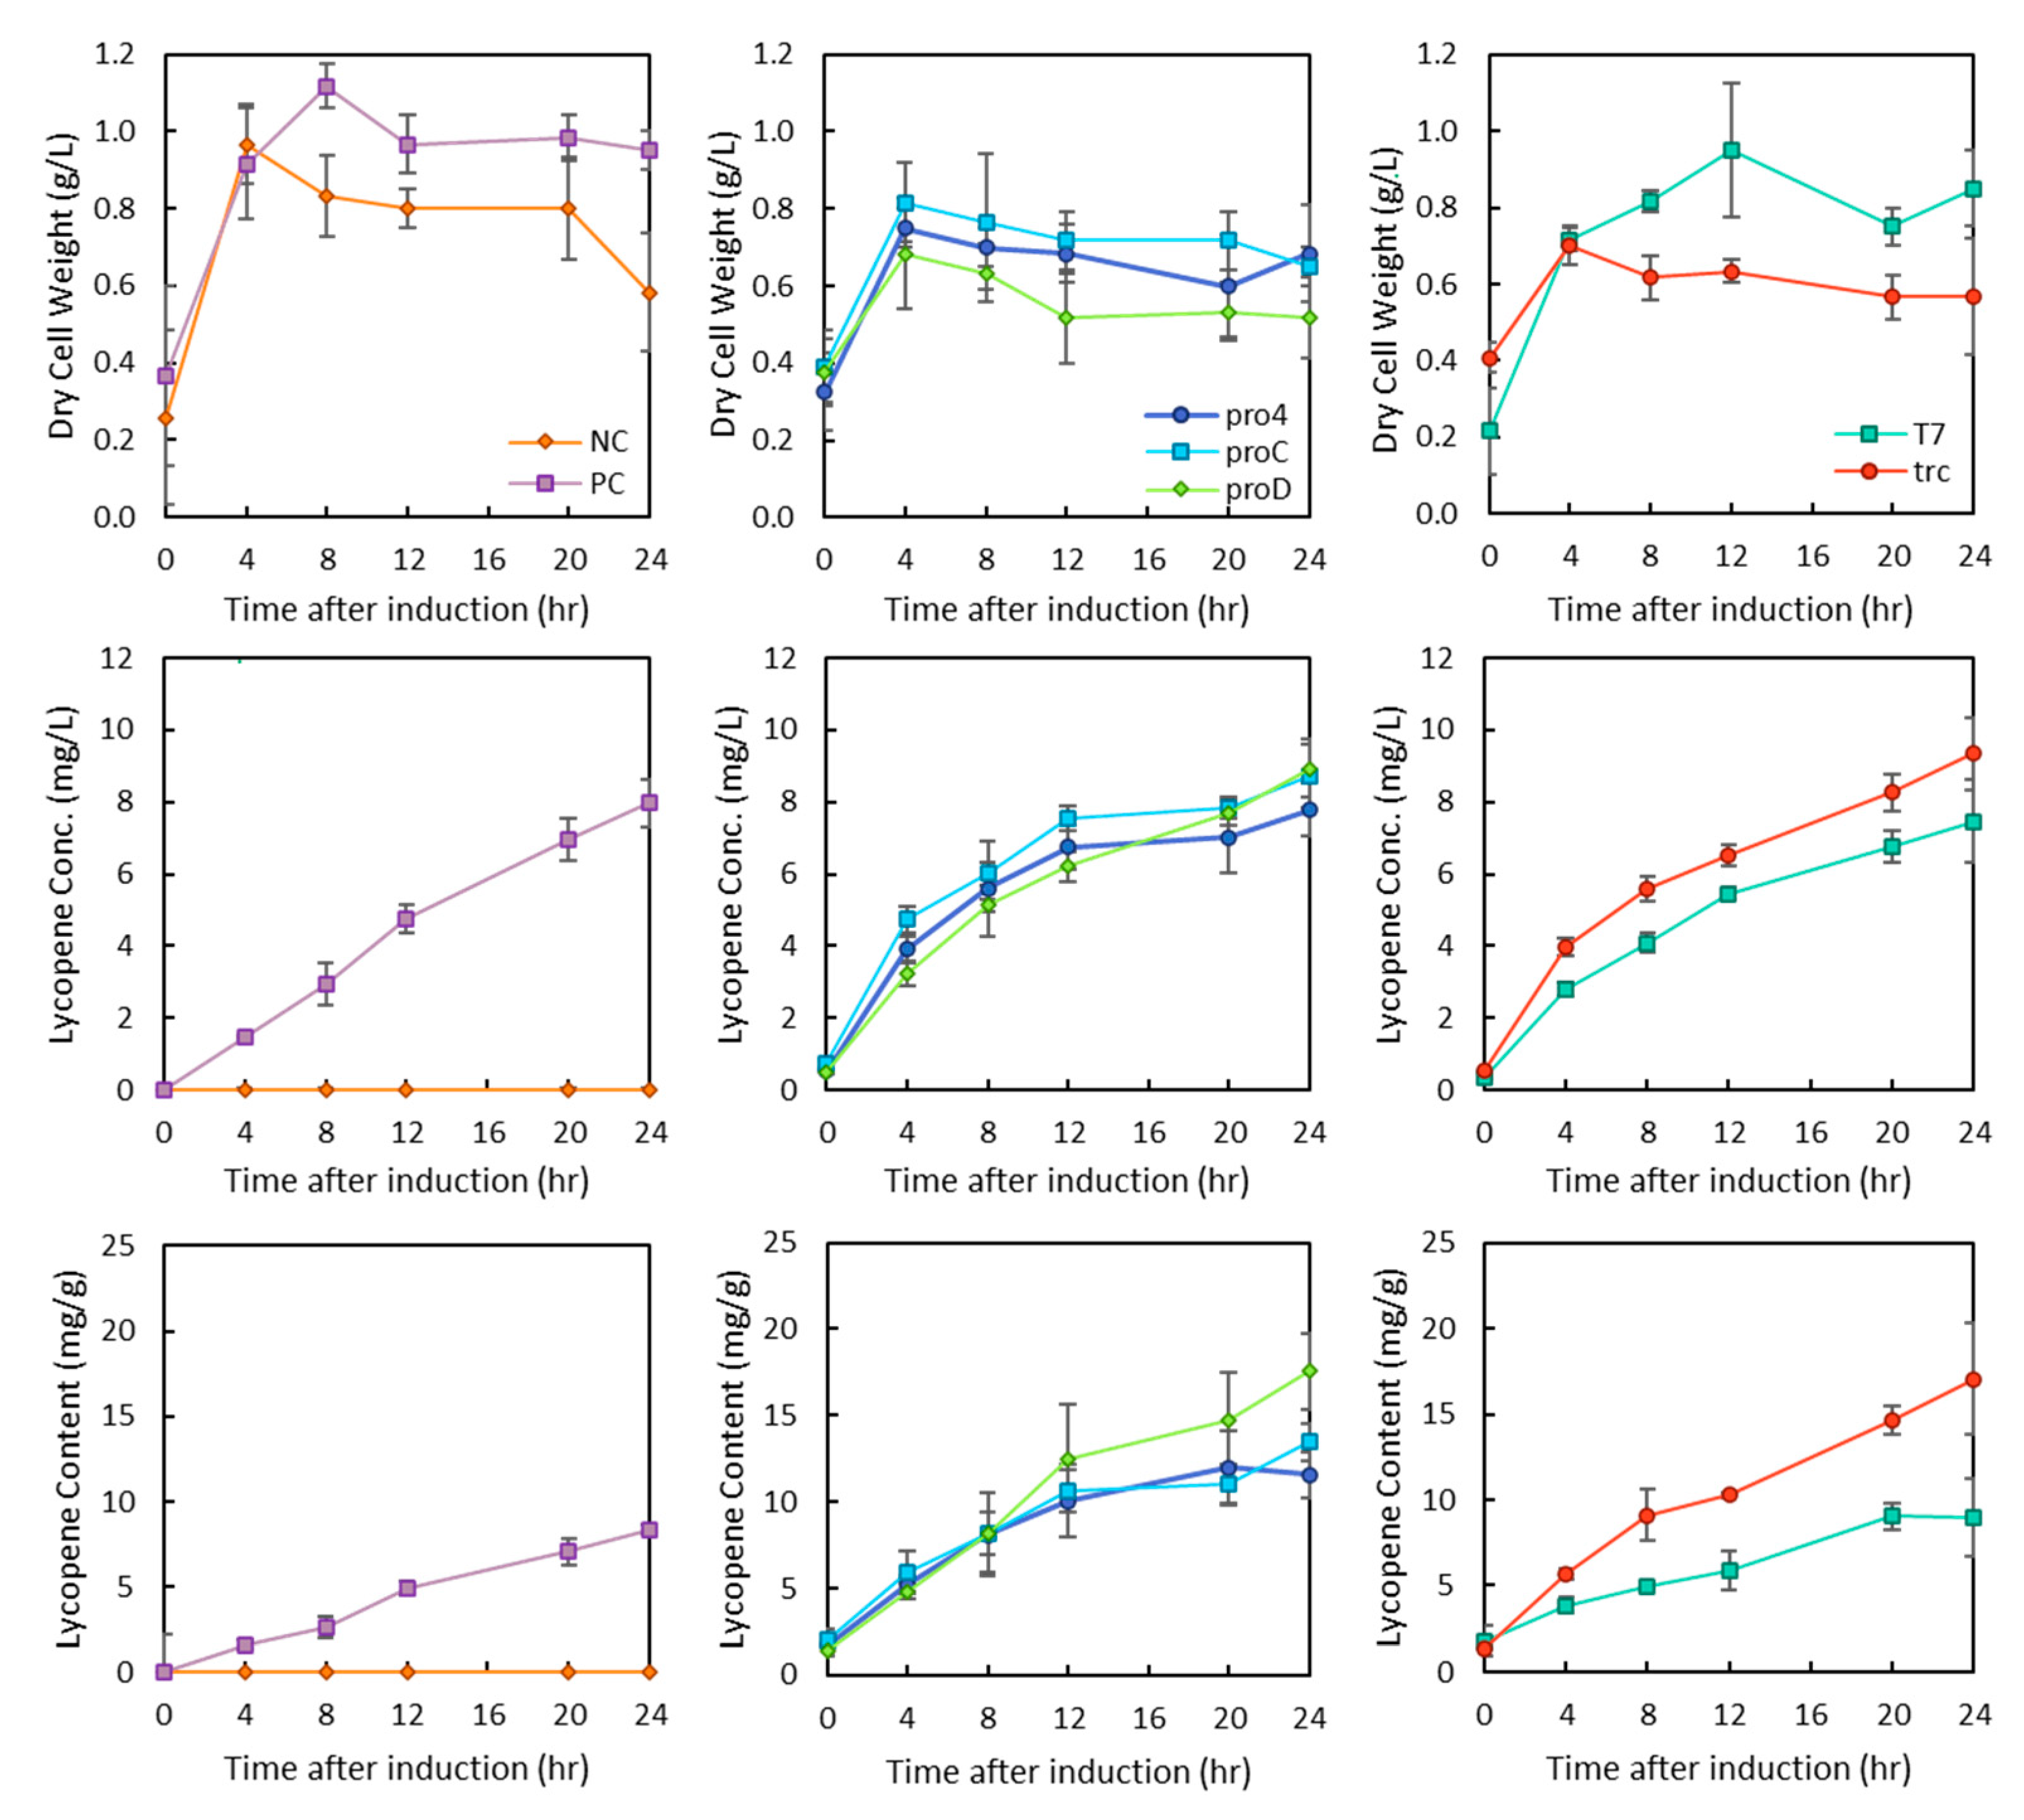
The further investigation of the growth characteristics of these strains shows that when the lycopene pathway is expressed along with the IUP on the plasmid system (PC), the dry cell weight of these cultures also increases. Conversely, the use of constitutive promoters pro4/C/D for the chromosomal expression of the IUP did not increase the dry cell weight (DCW). In all cultures, the production of lycopene steadily increased for the first 12 h (Figure 3). Interestingly, growth lasted for only 8 h in the PC and T7 IUP strains, and cell death may be occurring in the proD strain which had a lower final DCW than any other culture.

Figure 3.
Growth profiles of IUP strains expressing the lycopene synthesis pathway. Changes in cell growth are shown in the top row of panels. Changes in lycopene titres over time are shown in the middle panels, and changes in lycopene content are shown in the bottom row of panels. The promoter used is indicated in the legends and separated by the type of promoter with pro4/C/D being constitutive promoters and trc/T7 being IPTG inducible promoters. PC refers to the plasmid-based IUP system, while NC refers to WT E. coli.
2.2. Increasing Membrane Capacity Using Membrane Modulating Enzymes
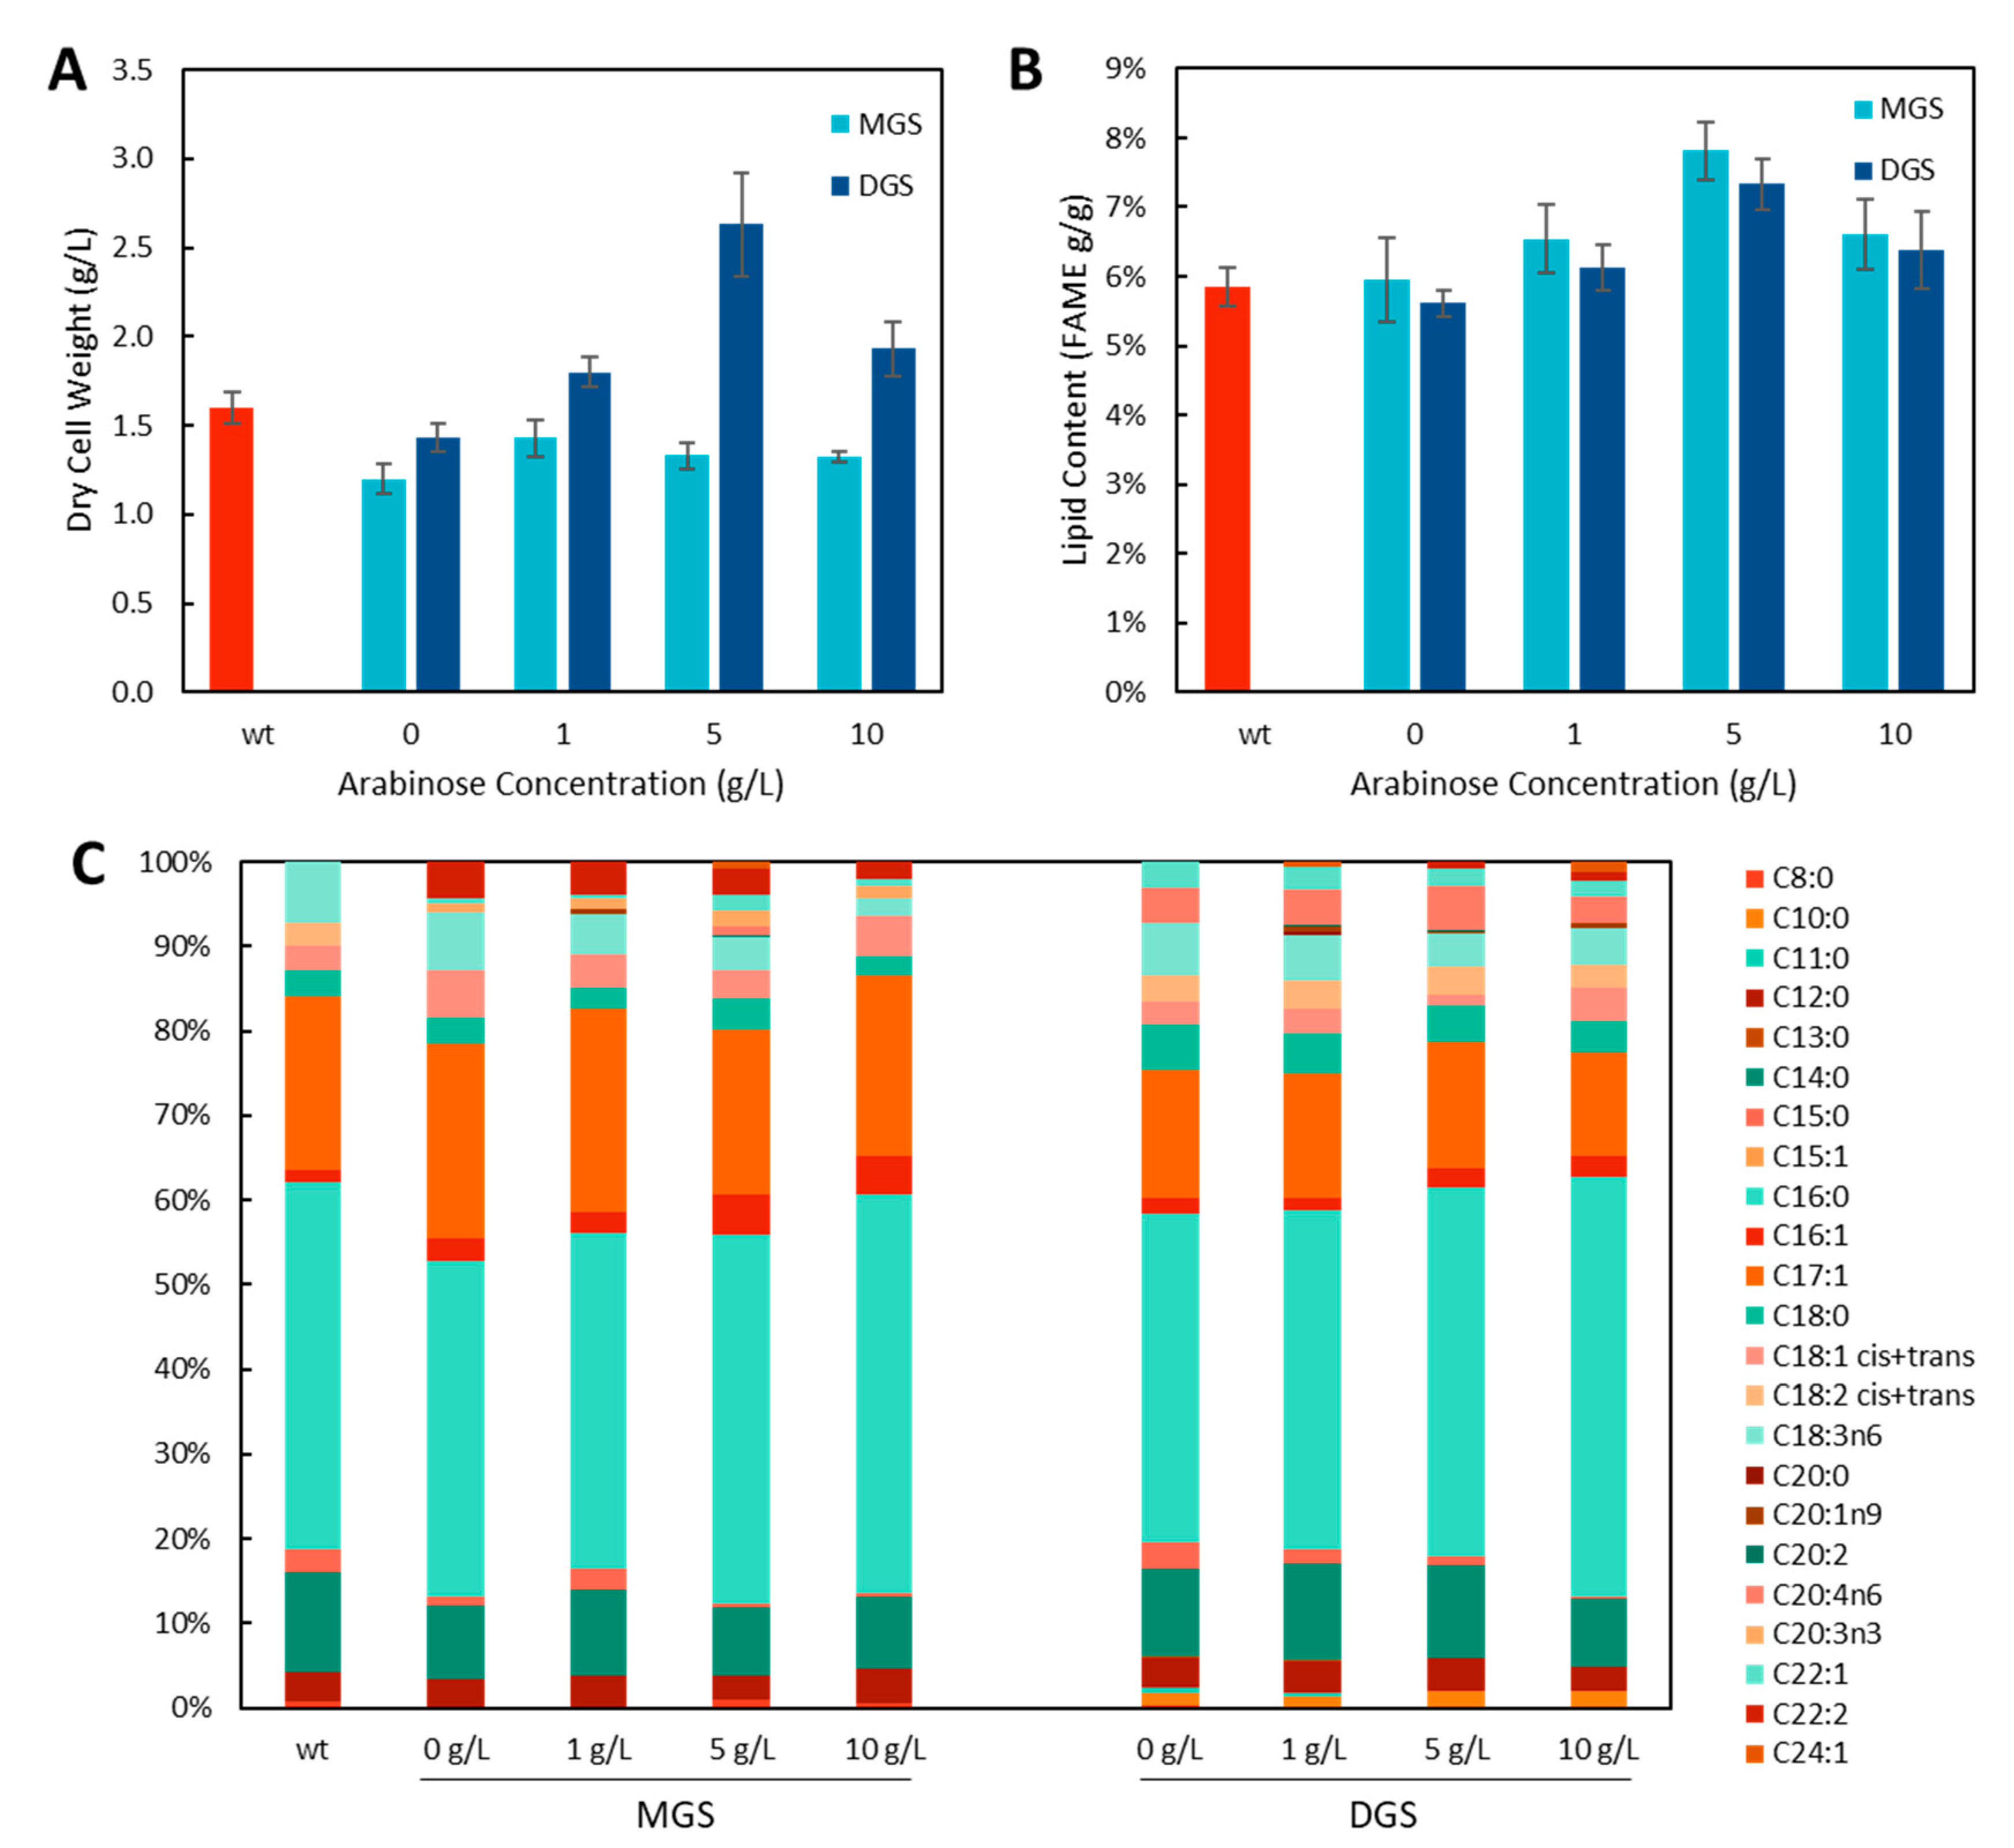
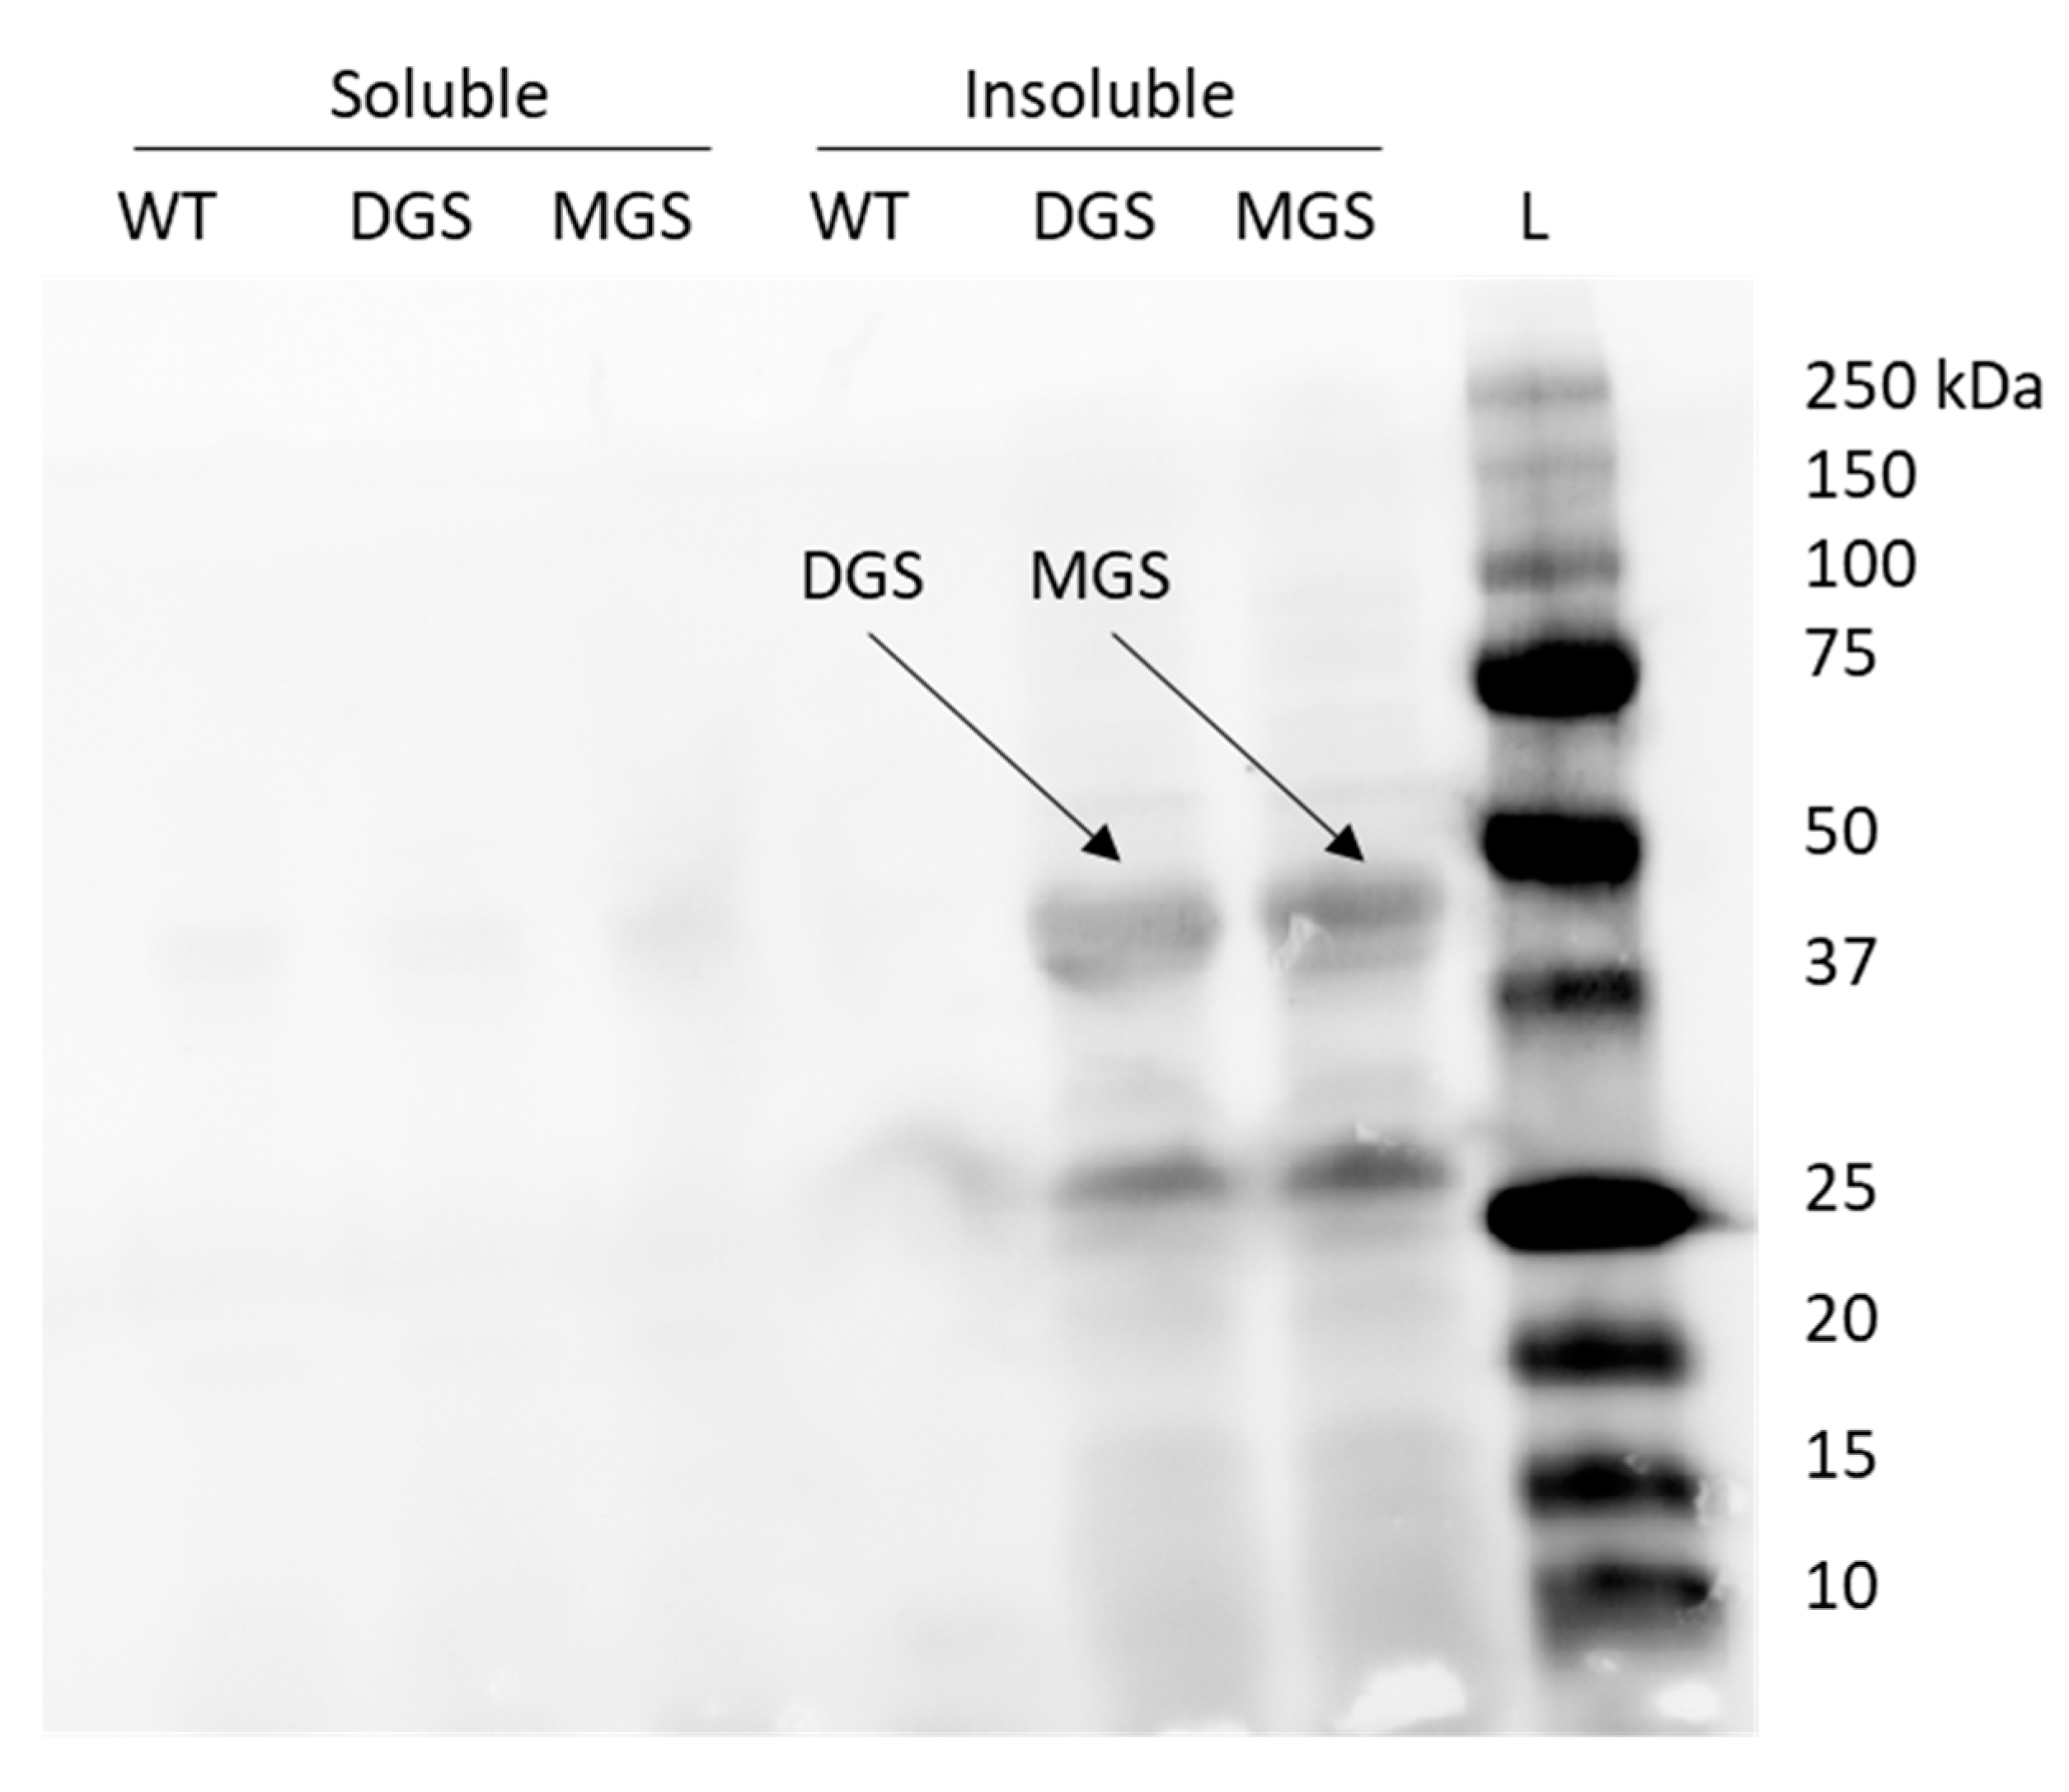
Phytoene desaturase (crtI) is the enzyme responsible for the formation of lycopene from its colourless intermediate phytoene and is a membrane-peripheral enzyme [16]. Increasing the membrane area could have two potential impacts on lycopene production by increasing the storage capacity of the cell for the products of this pathway (phytoene and lycopene) as well as increasing the area available for CrtI to associate with the inner membrane. To investigate this possibility, MGS and DGS from A. laidlawii were expressed to form intracellular membrane vesicles. First, MGS (45 kDa, [7]) and DGS (40 kDa, [17]) expression was confirmed by Western blot to be present in the insoluble membrane fraction (Figure A2). Then, E. coli containing either the MGS or DGS expression cassette only were grown in M9 media with varying concentrations of their inducer arabinose to see the effect of these genes on the DCW, lipid content, and lipid composition of the cells (Figure 4).

Figure 4.
(A) Dry cell weights and (B) lipid content of E. coli expressing MGS or DGS with different concentrations of the inducer, arabinose. The wildtype control (wt) did not contain any plasmids. (C) FAME lipid composition.
For MGS, the DCW was slightly lower for MGS than for the WT strain, and no changes were seen with increasing arabinose concentrations. However, for DGS, the DCW was significantly higher in cultures induced with 5 g/L of arabinose (Figure 4A). With the formation of intracellular vesicles, one might expect to see a large increase in the lipid content of the cells; however, the total lipids were determined by transesterification using an acid catalyst which can convert both triacylglycerides and phospholipids to fatty acid methyl esters (FAMEs), and only a small increase in FAMEs was found for DGS (31%, p < 0.01, two-tailed t-test, n = 3) and MGS (33%, p < 0.01, two-tailed t-test, n = 3) with arabinose induction (Figure 4B). However, it is unknown how the formation of intracellular vesicles affects cell size/volume, and it is possible that cells grow larger with lower cell densities (cells/mL), resulting in the same DCW for the WT and MGS/DGS cultures, effectively resulting in no appreciable increase in lipid content. The lipid composition was also found to be similar in all samples (Figure 4C); however, the production of C16:1 was found to increase with increasing arabinose concentration for both MGS and DGS expressing strains, and C22:2 was formed in these strains which was not present in the WT strain.
2.3. Lycopene Production in MGS and DGS Strains
To investigate the effect of the co-expression of MGS or DGS on the production of lycopene, the plasmid for lycopene biosynthesis along with either the DGS or MGS plasmids was transformed into the proD-IUP and trc-IUP strains as well as the wildtype strain containing only the endogenous MEP pathway (NC) or the wildtype strain containing the pSEVApro4-IUP plasmid (PC) (Figure 5).

Figure 5.
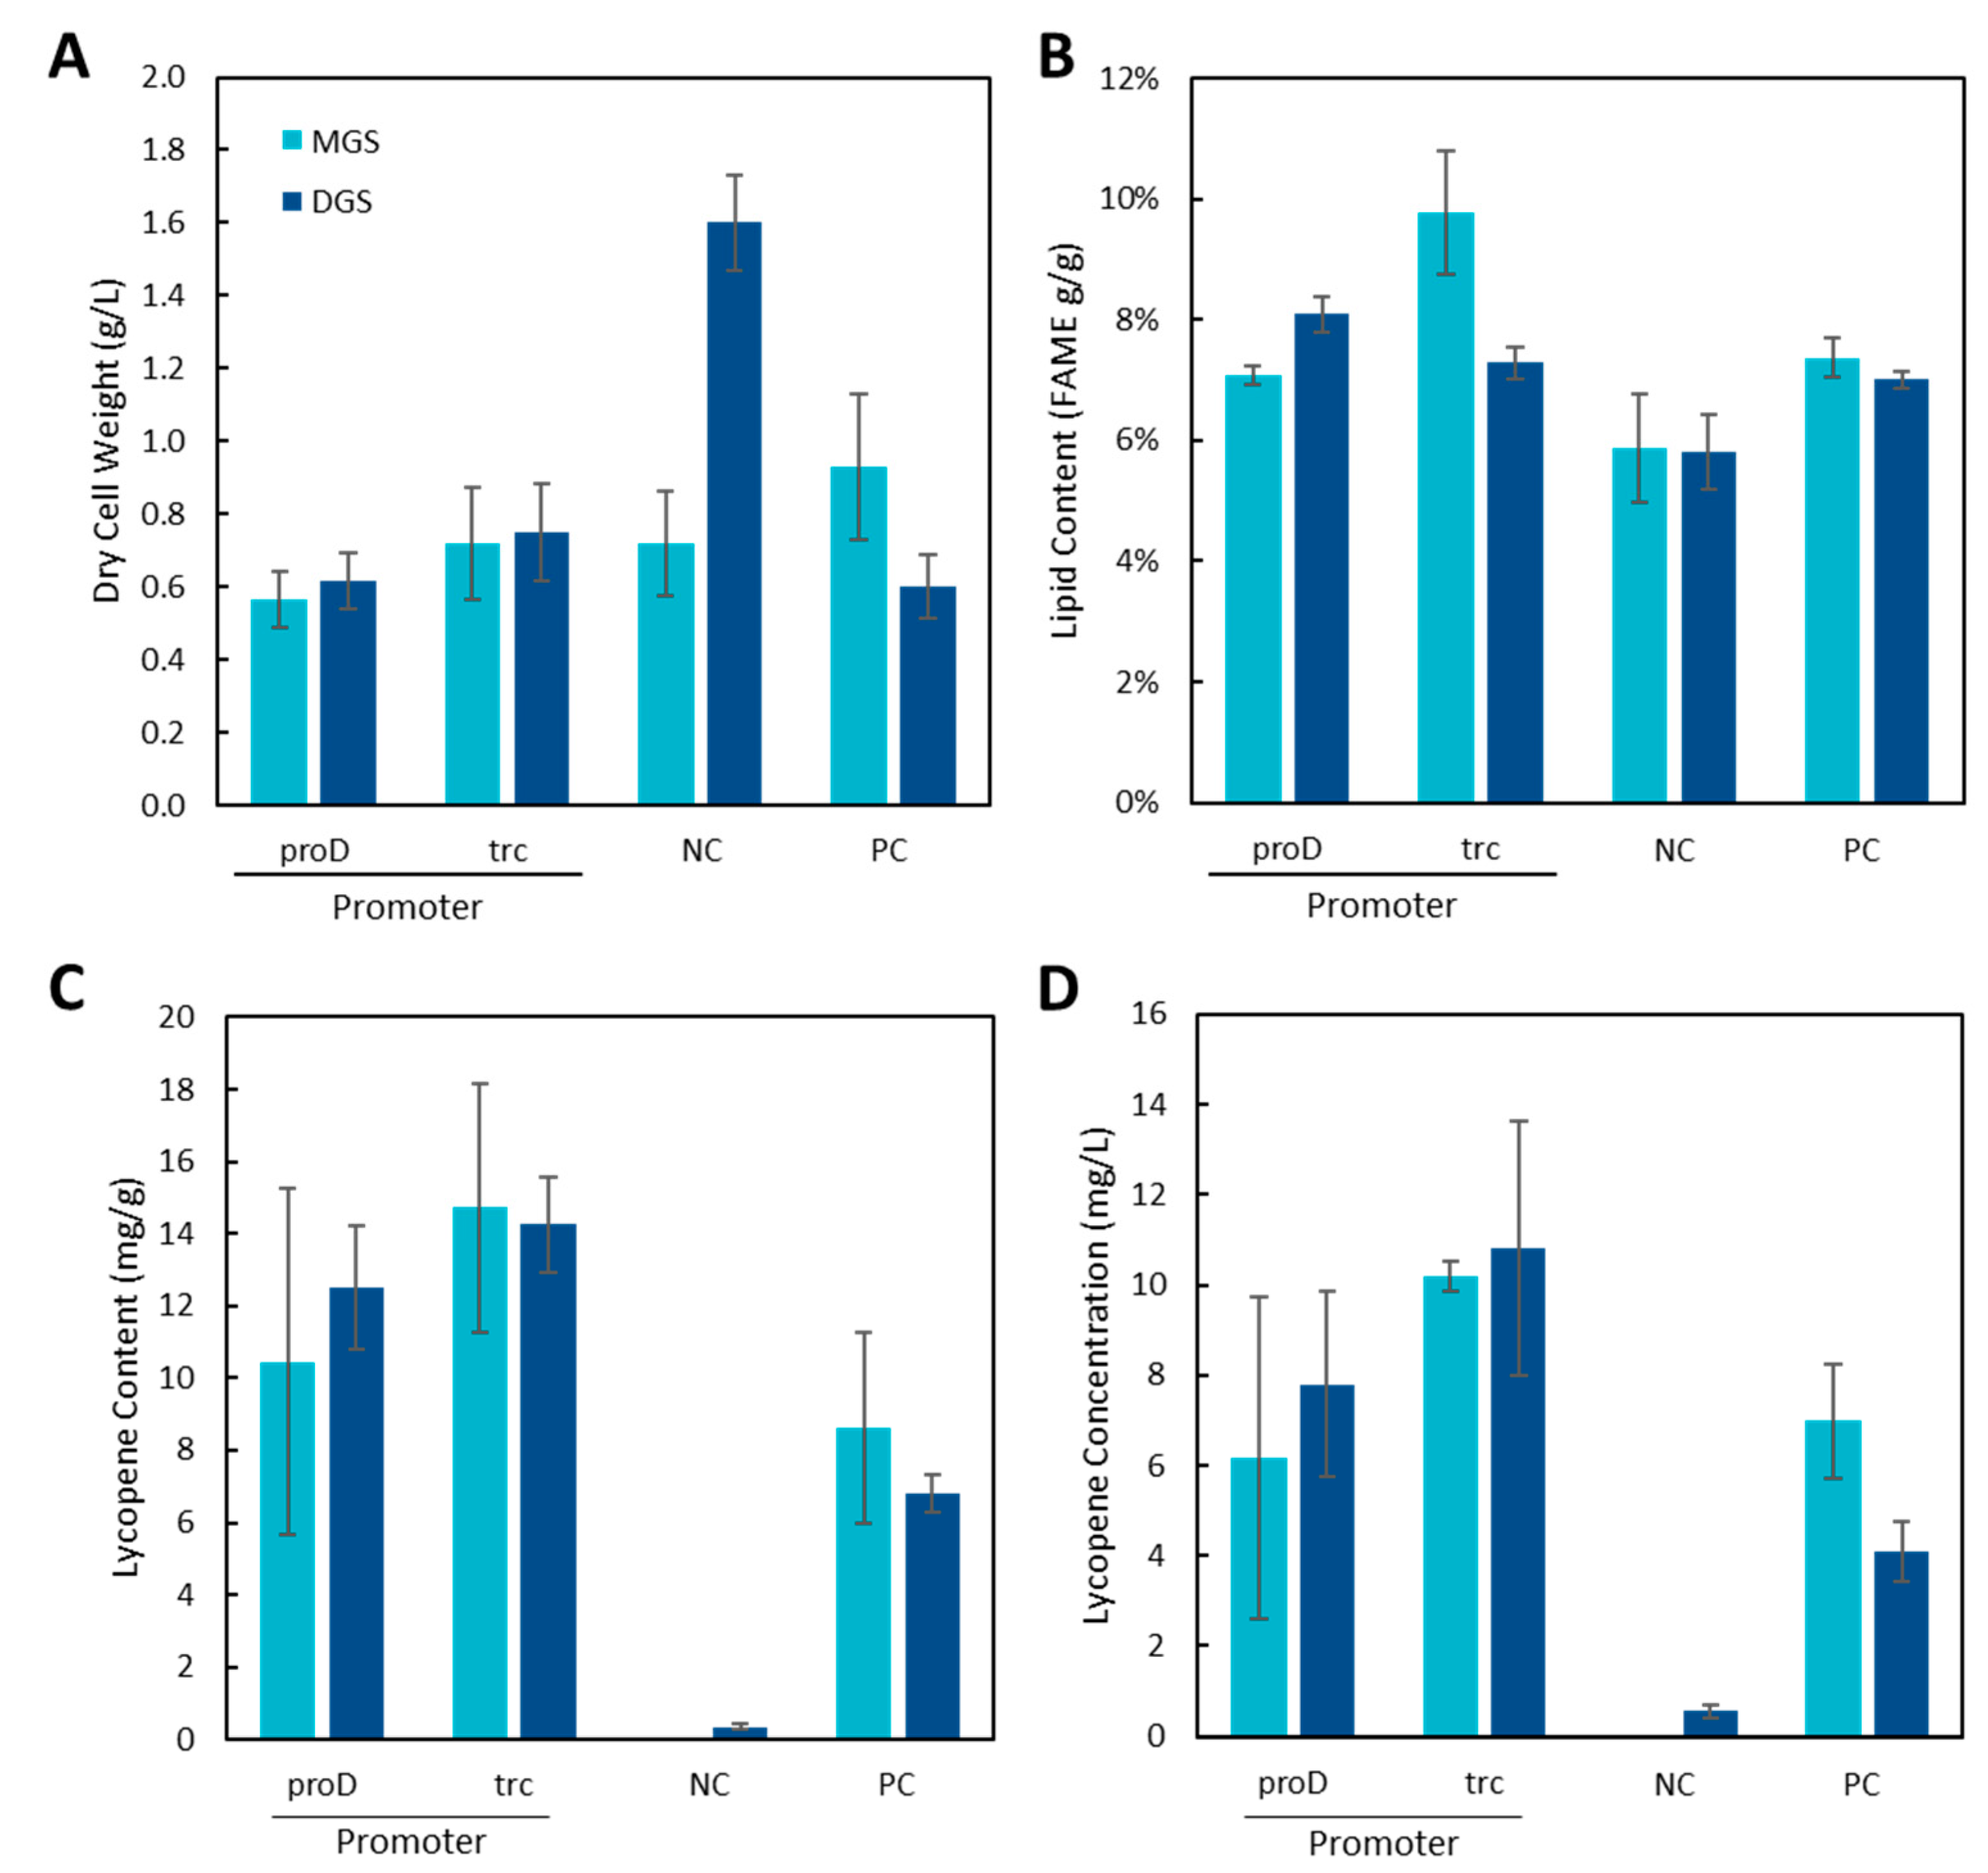
Effect of MGS or DGS expression on lycopene production in proD and trc strains, WT (NC), and the plasmid-based IUP expression (PC) system. (A) Dry cell weight, (B) Lipid content, (C) Lycopene content, and (D) Lycopene concentration.
Again, with 5 g/L of inducer, the expression of DGS increased the DCW of the wildtype culture (NC, Figure 5A) but not that of the other strains. The expression of the IUP and lycopene genes with MGS or DGS resulted in significantly higher lipid levels than the wildtype strain (NC), as confirmed by the one-way ANOVA test (p < 0.05). Notably, the trc + MGS strain exhibited superior lipid production, and this strain also exhibited higher lipid content (Figure 5C). However, lycopene production decreased in most of the strains when compared to the strains only expressing the lycopene biosynthesis pathway (Figure 2), with the PC lycopene content decreasing from 8.4 ± 0.3 mg/g to 6.8 ± 0.5 mg/g for DGS and no change for MGS (8.6 ± 2.6 mg/g). For the proD strain, the lycopene content decreased from 17.6 mg/g to 12.5 mg/g for MGS and 10.4 mg/g for DGS. A similar decrease was seen in the trc strain.
Interestingly, DGS expression also resulted in a detectable amount of lycopene in the WT strain (0.34 ± 0.08 mg/g, Figure 5C,D), in which lycopene is usually undetectable (Figure 2), confirming that DGS expression can have a positive effect on lycopene production. In contrast, DGS expression decreased the lycopene volumetric production in the positive control system where lycopene production is much higher. One possible explanation for the decrease in the IUP and positive control strains could be the formation of inclusion bodies. When inclusion bodies form, they can have profoundly negative effects on the metabolism of the host cell including other recombinant proteins being expressed such as those from the IUP and lycopene biosynthesis genes. This effect may be greater in strains where several recombinant proteins are being expressed at high levels compared to the negative control strain where a smaller number of proteins are overexpressed.
2.4. Effect of MGS and DGS on β-Carotene Production
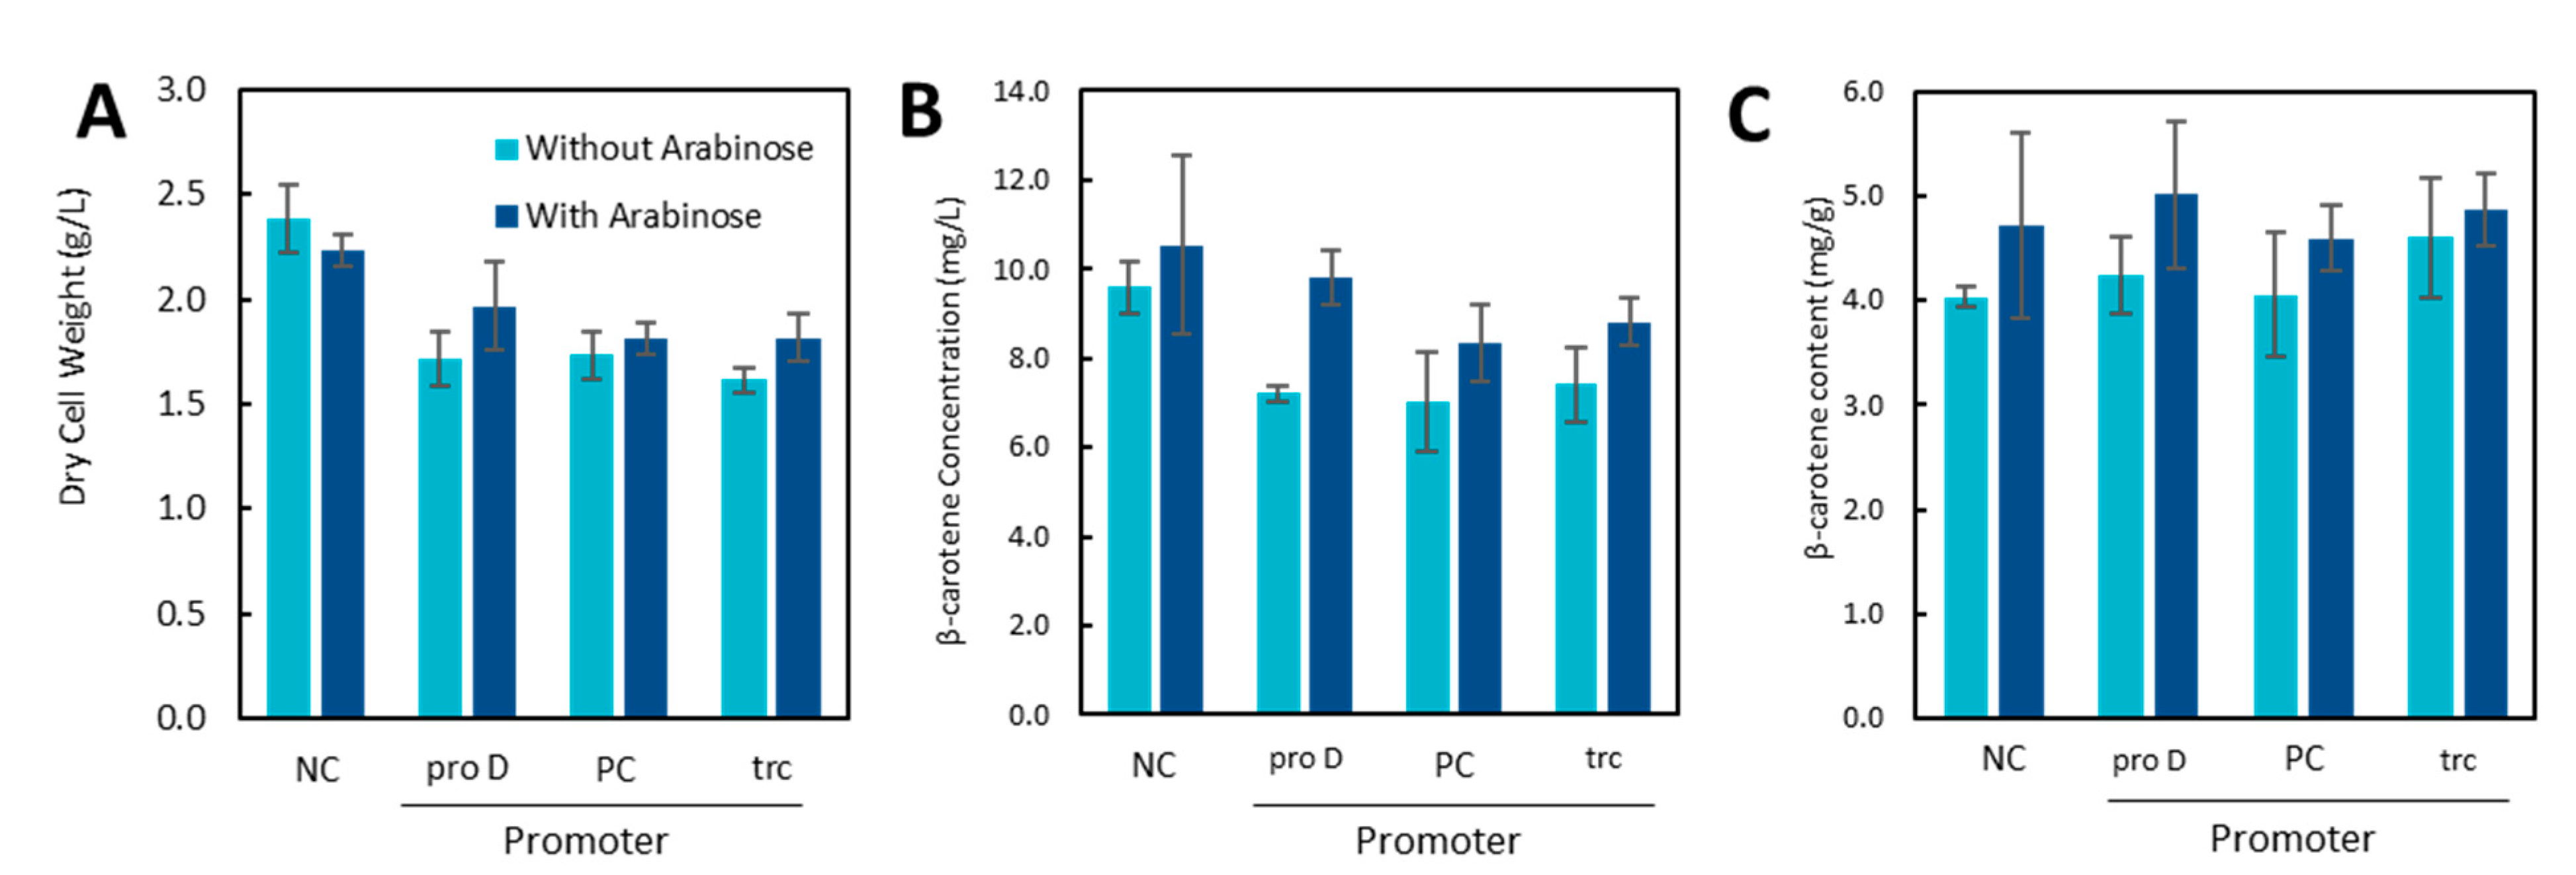
Curious as to the effects on different carotenoid products which would have different solubilities in the cell membrane, MGS and DGS were expressed alongside the pathway for β-carotene production (Figure 6). In contrast to the lycopene strains, the production of β-carotene must be conducted at a lower temperature (30 °C). In this scenario, the DCW decreased in the strains expressing the IUP from a plasmid or from the chromosome. No significant differences in the β-carotene content were observed; however, the proD strain did see an increase in the β-carotene concentration (7.2 mg/L vs. 9.8 mg/L) in strains induced for MGS expression (Figure 6B), but this only served to offset the decrease compared to the wildtype strain (NC). One possible explanation for the difference in productivity compared to the lycopene strains could be the difference in the optimal temperatures of the IUP and the β-carotene pathway. The increase in lycopene production in the IUP strains is minor compared to the wildtype strain at 30 °C, while it is significant at 37 °C (unpublished results).

Figure 6.
Dry cell weight (A) and β-carotene concentration (B) and β-carotene content (C) of strains with and without MGS induction.
3. Discussion
Notably, the investigation conducted by Wu et al. also aimed at enhancing lycopene production through the expression of MGS. In addition, they overexpressed plsb and plsc genes to boost phospholipid production via the diglyceride-3-phosphate synthesis pathway, resulting in a modest 13% increase in lycopene yield. They achieved slightly better results by combining this pathway with MGS; lycopene production improved, with a 32% increase observed when both pathways were employed. Meanwhile, Wu et al. inserted the mgs gene into the chromosome, potentially explaining the higher gene expression compared to plasmid insertion, as was conducted in our study. A summary of the work in terms of improvements or decreases in lycopene content is shown in Figure 7. This shows that gains made from the insertion of the IUP into the genome of E. coli were somewhat cancelled out by the expression of mgs or dgs in these strains. The small increases seen in the previous study, combined with this study, suggest that membrane vesicle engineering through MGS or DGS expression is not a promising option for increasing carotenoid production in E. coli.

Figure 7.
Summary of effects of chromosomal insertion and MGS or DGS expression on specific lycopene content.
The insertion of 13 copies of the IUP using modulated ribosome binding sites (RBSs) into the genome of E. coli saw a 1.78-fold increase in lycopene yield, similar to this study, where a single copy increased the lycopene specific yield by 2-fold [18]. Furthermore, the lycopene titre achieved in this study was produced using minimal salt media. Although higher lycopene titres can be achieved using LB or other rich media, these media are much more expensive than minimal salt media like the M9 used in this study. This is particularly important when considering the economic feasibility of producing carotenoids using biomanufacturing processes.
4. Materials and Methods
4.1. Strains and Routine Cultivation
E. coli strains were obtained from the source indicated in Table 1. All strains were stored as glycerol stocks at −80 °C. Strains were grown in LB media (10 g/L tryptone, 5 g/L yeast extract, and 5 g/L NaCl) at 37 °C and 200 rpm for routine purposes. Where appropriate, kanamycin (KnR), ampicillin (AmpR), and spectinomycin (SpR) were supplemented in the media at a final concentration of 50 µg/mL, 100 µg/mL, and 50 µg/mL.

Table 1.
List of E. coli strains and plasmids used in this work.
4.2. Cloning
All vectors were constructed using the routine cloning protocol and the primers described in Appendix B. The genes (mgs and dgs) from Acholeplasma laidlawii were codon-optimized for E. coli and synthesized by Twist Biosciences. They were cloned with and without a his-tag into the backbone of pCBFD1 containing the arabinose promoter/repressor, ampicillin resistance marker, and the origin using Gibson assembly to create p20-ara-mgs, p20-ara-dgs, and their his tag variants. To create the pTarget plasmids used to knock-in the IUP, the online tool ChopChop [19] was used to generate an sgRNA spacer sequence “AAATTCGCTGTGGAGCA’GGAAGG” targeting the region between yabP and rluA (NC_000913.3[59126-59687]) for insertion. The antibiotic selection marker of pCas9 was changed from kanamycin to chloramphenicol making pCas9-Cm by Gibson assembly to make the system compatible with other plasmids. A 1 kbp region surrounding the junction of yabP and rluA was amplified from MG1655 (DE3) using Q5 polymerase (NEB) and added to pTargetF by Gibson assembly along with the sgRNA spacer sequence to create pTarget-yabP. Then, the IUP genes were amplified from pSEVA228-pro4IUP along with a kanamycin resistance marker and inserted into the homology region of pTarget-yabP so that they were flanked by yabP and rulA using Gibson assembly. The promoter was varied by altering the Gibson primers. All primers are listed in Appendix B. All constructs were verified by Sanger sequencing at TCAG (Sick Kids, Toronto, ON, Canada).
4.3. Chromosomal Insertion
Insertions were performed using a modified version of a published protocol [15]. pCas-Cm and pTarget plasmids containing each version of the IUP were transformed into MG1655 (DE3) using electroporation. The transformants were recovered in LB broth with Kan, Sm, and Cm at 30 °C for 24–48 h. Then, 15 mL of broth was centrifuged for 15 min, and the cell pellet was resuspended in LB with Kan and 0.5 mM IPTG and incubated overnight at 30 °C to cure the pTarget plasmid. Then, another 10 mL of LB was added, and the culture was incubated overnight at 42 °C to cure pCas-Cm. After curing, 10 mL of the culture was spread onto an LB plate and streaked for single colonies. Colonies were screened for the insertion using colony PCR and streaked onto three separate plates each containing a single antibiotic (Kan, Sm, Cm) to confirm that the plasmids were cured. The PCR product was purified and sent for sequencing to confirm the insertion was correct. Each new strain (Table 1) was then made electrocompetent and transformed with combinations of p5T7-lycipi-ggpps, pAC-BETAipi, p20-ara-mgs, and p20-ara-dgs.
4.4. Western Blot
To confirm the expression of DGS and MGS, strains expressing the his-tagged versions were grown to 0.5 OD600 and induced with 5 g/L of arabinose and incubated at 37 °C, for 24 h. Cultures (25 mL) were centrifuged at 2300× g for 15 min at 4 °C, and the cell pellet was resuspended and washed using deionized water. The pellet was resuspended in 25 mL of PBS (0.05 M, Ph 7.4) and sonicated (Qsonica Misonix Sonicator XL-2000, Newtown, CT, USA) for 5 min at 22.5 Hz. The lysates were centrifuged for 10 min at 2300× g. The supernatant containing the soluble protein was prepared for SDS-PAGE by combining 25 µL with 1 µL of DNAse and 5 µL of Laemmli buffer containing 5% v/v β-mercaptoethanol. The insoluble pellet after centrifugation was resuspended in TE/SDS buffer (10 mM Tris HCl, 1 mM EDTA, 1% w/v SDS, pH 8) and combined with the same as the soluble protein fraction. Samples were boiled for 10 min at 95 °C.
Samples were then loaded to pre-cast SDS-PAGE gels (12%, Biorad, Mississauga, ON Canada) and run at 125 V for 120 min. The gel was then soaked in 1 L of protein transfer buffer (25 mM Tris, 192 mM glycine, 20% v/v methanol, pH 8.3) for 15 min. Proteins were transferred to the nitrocellulose membrane using electroblotting (Trans-Blot Turbo Transfer System, Biorad) for 25 min at 25 V and 0.4 A. The blot was briefly rinsed with PBS (50 mM, pH 7.4), then washed with TBST (10 mM Tris-HCl, 100 mM NaCl, 0.05% v/v Tween 20, pH 8.0) for 5 min at RT. Non-specific binding was blocked by incubating the membrane in 5% w/v nonfat milk for 1 h with gentle shaking. The membrane was then incubated in TBST with 5% w/v nonfat milk containing 1:1000 dilution of anti-His antibody (Catalog No. 501122712, Fisher Scientific, Waltham, MA, USA) overnight at 4 °C. The membrane was then washed three times with TBST for 5 min each and then incubated with Alexa Fluor™ 488 conjugated secondary antibody (Catalog No. A-21141, Thermo Fisher Waltham, MA, USA) in TBST with 5% w/v nonfat milk at a 1:10,000 dilution for 1 h at RT. The membrane was then washed three times as before and imaged using a Biorad ChemiDoc using a 700/50 filter.
4.5. Production of Isoprenoids
Glycerol stocks were streaked onto LB agar plates (15 g/L agar) with the appropriate antibiotic and grown overnight at 37 °C. Seed cultures were prepared by transferring one colony into LB broth and grown overnight at 37 °C. Flasks containing M9 media (4 g/L glucose, 6.8 g/L Na2HPO4-7H2O, 3 g/L KH2PO4, 0.5 g/L NaCl, 1.0 g/L NH4Cl, 2 mM MgSO4, 0.1 mM CaCl2) with Wolfe’s Trace elements [20] containing the appropriate antibiotics were inoculated with 1% v/v seed culture in triplicate. Growth was monitored using absorbance at 600 nm (OD600). In experiments requiring the induction of gene expression, IPTG was added to a final concentration of 0.1 mM when the culture reached an OD600 of 0. When required, 25 mM of isoprenol was also added when OD600 = 0. Induced cultures were grown for 24 h at 37 °C and 200 rpm, unless otherwise indicated. Dry cell weight was measured by centrifuging 12 mL of bacterial culture at 2211× g for 10 min. The supernatant was removed, the cells were washed with ultrapure water, and the pellet was transferred to a preweighed microcentrifuge tube. The solution was centrifuged, and the supernatant was removed. The cell pellet was frozen overnight and dried for 16 h using a Labconco lyophilizer. The dried pellet and tube were weighed, and the difference is reported as dry cell weight (DCW; g/L).
4.6. Carotenoid Extraction
To quantify carotenoids, 1 mL of culture was centrifuged at 10,000× g for 2 min in a dark microcentrifuge tube to prevent photodegradation. The supernatant was removed, and the cell pellet was resuspended in 1 mL of a 1:1 volume ratio of ethanol and acetone. The tubes were incubated for 1 h at room temperature in the dark with occasional mixing by inversion every 15 min. The tubes were centrifuged at 10,000× g for 2 min to remove cell debris, and 200 µL was transferred into a 96-well plate. The absorbance was read at 475 nm using a plate reader (BioTek, Agilent, Missassauga, ON, Canada). The blank reading was subtracted from the absorbance, and the carotenoid concentration was determined by dividing the absorbance by 0.0816 L/mg. Carotenoid content was determined by dividing concentration by DCW.
4.7. Total Lipid Content by Direct Transesterification to FAME
The fatty acid methyl ester (FAME) content by weight was determined for triplicate cultures using a slightly modified standard FAME laboratory analytical procedure (LAP) from the National Renewable Energy Laboratories (NREL) [21]. Briefly, approximately 10 mg of dried cells was mixed with 25 μL of the recovery standard methyl nonadecanoate (C19:0Me at 10 mg/mL), 300 μL of 0.6 M HCl, and 200 μL of a trichloromethane methanol mixture (2:1 v/v) and subsequently incubated for 1 h at 85 °C in a water bath with stirring on a magnetic hot plate at 1000 rpm. After cooling, 1 mL of hexane was added to each sample and mixed at ambient temperature at 1000 rpm. Samples were centrifuged, and 450 μL of the clear top hexane phase was spiked with 50 μL of the internal standard methyl heptadecanoate (C17:0Me) to have a final concentration of 100 μg/mL. FAME was separated and analysed using an FID-equipped Agilent 7890 Series GC and an Agilent DB-Wax capillary column (30 m, 0.25 mmm, 0.25 μm). Helium was used as the carrier gas at a constant pressure of 119 kPa, and the FID was operated at 280 °C. Samples were injected in split mode with a 1:10 split ratio and eluted using the following oven ramp: 50 °C, 1 min, 10 °C min−1 to 200 °C, 3 °C min−1 220 °C, and hold for 10 min. Individual FAMEs were quantified using an analytical standard mixture (Supelco 37, Sigma Aldrich, Burlington, MA, USA) and the internal standard. Unidentified FAMEs were quantified by applying the RF factor of the closest known peak. The total FAME content by weight was calculated according to the NREL LAP by adjusting the cumulative FAME mass using the recovery standard C15:0Me and dividing the total by the weight of cells used in the assay.
5. Conclusions
Overall, the insertion of the IUP into the chromosome had a large effect on the specific yield of lycopene at 37 °C (2.2-fold increase for proD); however, this effect was not observed for the production of β-carotene at 30 °C. This improvement is important, as these strains no longer require antibiotics for plasmid maintenance, which is costly at a large scale. Furthermore, the high lycopene yield obtained in this work used minimal salt media, another significant cost saving during large-scale production. The expression of MGS and DGS from A. laidlawii to induce intracellular lipid production did slightly alter the lipid profile of the E. coli strains and resulted in minor increases in lipid content but did not increase the carotenoid production in the IUP expressing strains. DGS expression did have a positive impact on carotenoid expression in the wildtype strain, increasing the lycopene content from undetectable levels to 0.34 mg/g. However, this effect was reversed in the IUP strains expressing MGS or DGS.
Author Contributions
Conceptualization, V.C.A.W.; methodology, V.C.A.W., J.L, D.S.P. and E.B.; formal analysis, V.C.A.W., J.L. and E.B.; investigation, J.L., E.B., D.S.P. and A.M.P.; resources, V.C.A.W.; writing—original draft preparation, V.C.A.W., E.B. and J.L.; writing—review and editing, V.C.A.W., J.L., D.S.P., E.B. and A.M.P.; visualization, V.C.A.W., E.B. and J.L.; supervision, V.C.A.W.; project administration, V.C.A.W.; funding acquisition, V.C.A.W. All authors have read and agreed to the published version of the manuscript.
Funding
This research was funded by the Natural Sciences and Engineering Research Council of Canada, Discovery grant program, and Canadian Foundation of Innovation—JELF Infrastructure Fund.
Data Availability Statement
Data are available upon request.
Conflicts of Interest
The authors declare no conflicts of interest.
Appendix A

Figure A1.
Sequencing results of the promoter region of the knock-in IUP strains. Green indicates the portion of the chromosome, turquoise/blue the promoter or operator regions, orange the ribosome binding site (RBS), and red the start of the choline kinase (CK) gene.
Figure A1.
Sequencing results of the promoter region of the knock-in IUP strains. Green indicates the portion of the chromosome, turquoise/blue the promoter or operator regions, orange the ribosome binding site (RBS), and red the start of the choline kinase (CK) gene.
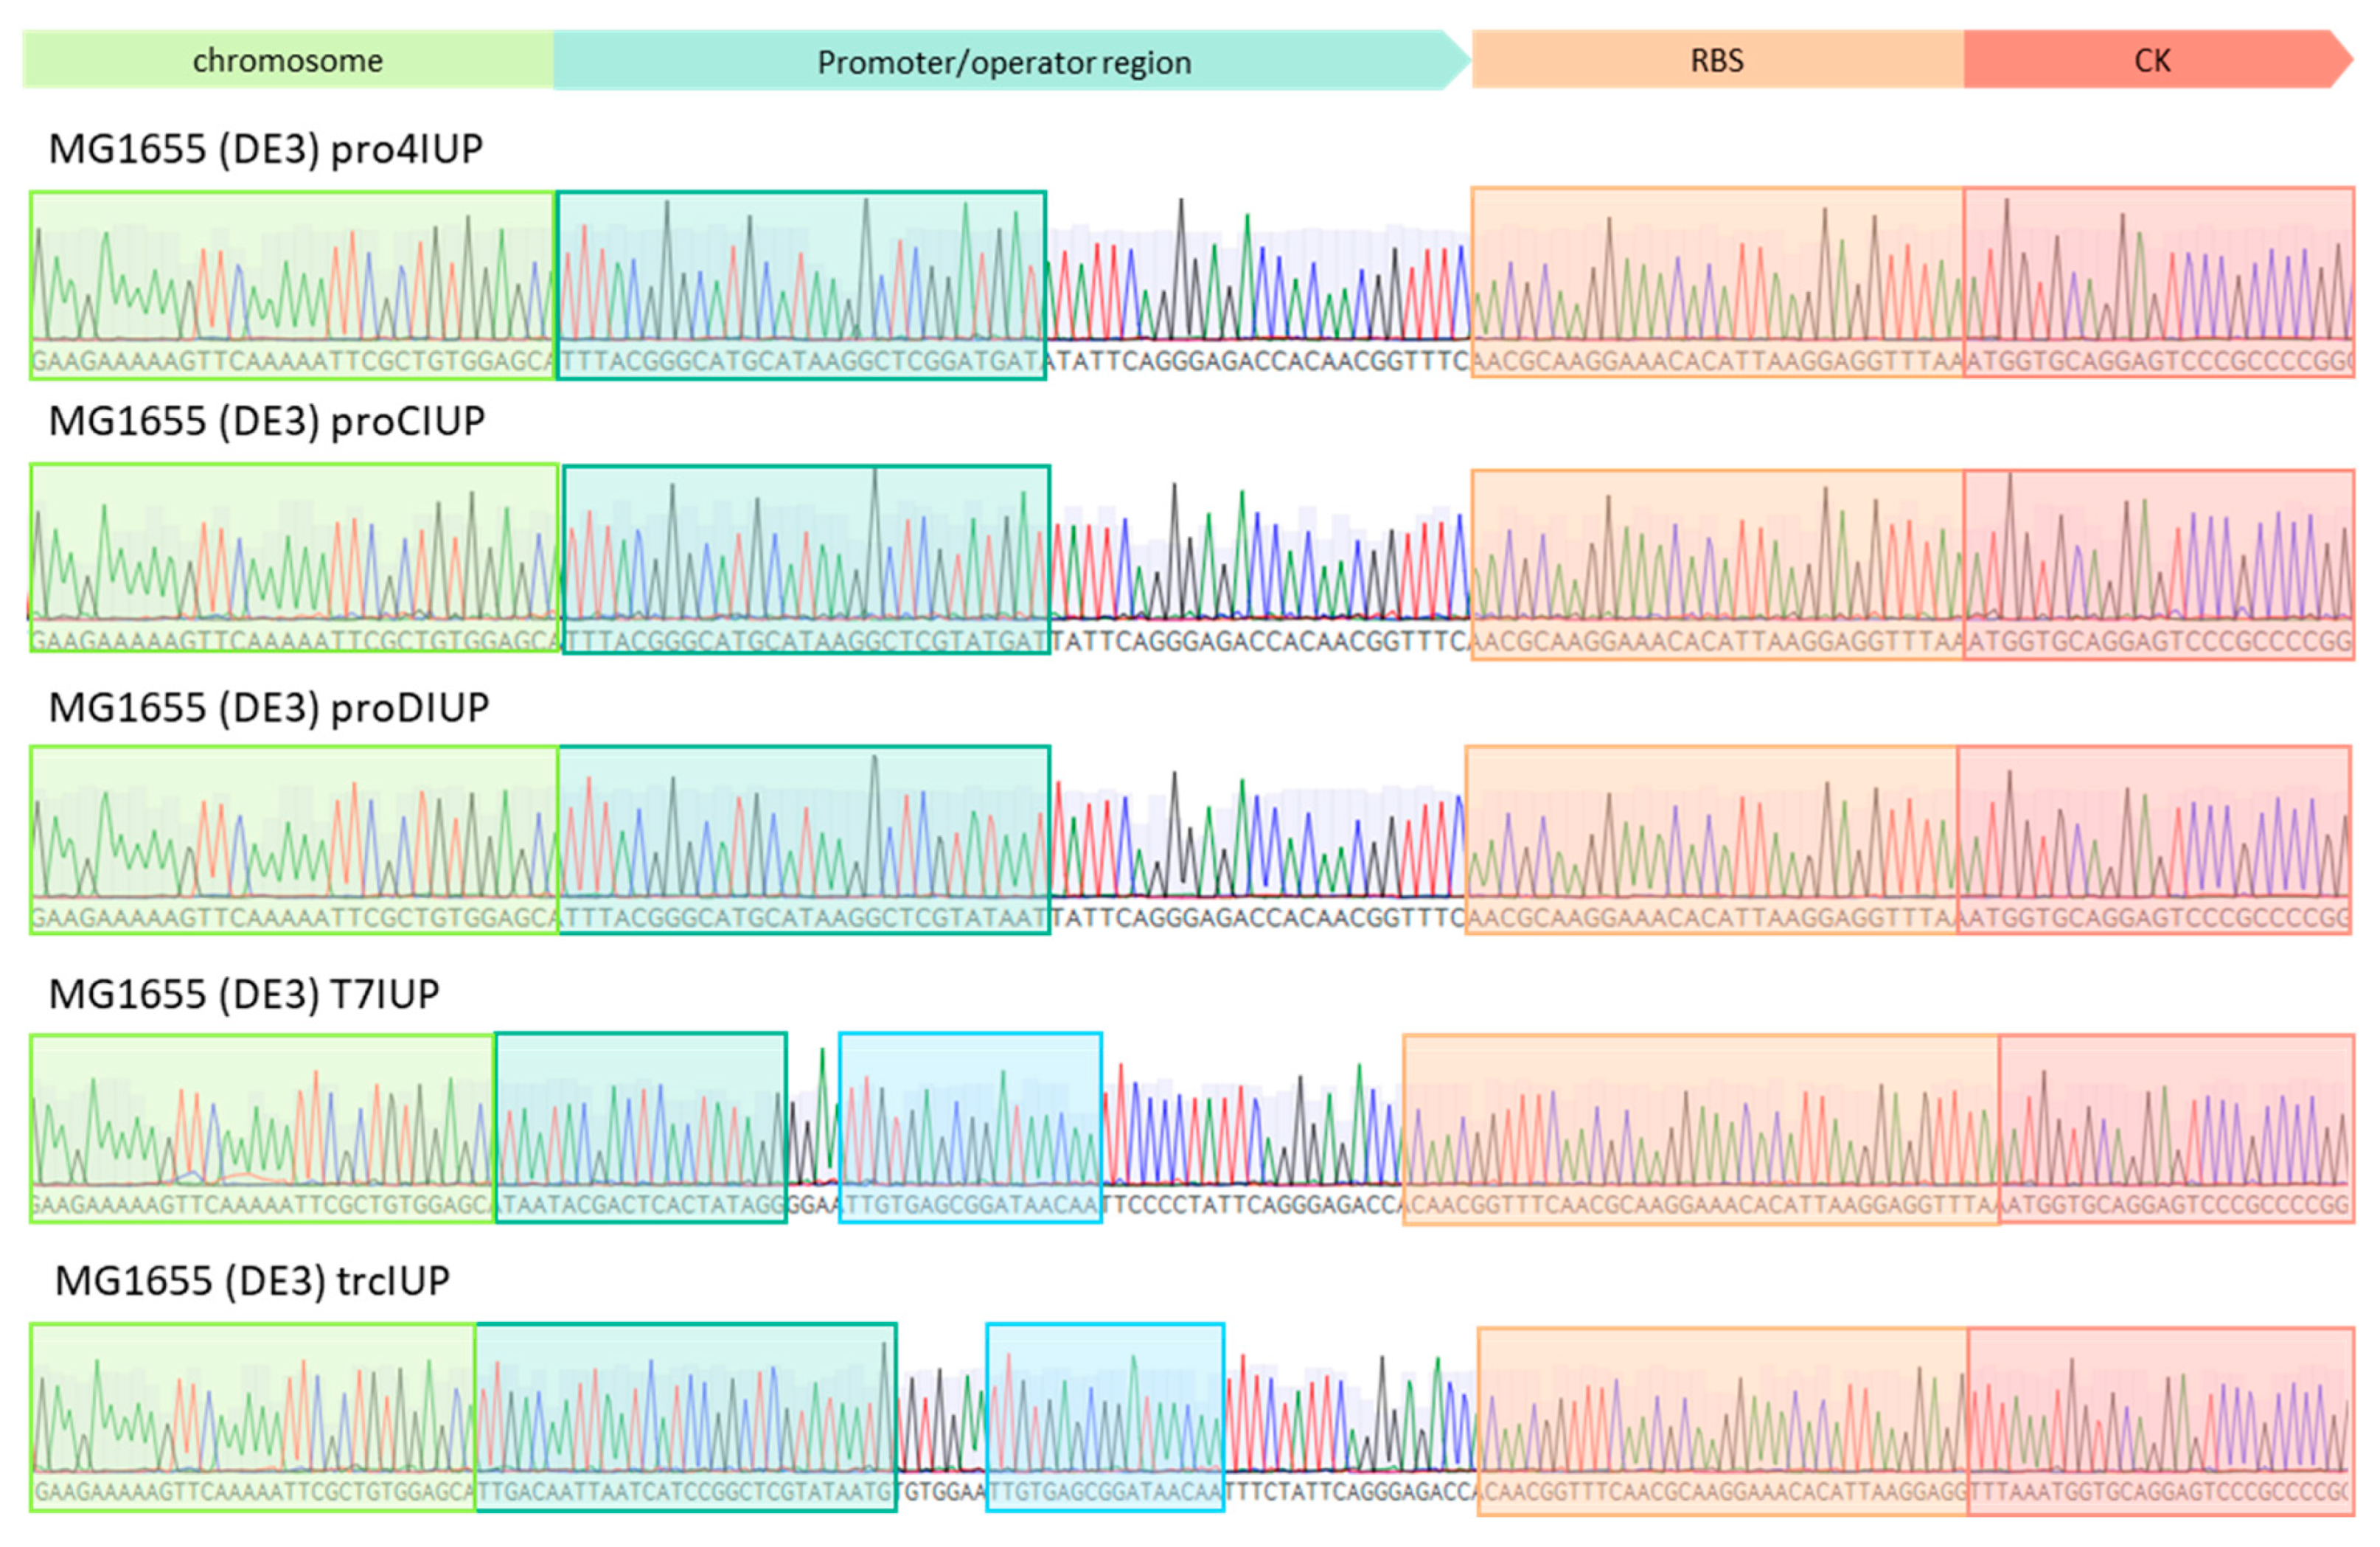

Figure A2.
DGS (lane 5) and MGS (lane 6) was his-tagged and immunoblotted using anti-His antibodies and compared to the ladder (L, lane 7).
Figure A2.
DGS (lane 5) and MGS (lane 6) was his-tagged and immunoblotted using anti-His antibodies and compared to the ladder (L, lane 7).
Appendix B

Table A1.
List of primers used throughout all steps of cloning and CRISPR insertion.
Table A1.
List of primers used throughout all steps of cloning and CRISPR insertion.
| Cloning Step | Primer Name | Primer Sequence (5′–3′) |
|---|---|---|
| Integration | Int_CP_fwd | gtactcagacgttgcagctg |
| Integration | Int_CP_rev | ggaatacgaccggaccgag |
| pCas-Cm | BB_Cm_fwd | taacggcaaagcagtcagagtagaatag |
| pCas-Cm | BB_Cm_rev | acgcctggtggtcagaccaagtttactc |
| pCas-Cm | CasCmC_2_fwd | gggtctgctatgtggtgcta |
| pCas-Cm | CasCmC_2_rev | ggtgagctggtgatatggga |
| pCas-Cm | CasCmC_fwd | gggtgatgctgccaacttac |
| pCas-Cm | CasCmC_SP1 | gggtgatgctgccaacttac |
| pCas-Cm | Cm_fwd | ttggtctgaccaccaggcgtttaagggc |
| pCas-Cm | Cm_rev | ctctgactgctttgccgttacgcaccac |
| pTargetT step 1 | HMR_fwd | tgaagatccttaacctgggcgtgctacc |
| pTargetT step 1 | HMR_rev | agatcctttaaagcagtatgtggcccgc |
| pTargetT step 1 | Ori_fwd | catactgctttaaaggatctaggtgaagatc |
| pTargetT step 1 | Ori_rev | ccttcctgctccacagcgaatttactagtattatacctaggactg |
| pTargetT step 1 | PT1C_fwd | aggcgagatcaccaaggtag |
| pTargetT step 1 | PT1C_rev | cagcagattacgcgcagaaa |
| pTargetT step 1 | SP1 | gcctgatgcggtattttctcc |
| pTargetT step 1 | Spec_fwd | aaattcgctgtggagcaggaagggttttagagctagaaatagcaag |
| pTargetT step 1 | Spec_rev | gcccaggttaaggatcttcacctagatc |
| pTargetT step 2 | IUP_Pro4_fwd | ctgtggagcatttacgggcatgcataagg |
| pTargetT step 2 | IUP_ProCD_fwd | tattcagggagaccacaacg |
| pTargetT step 2 | IUP_rev | attcccttcccagggttatgcagcggaaaag |
| pTargetT step 2 | IUP_T7_fwd | taatacgactcactataggggaattgtgagcggataacaattcccctattcagggagaccacaacg |
| pTargetT step 2 | IUP_trc_fwd | ttgacaattaatcatccggctcgtataatgtgtggaattgtgagcggataacaatttctattcagggagaccacaacg |
| pTargetT step 2 | PT_BB_fwd | cataaccctgggaagggaattaccgaatg |
| pTargetT step 2 | PT_BB_Pro4_rev | tgcccgtaaatgctccacagcgaatttttg |
| pTargetT step 2 | PT_BB_ProC_rev | cgttgtggtctccctgaataatcatacgagccttatgcatgcccgtaaatgctccacagcgaatttttg |
| pTargetT step 2 | PT_BB_ProD_rev | cgttgtggtctccctgaataattatacgagccttatgcatgcccgtaaatgctccacagcgaatttttg |
| pTargetT step 2 | PT_BB_T7_rev | ggggaattgttatccgctcacaattcccctatagtgagtcgtattatgctccacagcgaatttttg |
| pTargetT step 2 | PT_BB_trc_rev | gaaattgttatccgctcacaattccacacattatacgagccggatgattaattgtcaatgctccacagcgaatttttg |
| pTargetT step 2 | PT2_SP1 | tccggatatgaacaaactgca |
| pTargetT step 2 | PT2C_CP_fwd | tcgccaaccagactgctaat |
| pTargetT step 2 | PT2C_CP_rev | tcgatcccttgttcttggct |
| PCBFD1 backbone | bb_fwd | cgatgagggaatgataagtctgcgatgg |
| PCBFD1 backbone | bb_rev | gggcggattgcttattccagatgcgtgc |
| mgs/dgs fragment | dgsmgs_fwd | ctggaataagcaatccgccctcactacaac |
| mgs/dgs fragment | dgsmgs_fwd | gacttatcattccctcatcgacgccagag |
References
- Vickers, C.E.; Williams, T.C.; Peng, B.; Cherry, J. Recent advances in synthetic biology for engineering isoprenoid production in yeast. Curr. Opin. Chem. Biol. 2017, 40, 47–56. [Google Scholar] [CrossRef]
- Ram, S.; Mitra, M.; Shah, F.; Tirkey, S.R.; Mishra, S. Bacteria as an alternate biofactory for carotenoid production: A review of its applications, opportunities and challenges. J. Funct. Foods 2020, 67, 103867. [Google Scholar] [CrossRef]
- Jing, Y.; Wang, Y.; Zhou, D.; Wang, J.; Li, J.; Sun, J.; Feng, Y.; Xin, F.; Zhang, W. Advances in the synthesis of three typical tetraterpenoids including β-carotene, lycopene and astaxanthin. Biotechnol. Adv. 2022, 61, 108033. [Google Scholar] [CrossRef]
- Wang, Z.; Sun, J.; Yang, R.; Yang, J. Metabolic Engineering Escherichia coli for the Production of Lycopene. Molecules 2020, 25, 3136. [Google Scholar] [CrossRef] [PubMed]
- Ward, V.C.A.; Chatzivasileiou, A.O.; Stephanopoulos, G. Metabolic engineering of Escherichia coli for the production of isoprenoids. FEMS Microbiol. Lett. 2018, 365. [Google Scholar] [CrossRef] [PubMed]
- Chatzivasileiou, A.O.; Ward, V.; Edgar, S.M.; Stephanopoulos, G. Two-step pathway for isoprenoid synthesis. Proc. Natl. Acad. Sci. USA 2018, 116, 506–511. [Google Scholar] [CrossRef] [PubMed]
- Eriksson, H.M.; Wessman, P.; Ge, C.; Edwards, K.; Wieslander, Å. Massive Formation of Intracellular Membrane Vesicles in Escherichia coli by a Monotopic Membrane-bound Lipid Glycosyltransferase. J. Biol. Chem. 2009, 284, 33904–33914. [Google Scholar] [CrossRef] [PubMed]
- Ge, C.; Gómez-Llobregat, J.; Skwark, M.J.; Ruysschaert, J.-M.; Wieslander, Å.; Lindén, M. Membrane remodeling capacity of a vesicle-inducing glycosyltransferase. FEBS J. 2014, 281, 3667–3684. [Google Scholar] [CrossRef] [PubMed]
- Palage, A.M.; Ward, V.C. Strategies for production of hydrophobic compounds. Curr. Opin. Biotechnol. 2022, 75, 102681. [Google Scholar] [CrossRef] [PubMed]
- Wu, T.; Ye, L.; Zhao, D.; Li, S.; Li, Q.; Zhang, B.; Bi, C. Engineering membrane morphology and manipulating synthesis for increased lycopene accumulation in Escherichia coli cell factories. 3 Biotech 2018, 8, 269. [Google Scholar] [CrossRef] [PubMed]
- Liu, Y.; Low, Z.J.; Ma, X.; Liang, H.; Sinskey, A.J.; Stephanopoulos, G.; Zhou, K. Using biopolymer bodies for encapsulation of hydrophobic products in bacterium. Metab. Eng. 2020, 61, 206–214. [Google Scholar] [CrossRef] [PubMed]
- Rodríguez-Beltrán, J.; León-Sampedro, R.; Ramiro-Martínez, P.; de la Vega, C.; Baquero, F.; Levin, B.R.; Millán, S. Translational demand is not a major source of plasmid-associated fitness costs. Philos. Trans. R. Soc. B Biol. Sci. 2021, 377, 20200463. [Google Scholar] [CrossRef] [PubMed]
- Brechun, K.E.; Förschle, M.; Schmidt, M.; Kranz, H. Method for plasmid-based antibiotic-free fermentation. Microb. Cell Factories 2024, 23, 1–11. [Google Scholar] [CrossRef] [PubMed]
- Chen, H.-T.; Lin, M.-S.; Hou, S.-Y. Multiple-Copy-Gene Integration on Chromosome of Escherichia Coli for Beta-Galactosidase Production. K. J. Chem. Eng. 2008, 25, 1082–1087. [Google Scholar] [CrossRef]
- Jiang, Y.; Chen, B.; Duan, C.; Sun, B.; Yang, J.; Yang, S. Multigene Editing in the Escherichia coli Genome via the CRISPR-Cas9 System. Appl. Environ. Microbiol. 2015, 81, 2506–2514. [Google Scholar] [CrossRef]
- Schaub, P.; Yu, Q.; Gemmecker, S.; Poussin-Courmontagne, P.; Mailliot, J.; McEwen, A.G.; Ghisla, S.; Al-Babili, S.; Cavarelli, J.; Beyer, P. On the Structure and Function of the Phytoene Desaturase CRTI from Pantoea ananatis, a Membrane-Peripheral and FAD-Dependent Oxidase/Isomerase. PLoS ONE 2012, 7, e39550. [Google Scholar] [CrossRef]
- Vikström, S.; Li, L.; Karlsson, O.P.; Wieslander, Å. Key Role of the Diglucosyldiacylglycerol Synthase for the Nonbilayer−Bilayer Lipid Balance of Acholeplasma laidlawii Membranes. Biochemistry 1999, 38, 5511–5520. [Google Scholar] [CrossRef]
- Wang, Y.Z.; Jing, H.Y.; Li, X.; Zhang, F.; Sun, X.M. Rapid construction of Escherichia coli chassis with genome multi-position integration of isopentenol utilization pathway for efficient and stable terpenoid accumulation. Biotechnol. J. 2023, 18, e2300283. [Google Scholar] [CrossRef]
- Montague, T.G.; Cruz, J.M.; Gagnon, J.A.; Church, G.M.; Valen, E. CHOPCHOP: A CRISPR/Cas9 and TALEN web tool for genome editing. Nucleic Acids Res. 2014, 42, W401–W407. [Google Scholar] [CrossRef] [PubMed]
- Wolin, E.A.; Wolin, M.J.; Wolfe, R. 8 Formation of Methane by Bacterial Extracts*. J. Biol. Chem. 1963, 238, 2882–2886. [Google Scholar] [CrossRef]
- van Wychen, S.; Laurens, L.M.L. Determination of Total Lipids as Fatty Acid Methyl Esters (FAME) by In Situ Transesterification; Laboratory Analytical Procedure (LAP): Golden, CO, USA, 2013. [Google Scholar]
Disclaimer/Publisher’s Note: The statements, opinions and data contained in all publications are solely those of the individual author(s) and contributor(s) and not of MDPI and/or the editor(s). MDPI and/or the editor(s) disclaim responsibility for any injury to people or property resulting from any ideas, methods, instructions or products referred to in the content. |
© 2024 by the authors. Licensee MDPI, Basel, Switzerland. This article is an open access article distributed under the terms and conditions of the Creative Commons Attribution (CC BY) license (https://creativecommons.org/licenses/by/4.0/).

