Article

Multidimensional In Situ Characterization of Surface and Free Nanobubbles in Oxidic Nanofluids

1
Institute of Particle Technology, Clausthal University of Technology, 38678 Clausthal-Zellerfeld, Germany
2
CUTEC Forschungszentrum, 38678 Clausthal-Zellerfeld, Germany
*
Author to whom correspondence should be addressed.
Submission received: 31 December 2024 / Revised: 18 February 2025 / Accepted: 22 February 2025 / Published: 27 February 2025

Abstract

:
The efficiency of froth flotation drastically drops towards ultrafine particles. Some improvements may be possible using smaller bubbles and high degrees of turbulence, however, reaching their limits in the nanometer particle range. Therefore, an approach is presented where the nanoparticles themselves produce nanobubbles that remain attached and allow, in combination with small bubbles, for the direct flotation of nanoparticles. Here, the formation and the fate of these surface nanobubbles are investigated directly in the dispersed systems for the first time. The required differentiation between free and attached nanobubbles is realized by combining light scattering and extinction measurements. With this combination, it was also possible to study the formation of the attached nanobubbles and the strength of their mechanical attachment to the particles. The successful formation of attached nanobubbles is also confirmed with measurements of the settling velocities. Surprisingly, stable surface nanobubbles can be formed even on hydrophilic particles if the surface contains enough concave sites.

Graphical Abstract

1. Introduction

Particulate intermediate products form the basis for the vast majority of high-quality industrial products, including ceramic and powder metallurgical components, coatings, porous functional structures, printed electronics, etc. [1,2]. There is enormous potential for highly specified particle systems, especially in the size range < 10 µm. In order to fully leverage this potential, it is often necessary to consider several particle characteristics [3].
In many technically relevant fields, separating particles smaller than 10 µm based on size or other properties is a persistent challenge [4]. In particular, separating and sorting micron-sized particles is crucial for environmental assessment, food and chemical processing, biological and chemical analysis, and diagnostics. In 2016, the German Science Foundation funded the priority program PP 2045, titled “MehrDimPart—highly specific multidimensional fractionation of technical fine particle systems”. The program’s objective is to develop processes for the multidimensional fractionation of particles smaller than 10 µm, enabling precise control over particle properties while significantly increasing production throughput. As a part of the PP 2045 program, this study investigated the role of nanobubbles in the separation of nanoparticles by flotation.
On an industrial scale, flotation plays a major role in the processing of mineral powders. It is based on the attachment of hydrophobic particles to rising gas bubbles. The hydrophobic surface character can be adjusted by adding collector molecules. While high throughputs can be achieved with flotation, the separation efficiency decreases significantly as the particles become smaller. This is partly due to the reduced probability of collision between particles and rising bubbles but also to a reduced sticking probability upon collision [5,6,7]. With the growing interest in nanobubbles, it made sense to investigate their effect on flotation [8,9]. While the direct particle–bubble collisions can be influenced to a small extent, nanobubbles can reduce the rising velocity of macro bubbles on the one hand and promote the formation of larger agglomerates of ultrafine particles on the other [10]. In the first case, there are so-called free nanobubbles (or bulk nanobubbles, BNBs) at work. In the second case, nanobubbles attached to the particles (or surface nanobubbles, SNBs) play a decisive role, especially on hydrophobic surfaces [11,12,13].
The stability of the BNBs and SNBs was intensively investigated experimentally and theoretically [14,15,16,17,18,19,20]. Nevertheless, there is still no consistent theory for the stability of BNBs [21]. A variety of investigations with atomic force microscopy regarding the stability of SNBs were conducted on well-defined flat hydrophobic surfaces, e.g., [18]. For micrometer particles in suspension, Knüpfer et al. showed that NBs attached to hydrophobic alumina particles with primary particle diameters from 2 to 10 µm enhance the agglomeration by capillary bridging [22]. No such investigations on dispersed systems were found regarding even smaller and hydrophilic particles.
For nanoparticles, besides size and surface character, i.e., hydrophilic or hydrophobic, particle morphology may also affect their interaction with nanobubbles. Olszok et al. showed that NBs form on hydrophilic Pt and on hydrophobic polystyrene (PS) nanoparticles [23]. While the NBs detach from the Pt NP and become BNBs, they stay attached to the PS NP with smooth surfaces. The existence of the attached NBs was proven by a shift of the particle size distribution (PSD) of the PS NPs with nanoparticle tracking analysis (NTA). In that study, model NPs with defined properties with regard to size and morphology were used. In particular, the behavior of hydrophilic, commercial NPs, which are mostly highly aggregated clusters of primary particles, remains scarcely investigated so far. The studies documented in the literature regarding surface-attached nanobubbles on hydrophilic surfaces, such as those conducted by [18,24], primarily utilize atomic force microscopy (AFM), mostly on flat substrates. Alternatively, Pan et al. employed synchrotron-based scanning transmission X-ray microscopy (STXM) for small particles with a low specific surface area [25]. A common characteristic of all the presented methods is that the particle material is extracted from the suspension, thus undergoing offline analysis.
Therefore, this work deals with the generation of nanobubbles on commercial hydrophilic TiO2 nanoparticle aggregates, i.e., the titania nanopowder P 25 from Evonik, which is produced in megatons per year and used in a waste field of applications such as photo-catalyst and pigments [26]. A particular challenge here is to distinguish the dispersed systems of nanobubbles and nanoparticles experimentally. For this purpose, NTA, which provides a diffusion- and light-scattering-equivalent diameter as well as the zeta potential on a single particle basis, is combined with fast UV–vis extinction measurements on nanoparticle collectives. This combination of the two methods facilitates direct in situ analysis within the suspension. Furthermore, the impact of SNBs on the settling velocity of hydrophilic NPs is presented here for the first time.

2. Materials and Methods

2.1. Overall Experimental Setup

The different aspects of the study are shown schematically in Figure 1. The formation of the bubbles is performed in a gassing chamber. The bubbles form when the pressure is released either in the presence of NPs or without them. For the characterization, in situ techniques are employed on the suspensions (NTA, UV–vis extinction, analytical centrifugation) and offline methods are used on the dry powders (TEM, BET). In addition, the mechanical stability of the bubble–particle clusters was explored using ultrasonic treatment. Finally, the effects of the NBs on the flotation of NPs are considered.
To ensure optimal comparability of individual samples across all experiments, the samples were prepared from a stock suspension, created as follows: Ultrapure water (UPW) (Sartorius AG, Göttingen, Germany, arium® pro) was degassed in an ultrasonic bath (BANDELIN, Berlin, Germany, SONOREX RK512, 215 W, 35 kHz) for a duration of 20 min. The research conducted by Asakura and Yasuda [27] demonstrated that complete degassing of water occurred at a reduced amplitude within five minutes. The pH was subsequently adjusted. A specified quantity of titanium powder was added to a 500 mL volumetric flask, which was subsequently filled with degassed, pH-adjusted UPW. The suspension underwent dispersion in the same ultrasonic bath for a duration of 30 min. Prior to experimental use, the suspension was subjected to sonication for an additional 5 min and agitated vigorously.
Following exposure of the samples to gas, the determination of particle number via NTA and the execution of UV–vis measurements were completed within a few minutes.

2.2. Experimental System to Produce Nanobubbles

The NBs were generated with a self-built pressure system (Figure 2a) for approx. 50 mL of suspension. The pre-cleaned compressed air was fed into the suspension via a mass flow controller at a constant pressure (max. 2 bar) and a constant flow rate of 2 L per minute. A condensation particle counter (CPC, GRIMM Aerosol Technik Ainring GmbH & Co. KG, Ainring, Germany, model 5.403) was used to check that the air was particles-free. Once the intended pressure was reached in the gassing cell, the pressure was kept constant with a pressure relief valve at a constant gas flow rate. In each batch, 50 mL of the suspension was gassed for 10 min at 0.4 bar, 1.0 bar, and 2.0 bar overpressure. For the higher pressures, the needle valve was opened slowly (with a half-pressure time of ca. 60 s) at the end of the gassing period to avoid dynamic effects in the sample. This approach differs significantly from the method employed by Azevedo et al., in which hydrodynamic cavitation is utilized to relax pressurized water through a needle valve to create nanobubbles [28]. To analyze the gas-treated suspension, 5 mL of the sample was taken for offline measurements using NTA, UV–vis extinction, and LUMiFuge® (LUM GmbH, Berlin, Germany). A more detailed description of the system can be found in [23].

2.3. Flotation Experiments

A modified Hallimond tube (cf. Figure 2b) was used for the flotation experiments. There are two challenges in the flotation of NPs, namely, the good spatial distribution of the NPs already at the beginning of the flotation—i.e., the NPs are already in the upper part of the Hallimond tube at the beginning—and a low sedimentation velocity of the NPs, especially in the outlet provided for this purpose. Very low air volume flows were used to reduce the entrainment effect, i.e., only 65 mL/min. Entrainment is characterized by the removal of small particles from a suspension through bubble dynamics rather than direct interaction with the air–solid interface due to the hydrophobicity induced by surfactants. This effect is also known as false flotation [29].

2.4. Ultrasonic (US) Treatment

Ultrasonic treatment (US) is often used to disperse nanosuspensions by deagglomerating weakly bounded particles such as flocculates. However, here, US was employed to apply mechanical stress on the NBs attached to the NP aggregates. To avoid any issue with agglomeration, only stable suspensions were used, which were checked by measuring the size distribution and number concentration before and after being treated with gas. The applied US intensities were moderate, and the different stressing intensities were obtained by varying the US irradiation time. With this US treatment, the detachment of the NBs could, in fact, be observed and quantified with the combination of NTA and UV–vis extinction measurements.

2.5. Characterization of Nanoparticle and Nanobubble Suspensions

Transmission Electron Microscopy (TEM) and Nitrogen Adsorption (BET)
Particle morphology and specific surface area were determined with TEM (JEOL GmbH, Freising, Germany, 2100, 200 kV) and BET (Micromeritics GmbH, Unterschleißheim, Germany, Gemini). The primary particle size was obtained by the BET measurements (cf. Appendix A). This BET equivalent diameter was used to calculate the light scattering and absorption properties of the agglomerates. In addition, the fractal dimension of the agglomerates was determined by the nested circle method [30].
LUMiFuge
Settling experiments were performed with a LUMiFuge®) at a revolution rate of 1000 rpm. It is expected that particles with attached NBs will settle slower than those without NBs. A simple estimate correlates the influence of the attached air volume with the settling velocity, as shown in the following. The drag force of the aggregate is not a mere superposition of the drag force on the primary particles but scales with the number of primary particles in a power law way [31]. As will be observed below, the gas treatment changes the size of the aggregates to a minor extent, while it has a significant influence on the effective density and, therefore, on the buoyancy. Since the distribution of the gas on the aggregates is not known, two models will be considered (cf. Figure 3). In one case, it is assumed that the hydrophobic air volume originates in the necks between the primary particles and is, at least initially, growing there (neck model). Since the particle surface is hydrophilic, the necks with their negative surface curvature are physically the most likely places to host the air bubbles. On the other hand, regarding the calculation of the optical properties and the settling velocity, such a geometry is difficult to treat. Therefore, another very simple model is introduced where the air volume is evenly distributed over the aggregates, leading to a homogeneous shell of thickness h (core–shell model).
The resulting settling velocity of the aggregates in the centrifugal field of the LUMiFuge includes centrifugal forces F z , a g g , buoyancy forces F b , a g g , and drag forces F d r a g , a g g . While the mass-based forces are easily related to the primary particle level, the scaling of the drag forces is somewhat more complicated, according to Binder et al. [31]:
F z , a g g F b , a g g = N F z , p p N F b , p p
F d r a g , a g g = A a g g A p p 0.6 F d r a g , p p = 3 4 N 0.63 F d r a g , p p
where N is the number of primary particles in an aggregate, A a g g is the projection area of an aggregate (averaged over all orientations), and A p p is the projection area of a primary particle. Thus, the calculation of the aggregate settling velocity as a function of the attached air volume is reduced to the calculation on the primary particle level:
F z , p p F b , p p = V p p ρ p V p p ρ w V a i r ρ w r ω 2
F d r a g , p p = 3 π η d p p , e f f w p p
where r is the rotation radius, ω the angular velocity, w p p is the settling velocity of the primary particle, η the dynamic viscosity of water, and d p p , e f f accounts for the increased cross-section by the attachment of air. In the case of the core–shell model,
d p p , e f f = d p p + 2 h
In the case of the neck model, the additional projection area due to attached air is given by (cf. Appendix B)
A a i r = 8 3 r z = 8 3 r d p p 2 d p p 2 2 r 2 0.5
d p p , e f f = 4 π π 4 d p p 2 + A a i r 0.5
To acquire measurable sedimentation speeds, the particle settling was performed in a centrifugal field of a LUMiFuge®. In this device, the transmission profile of an IR beam along the radial direction of a cuvette is measured as a function of time.
NTA
The hydrodynamic diameter of particles and NBs was investigated using a nanoparticle tracking analyzer (ZetaView® BASIC PMX-120 Particle Metrix GmbH, Inning am Ammersee, Germany). An NTA device consists of laser-illuminating (λ = 520 nm; P = 35 mW) particles of a colloidal suspension within a flow-through measurement cell and a video camera system equipped with a microscopic lens. By detecting the Brownian diffusion of single particles in the suspension, nanoparticle-tracking-analysis determines the mean square displacement for those particles per time interval, providing the diffusion coefficient and the correlated hydrodynamic particle diameter using the Stokes–Einstein equation [23]. For all NTA measurements in this work, video camera settings like camera sensitivity (Sen) and shutter (Shu) were set to constant values: Sen = 70 and Shu = 100.
UV–vis Extinction
The spectral UV–vis extinction measurements were mainly carried out on liquid suspensions using a commercial device from Agilent (Cary 60 UV–vis Spectrometer) with standard cuvettes with an optical path length of s = 1 cm. In addition, a self-built setup consisting of a 150 W Xenon lamp (UV-C enhanced Xenon arc lamp, LSB522, Quantum Design GmbH, Pfungstadt, Germany) and a CCD spectrometer (BLUE-WAVE, StellarNet Inc., Tampa, FL, USA) was used for the aerosol extinction measurements. The transmitted light was focused with a collimator lens (StellarNet Inc., Tampa, FL, USA) onto fiber optics connected to the spectrometer (Figure 4). In order to adapt the very high power of the Xenon source to the sensitive CCD sensor of the spectrometer, the incident light was attenuated using a filter (Ø 50 mm, UV Fused Silica Metallic ND Filter, THORLABS GmbH, Bergkirchen, Germany). Due to the low concentration in the aerosol, a long optical path length of s = 43 cm had to be realized. For both setups, the wavelength-dependent ratio of the transmitted intensities with ( I ( λ ) ) and without particles ( I 0 ( λ ) ) was used to determine the extinction according to the Lambert–Beer law [32]:
E ( λ ) = ln I ( λ ) I 0 ( λ ) = c N s E x ( d p , λ , m ) π 4 d p 2
where c N is the particle number concentration and E x is the extinction coefficient.
While the TiO2-NPs could be dispersed well and stably in pure water, producing a reference aerosol was somewhat more complex. The setup is shown in Figure 4. It comprises a nebulizer (ATM 210, Topas GmbH, Dresden; Germany), a drying section consisting of a tube furnace (12/38/400, Carbolite Gero, Neuhausen, Germany), a subsequent denuder (home-built), and the actual extinction unit. To achieve reliable comparability of the particles in the online measurement (aerosol extinction) with the offline analysis (suspension extinction), some of the atomized and dried aerosol particles were collected on a heated filter (Ø 150 mm, Hahnemühle, Germany) and then measured in the Agilent UV–vis spectrometer after redispersion.
Calculation of light scattering
The interaction of the agglomerates with light is an essential issue in this study since the scattering intensity is measured with NTA, as well as the sum of absorption and scattering with UV–vis extinction. For scattering and absorption, the agglomerate behavior is considered as a superposition of the N primary particles (with radius a = d p p /2) composing the agglomerate. Since the product of wave number k ( k = 2π/λ with λ as wavelength) and primary particle radius a is much smaller than one for all wavelengths, the following equations can be applied for the absorption cross-section of the agglomerate [33]:
σ a b s , a g g = N σ a b s , p p
where the absorption cross-section of a single primary particle is given by [33]
σ a b s , p p = 4 k a 3 E ( m )
with
E ( m ) = Im m 2 1 m 2 + 2
where m is the complex refractive index.
For the scattering cross-section of the agglomerate, the following equations containing a dependence on the product of wave number k and radius of gyration R g are used [33]:
σ s c a , a g g = N 2 σ s c a , p p G ( k R g )
where the scattering cross-section of a single primary particle is given by [33]
σ s c a , p p = 8 3 k 4 a 6 F ( m )
with the function F ( m ) , the structure factor G ( k R g ) , and D as fractal dimension [33]:
F ( m ) = m 2 1 m 2 + 2 2
G ( k R g ) = 1 + 4 3 D k 2 R g 2 D 2
During the different treatment steps of the suspension, such as gas treatment, decompression, US irradiation, and characterization measurements, the agglomerate structure did not change, as confirmed with TEM microscopy (cf. Appendix A). Therefore, it is assumed that the structure factor G remains the same, and changes in the optical properties due to the attachment of NBs are reflected in the variation on the primary particle level (including changes in size and the refractive index m). In fact, as in the case of settling, the simple core–shell model is used to calculate the optical behavior; although, energetically, the air bubbles would rather be expected in the necks between the primary particles (for an estimate of the difference between the two models, see Appendix C). Due to their strong negative surface curvature, the necks are also the sites most prone to bubble nucleation.
To consider the influence of the thickness of such a gas shell on the absorption and scattering coefficient of the primary particles, an open-source Mie calculation software was employed [34]. The results for absorption, scattering, and extinction of the primary particles at wavelengths of 300 nm and 600 nm are given in Appendix C. For both wavelengths, it is found that the attachment of an air layer leads to a similar reduction in the extinction coefficient with increasing layer thickness but with a substantially lower absolute value for the longer wavelength. This is a consequence of the reduced wave number k, which scales inversely with the wavelength.

3. Results

This section will present the results in the following way: First, the amount of background bubbles and the detection of free bulk NBs (BNBs) are considered. On the one hand, this serves to establish the tools for BNB detection. On the other hand, surface nucleated and attached NBs (SNBs) may also detach from the particles, becoming free NBs. In the second part, a new method for in situ detection of NBs attached to NPs will be presented and employed to monitor the formation of SNBs on hydrophilic NP aggregates. In the third part, the mechanical stability will be investigated by applying ultrasonic (US) irradiation with various sonication times. US treatment is a common method to disperse nanopowders. However, in combination with NB, this treatment may lead to a detachment of the NBs. Therefore, the effect of US energy input on the disruption of the NP–NB complex will be explored.

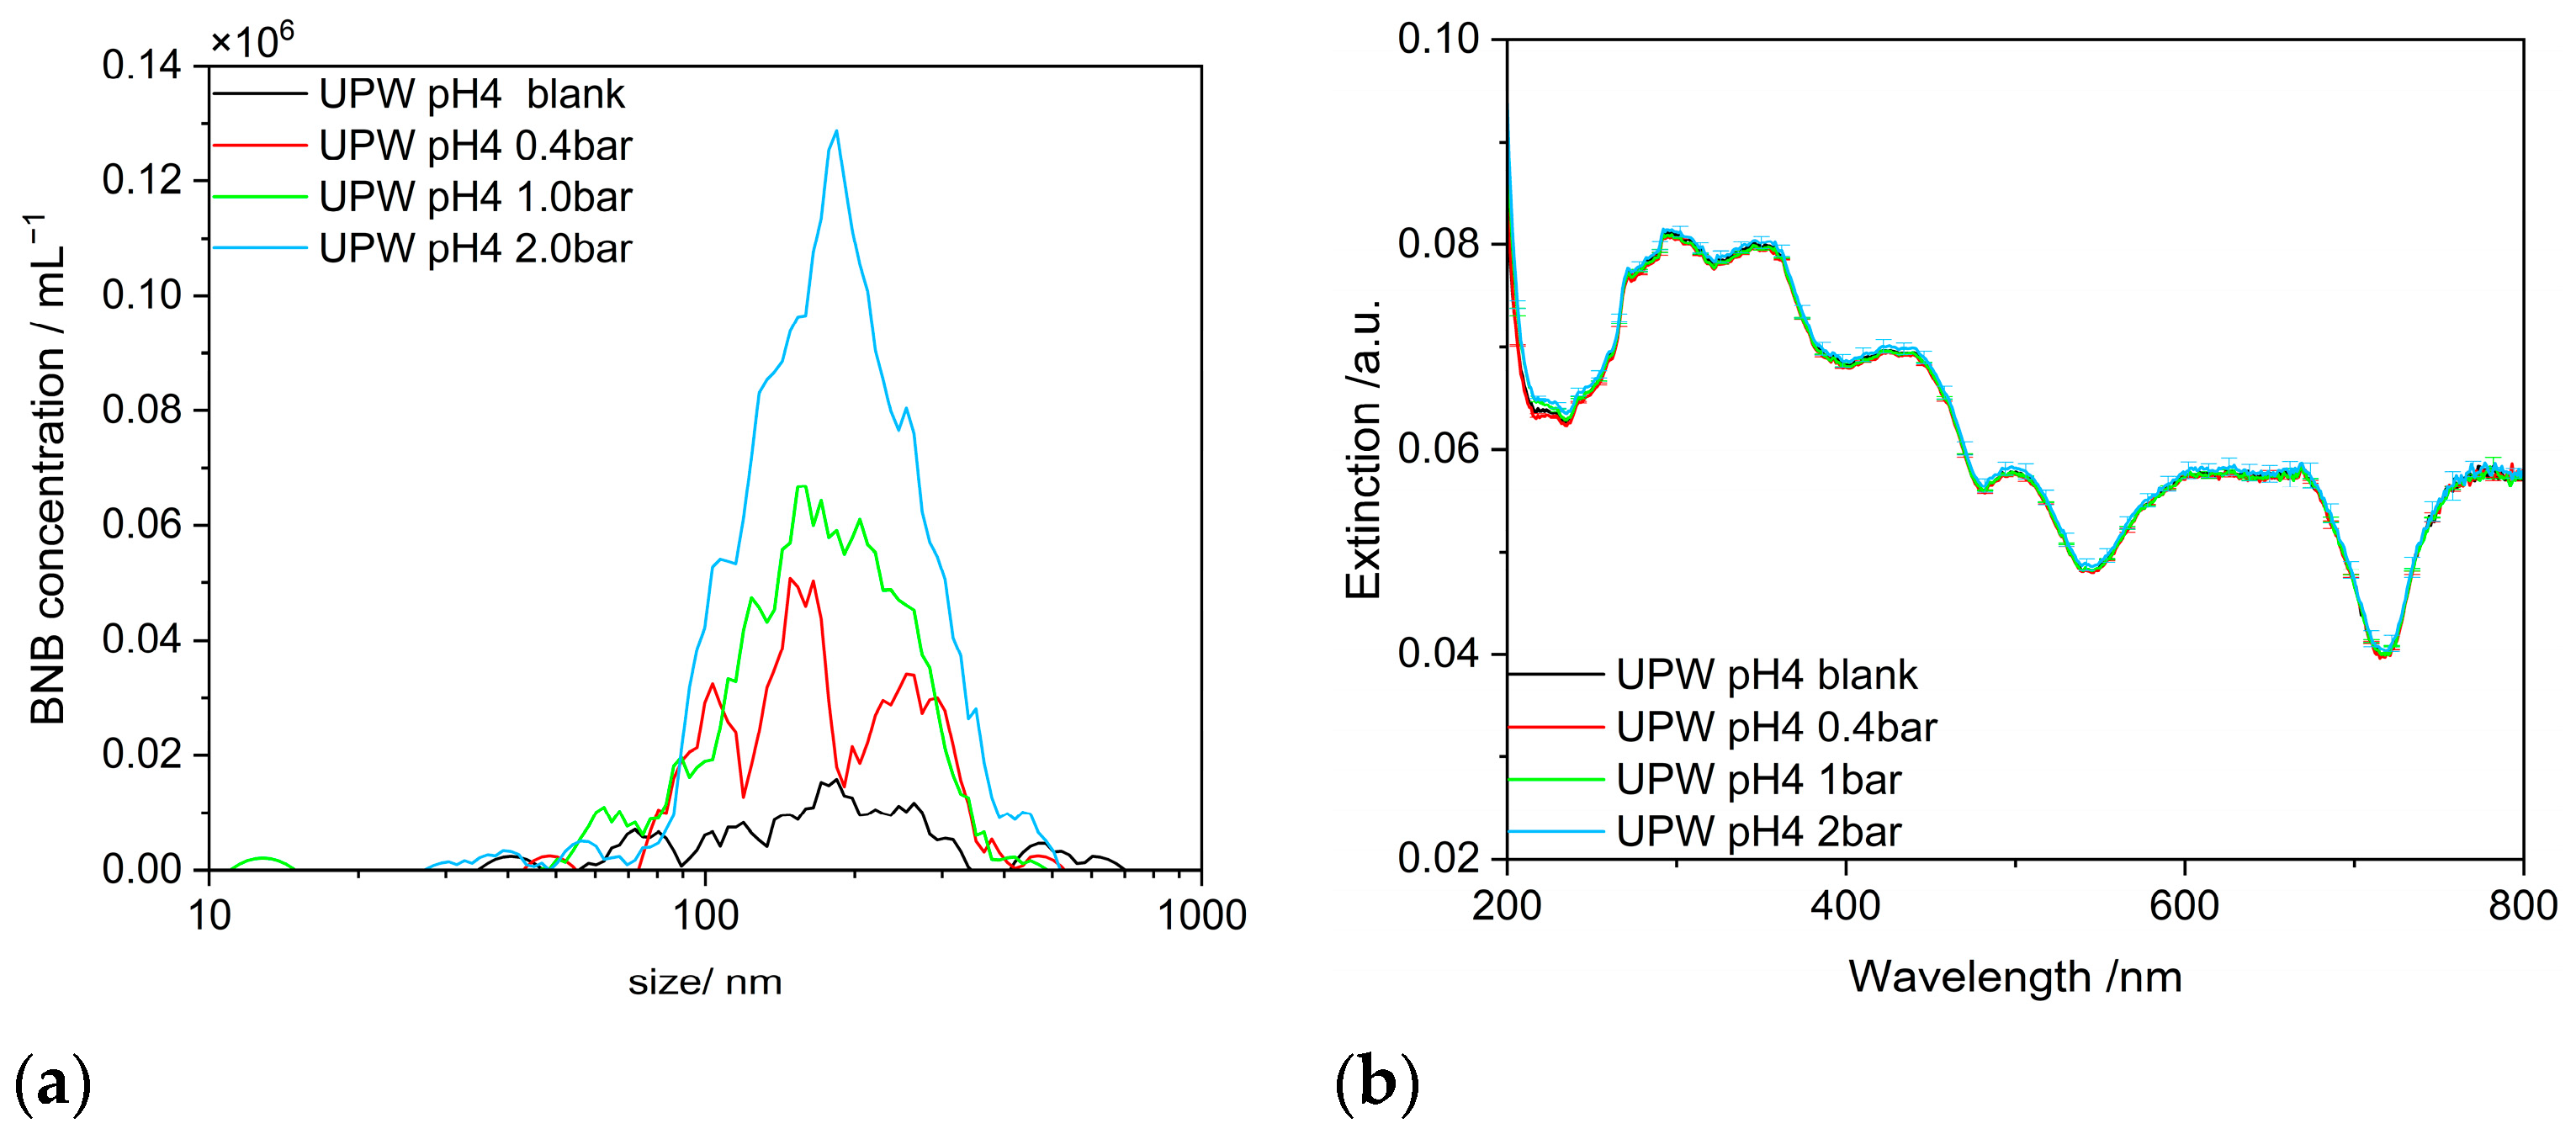
3.1. Background and Homogeneous NB Nucleation

To keep the background on NBs low, ultrapure water was used in all experiments, using UPW at room temperature and adjusted for pH value by HCl or NaOH for sample preparation and dilution.
As seen in Figure 5a, the concentration of BNBs increases significantly with gas treatment pressure, even though the size distribution remains relatively unchanged [14,15,20]. This is a common, though so far less convincingly explained feature of NBs. Two effects may coin the limited variation in the size distribution. On the one hand, once an NB has formed, the initial growth seems to be very fast, and initially, the bubbles are too small to be detected by NTA analysis. On the other hand, larger bubbles exhibit increasing buoyancy due to further growth and bubble coalescence, as well as with much larger bubbles available. Thus, the upper end of the bubble size distribution also depopulates.
In contrast to the scattering that is detected with the NTA, in the extinction spectrum, no change is observed as a function of the gas treatment pressure (Figure 5b). Even a tenfold increase in NB concentration only leads to a negligible effect in the extinction spectrum, which, in addition, is restricted to the UV range between 200 and 250 nm. Therefore, UV–vis spectrometry appears to be the method of choice to investigate attached SNBs not being superimposed by BNBs. In fact, as will be shown in the next chapter, UV–vis extinction spectrometry proves to be very sensitive to any surface changes of the NP aggregates. This surface sensitivity will be used to characterize the presence of NBs on the surface of hydrophilic NP-aggregates for the first time.

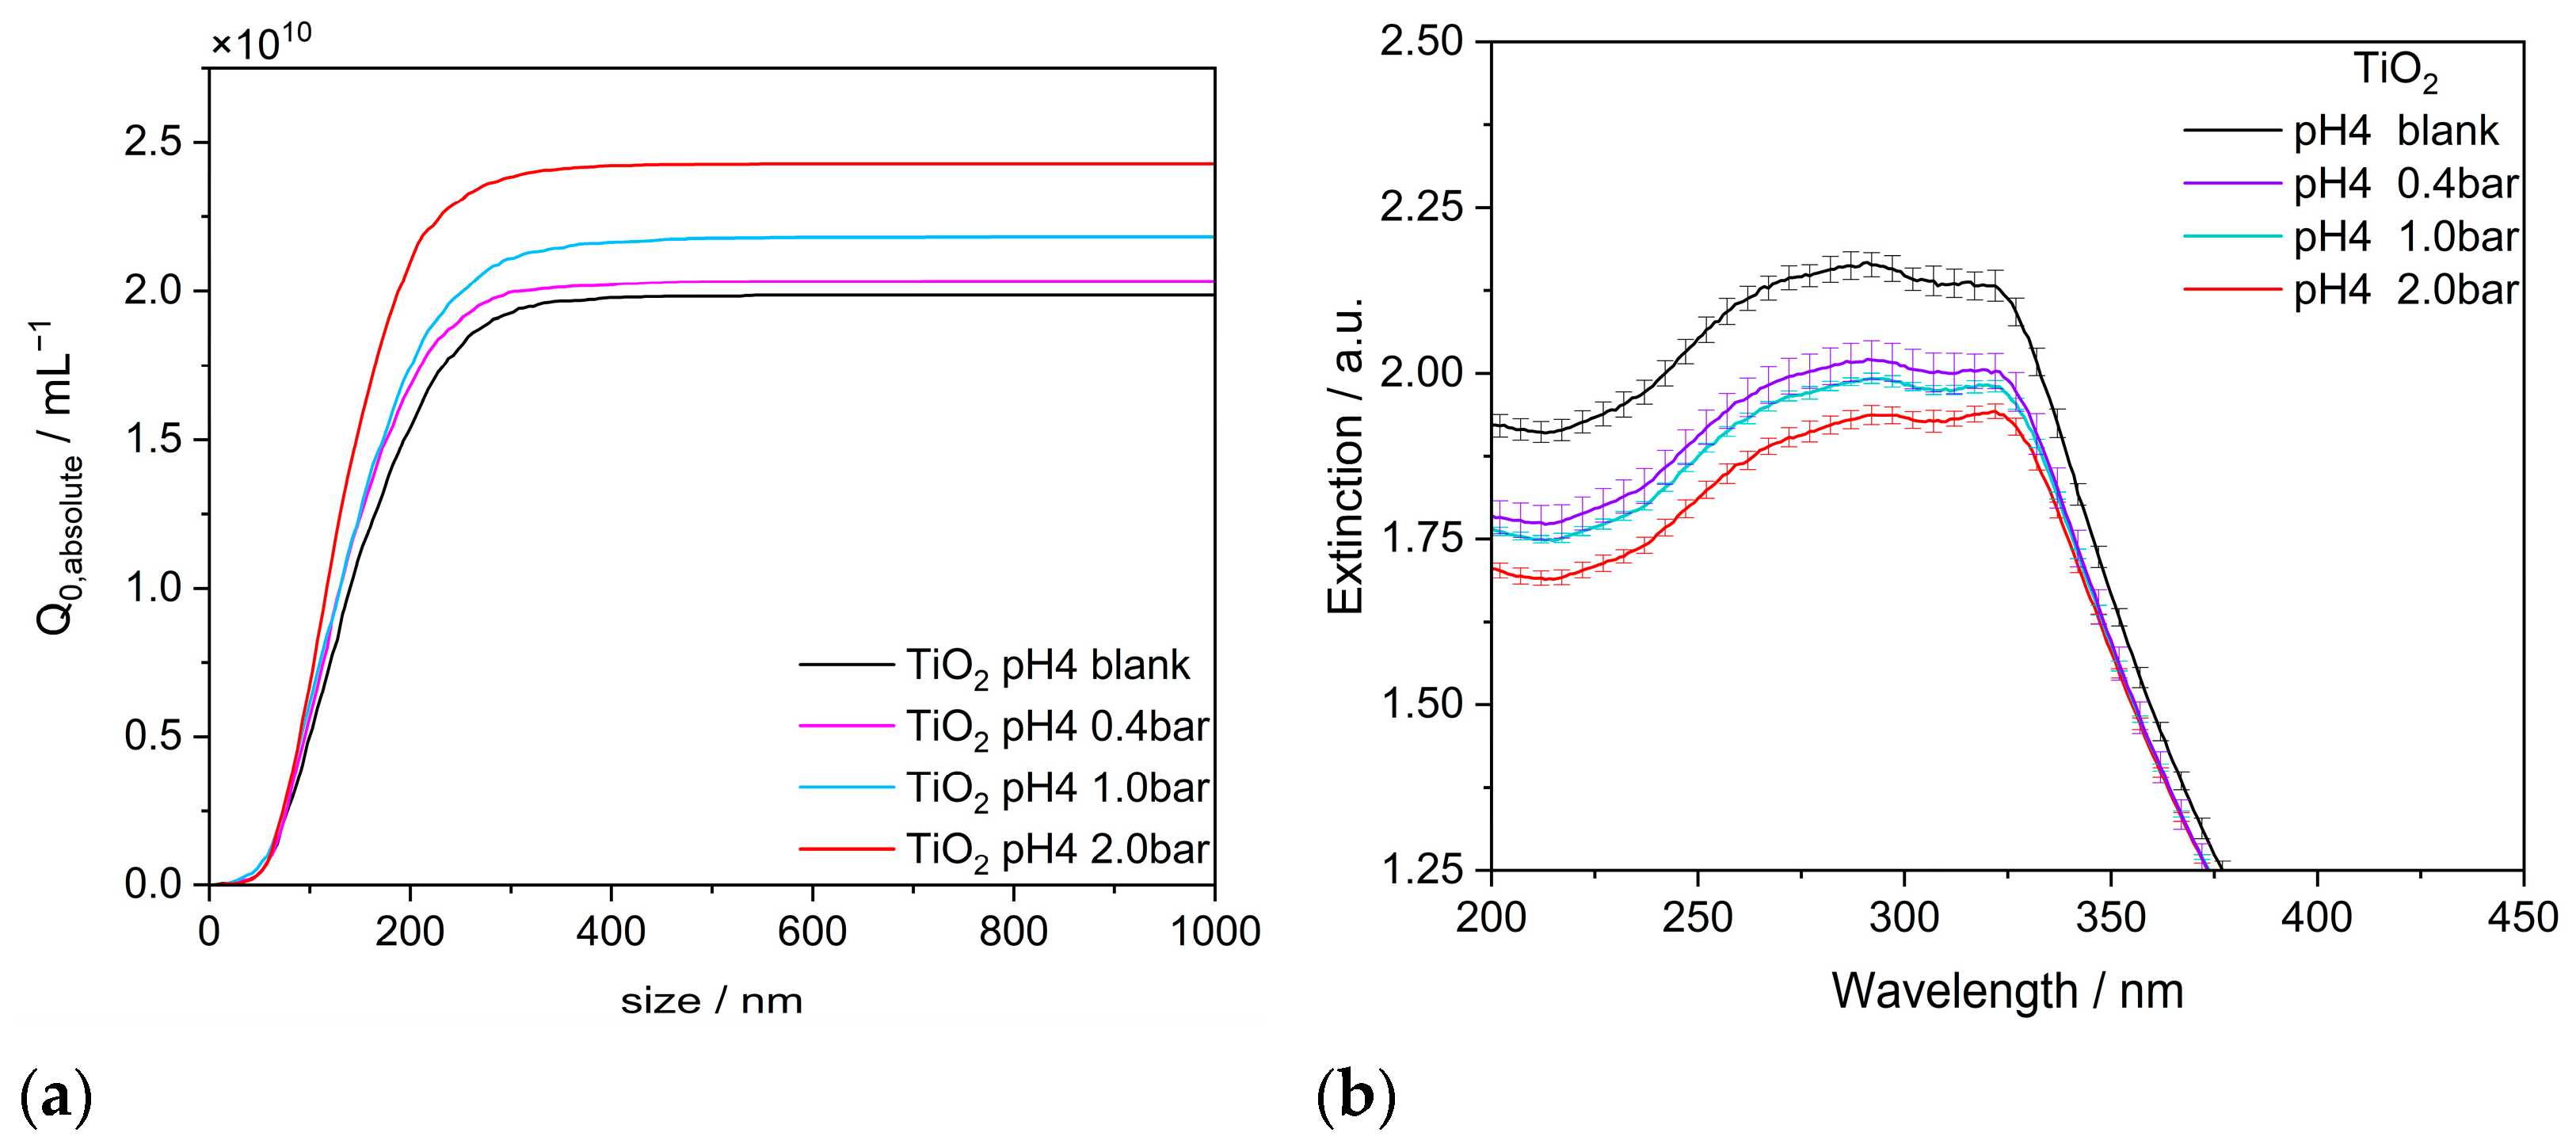
3.2. Formation of Surface Nanobubbles

In the last chapter, it was shown that the background concentration of BNBs is very low, and only the gas treatment leads to the formation of a substantial number of BNBs by homogeneous nucleation, which could only be detected with NTA but did not show any extinction signal in UV–vis measurements. Therefore, the influence of NPs on the formation of NBs needs to be investigated. In particular, it must be quantified as to which fractions of attached and free NBs are produced by NPs. As outlined above, NBs attached to nanoparticle aggregates will reduce their settling velocity. Therefore, to prove that, in fact, there are attached NBs, P 25 titania aggregates were treated with gas in pure water at a pressure of 0.4 bar for 10 min. The settling velocity of these aggregates was subsequently examined using a LUMiFuge®. As shown in Figure 6a, the settling velocity of NPs can be reduced by the attached SNB. However, there is not enough gas volume attached to reverse the settling process by buoyancy.
Figure 6b shows the results for the calculated settling velocity as a function of the attached air volume for both models (core–shell and neck models). It can be seen that the two models, although they are based on completely different geometries, lead to similar results for the same amount of gas. For fully filled necks, i.e., a “gas cylinder” with diameter dpp, the accumulated air volume corresponds to half the volume of a primary particle. The intersection curve of the neck model with the measured reduction in settling velocity after gas treatment indicates an accumulated gas volume of 46.7% per primary particle volume. In the core–shell model, this volume fraction of adsorbed gas corresponds to a layer thickness of h = 2.0 nm. Using the core–shell model in Figure 6b, a layer thickness of h = 3.6 nm is required to reproduce the measured reduction in settling velocity by 27% (cf. Figure 6a). These values approximately indicate a fully filled cavity between the primary particles, i.e., a cylindrical gas volume with the diameter of the primary particles. The exact design of the geometry of the deposited gas volumes also depends on the effective contact angles and is likely to deviate from this simple model. However, the cylinder model appears useful as a first approximation.
In principle, BNBs can also influence the settling velocity of the particles. However, these BNBs must be present in high concentrations for this to happen. It is shown below that at a gas treatment pressure of 0.4 bar in the presence of TiO2 aggregates, only a limited number of BNBs are produced (ca. 9 × 109 cm−3 corresponding to a volume fraction of about 1.3 × 10⁻⁵). Even at the highest pressure of 2.0 bar, only 1.3 × 10¹⁰ NBs per cm3 were formed. These volume concentrations are too low to influence the settling velocity [35,36] of the TiO2 aggregates. Therefore, the reduced settling velocity of the titania NPs effectively shows the effect of the attached NB.
NTA measurements and UV–vis spectrometry were performed on TiO2 suspensions after gassing at different pressures to investigate the distinction between SNBs and new BNBs formed by nucleation on existing NPs. From the results in Figure 7a, it is obvious that at low pressure (0.4 bar), only a moderate number of new bubbles are formed. Since the size distribution of the BNB overlaps with the ones of the original TiO2 aggregates, a discernible shift in the titania size distribution remains unattainable. Therefore, attached NBs are hardly investigated directly by NTA. However, as shown above, free NBs do not contribute to the UV–vis extinction spectrum, which is shown in Figure 5b. The clear decrease in absorbance in the UV range, even at a low gassing pressure of 0.4 bar, is clearly a result of the altered surface of the TiO2 aggregates (Figure 7b). With increasing gassing pressure, the reduction in absorbance continues to increase but appears to run asymptotically towards a limiting value (cf. Figure 8a). It is assumed that this limiting value corresponds to the saturation of the aggregate surface, i.e., the necks between the rather hydrophilic primary particles (wetting angle approx. 50° [37]) can adsorb a certain amount of hydrophobic air due to their negative surface curvature. If more air is available, more and larger bubbles form, breaking off and manifesting as BNBs. In principle, the free NBs, either formed on the particles or by homogeneous nucleation in the suspension (cf. Figure 5a), could attach to the aggregates. However, two arguments render such an attachment of BNBs rather unlikely. On the one hand, the corresponding volume of the individual gas-filled neck is substantially smaller than the one of typical BNBs, which exhibits a surprising constant size of about 160 nm. Without an external force enhancing bubble attachment, the hydrophobic surface of the bubble and the rather hydrophilic surface of the particles repel each other. The spots on the aggregates exhibiting negative surface curvature may support bubble formation starting from the surface but are not easily accessible for an approaching bubble. If the BNBs were to attach to aggregates, flocculation would have to be observed. In contrast, Figure 7a shows an increasing number concentration of nano-objects in the suspension. The particle concentration of the NP initial solution (50 mgL−1) is increased from 1.98 × 10¹⁰ #mL−1 to 2.03 × 10¹⁰ #mL−1 at gas treatment with 0.4 bar, corresponding to an increase of 2.5%. This shows that the BNBs are not attaching to the hydrophilic NP aggregates but, rather, may coalesce among each other.
From the increase in the number of scattered light signals in the NTA (cf. Figure 8a), a volume of BNBs was calculated and compared with the volume of SNB signals determined from the UV–vis measurement (cf. Figure 8a) using the correlation mentioned above based on Figure 9. It can be seen in Figure 8b that the increase in the volume of BNBs is proportional to the volume of SNBs. This further indicates that more/larger bubbles form from the accumulated gas volumes, which break off at a certain volume. This indicates that the NBs initially formed on the NP aggregates continued to grow after break-off, presumably due to both BNB coalescence and the adsorption of further dissolved air from the suspension liquid.
The decrease in extinction due to the accumulation of gas volumes on the aggregate surface can be understood from the core–shell model shown above using Mie calculations on the primary particle level (cf. Appendix C). The consistency of the Mie calculations is confirmed by the comparison of UV–vis absorbance measurements in the suspension and the aerosol (Figure 9). While both methods show similar results in the scattering-dominated wavelength range (350–600 nm), they differ considerably in the absorption-dominated wavelength range (200–350 nm). If the surface of the TiO2 aggregates is completely covered with water (suspension), the absorbance is higher in the 200–350 nm range. If, on the other hand, the surface is completely dry, i.e., only in contact with air, the extinction at a wavelength of 300 nm is reduced by about 15% (aerosol). Consequently, these two scenarios may be regarded as limiting cases of the accessible surface. If only parts of the surface are covered with air, an extinction value in between is obtained. If this simple approach is used for a linear interpolation (cf. Appendix C), approx. 33% of the total particle surface should be covered at a pressure of 0.4 bar and approx. 66% at a pressure of 2 bar.
The exact interpolation between extinction in the suspension and in the aerosol becomes more difficult because of the strong fluctuations in aerosol measurement. These fluctuations are partly a result of the low optical concentration of the aggregates in the gas phase. On the other hand, especially in the UV-B and UV-C regions, they also contain information about specific atomic absorptions, which are blurred in the suspension. The possibility of assigning the peaks in the aerosol extinction spectrum is interesting and should be pursued further, but it goes beyond the context of the investigation here.

3.3. Mechanical Stability of NP-SNB Clusters—The Impact of Ultrasonic Treatment

While it was shown above that gas bubbles are attached to the aggregate surfaces, it remains unclear how stable this attachment is. For hydrophobic surfaces, Brotchie and Zhang, and Knüpfer et al., state that the SNBs are so strongly fixed to the surface that US treatment has no detaching effect [22,38]. Therefore, the hydrophilic titania aggregates with attached SNBs were subjected to ultrasonic treatment for various lengths of time. The results of the US irradiation mentioned above are shown in Figure 10. With increasing irradiation time, the attached NBs are lost. However, in the first 5 s, about 90% of the attached gas volume is lost, pointing to the detachment of larger quantities at the first stressing phase. Later, some additional gas volume is detached; however, this is in much smaller quantities. This may indicate that the air of gas-filled necks is released at a longer irradiation time. After only 20 s, there is no longer a discernable difference between non-gas-treated NPs and US-treated gasified NPs. This indicates that SNBs on hydrophilic particle surfaces are only weakly bonded.

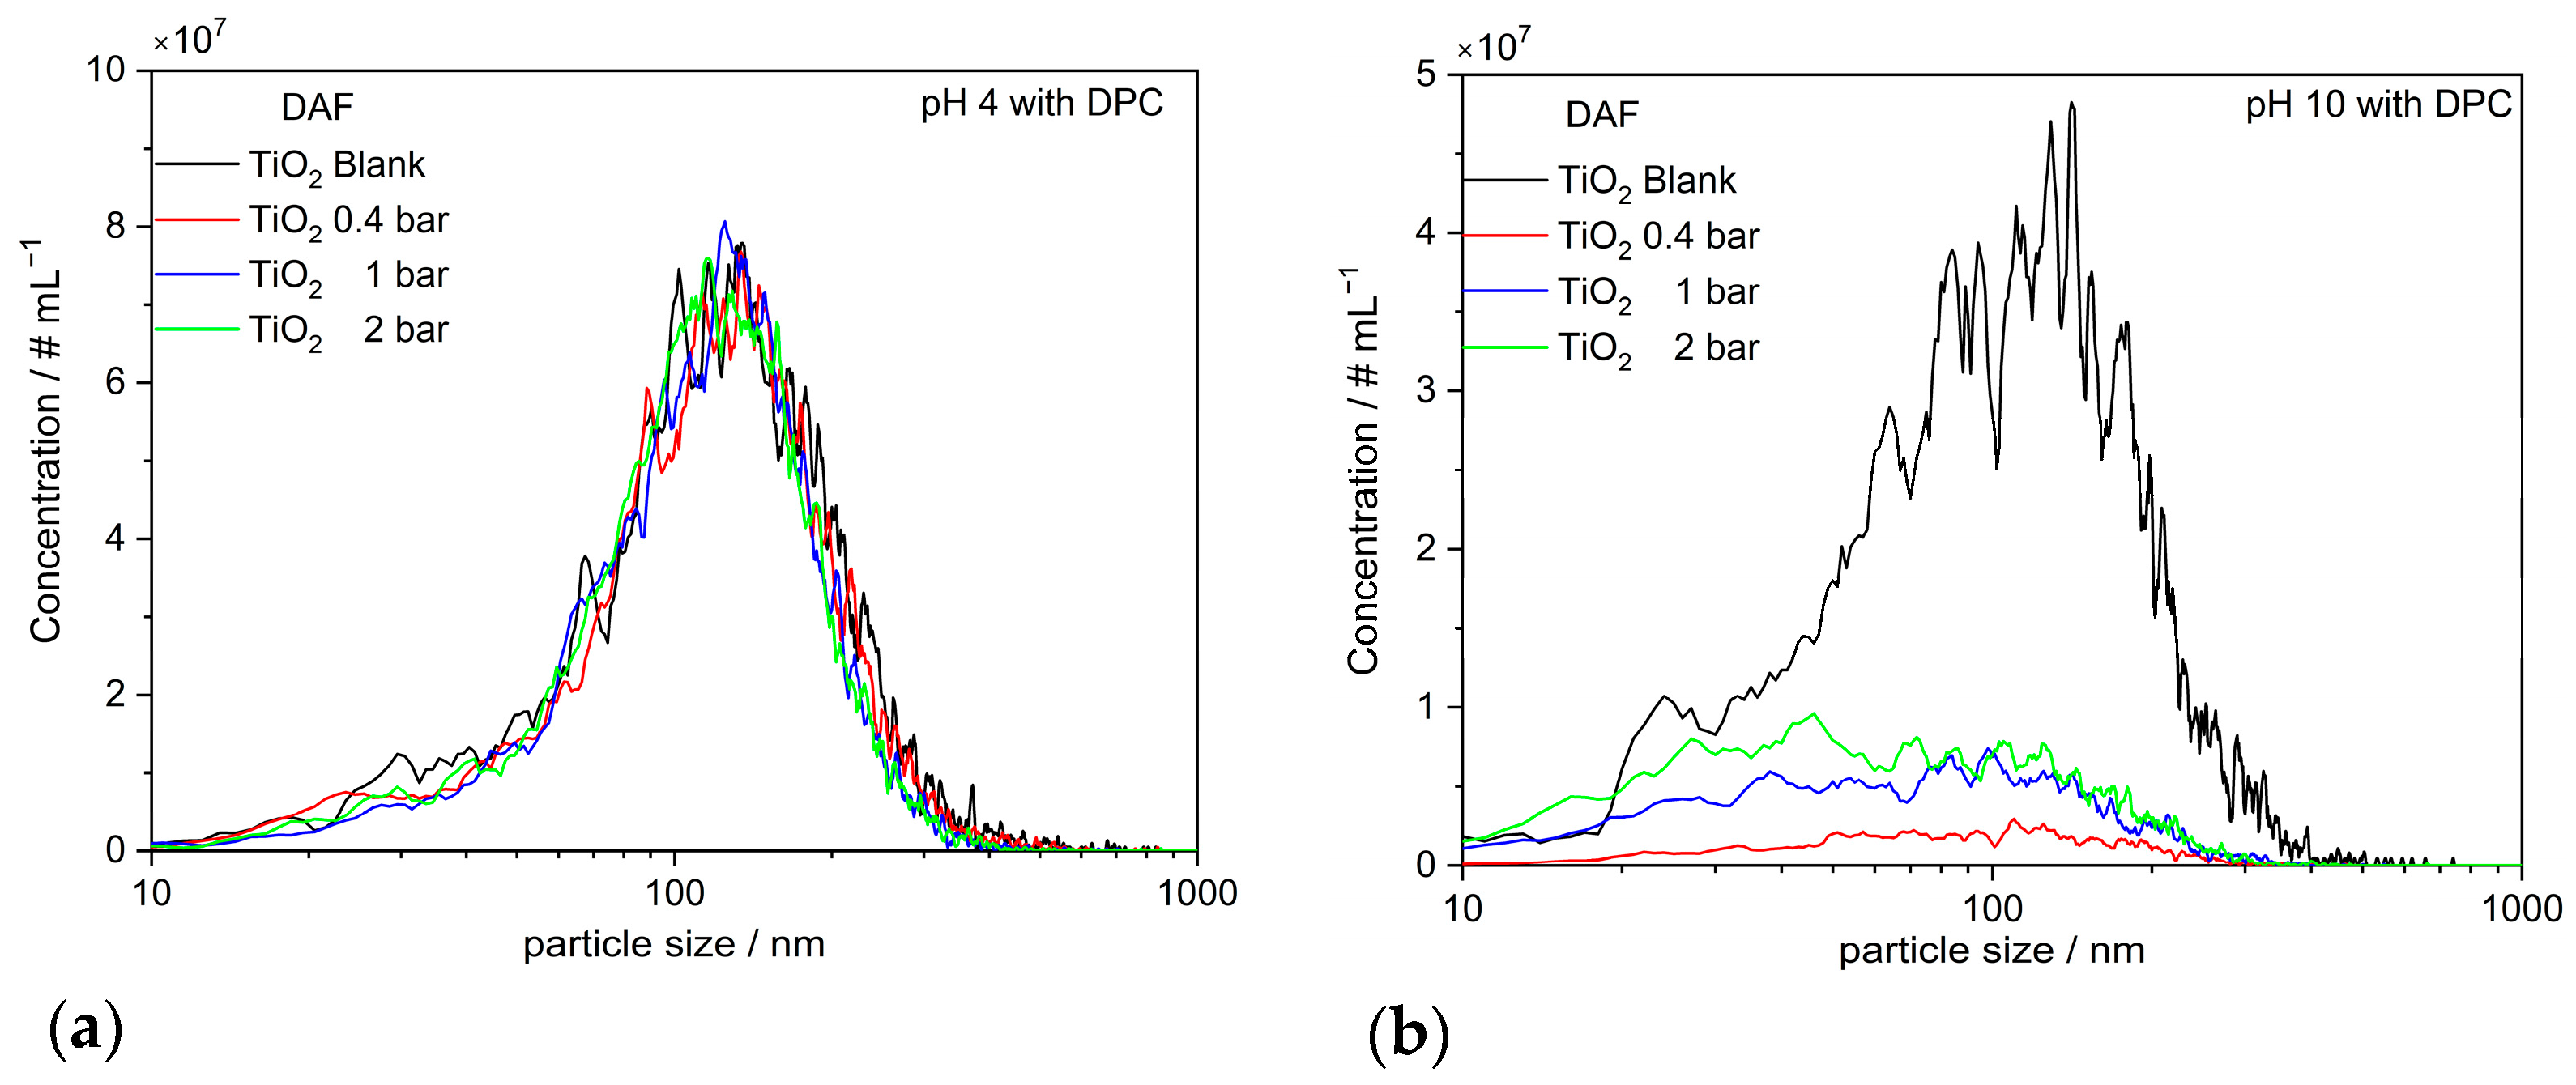
3.4. Flotation Efficiency of Nanoparticles

Finally, it was investigated if the attached SNBs, in combination with microbubbles, could lead to a successful flotation of the targeted NPs [39,40]. The experiments were carried out in the DAF (cf. Figure 2a) and using the Hallimond tube (cf. Figure 2b) at a minimal gas flow rate (65 mLmin−1). The tests in the DAF were conducted at low NP concentrations of 0.67 mgL−1 and a collector concentration (Dodecyl Pyridinium Chloride—DPC) of 66.7 µML−1. In the Hallimond tube, the nanoparticle concentration was 0.5 gL−1 with a collector concentration of 50 µML−1 while consistently trying to prevent entrainment.
Figure 11a,b present the results for TiO2 NP aggregates in the presence of DPC at varying gas treatment pressures for pH 4 and 10. Optimal flotation performance is attained at pH 10, while at pH 4, the flotation effect is marginal.
The zeta potential curve at pH 4 (cf. Figure 12a, right y-axis) indicates that the TiO2 surface exhibits a positive charge. Electrostatic interactions are predominant with oxidic materials [41,42], resulting in minimal or negligible adsorption of DPC due to the similar charges involved. Despite an increase in DPC concentration, the zeta potential at pH 4 remains largely unchanged, as demonstrated in Appendix D. Following gas treatment at 1 bar, the total particle number concentration at pH 4 shows a slight reduction of 15% (cf. Figure 12a left y-axis). Unlike the experiment without a collector (cf. Figure 7a), where the overall concentration markedly increases post-gassing, the observed drop in concentration indicates bubble-induced flocculation. TiO2 exhibits a positive zeta potential at pH 4; however, some particles or surface regions possess a negative surface charge, allowing the attachment of DPC molecules and resulting in hydrophobic characteristics. Schubert [11] indicates that the presence of SNBs enhances attractive capillary forces, potentially resulting in hetero-coagulation, defined as the adhesion of hydrophobic particles to a microbubble. Hydrophobic forces are characterized by their long-range attractive attributes [12,13], which may also promote particle aggregation. A similar behavior is noted at a pH of 5.4.
At a pH of 6, the net charge of TiO2 approaches neutrality, as it is near the isoelectric point (IEP) of pH 6.3, resulting in a 68% reduction in particle number concentration after gassing. The electrostatic repulsion is minimized at the IEP, resulting in the destabilization of the suspension and, subsequently, flocculation. The increase in negatively charged regions, where DPC molecules attach, leads to greater hydrophobicity of the particles, thereby enhancing NB-induced effects.
As the pH values shift into the alkaline range, the surface charge of TiO2 becomes primarily negative, resulting in the binding of the cationic collector. Prior to the initiation of gassing, the number concentration of the blank value at pH 10 (6.6 × 10⁹ #mL−1) exhibited a reduction by a factor of 1.82 in comparison to the blank value at pH 4 (1.2 × 10¹⁰ #mL−1) (cf. Figure 11a,b). After gassing, 80% to 90% of the particles are floated due to their strong hydrophobic properties. Figure 12a clearly illustrates that when gas treatment pressure rises, the quantity of particles retained in the suspension increases in comparison to those treated with gas at an overpressure (0.4 bar). For clarification, additional ICP-OES measurements were performed. The results are summarized in Table 1.
For the ICP measurements, the residue suspensions were processed as a liquid sample and examined directly for titanium concentration without additional chemical digestion. Despite the differing measured variables—mass concentration (ICP) and number concentration (NTA)—the normalized flotation efficiencies were 93% and 94%, respectively, at 0.4 bar. At 1 bar, flotation efficiency decreases to 86% for ICP measurement and 81% for the NTA analysis, and it further decreases at 2 bar.
When compared to the results obtained using inductively coupled plasma mass spectrometry (ICP), the flotation efficiency that was determined through nanoparticle tracking analysis (NTA) is found to be lower at both 1 and 2 bar (cf. Table 1 and Appendix E). This disparity arises because the NTA cannot manage to distinguish between solid particles and BNBs, leading to an overestimation of the number of titania particles. The observed reduction in flotation efficiency as pressure rises may be attributed to the complex interaction of multiple factors. It might be hypothesized that aggregates of flocculated particles, bound by weak intermolecular forces, may disintegrate with a reduction in pressure, potentially resulting in the resuspension of these particles. Moreover, the role of the cationic surfactant and its interplay with the BNBs is unclear. At a pH of 10, bubbles have a markedly negative zeta potential, as evidenced by our results (cf. Appendix F) and the studies conducted by Takahashi [43] and Meegoda et al. [17]. This may lead to the diminished availability of the surfactant for the hydrophobization of the particles. Alternatively, other aspects may be evaluated that affect behavior under increased pressure, such as the competition between surfactants and SNBs for available surface sites or a decrease in pH value resulting from gas introduction. This would reduce the surface charge of the particles, perhaps resulting in decreased adsorption or desorption of the surfactant. Both factors indicate that the interactions of surfactants with oxide particle surfaces are mostly dictated by electrostatic forces rather than strong chemical bonds. Due to the complexity of these effects, these phenomena cannot be elucidated here.
To examine the behavior of TiO2 NPs in a froth flotation process, Hallimond tube experiments were conducted with varying flotation times at pH 4 and 10. The results are shown in Figure 12b. As flotation time increases at a pH of 10, the yield rises from 15% to 94%. Unlike the DAF, which assesses particle number concentration, the particle mass is determined here. The cationic collector attaches to the NP surface at a pH of 10, resulting in hydrophobization and supporting successful flotation. It is established that nanoparticles experience significant entrainment; despite their non-hydrophobic nature, the foam can encapsulate a substantial quantity of NPs, subsequently transporting them to the flotation outlet. Therefore, tests were carried out with a pH of 4 and the cationic collector DPC. In every experiment, the mass of the floating particles is measured. Based on these data, a 99% confidence interval is calculated, and the corresponding standard deviation is 5.5%. The yield achieved after 2 min of flotation time at pH 10 exceeds the specified value for entrainment, even when applying a double standard deviation of 11%. This indicates that the BNBs also promote the interaction between the NPs and the ascending microbubbles in froth flotation.

4. Discussion and Possible Fields of Application

The presented results demonstrate that hydrophilic nanoparticles with structured surfaces generate nanobubbles through gassing, with bubble formation primarily occurring in the concave regions of these surfaces where gas can accumulate [44,45]. In contrast to hydrophobic surfaces, which exhibit strong bubble adhesion, hydrophilic materials tend to have either very few or no bubbles remaining on their surfaces, as evidenced by Ditscherlein et al. in their studies of nanobubbles on planar surfaces using AFM measurements [18]. The forces at the three-phase contact on hydrophilic surfaces—such as van der Waals forces, hydrogen bonds, and electrostatic interactions—are critical for bubble formation and detachment. Specifically, strong hydrogen bonds between the liquid phase and the hydrophilic surface significantly influence the stability of the formed bubbles as well as the generation of bubble caps, as determined by molecular dynamics simulations conducted by Maheshwari et al. [19].
Furthermore, there is an indication that reduced surface roughness correlates with smaller bubble sizes, which complicates the direct detection of surface nanobubbles (SNBs) on hydrophilic surfaces. In the context of bulk nanobubble (BNB) systems, enhanced techniques such as nanoparticle tracking analysis (NTA) have enabled various research groups to detect BNBs in liquids and investigate their stability successfully. However, research is still lacking regarding the correlation of BNB concentration in the presence of hydrophilic particles with highly structured surfaces.
In flotation processes, the nanobubbles generated on hydrophilic submicron- and nanoparticles offer promising approaches to improve the flotation efficiency of target materials, e.g., as demonstrated in studies involving specific minerals such as [24,46,47]. However, the high stability of the bubbles on hydrophilic surfaces may lead to unwanted gangue material adhering to macrobubbles due to increased adhesion forces, thereby reducing the selectivity of the flotation process. Consequently, it is crucial that the formed bubbles are detached from the surface early to ensure optimal separation of the desired materials.
Additionally, electrolysis processes are also significantly impacted by gas formation and release. At the electrodes where hydrogen and oxygen are produced, the coverage of gas bubbles can decrease the efficiency due to overpotentials. Recognizing the importance of surface texture, recent advancements have focused on structuring electrodes using laser technology to achieve higher gas yields at lower overpotentials [48]. In this context, the influence of surface roughness on the first phase of bubble formation and the strength of bubble adhesion has been little studied. Therefore, the presented method could provide insights into the first growth phase of bubble formation by mimicking the surface roughness of electrolysis electrodes. Future research in this area could not only improve the efficiency of existing electrolytic processes but also open new application fields where controlling gas formation and release is essential. A deeper understanding of the hydrodynamic influences on bubble detachment is also necessary to facilitate targeted enhancements in the efficiency and selectivity of flotation and electrochemical processes.

5. Conclusions

In this study, the influence of free and attached NBs on the properties of hydrophilic, aggregated NPs was investigated. This required the analytical tools to distinguish between the two NB phases, which was realized by combining light scattering and extinction measurements.
While BNBs do not contribute much to absorption, they scatter a detectable amount of light. On the contrary, the SNBs have a minor effect on the light scattering but modify the refractive index of the host particles, resulting in a reduced extinction, which is especially observable in the wavelength range around 300 nm.
With these techniques, it was possible to show that even rather hydrophilic particles can produce substantial amounts of NBs, most likely due to nucleation of the dissolved gas (bubbles) on the negatively curved surface sites of the ramified aggregates (“concave areas”). However, rather moderate mechanical stressing by US treatment is sufficient to detach these SNBs from the host particles.
Regarding the influence of the SNBs on the flotation behavior of the NP aggregates, the attached gas volume leads to decreased settling velocities, which, however, cannot be reversed by bubble formation alone.
Therefore, flotation was improved by using small bubbles generated in a Hallimond tube at a moderate flotation regime, i.e., only low gas flow rates were used to avoid entrainment. The combination of hydrophobization, SNBs, and rising bubbles in the Hallimond tube enables, in fact, the direct flotation of NPs. In addition, the negative surface curvature can be used to generate SNBs, which is a prerequisite for this flotation method. Nevertheless, hydrophobization is necessary for the successful flotation of NPs.

Author Contributions

Conceptualization, A.W. and A.P.W.; methodology, A.W. and V.O.; software, A.W.; validation, A.W. and B.B.; formal analysis, A.W.; investigation, A.W.; resources, A.W. and B.B.; data curation, A.W.; writing—original draft preparation, A.W. and A.P.W.; writing—review and editing, A.P.W., A.W. and B.B.; visualization, A.W.; supervision, A.P.W.; project administration, B.B. and A.P.W.; funding acquisition, A.P.W. All authors have read and agreed to the published version of the manuscript.

Funding

This research was funded by the German Research Foundation (DFG) (grant number: WE 2331/21-2) within the Priority Program 2045. The publishing fee of the article was funded by the Open-Access Publishing Fund of Clausthal University of Technology.

Institutional Review Board Statement

Not applicable.

Informed Consent Statement

Not applicable.

Data Availability Statement

The data are available upon reasonable request from the corresponding author.

Acknowledgments

We express our gratitude to Peggy Knospe for particle analysis with TEM and BET. Additionally, we would like to extend our gratitude to Juliana Rivas-Botero for her efforts in conducting the centrifuge experiments and initiating the DAF trials with DPC. Furthermore, we would like to thank Timm Willhardt for his bachelor thesis, which involved an in-depth analysis of BNBs, including the detection of ZP at various pH values. We acknowledge financial support by Open Access Publishing Fund of Clausthal University of Technology.

Conflicts of Interest

The authors declare no conflicts of interest. The funders had no role in the design of the study; in the collection, analyses, or interpretation of the data; in the writing of the manuscript; or in the decision to publish the results.

Symbols and Abbreviations

Symbols used in the manuscript
A a g g projection area of an aggregate (averaged over all orientations)m2
A a i r cross-section of a primary particle with attached airm2
A p p projection area of primary particles m2
a , a radius of primary particlesm
c N particle number concentrationm−3
cvvolume concentrationm3 m−3
cv_BNBvolume concentration of bulk nanobubblesm3 m−3
cv_SNBvolume concentration of surface nanobubblesm3 m−3
D fractal dimension-
d p particle diameterm
d p p primary particle diameterm
d p p , e f f hydrodynamic equivalent diameter through the attached airm
E extinction-
E ( m ) factor-
E x extinction coefficient -
F b , a g g buoyancy force of an aggregateN
F d r a g , a g g drag force of an aggregateN
F z , a g g centrifugal force of an aggregateN
F b , p p buoyancy force of a primary particleN
F d r a g , p p drag force of a primary particleN
F z , p p centrifugal force of a primary particleN
F ( m ) factor-
G structure factor-
h ,h thickness of the air-shell m
I intensity of the transmitted lightWm−2
I 0 intensity of the incident lightWm−2
k wave numberm−1
m complex refractive index of solids relative to that of the surrounding medium-
N number of (primary) particles-
Q0cumulative number distribution (here: not normalized)m−3
Qabsefficiency factor for absorption -
Qextefficiency factor for extinction -
Qscaefficiency factor for scattering -
R g radius of gyrationm
r radius of a cylindrical gas volumem
s optical path length through the cuvettem
V a i r attached air volume on an aggregatem3
V p p volume of the primary particlem3
wsettl,effsettling velocity of an aggregate with attached airm s−1
wsettl,0settling velocity of an aggregate without attached airm s−1
w p p settling velocity of primary particlem s−1
z ,z half-length of a cylindrical gas volumem
αabsorption coefficient-
η dynamic viscosity of the mediumPas
ρ p particle densitykg m−3
ρ w medium densitykg m−3
σ a b s , a g g absorption cross-section of aggregatesm2
σ a b s , p p absorption cross-section of primary particlem2
σ s c a , a g g scattering cross-section of aggregatesm2
σ s c a , p p scattering cross-section of primary particlem2
ω angular velocityrad s−1
BNBbulk nanobubbles (free nanobubbles in the surrounding liquid)
BETspecific surface area (Brunauer–Emmett–Teller)
CCDcharged coupled device
cmccritical micelle concentration [molL−1]
CPCcondensation particle counter (manufacturer: Grimm Aerosol Technik)
DAFdissolved air flotation
DPCdodecyl-pyridinium-chloride
HClhydrochloric acid
ICP-OESinductively coupled plasma optical emission spectrometry
LumiFuge®analytical centrifuge (manufacturer: LUM GmbH)
NaOHsodium hydroxide
NBnanobubble
NPnanoparticle
NTAnanoparticle tracking analysis (manufacturer: Particle Metrix)
P 25titania nanopowder (manufacturer: Evonik)
PSpolystyrene
SNBsurface nanobubbles attached to a particle’s surface
STXMsynchrotron-based scanning transmission X-ray microscopy
TEMtransmission electron microscopy
USultrasonic
UV–visultraviolet–visible spectrophotometry
ZPzeta potential

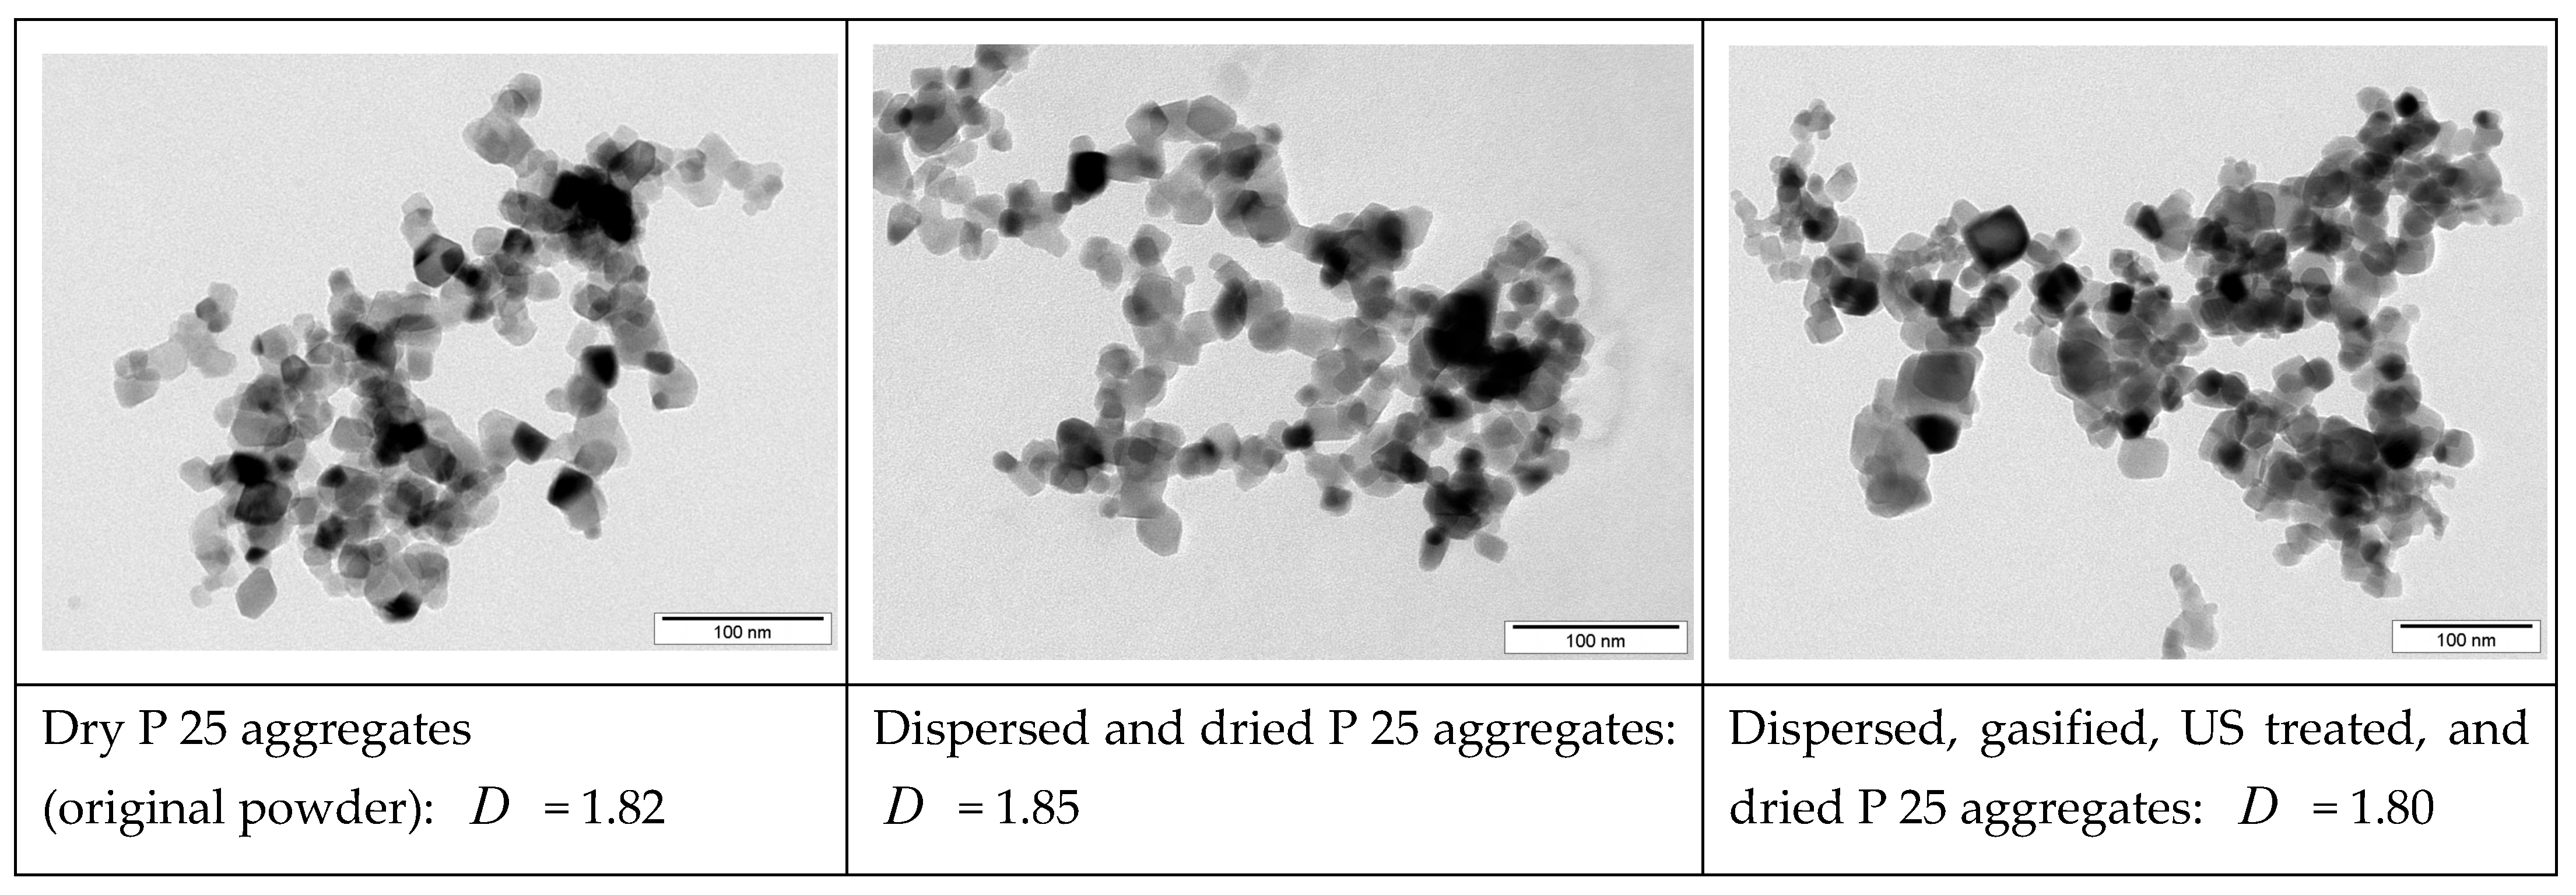
Appendix A. Morphology of TiO2 Nanoparticle Aggregates

The TEM micrographs shown in the following reflect different histories of the titania NP aggregates, including the dry initial state, dispersed in water using mild ultrasound (US) and after gasification and extended US. BET measurements of the specific surface area gave a value of Sm = 50 + 2 m2g−1 for all three powders. Therefore, it can be concluded that the primary particle size distribution did not change. From the BET results, an average primary particle diameter of dpp = 27.3 nm was deduced. To check whether the treatments changed the structure of the aggregates, TEM images, as shown in Figure A1, were analyzed with regard to the fractal dimension D. The “nested circles” method was used for this purpose. Referring to the obtained values for fractal dimension, it can be concluded that the aggregate morphology did not change under the actions of wet dispersion (using gentle US), gasification, intense US treatment, and subsequent drying. Therefore, the structure factor G ( k R g ) (cf. Equation (15)) employed in the calculation of the light scattering and absorption cross-sections is considered constant, and the changes observed in optical behavior and settling velocity can be attributed to the attachment of air bubbles only.
Figure A1. Morphology of TiO2 nanoparticle aggregates imaged with TEM: (left) original, dry powder; (middle) after dispersing in pure water (including mild US treatment) and drying; (right) after additional gasification and intense US treatment.
Powders 04 00007 g0a1

Appendix B. Settling Velocity of Gas-Treated Agglomerates

The expected geometry (cf. Figure A2, green line) was approximated by a simplified cylinder geometry (cf. Figure A2, gray area) to consider the attached air volume in the particle settling velocity. Then, the air volume can be calculated from the cylinder volume minus two spherical caps (radius r and height z ) as
V a i r = 2 3 z 2 ( 3 a 2 z )
where radius and height are correlated via
r = a 2 a z 2 0.5
Similarly, the projection surface of the attached air volume, which contributes to the friction during sedimentation, can be written as
A a i r = 8 3 r a a 2 r 2 0.5
Finally, a hydrodynamic equivalent diameter d p p , e f f is calculated from the projection surface of a primary particle and the friction surface on both sides (twice half of the gray area) caused by the attached air volume:
d p p , e f f = 4 π π 4 d p p 2 + A a i r 0.5
Figure A2. Schematic diagram of an attached air bubble between two primary particles (each with radius a): while the green contour line indicates a more realistic geometry for the wetting of the hydrophilic particle surface with the hydrophobic air (contact angle > 90°, through the air), the calculations were performed assuming a cylindrical geometry (gray area) with a radius r and a length of 2z.
Powders 04 00007 g0a2

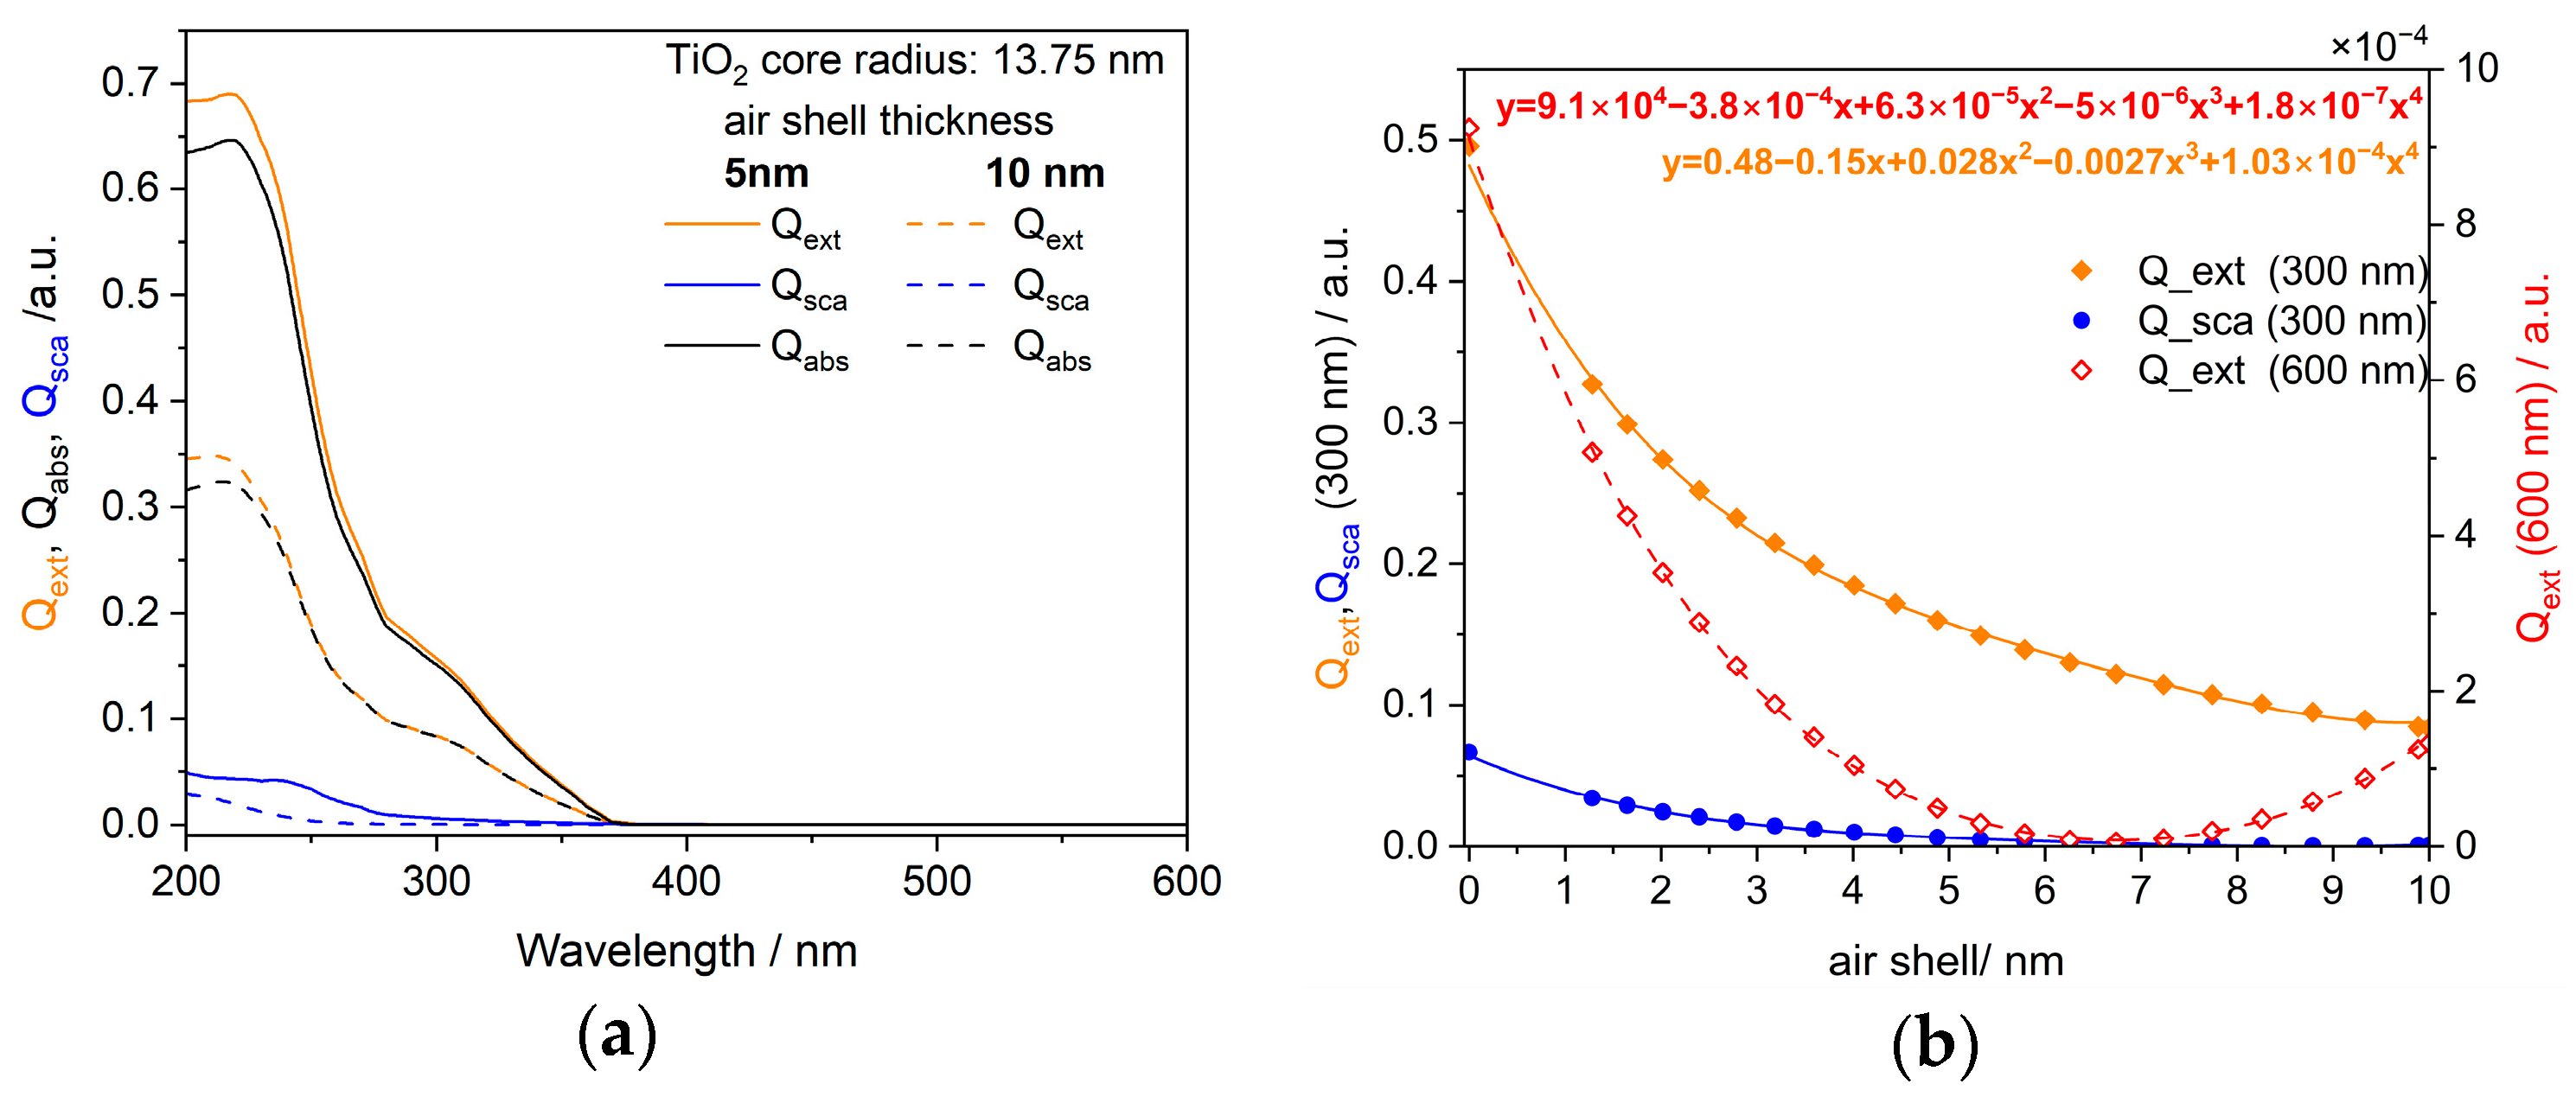
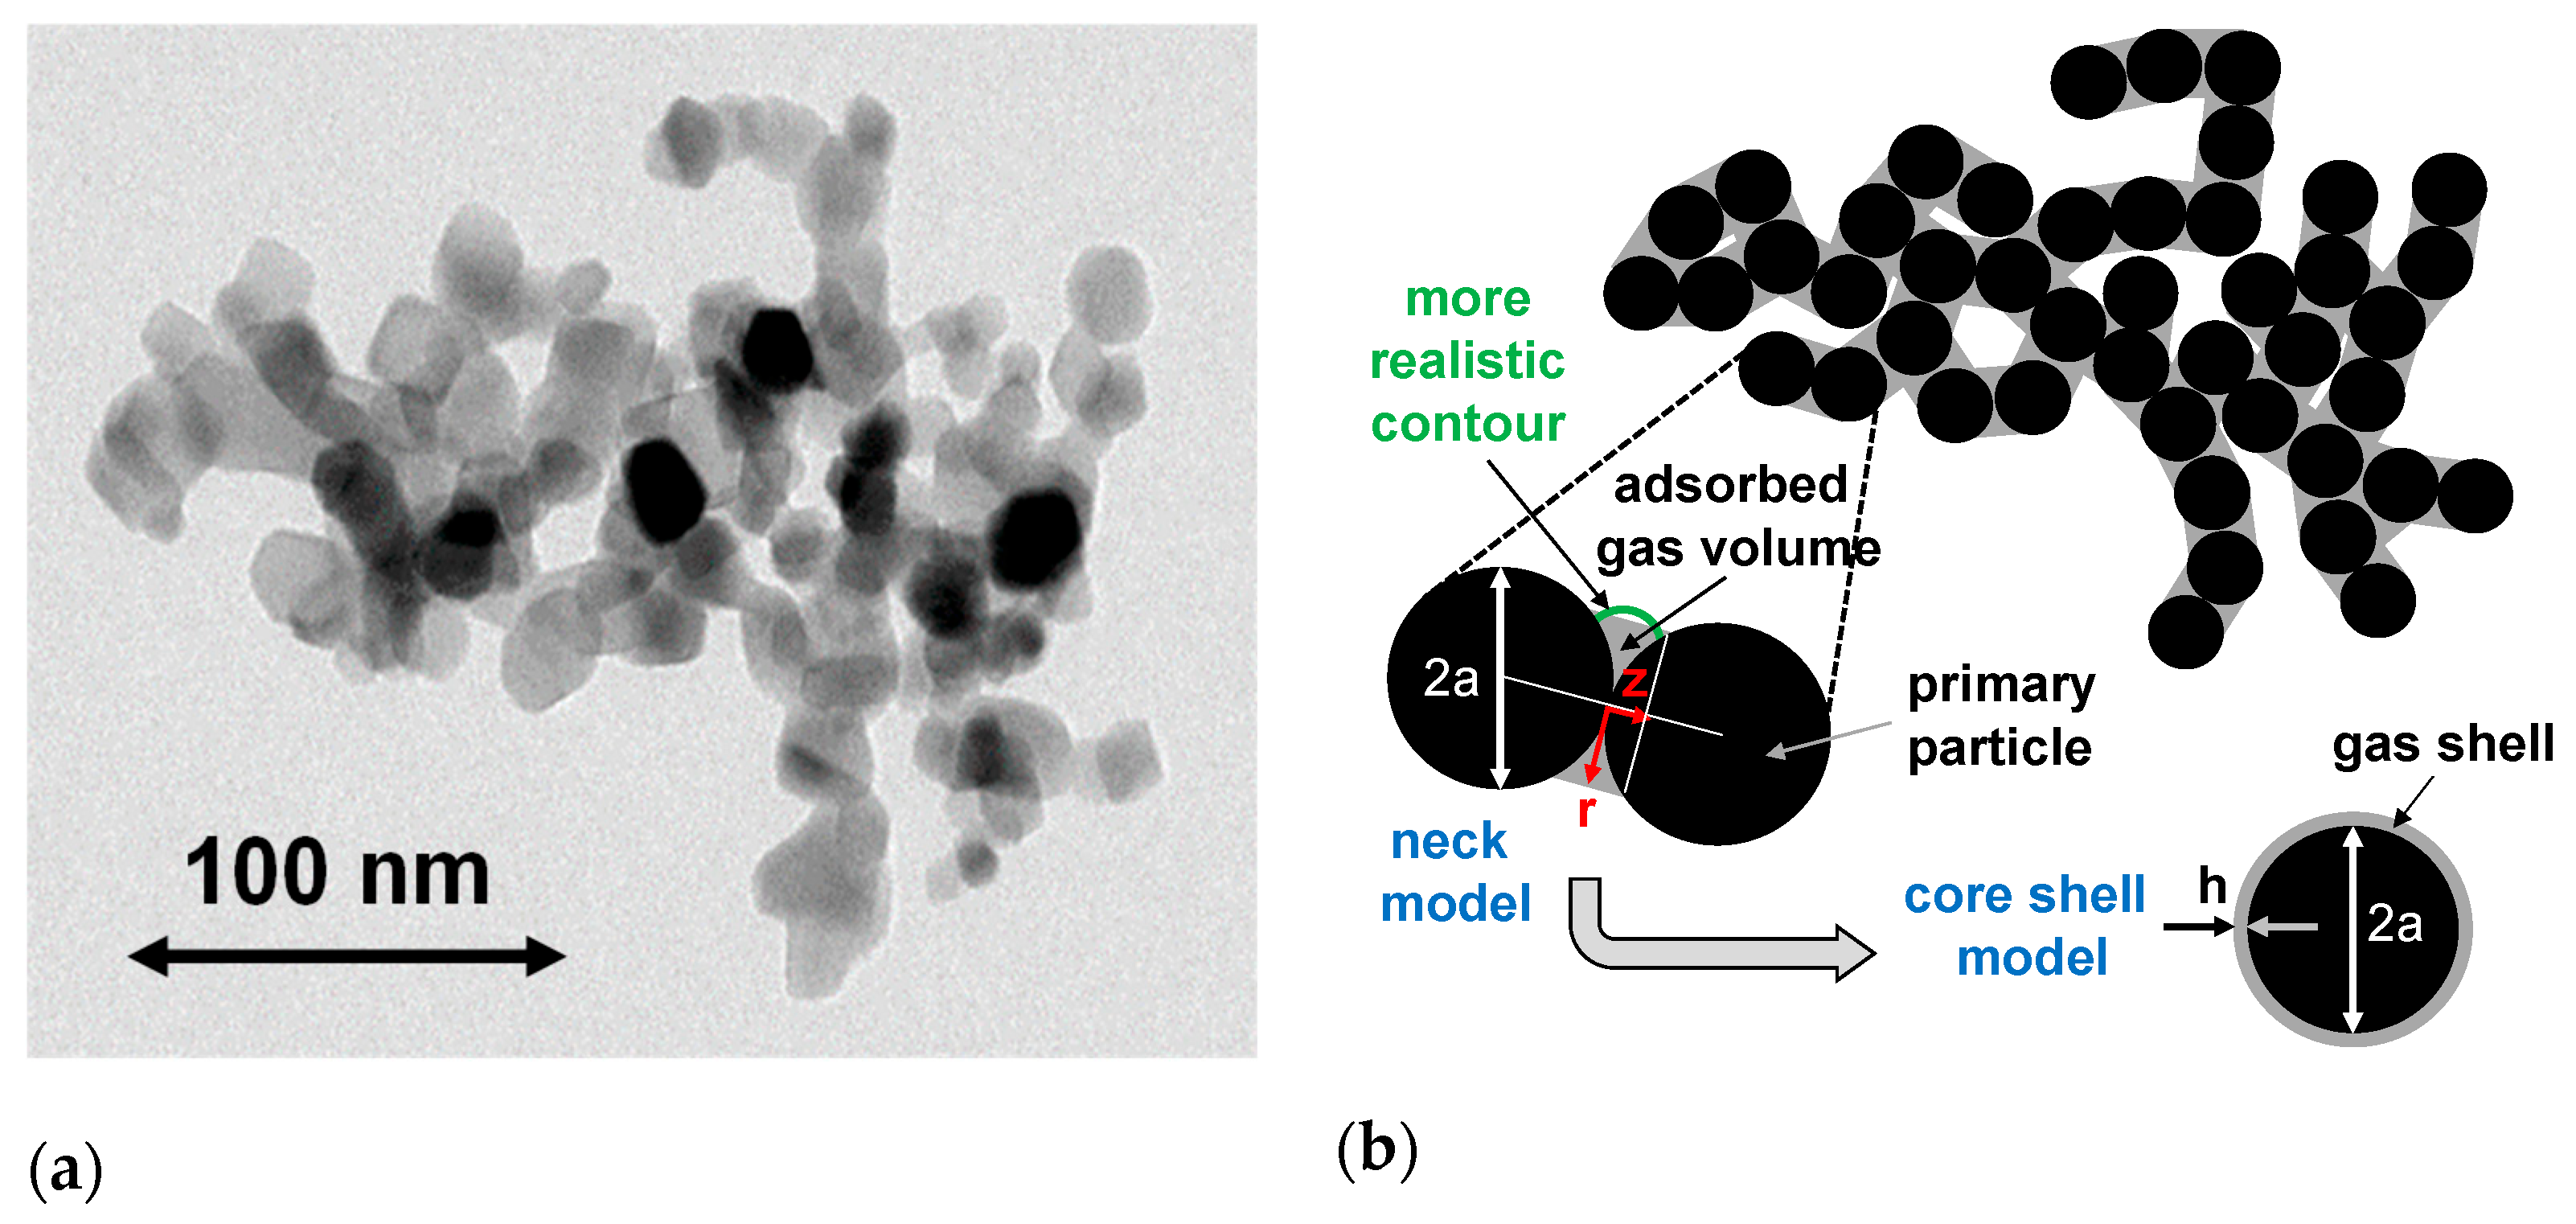
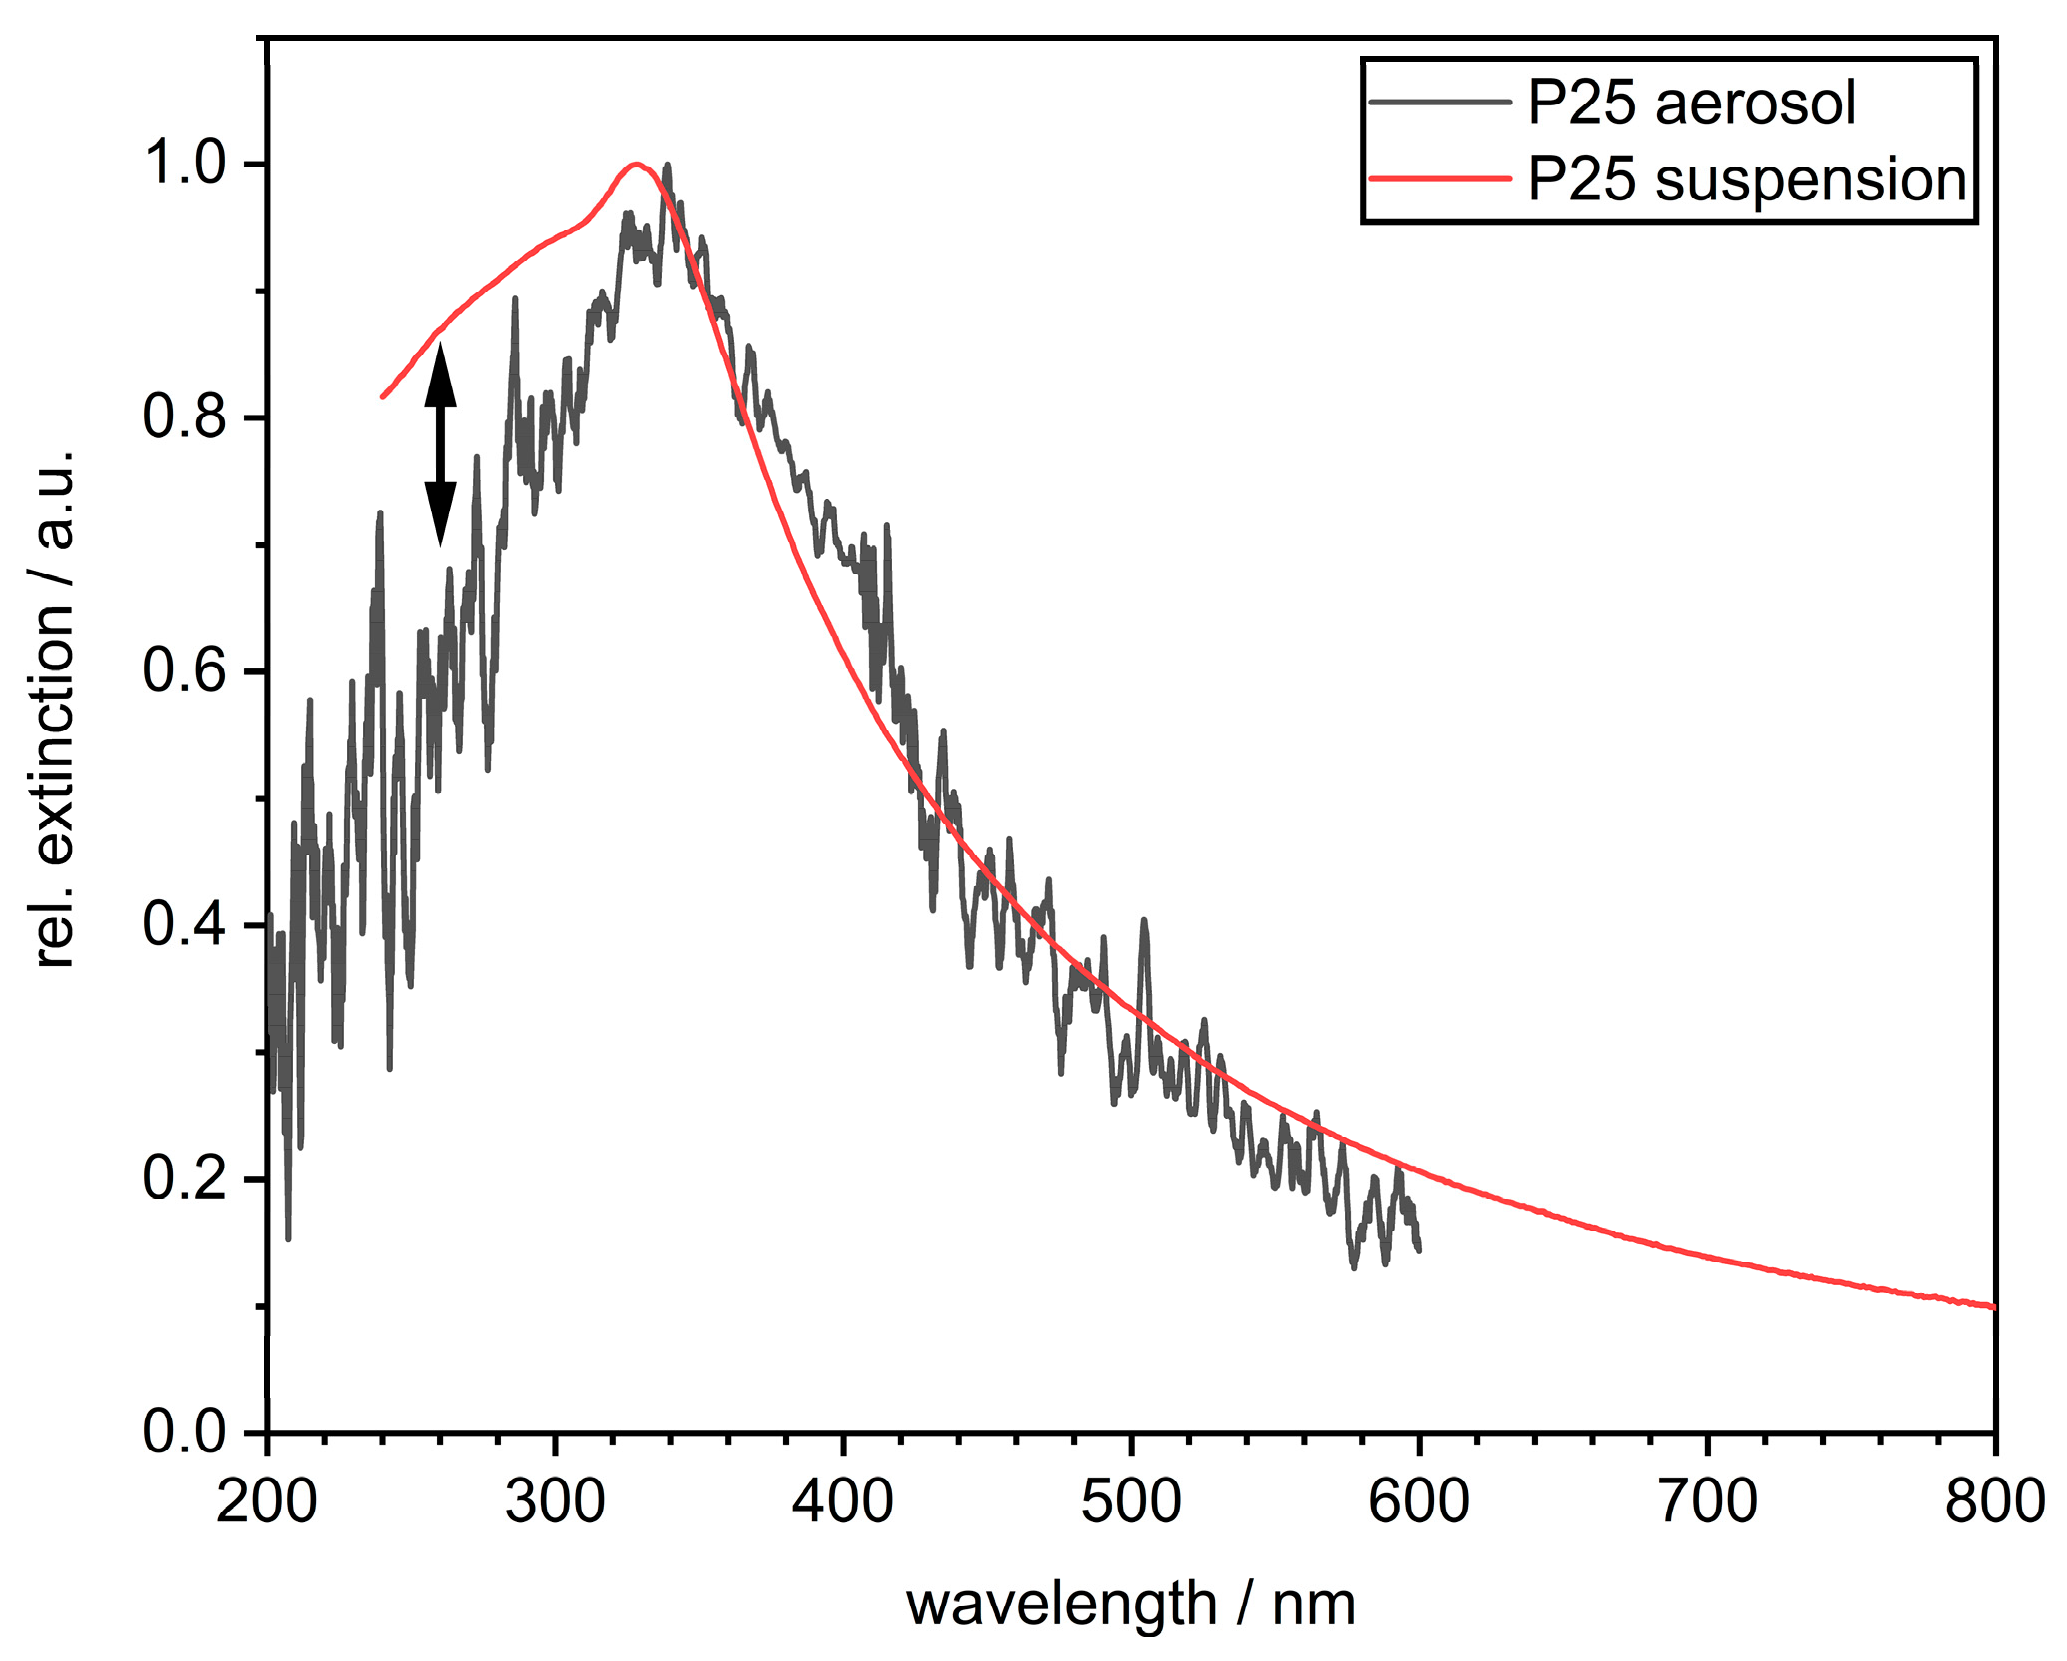
Appendix C. Extinction Behavior of Nanoparticle Aggregates and Comparison Neck to the Core–Shell Model

The scattering and extinction coefficients for primary titania nanoparticles (diameter of 27.3 nm) with a volume fraction of cv = 3 × 10⁻⁵ in water were calculated for various fractions of attached air bubble volumes. The absorption and scattering coefficients σabs,0 and σsca,0 were calculated using MiePlot v4 software [34]. While the total absorption of all particles is just the sum of all primary particle absorption processes (Equation (9)), the scattering of the agglomerates is proportional to the square of the number of primary particles in each agglomerate (cf. Equation (12)) multiplied with the structure factor G (Equation (15)). However, since the agglomerate structure does not change during gas treatment (cf. Appendix A), the total scattering cross-section is proportional to the scattering cross-section of a primary particle σsca,0. Therefore, relative changes of the total absorption and scattering cross-sections of the suspension are correlated with the changes of σabs,0 and σsca,0 due to the influence of the gas treatment on the size and the refractive index. Using the core–shell model outlined above, the correlation found in Figure A3 (right) was used to quantify the equivalent air volume attached to the TiO2 nanoparticles based on the reduced extinction of the suspension when treated with gas. The extinction is the sum of absorption and scattering, where the absorption contribution dominates the UV–vis extinction spectra.
Figure A3. (a) Extinction spectrum of 27.3 nm TiO2 core particles with an air-shell of 5 and 10 nm, respectively, including scattering and absorption contributions; (b) influence of the air-shell thickness on the scattering and extinction behavior of these titania core particles at two wavelengths of 300 nm (dominated by absorption) and 600 nm (dominated by Rayleigh scattering).
Powders 04 00007 g0a3
The extinction of the aggregates shown in Figure A1, some of which have gas volumes in the necks (cf. Figure A2), could, in principle, also be calculated using discrete dipole approximation (DDA). However, as this calculation exceeds the focus of the present study, a brief comparison between the neck model and the core–shell model will be made below. In particular, an estimate of the maximum error to be expected will be given. In the core–shell model, the extinction cross-section σext per primary particle can be calculated from the extinction coefficient Qext and the projection area App. The Mie calculations (at λ = 300 nm) with the core–shell model show the observed decrease in extinction with increasing shell thickness (orange triangles in Figure A4). However, the measured final value of the extinction when the surface is completely free of water (cf. Figure 9) differs from the value according to the core–shell model. Compared to the measured reduction in extinction at the transition from full water coverage to full air coverage (−15%, at λ = 300 nm in Figure 9), the Mie calculation with the core–shell model predicts a stronger decrease (−25%). Thus, the error in complete air coverage can be estimated as approx. 67%. It was assumed that for the large aggregates encountered in the experiments, the complete coverage by bubble formation (two end hemispheres are neglected) corresponds to the aerosol state (cf. inserts in Figure A4 in the top right-hand corner). For the evaluation of the UV–vis spectra, a linear interpolation between the two extreme values was selected (see red dashed line in Figure A4). Therefore, although significant differences (up to 67%) are expected between the neck model and the core–shell model, they have the same sign, namely, a decrease in extinction with increasing adsorbed gas volume.
Figure A4. Comparison of the extinction cross-sections (per primary particle) calculated by the core–shell model (orange triangles) with the UV–vis measurements in water (suspension) and in air (aerosol) at λ = 300 nm (red circles). The wetting of the aggregates are shown as schematic inserts. The shell thickness of 2 nm corresponds to the case that the necks between the primary particles are nearly completely filled with air.
Powders 04 00007 g0a4

Appendix D. Zeta Potential of TiO2 with DPC at Different pH Values

Figure A5. The effect of the cationic collector concentration (DPC) on the surface charge potential of TiO2 at pH 10 and pH 4. Through the positive surface charge at pH 4, DPC molecules are not attached compared to the measured behavior at pH 10. Here, TiO2 is negatively charged and DPC is attached. The change from negative to positive polarity at a DPC concentration of 4 mML−1 (critical micelle concentration—cmc) relies on forming a double layer of DPC molecules.
Powders 04 00007 g0a5

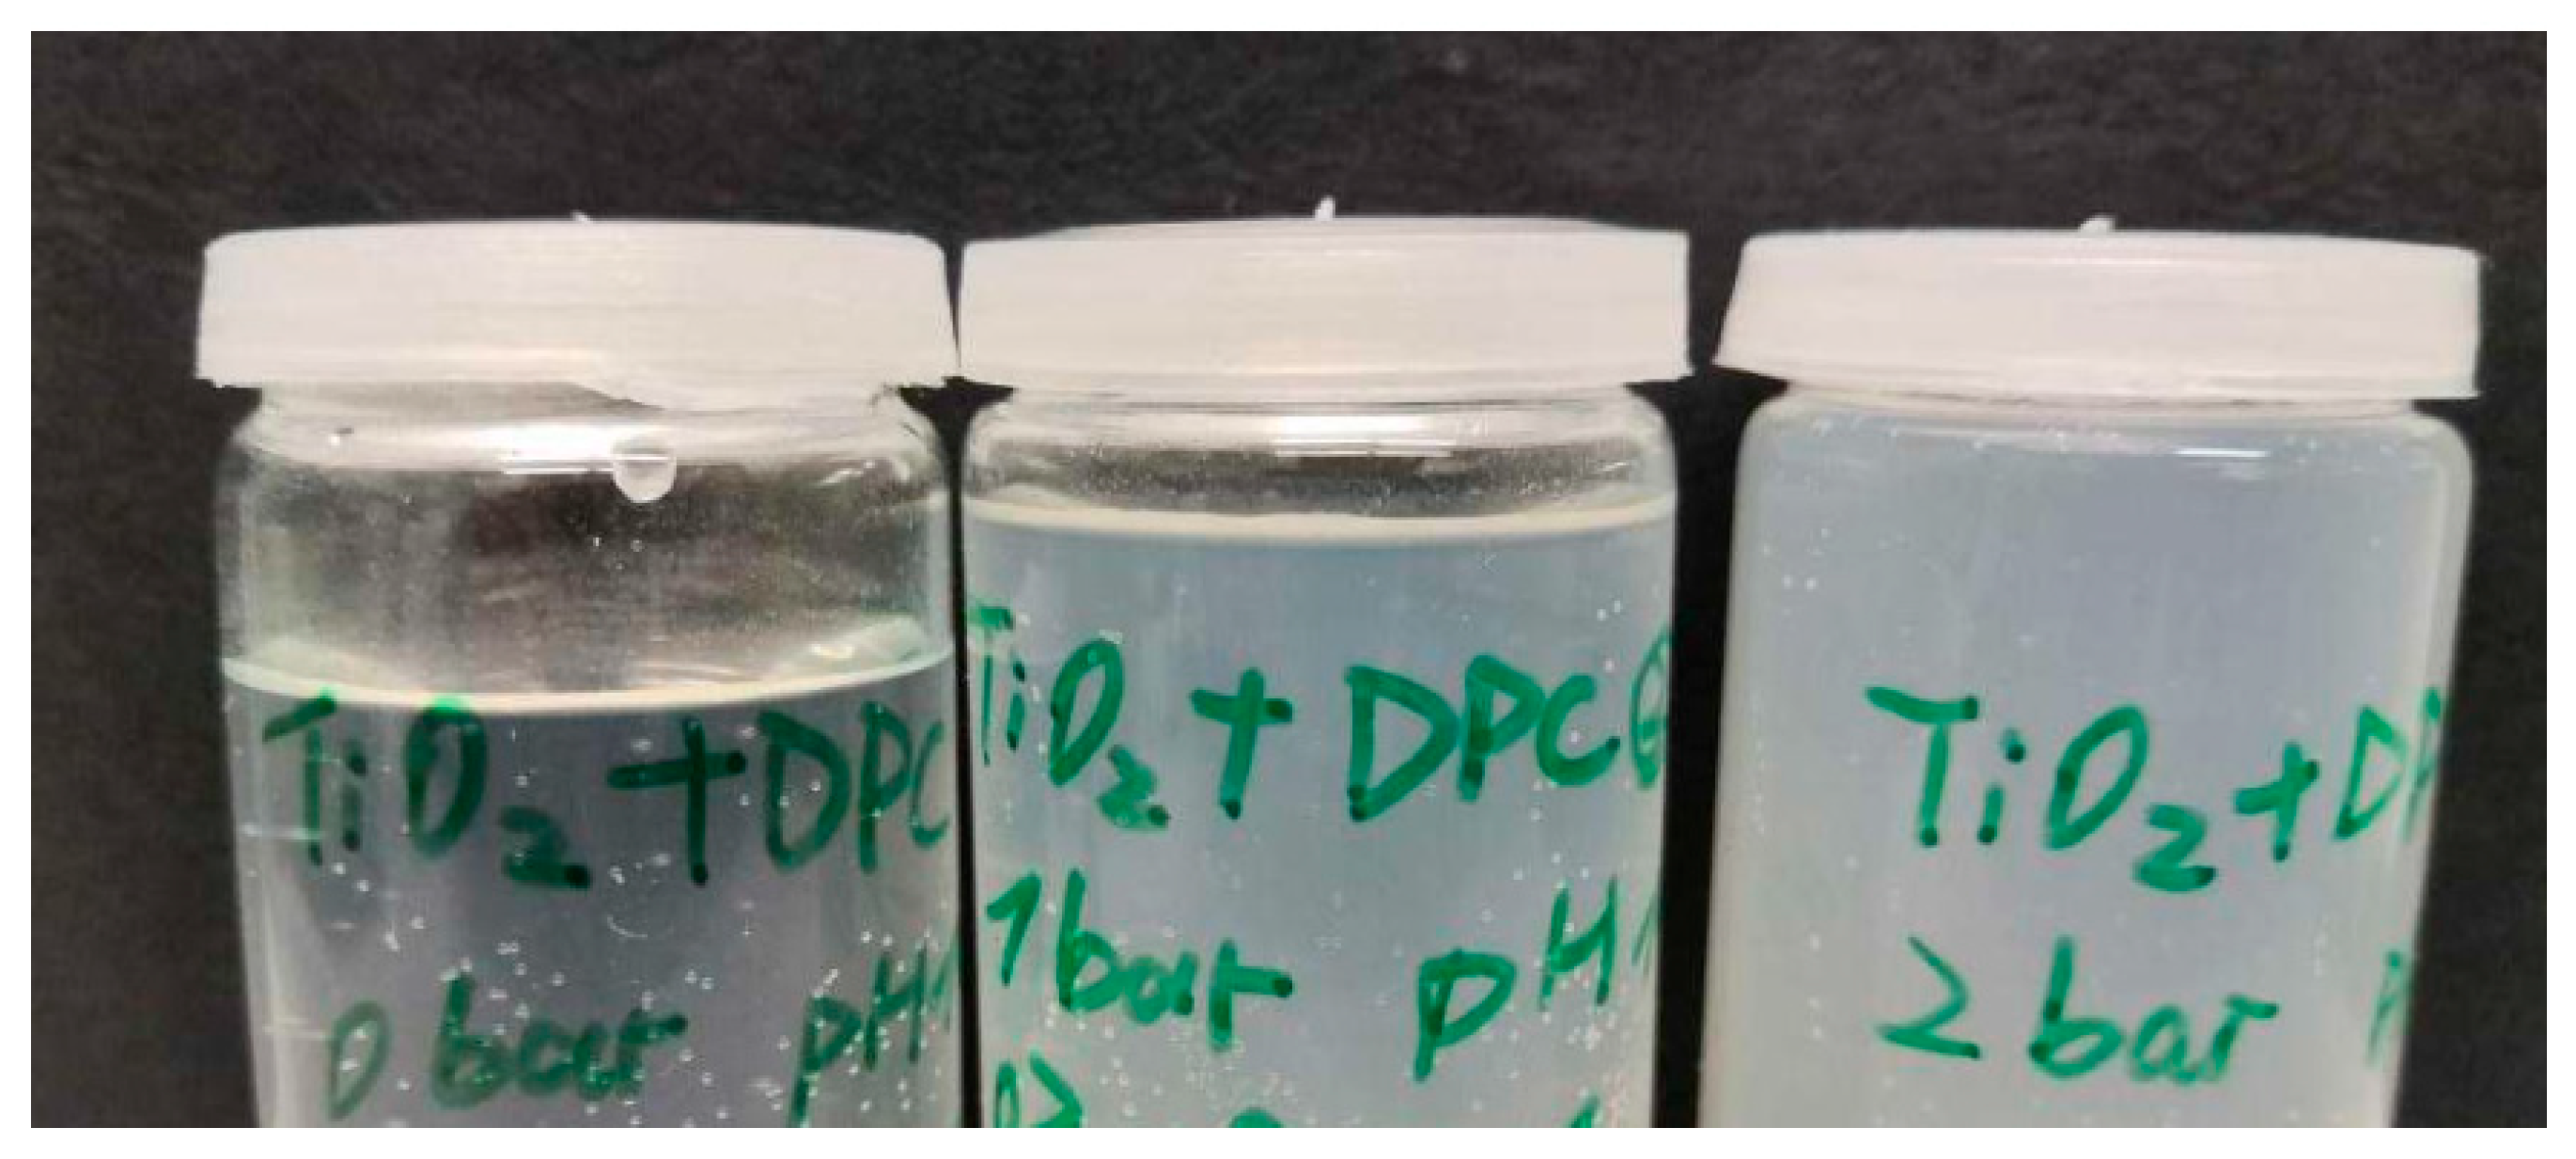
Appendix E. TiO2 Samples After Gas Treatment at Different Pressures

Figure A6. The photograph represents the particles that remained in the suspension after the gas treatment of TiO2 NP in the DAF at 0.4, 1, and 2 bar (left to right). At 1 and 2 bar, the elevated concentration of the remaining/resuspended TiO2 particles is visible (cf. Figure 11b).
Powders 04 00007 g0a6

Appendix F. Zeta Potential of Free Nanobubbles (BNBs)

The zeta potential of free nanobubbles (BNBs) in UPW was measured using NTA across various pH values. Figure A7 illustrates that nanobubbles have a positive charge in very acidic environments and a negative charge in alkaline settings. The isoelectric point occurs at a pH of around 3.2. These findings are analogous to the studies conducted by Takahashi [43] and Meegoda et al. [17].
Figure A7. Zeta potential (ZP) of BNBs at different pH values measured by NTA. The vertical lines represent the ZP at pH 4 and pH 10; black dots: measurements; green line: a guide to the eyes.
Powders 04 00007 g0a7

References

  1. Gu, Y.; Xia, K.; Wu, D.; Mou, J.; Zheng, S. Technical Characteristics and Wear-Resistant Mechanism of Nano Coatings: A Review. Coatings 2020, 10, 233. [Google Scholar] [CrossRef]
  2. Parthasarathy, M. Challenges and Emerging Trends in Toner Waste Recycling: A Review. Recycling 2021, 6, 57. [Google Scholar] [CrossRef]
  3. Masuhr, M.; Kruis, F.E. Fractionation of Aerosols by Particle Size and Material Composition Using a Classifying Aerodynamic Lens. Powders 2024, 3, 392–415. [Google Scholar] [CrossRef]
  4. Giesler, J.; Weirauch, L.; Thöming, J.; Baune, M.; Pesch, G.R. Separating Microparticles by Material and Size Using Dielectrophoretic Chromatography with Frequency Modulation. Sci. Rep. 2021, 11, 16861. [Google Scholar] [CrossRef]
  5. Farrokhpay, S.; Filippov, L.; Fornasiero, D. Flotation of Fine Particles: A Review. Miner. Process. Extr. Metall. Rev. 2021, 42, 473–483. [Google Scholar] [CrossRef]
  6. Karakashev, S.; Grozev, N.; Ozdemir, O.; Guven, O.; Ata, S.; Bournival, G.; Batjargal, K.; Boylu, F.; Hristova, S.; Çelik, M. Physical Restrictions of the Flotation of Fine Particles and Ways to Overcome Them. Physicochem. Probl. Miner. Process. 2022, 58, 153944. [Google Scholar] [CrossRef]
  7. Nguyen, A.V.; George, P.; Jameson, G.J. Demonstration of a Minimum in the Recovery of Nanoparticles by Flotation: Theory and Experiment. Chem. Eng. Sci. 2006, 61, 2494–2509. [Google Scholar] [CrossRef]
  8. Zhang, F.; Sun, L.; Yang, H.; Gui, X.; Schönherr, H.; Kappl, M.; Cao, Y.; Xing, Y. Recent Advances for Understanding the Role of Nanobubbles in Particles Flotation. Adv. Colloid Interface Sci. 2021, 291, 102403. [Google Scholar] [CrossRef]
  9. Kyzas, G.Z.; Mitropoulos, A.C.; Matis, K.A. From Microbubbles to Nanobubbles: Effect on Flotation. Processes 2021, 9, 1287. [Google Scholar] [CrossRef]
  10. Tao, D. Recent Advances in Fundamentals and Applications of Nanobubble Enhanced Froth Flotation: A Review. Miner. Eng. 2022, 183, 107554. [Google Scholar] [CrossRef]
  11. Schubert, H. Nanobubbles, Hydrophobic Effect, Heterocoagulation and Hydrodynamics in Flotation. Int. J. Miner. Process. 2005, 78, 11–21. [Google Scholar] [CrossRef]
  12. Attard, P. Nanobubbles and the Hydrophobic Attraction. Adv. Colloid Interface Sci. 2003, 104, 75–91. [Google Scholar] [CrossRef] [PubMed]
  13. Tyrrell, J.W.G.; Attard, P. Images of Nanobubbles on Hydrophobic Surfaces and Their Interactions. Phys. Rev. Lett. 2001, 87, 176104. [Google Scholar] [CrossRef]
  14. Ferraro, G.; Jadhav, A.J.; Barigou, M. A Henry’s Law Method for Generating Bulk Nanobubbles. Nanoscale 2020, 12, 15869–15879. [Google Scholar] [CrossRef]
  15. Nirmalkar, N.; Pacek, A.W.; Barigou, M. Interpreting the Interfacial and Colloidal Stability of Bulk Nanobubbles. Soft Matter 2018, 14, 9643–9656. [Google Scholar] [CrossRef]
  16. Jin, J.; Feng, Z.; Yang, F.; Gu, N. Bulk Nanobubbles Fabricated by Repeated Compression of Microbubbles. Langmuir 2019, 35, 4238–4245. [Google Scholar] [CrossRef]
  17. Meegoda, J.N.; Aluthgun Hewage, S.; Batagoda, J.H. Stability of Nanobubbles. Environ. Eng. Sci. 2018, 35, 1216–1227. [Google Scholar] [CrossRef]
  18. Ditscherlein, L.; Fritzsche, J.; Peuker, U.A. Study of Nanobubbles on Hydrophilic and Hydrophobic Alumina Surfaces. Colloids Surf. Physicochem. Eng. Asp. 2016, 497, 242–250. [Google Scholar] [CrossRef]
  19. Maheshwari, S.; van der Hoef, M.; Zhang, X.; Lohse, D. Stability of Surface Nanobubbles: A Molecular Dynamics Study. Langmuir 2016, 32, 11116–11122. [Google Scholar] [CrossRef]
  20. Oh, S.H.; Kim, J.M. Generation and Stability of Bulk Nanobubbles. Langmuir 2017, 33, 3818–3823. [Google Scholar] [CrossRef]
  21. Tan, B.H.; An, H.; Ohl, C.-D. Stability of Surface and Bulk Nanobubbles. Curr. Opin. Colloid Interface Sci. 2021, 53, 101428. [Google Scholar] [CrossRef]
  22. Knüpfer, P.; Ditscherlein, L.; Peuker, U.A. Nanobubble Enhanced Agglomeration of Hydrophobic Powders. Colloids Surf. Physicochem. Eng. Asp. 2017, 530, 117–123. [Google Scholar] [CrossRef]
  23. Olszok, V.; Rivas-Botero, J.; Wollmann, A.; Benker, B.; Weber, A.P. Particle-Induced Nanobubble Generation for Material-Selective Nanoparticle Flotation. Colloids Surf. Physicochem. Eng. Asp. 2020, 592, 124576. [Google Scholar] [CrossRef]
  24. Li, C.; Zhang, H. Surface Nanobubbles and Their Roles in Flotation of Fine Particles—A Review. J. Ind. Eng. Chem. 2022, 106, 37–51. [Google Scholar] [CrossRef]
  25. Pan, G.; He, G.; Zhang, M.; Zhou, Q.; Tyliszczak, T.; Tai, R.; Guo, J.; Bi, L.; Wang, L.; Zhang, H. Nanobubbles at Hydrophilic Particle–Water Interfaces. Langmuir 2016, 32, 11133–11137. [Google Scholar] [CrossRef]
  26. Wang, K.; Wei, Z.; Colbeau-Justin, C.; Nitta, A.; Kowalska, E. P 25 and Its Components—Electronic Properties and Photocatalytic Activities. Surf. Interfaces 2022, 31, 102057. [Google Scholar] [CrossRef]
  27. Asakura, Y.; Yasuda, K. Frequency and Power Dependence of Ultrasonic Degassing. Ultrason. Sonochem. 2022, 82, 105890. [Google Scholar] [CrossRef]
  28. Azevedo, A.; Etchepare, R.; Calgaroto, S.; Rubio, J. Aqueous Dispersions of Nanobubbles: Generation, Properties and Features. Miner. Eng. 2016, 94, 29–37. [Google Scholar] [CrossRef]
  29. Smith, P.G.; Warren, L.J. Entrainment of Particles into Flotation Froths. Miner. Process. Extr. Metall. Rev. 1989, 5, 123–145. [Google Scholar] [CrossRef]
  30. Kanniah, V.; Wu, P.; Mandzy, N.; Grulke, E.A. Fractal Analysis as a Complimentary Technique for Characterizing Nanoparticle Size Distributions. Powder Technol. 2012, 226, 189–198. [Google Scholar] [CrossRef]
  31. Binder, C.; Feichtinger, C.; Schmid, H.-J.; Thürey, N.; Peukert, W.; Rüde, U. Simulation of the Hydrodynamic Drag of Aggregated Particles. J. Colloid Interface Sci. 2006, 301, 155–167. [Google Scholar] [CrossRef] [PubMed]
  32. Mäntele, W.; Deniz, E. UV–VIS Absorption Spectroscopy: Lambert-Beer Reloaded. Spectrochim. Acta. A. Mol. Biomol. Spectrosc. 2017, 173, 965–968. [Google Scholar] [CrossRef] [PubMed]
  33. Sorensen, C.M. Light Scattering by Fractal Aggregates: A Review. Aerosol Sci. Technol. 2001, 35, 648–687. [Google Scholar] [CrossRef]
  34. Laven, P. MiePlot v4. 2014. Available online: http://www.philiplaven.com/mieplot (accessed on 10 February 2025).
  35. Haarhoff, J.; Edzwald, J.K. Dissolved Air Flotation Modelling: Insights and Shortcomings. J. Water Supply Res. Technol.-Aqua 2004, 53, 127–150. [Google Scholar] [CrossRef]
  36. Edzwald, J.K. Principles and Applications of Dissolved Air Flotation. Water Sci. Technol. 1995, 31, 1–23. [Google Scholar] [CrossRef]
  37. Zhu, P.; Dastan, D.; Liu, L.; Wu, L.; Shi, Z.; Chu, Q.-Q.; Altaf, F.; Mohammed, M.K.A. Surface Wettability of Various Phases of Titania Thin Films: Atomic-Scale Simulation Studies. J. Mol. Graph. Model. 2023, 118, 108335. [Google Scholar] [CrossRef]
  38. Brotchie, A.; Zhang, X.H. Response of Interfacial Nanobubbles to Ultrasound Irradiation. Soft Matter 2011, 7, 265–269. [Google Scholar] [CrossRef]
  39. Yang, S.; Pelton, R.; Raegen, A.; Montgomery, M.; Dalnoki-Veress, K. Nanoparticle Flotation Collectors: Mechanisms Behind a New Technology. Langmuir 2011, 27, 10438–10446. [Google Scholar] [CrossRef]
  40. Yang, S.; Pelton, R.; Montgomery, M.; Cui, Y. Nanoparticle Flotation Collectors III: The Role of Nanoparticle Diameter. ACS Appl. Mater. Interfaces 2012, 4, 4882–4890. [Google Scholar] [CrossRef]
  41. Somasundaran, P.; Fuerstenau, D.W. Mechanisms of Alkyl Sulfonate Adsorption at the Alumina-Water Interface1. J. Phys. Chem. 1966, 70, 90–96. [Google Scholar] [CrossRef]
  42. Scamehorn, J.F.; Schechter, R.S.; Wade, W.H. Adsorption of Surfactants on Mineral Oxide Surfaces from Aqueous Solutions. J. Colloid Interface Sci. 1982, 85, 463–478. [Google Scholar] [CrossRef]
  43. Takahashi, M. ζ Potential of Microbubbles in Aqueous Solutions: Electrical Properties of the Gas−Water Interface. J. Phys. Chem. B 2005, 109, 21858–21864. [Google Scholar] [CrossRef] [PubMed]
  44. Harvey, E.N.; Barnes, D.K.; McElroy, W.D.; Whiteley, A.H.; Pease, D.C.; Cooper, K.W. Bubble Formation in Animals. I. Physical Factors. J. Cell. Comp. Physiol. 1944, 24, 1–22. [Google Scholar] [CrossRef]
  45. Groß, T.F.; Pelz, P.F. Diffusion-Driven Nucleation from Surface Nuclei in Hydrodynamic Cavitation. J. Fluid Mech. 2017, 830, 138–164. [Google Scholar] [CrossRef]
  46. Calgaroto, S.; Azevedo, A.; Rubio, J. Flotation of Quartz Particles Assisted by Nanobubbles. Int. J. Miner. Process. 2015, 137, 64–70. [Google Scholar] [CrossRef]
  47. Chang, G.; Xing, Y.; Zhang, F.; Yang, Z.; Liu, X.; Gui, X. Effect of Nanobubbles on the Flotation Performance of Oxidized Coal. ACS Omega 2020, 5, 20283–20290. [Google Scholar] [CrossRef]
  48. Rox, H.; Ränke, F.; Mädler, J.; Marzec, M.M.; Sokołowski, K.; Baumann, R.; Hamedi, H.; Yang, X.; Mutschke, G.; Urbas, L.; et al. Boosting Electrode Performance and Bubble Management via Direct Laser Interference Patterning. ACS Appl. Mater. Interfaces 2025, 17, 9364–9377. [Google Scholar] [CrossRef]
Figure 1. Structure of the presented work and employed characterization tools.
Powders 04 00007 g001
Figure 2. Experimental setup for (a) the production of NB and dissolved air flotation (DAF) and (b) for the froth flotation with a modified Hallimond tube. Piping and instrumentation diagram of the small-scale pressurization system (a): F1—activated carbon filter; F2—particle filter; V1—needle valve; V2—relief valve; V3—valve of the mass flow controller; PI—pressure indication (manometer); PIR—pressure indication recording; FIC—flow indication control; 01, 02, 03—numbering in the control and regulation unit.
Powders 04 00007 g002
Figure 3. Morphology of NP aggregates: (a) TEM micrograph of a typical TiO2 aggregate (P 25) and (b) two models of the aggregate after gas treatment: the first model (neck model—for details, see Appendix B) seems more realistic but less accessible to light scattering calculations. Therefore, a simplified second model (core–shell model) is used for optical calculations (primary particle diameter: d p p = 2a, shell thickness h , cf. Appendix C).
Powders 04 00007 g003
Figure 4. Experimental setup for the direct comparison between online aerosol extinction spectrometry (on dry particles) and offline extinction spectrometry (in pure water) on TiO2 nano-aggregates (P 25).
Powders 04 00007 g004
Figure 5. Influence of gas treatment pressure on the properties of free NBs: (a) on the size distribution measured with NTA; (b) on the UV–vis extinction.
Powders 04 00007 g005
Figure 6. (a) Influence of the gas treatment of TiO2 aggregates on the settling behavior; (b) reduction in the settling velocity as a function of the attached air volume calculated for both models: core–shell (dashed line) and neck models (dashed–dotted line). The measured reduction in the settling velocity is also included; furthermore, the shell thickness is given to correspond to the core–shell case.
Powders 04 00007 g006
Figure 7. Influence of the gas treatment pressure on (a) the NTA and (b) the UV–vis extinction measurements for TiO2 aggregates (P25) in pure water.
Powders 04 00007 g007
Figure 8. (a) Influence of the gas treatment pressure on the formation of new BNBs (given in terms of volumetric number concentration) and on the build-up of the air volume of SNBs to TiO2 aggregates; purple crossed rectangles: measured values with the standard deviation of the BNBs and the purple curve is a fit function, purple color refer to the left y-axis; orange dots: measured values with the standard deviation of the SNBs and the orange curve is a fit function, the orange color refer to the right y-axis (b) correlation between the volumes of BNBs and of SNBs confirming a causal relationship.
Powders 04 00007 g008
Figure 9. Influence of the dispersion medium on the extinction of measurements for TiO2 aggregates (P25), i.e., comparison of UV–vis extinction in water (suspension) and in air (aerosol).
Powders 04 00007 g009
Figure 10. Influence of US treatment of gasified P25 aggregates: (a) changes in UV–vis extinction spectra with the standard deviation for the gas−treated sample (in light blue) and the blank sample (in black) (b) temporal evolution of the bubble–particle clusters with US time where gas-treated NPs return to their original state within 20 s by detaching adsorbed gas volumes.
Powders 04 00007 g010
Figure 11. Number-based particle size distributions obtained with NTA measurements of the particles remaining in the suspension DAF after gas treatment at different pressures: (a) for TiO2 NP aggregates at various gas treatments at pH 4; (b) for TiO2 NP aggregates at various gas treatments at pH 10.
Powders 04 00007 g011
Figure 12. (a) Changes in the TiO2 NP concentration N1bar/Ninitial due to gas treatment of the suspension at 1 bar at different pH values analyzed by NTA (blue dots refer to the left y-axis). The suspension was pre-mixed with a cationic collector (DPC) before being treated with gas. The zeta potential curve for TiO2 NPs was analyzed without the presence of any additional collector or salt (gray semi−filled diamonds and the gray line refer to the right y-axis). (b) The time-dependent yield of TiO2 NPs with DPC as a collector by froth flotation using a Hallimond tube. Blue squares: flotation at pH 10, green diamonds: flotation at pH 4; green area: 99% confidence interval, defined as entrainment (false flotation) with an averaged standard deviation of 5.5%.
Powders 04 00007 g012
Table 1. Comparison of the inductively coupled plasma with optical emission spectroscopy (ICP-OES) measurement with the NTA measurements of the particles remaining in the suspension after the gas treatment (DAF) at pH 10 (see Figure 11b). While each particle is detected by the NTA analysis, regardless of whether it is TiO2 or NBs, only titanium was analyzed by ICP-OES.
ICP-OES Measurement
Rel. TiO2-Mass Concentration %
NTA Measurement
Rel. Particle Number
Concentration %
blank100100
0.4 bar76
1 bar1419
2 bar1625
Disclaimer/Publisher’s Note: The statements, opinions and data contained in all publications are solely those of the individual author(s) and contributor(s) and not of MDPI and/or the editor(s). MDPI and/or the editor(s) disclaim responsibility for any injury to people or property resulting from any ideas, methods, instructions or products referred to in the content.

