Abstract
Modeling powder properties remains a complex and difficult area of study because particulate materials can behave differently under variable conditions based on their bulk and surface-level properties. The research presented in this manuscript was designed to support the fundamental understanding of powder systems by joining experimental and theoretical calculations of dimensionless numbers groups for design purposes. In order to do so, this work focused on two critical variables to better understand fluidization design: physical and chemical surface properties. To better resolve the influence of surface properties, surface-treated powders were used. Five different powder samples of varying particle size distribution were characterized using physical property measurements, including pressure drop profiles to obtain the minimum fluidization velocity, density measurements, and particle sizing. Using theoretical equations, the minimum fluidization velocity was also calculated to compare with those obtained experimentally and determine typical dimensionless number groups used in bulk handling system design. The results showed that the theoretically determined values were lower than those calculated using the experimentally . In the case of the Reynolds number, the experimental values were 3–20% higher than the theoretical values, which is an important distinction for designing conveying systems and pipeline flow. Similar results were observed for the theoretical and experimental Froude numbers, indicating an important dependence on the cohesive properties of the particle interactions. Additional dimensionless number groups were considered, including the granular bond number and flow factors. To investigate the influence of surface forces, Hamaker constants were utilized for alumina and polydimethylsiloxane in the calculation of the granular bond number. A lower granular bond was observed with a decrease in the Hamaker constant for PDMS, suggesting that the surface forces would be lower for our surface-treated powders.
1. Introduction
Powder flow properties tend to change when introduced to new environments, e.g., when a powder in a pneumatic transfer environment hits a pipe bend where the flow could transition from laminar to turbulent. When designing equipment, process engineers have tools to evaluate powder properties a priori, such as the Reynolds (Re), Archimedes (Ar), and Froude (Fr) numbers, which are considered dimensionless groups. Traditionally, dimensionless number groups have been used to generalize relationships between powder properties such as particle size, density, and viscosity of the transport fluid. The use of these dimensionless number groups can help our understanding of the physics involved in the system, provide design spaces, and give scaling considerations for bulk solids-handling applications.
The study of powder flow is a high-interest research area because of its many applications, including combustion of fuels [1], food coating technology [2], and dryers [3], just to name a few. The ability to move powders in a fluid-like manner is very appealing as it can improve the efficiency of the many processes that utilize powdered materials. In some recent works, authors have compared results using experimentally determined values with theoretical models. Ferreira et al. investigated the experimental and theoretical results of the fluidization of commercial metal powders for nozzle design of an additive manufacturing system [4]. The authors found reasonable agreement for the calculations and measurements, but also found discrepancies for the gas velocity measured by experiment. Through investigating the flow characteristics in microchannels, Li et al. also made comparisons between experimentally and numerically calculated values of the Reynolds number [5]. In their study, they found that experiments with high Reynolds numbers tended to be in better agreement than those with lower Re numbers.
Bulk powder handling system design is based on the intended material’s flowability. Two examples, hydraulic conveying and pneumatic transport, are efficient, practical ways to move large quantities of material in industrial settings. Bulks solids engineering is difficult because of the challenges arising from friction and cohesion, which do not allow for a standard design process. In order to produce a reliable and robust system, understanding the design parameters and powder properties is critical. For example, in pipeline transport, the Re number is particularly important because it is a function of the powder’s density and the delivery fluid viscosity. To that end, the Ar number is also critical in vertical powder movement because it is based on the gravity and viscous forces. Although these values can be evaluated empirically, the actual powder properties can be influenced by variables that are not included in these evaluations.
In this work, powder flow was evaluated using experimental fluidization studies and dimensional analysis. Using pressure drop profiles generated from our test powders, the experimentally determined minimum fluidization velocity () or the incipient point at which the buoyancy force created by the fluid is equivalent to gravitational force exerted by the mass of the powder bed can be resolved. When the incoming gas velocity reaches the , the powder acts like a free-flowing liquid rather than a bulk solid, and the pressure drop remains constant as the gas velocity increases. This velocity can also be calculated from the density of the powder, density of the fluidizing gas, particle diameter, and fluid viscosity. When determining the this way, there are no considerations for surface-level properties. The idea of including surface level parameters into first-principles models has received recent attention because of its potential to determine the a priori [6]. The work presented in this manuscript will compare experimental measurements to the existing dimensionless number group methods.
Characterizing the gas-fluidization properties of powders originated with the seminal works of D. Geldart [7,8,9]. By compiling a wide variety of experimental data, he was able to generate a graph that could predict the type of fluidization based on powder mean particle size and the density differences between the fluidizing gas and the powder density. This graph is known as Geldart’s Chart, and he identified four distinct groups designated as cohesive (C), aeratable (A), sand-like (B), and spoutable (D). The powders considered in this work would all fall under the group C or group A solely based on mean particle size.
Surface treatment of particles has been a successful method to improve the flow properties of powders [10,11,12,13,14]. In some cases, it can change a powder from Hausner group C to group A, despite the mean particle size [15,16]. This is particularly useful when considering fine powders with a mean particle size of less than 50 microns. In the interest of studying finer particles, surface-treated particles were used because fluidization velocities for as-received powders are not measurable by this method. Issues such as channeling and rat-holing occurred, making the data erratic and pressure fluctuations difficult to identify unequivocally. The use of surface-treated particles removes interparticulate interactions, including liquid bridging and surface molecular water, which can complicate the results. Figure 1 shows a photo comparison of raw (left) and surface-treated (right) powder samples to show the apparent reduction in clumping behavior and decrease in cohesive properties, making these samples appropriate for experimental testing. Using the results from this work, an important knowledge gap can be filled in the experimental analysis of surface-treated particles for fluidizing gas environments in support of bulk scale processing design and scale-up.
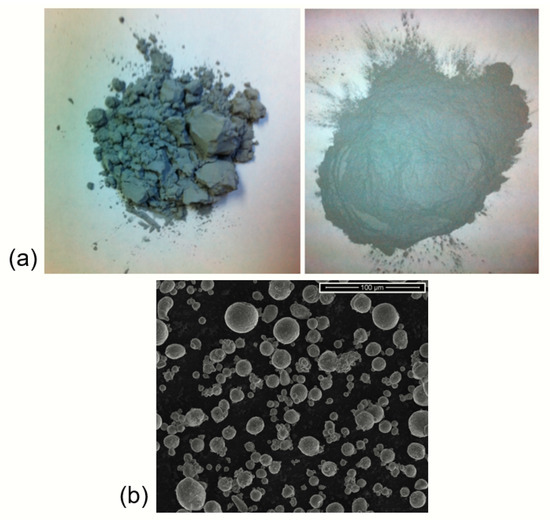
Figure 1.
(a) Comparison of raw (left) and surface-treated (right) aluminum powders. Reduction in cohesion and surface water content can be seen by the decrease in clumping behavior. (b) SEM image of gas-atomized aluminum powder, showing spherical particle and agglomerates (SD16).
In order to remove the impact of surface forces, most studies focus on noncohesive powders, such as Geldart group A. In order to study finer particles sizes, surface-treated particles previously studied by the author were used, which gave us the ability to study Geldart C group particle sizes (<50 μm). Previous results from our lab showed that siloxane surface coatings can effectively change a typically group C powder to group A. Thorough experimental investigations, including measurements for powder preparation methods and relevant surface properties, can be found in references [15,17,18,19]. To support the experimental component of this study, existing pressure drop curves were used from previous studies to calculate the . The curves were generated using a Freeman FT4 Powder Rheometer® through aeration studies [17].
The goal of this work was to compare the experimentally determined with those derived theoretically using fine, micron-sized particles. The dimensionless number groups were considered to evaluate the properties of our surface-treated powder to investigate a typically cohesive, poorly flowing powder. The use of the Reynolds (Re) number is an important value in fluid mechanics that can estimate flow patterns for the design of pipes, open channels, and transport. Another important consideration is the particulate Archimedes (Ar) number, which is important in the design of chemical, drying, and coating reactors. The Froude (Fr) number is critically important for mixing and tumbling operation scaling. Because our particles are surface-treated, we also considered groups with surface-level features included, such as the granular bond number ().
2. Materials and Methods
2.1. Materials
Aluminum powder (Valimet, various PSD) was surface-treated using methyltriethoxysilane (MTES) prior to use according to reference [15]. Ultra-high-purity argon (Praxair) was used in all FT4 Powder Rheometer® trials to determine the experimental minimum fluidization velocity () through pressure drop profiles [17].
2.2. Particle Sizing Measurements
Particle sizing was completed using laser diffraction (Mastersizer 3000, Malvern Panalytical Ltd., Malvern, UK). The instrument had a liquid phase sample chamber where a small amount of aluminum (10–20 mg) was dispersed in isopropyl alcohol (99%). The measurement was completed when the obscuration value was between 10–20% and each sample was measured in triplicate with the average value reported. The instrument reports an error of ±0.1. Experimentally determined property values for the powders used in this testing including Sauter mean diameter (μm), particle size distribution, and values (10, 50, and 90).
2.3. Density Measurements
All of the samples were analyzed for density and Hausner ratio using an Autotap instrument (Quantachrome Instruments, Boynton Beach, FL, USA). Each sample was analyzed using the ASTM B527-06 standard [20]. The standard requires that 100 g of powder is measured in a 100 mL graduated cylinder, where the apparent density was calculated prior to the tap density measurement. The final tap density was measured after the density did not appear to change, which generally occurred after 3000 taps. From the apparent and tap densities, the Hausner ratio can be calculated using the following equation:
The value of Hausner ratio is classified as follows: > 1.4 are cohesive (group C), 1.25 > > 1.25 are transitional (group A–C), and < 1.25 are considered aeratable (group A).
2.4. Surface Analysis
X-ray photoelectron spectroscopy (XPS) was used to verify the presence of silicon on the particle surfaces from the siloxane coating. The analysis was completed using a spectrophotometer (Kratos Axis Ultra) equipped with a monochromatic Al X-ray source. Each sample was mounted using double-sided tape to adhere the sample to a silicon substrate. Pressure was held at torr throughout the analysis, and a high-resolution scan was collected using a pass energy of 20 eV and a step size of 0.1 eV. Adventitious carbon correction was based on the internal standard of 284.5 for the carbon 1 s peak.
2.5. Fluidization Measurements
A full description of the experimental measurement of can be found in reference [17]. For this manuscript, a brief description is provided. Using a commercially available powder rheometer (FT4 powder rheometer, Freeman Technology, Tewkesbury, UK), pressure drop profiles were measured using a custom gas delivery program developed specifically for identifying the based on a typical profile. The powder is loaded into a glass powder column with an aeration base to deliver the gas at various flow rates. The pressure drop is collected at each individual gas velocity, resulting in a pressure drop profile. A typical profile is shown in Figure 2; when the pressure drop reaches a maxima and begins to level out, the velocity measured at that instance is the minimum fluidization velocity. The full datasets for these measurements can be found in reference [17].
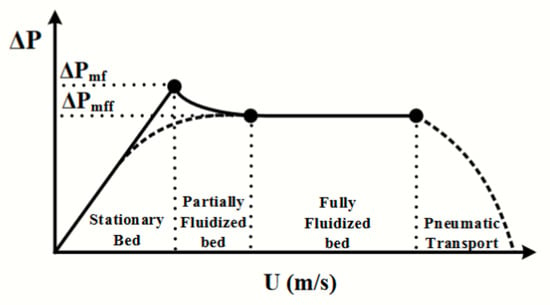
Figure 2.
Typical pressure drop profile observed using a given gas velocity (U) and a measured pressure drop to identify the .
2.6. Dimensional Analysis
To calculate the theoretical for all of samples, Equation (2) was used, which uses the particle and fluid densities (, ), Sauter mean diameter (), and viscosity of the fluid () [21].
The particulate Reynolds (Re) number is defined as the ratio of inertial to viscous forces on the particle as a result of fluidizing gas. This ratio uniquely distinguishes between “laminar” and “turbulent” flow. Systems with very low Reynolds numbers are considered to have laminar flow; in the case of gas-fluidized powder beds, the Reynolds number is generally low, indicating that viscous forces dominate that of inertia, and this is also known as Stokes or “creeping” flow. Components of the Reynolds number include fluid density () and minimum fluidization velocity (), as shown in Equation (3). The drag coefficent is calculated according to Equation (4) which is deemed appropriate for the particle sizes used in our work [21].
The particulate Archimedes (Ar) number is used to characterize powders based on density differences between the fluid and particulate, as shown in Equation (5). Here, the relative importance of the density differences compared to the viscosity of the fluidizing gas can be determined to elucidate which dictates the flow behavior. Large density differences and particle size make the Archimedes number larger, indicating that the fluidizing gas viscous effects are small in comparison. In gas-fluidized particulate systems, the viscosity of the fluid generally dominates the flow because the density of the gas is small compared to the powder. This is consistent with low Reynolds number flows, as described previously based on particle size and fluidizing gas density.
Correlations between the Re and Ar numbers have been reported in the literature, as mentioned in reference [21]. The Ergun equation was originally based on the void fraction , as shown in Equation (6).
A modified Ergun equation was developed to remove the use of voidage, which can be a difficult parameter to measure. Here, the voidage term was replaced by two constants that were approximated from a survey of experimental data, shown as and in Equation (7).
There have been multiple values reported for and in the literature; 30.28 and 0.108 are deemed appropriate for fine particle sizes (<100 μm) and are used in this work.
The Froude (Fr) number represents a qualitative indication of the relative importance of inertial to gravitational forces. Wilhelm et al. reported that the Froude number could be used to differentiate between “particulate” and “aggregative” fluidization regimes [22]. Particulate fluidization is considered a homogeneous, uniform fluidization of the powder bed, whereas aggregative fluidization includes the formation of bubbles and void spaces (Equation (8)).
The granular bond number () was initially developed based on the ratio of gravitational forces and surface tension of a liquid phase flowing through a solid; however, it has been modified for gas–particulate flow [23,24]. This value incorporates the force of cohesion based on the Rumpf model (Hamaker constants) with particle weight, as shown in Equations (9) and (10).
This dimensionless group is one of the few that includes measurable, surface-level properties into its calculation including the cohesion. The flow factor can be calculated experimentally from shear data and represents the ratio of the major principle stress () to the unconfined yield strength () collected as shown in Equation (11). Previous work included measurement of the using the FT4 Powder Rheometer [15].
Table 1 defines the classification of the powders based on the calculated flow factor value. This value physically gives an indication of how susceptible a powder bed is to plastic deformation under the major principle stress. In Capece’s work, he found an experimental relationship based on Equation (12).
The values of and are 15.7 and 0.27, respectively, with a 95% confidence interval [24].

Table 1.
Flow factor classification of powder flowability.
3. Results and Discussion
The basic material properties of the powders used for this study are presented in Table 2. Here, the particle sizing measurements, density, and surface analysis used for all of the calculations for the dimensionless number groups and surface properties are presented. The Sauter mean diameter is typically used for the dimensionless number groups, but the standard presentation of and are provided for reference. The PSD plots for each sample are shown in Figure 3.

Table 2.
Particle sizing measurements, density (kg/m3), and surface silicon content (at.%) for all samples used in this work.
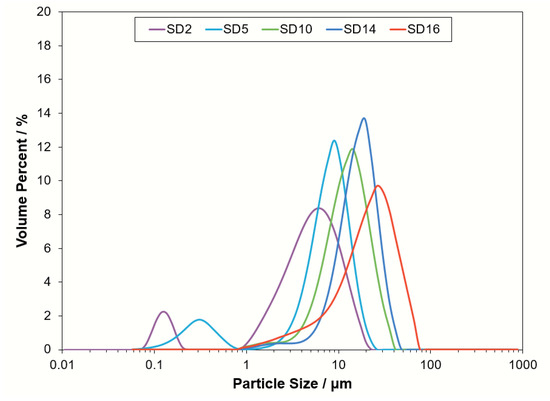
Figure 3.
Particle size distribution plots for SD2, SD5, SD10, SD12, and SD16.
Table 3 reports the calculated values for the theoretical and experimental Re numbers and for all PSDs. The Re numbers fall into Stoke’s law regime (<1) and suggest that the flow around single particles is laminar and dominated by viscous forces of the fluid. When comparing the theoretical and experimental results of the Re number, the experimental results were higher than the experimental results for smaller particle sizes (SD2, SD5), which is not surprising due to the differences in the used in the calculation (Equation (5)). The experimental was higher in all cases; however, the difference lessened as the particle size increased. The theoretical does not consider any factors contributing from cohesive forces, whereas the experimentally measured has contributions from all of the powder properties.

Table 3.
Theoretical and experimentally determined values for (mm/s), Reynolds number (Re), and drag coefficients.
To consider the Ergun equation similarity between the experimental and theoretical values, the Ar number was considered. Although the Ar number does not include the experimentally determined , the comparison of the experimental and predicted Re numbers with the Ergun equation was investigated. The predicted Ar numbers were low (1), indicating that the fluidizing gas viscosity dominates the effects of particle size. As the particle size increased, the Ar number increased due to the contribution of . All drag coefficients () were reduced with increasing particle size, as seen in Table 3. As the is proportional to surface area, this is the expected result with increasing particle size/lower surface area.
A plot of Re vs. Ar is shown in Figure 4, and the Ergun Equation (7) is plotted for reference. The power function generated from the MTES surface-treated powder data shows a similar relationship between the Ar and Re to the modified Ergun equation. The values calculated for treated larger particle sizes are reasonably correlated with the Ergun equation, differing from 3–20% based on the theoretical value. The smaller particles tended to deviate from this line, showing higher-than-anticipated Reynold’s numbers. SD2 and SD5 had the lowest Ar numbers, which is consistent with their low density. The differences observed here are likely a result of the surface treatment. Direct comparison to the untreated particles was not possible due to the non-uniform fluidization of their powder beds during analysis.
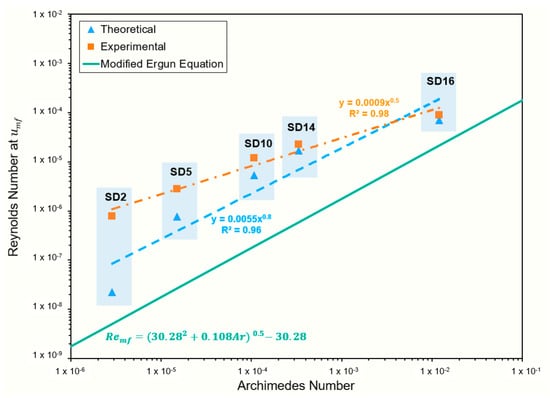
Figure 4.
Plot of relationship between Reynolds and Archimedes numbers, indicating closer agreement to Ergun equation for larger particle sizes (SD10, SD12, SD16) and larger discrepancy for smaller particle sizes (SD2, SD5).
The Froude numbers were calculated using Equation (8), where a value of less than 0.13 indicates particulate fluidization [21]. All of the values calculated for the Froude number were low (<0.13), as revealed in Table 4, indicating that the effect of gravity is more significant than the particle inertia. Interestingly, all particle sizes had values that were close in order of magnitude, unlike the other dimensionless groups, which differed significantly. To corroborate these values, experimental observations showed uniformly fluidized beds, suggesting particulate fluidization.

Table 4.
Theoretical and experimental values of the Froude number, Hausner groups based on density, and the Goosenn’s approximation ().
The Ar number can be used similarly to characterize fluidizable powders based on Hausner’s classification methods. All of the powders measured were classified as group C powders, despite experimental classification as group A and A/C for SD12 and SD16, as revealed in Table 4. The criterion for group A is to achieve an Ar value of greater than 0.97, and the powders studied herein had Ar numbers that were orders of magnitude lower than this value, suggesting their inability to be fluidized based on Geldart’s classification. As described earlier, most surface-treated powders by experimental evaluation showed group-A-like pressure drop profiles, suggesting uniform fluidization [17]. Figure 4 shows the area of Goosenns’s approximation when plotting Re with Ar [25]. Using this approximation, all of the powders fell into the fluidized region, suggesting improved flowability. When compared to the , the powders were all considered cohesive as the Ar numbers were not above 0.97 and the Re numbers were above 0.54 for all of the powder samples.
Capece determined, experimentally with data collected using cohesive and non-cohesive powders with similar particle size to those studied here, that a of >1 corresponded to powders that are considered cohesive, and <1 non-cohesive [24]. The theoretical values of based on experimentally determined values for surface-treated powders of the flow factor for aluminum powders are shown in Figure 5. All powders fell into the non-cohesive category. This suggests that, even though they are classified as cohesive by other methods, the raw powders are non-cohesive by this evaluation. It has been demonstrated previously that the smaller particle sizes studied in this work tend to be labeled as cohesive rather than non-cohesive. This evaluation is one of the few that consider SD2 and SD5 to fall in the non-cohesive category. The general and anticipated trend that the decreases with increasing particle size, however, was observed. As shown numerically in Figure 5, a higher is observed with smaller particle size.
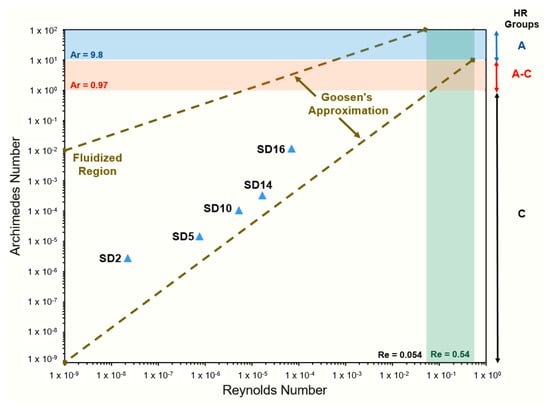
Figure 5.
Trend of decreasing with increasing particle size, consistent with the lowered cohesive forces associated with larger particles.
To investigate the influence of the Hamaker constant (HC) on the , the HCs for alumina and polydimethylsiloxane were used to represent the raw and untreated surfaces. The polymerized form of MTES is a siloxane network, anchored to the particle surface through -OH groups and covalent bonds, as shown in Figure 6. For this reason, PDMS aptly represents a similar surface to our MTES-treated particles. These constants differ by approximately an order of magnitude, at 1.5 × for alumina and 4.5 × for PDMS [26].
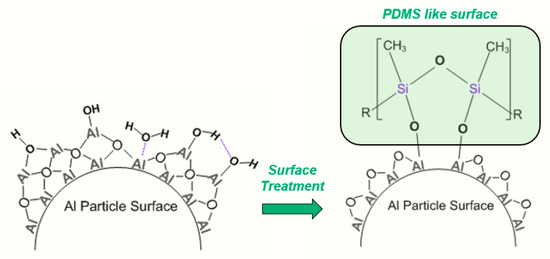
Figure 6.
Pictorial comparison of raw, untreated particle surface with exposed surface -OH and physisorbed molecular water with MTES-coated particle with PDMS-like surface.
As shown in Figure 7, the change in GBN using the alumina HC resulted in a constant increase of about 10% for SD2–SD14, which was the expected result. At the particle size for SD16, there is a large increase of about 57%. Using the PDMS HC, there is a similar trend with a constant increase of about 8%, followed by an increase of 60%. Overall, the general trend of decreased with PDMS was observed and gave us the anticipated result through having a lower . This is a straightforward explanation and supports our results for the Re number calculated using the empirical and theoretical .
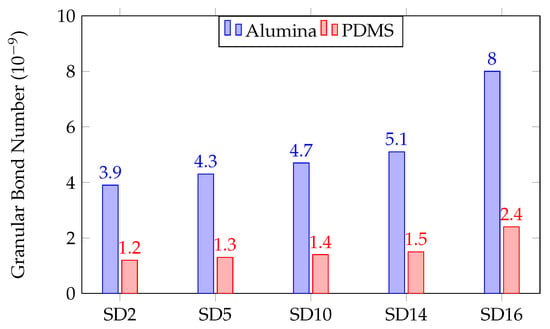
Figure 7.
Bar chart of using HC for alumina and PDMS.
The flow factor was calculated experimentally using powder shear measurements; this can be performed on a variety of different instruments, including rheometers, shear testers, and flow testers. The flow factor gives an indication of how easily a powder will collapse, or the strength of an at-rest, powder column. This property is particularly useful in developing hoppers and capsule-filling devices. For our study, the predicted was compared to the raw and surface-treated powder values. Using the raw powder for calculation of the was not possible due to the non-uniform fluidization using our instrumentation. In this case, the flow factor can be measured through standard shear testing. Figure 8 shows the results for the powders used in this work [27]. As reported in Table 1 in the methods section, the predicted and experimentally determined for raw powders were cohesive and very cohesive for the smaller particle sizes (samples SD2–S10). In all surface-treated cases, the were either easy- or free-flowing.
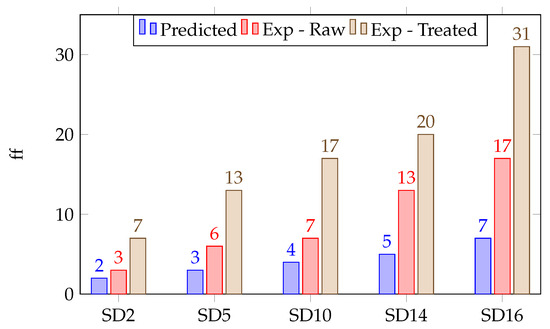
Figure 8.
Bar chart of flow factors for surface-treated powders by predicted (violet), experimental—raw (orange), and experimental—treated (brown).
4. Conclusions
In this work, the ability to evaluate micron-sized, flowable powders using dimensionless number groups with an experimentally and theoretically determined was demonstrated successfully. The theoretical results calculated for all of the dimensionless number groups were all lower than the experimentally determined values. The primary explanation for this is the lack of interparticulate interaction considerations in these equations, which can also be corroborated by using different Hamaker constants.
The results from this work showed that a combination of experimental and theoretical approaches can help predict the powder’s flowability for equipment design. The Re numbers calculated using the experimentally determined for the surface-treated powders were typically higher than the theoretically obtained values by 3–20%, depending on the particle size. This is attributed to the higher calculated by experimental means, likely influenced by interparticulate interactions.
The Fr and number when calculated theoretically were also lower than the experimentally derived value by a few orders of magnitude. All sample values were less than 0.13, indicating particulate fluidization. When considering the , the decreased with increasing particle size, which is the expected result due to the decreased cohesive as a function of particle size. Consideration for the particle surface was also taken into account to help better predict the flow behavior. To conduct a simple comparison, the Hamaker constants for alumina and PDMS were used to show the dependence of on surface properties. In all cases, the was lower for the PDMS representative surface.
The outcomes of this work present some interesting opportunities for prospective follow-on research. Future study should include the use of Buckingham Π analysis to identify other physically relevant quantities and potentially find a general relationship betweenthe groups. Understanding the fundamental premises of flow behavior will provide better design methods for these processes and can have a significant impact on the performance and economical operation of bulk solids handling equipment.
Funding
This material is based upon work supported by the Office of Naval Research under contract No. N00024-12-D-6402, Delivery Order No. 0037.
Institutional Review Board Statement
Not applicable.
Informed Consent Statement
Not applicable.
Data Availability Statement
Data are contained within the article.
Acknowledgments
The author wishes to thank Maria Medeiros for funding this effort and Julie Anderson of the Materials Characterization Laboratory at the Pennsylvania State University for obtaining the SEM images.
Conflicts of Interest
The author declares no conflict of interest. The funders had no role in the design of the study; in the collection, analyses, or interpretation of data; in the writing of the manuscript, or in the decision to publish the results.
Abbreviations and Constants
The following abbreviations are used in this manuscript:
| Granular bond number coefficient (15.7) | |
| A | Hamaker constant (10−19 J) |
| Ar | Archimedes number |
| at.% | Atomic percentage |
| Granular bond number constant (0.27) | |
| Granular bond number | |
| Drag coefficient | |
| dasp | Asperities of diameter |
| dp | Sauter mean diameter (μm) |
| CD | Drag coefficient |
| Flow factor | |
| Force of cohesion | |
| Froude number | |
| g | Gravity (9.8 m/s2) |
| H0 | Separation distance (<20 nm) |
| MTES | Methyltriethoxysilane |
| Fluid viscosity | |
| PDMS | Polydimethylsiloane |
| Fluid density | |
| Particle density | |
| Reynolds number, experimental | |
| Reynolds number, theoretical | |
| Equilibrium separation distance (0.4 nm) | |
| umf | Minimum fluidization velocity |
References
- Miccio, F.; Raganati, F.; Ammendola, P.; Okasha, F.; Miccio, M. Fluidized bed combustion and gasification of fossil and renewable slurry fuels. Energies 2021, 14, 7766. [Google Scholar] [CrossRef]
- Dewettinck, K.; Huyghebaert, A. Fluidized bed coating in food technology. Trends Food Sci. Technol. 1999, 10, 163–168. [Google Scholar] [CrossRef]
- Daud, W.R.W. Fluidized bed dryers—Recent advances. Adv. Powder Technol. 2008, 19, 403–418. [Google Scholar] [CrossRef]
- Ferreira, E.; Dal, M.; Colin, C.; Marion, G.; Gorny, C.; Courapied, D.; Guy, J.; Peyre, P. Experimental and numerical analysis of gas/powder flow for different LMD nozzles. Metals 2020, 10, 667. [Google Scholar] [CrossRef]
- Li, H.; Huang, B.; Wu, M. Experimental and numerical analysis investigations on the flow characteristics within hydrodynamic entrance regions in microchannels. Micromachines 2019, 10, 317. [Google Scholar] [CrossRef] [PubMed]
- Wolfinger, T.; Spreitzer, D.; Schenk, J. Analysis of the Usability of Iron Ore Ultra-Fines for Hydrogen-Based Fluidized Bed Direct Reduction—A Review. Materials 2022, 15, 2687. [Google Scholar] [CrossRef] [PubMed]
- Geldart, D. The effect of particle size and size distribution on the behavior of gas-fluidized beds. Powder Technol. 1972, 6, 201–215. [Google Scholar] [CrossRef]
- Geldart, D. Types of gas fluidization. Powder Technol. 1973, 7, 285–292. [Google Scholar] [CrossRef]
- Geldart, D.; Harnby, N.; Wong, A.C. Fluidzation of cohesive powders. Powder Technol. 1984, 37, 25–37. [Google Scholar] [CrossRef]
- Yang, J.; Sliva, A.; Banerjee, A.; Dave, R.N.; Pfeffer, R. Dry particle coating for improving the flowability of cohesive powders. Powder Technol. 2005, 158, 21–33. [Google Scholar] [CrossRef]
- Spillmann, A.; Sonnenfeld, A.; Von Rohr, P.R. Effect of surface free energy on the flowability of lactose powder treated by PECVD. Plasma Process. Polym. 2008, 5, 743–758. [Google Scholar] [CrossRef]
- Jallo, L.J.; Schoenitz, M.; Dreizen, E.L.; Dave, R.N.; Johnson, C.E. The effect of surface modification of aluminum powder on its flowability, combustion, and reactivity. Powder Technol. 2010, 204, 63–70. [Google Scholar] [CrossRef]
- Chen, Y.; Jallo, L.J.; Quintanilla, M.A.S.; Dave, R.N. Characterization of particle and bulk level cohesion reduction of surface modified fine aluminum powders. Colloids Surf. A Physicochem. Eng. Asp. 2010, 316, 66–80. [Google Scholar] [CrossRef]
- Bao, D.; Sang, L.; Xie, J.; Zhang, H.; Zhang, H.; Zhu, J. Experimental and Calculational Study on Effects of Flow Additive on Flowability of Fine Coating Particles. Processes 2022, 11, 2. [Google Scholar] [CrossRef]
- Ludwig, B.; Miller, T.F. Rheological and surface chemical characterization of alkoxysilane treated, fine aluminum powders showing enhanced flowability and fluidization behavior for delivery applications. Powder Technol. 2015, 283, 380–388. [Google Scholar] [CrossRef]
- Ludwig, B.; Gray, J.L. The effect of gas phase polydimethylsiloxane surface treatment of metallic aluminum particles: Surface characterization and flow behavior. Particuology 2017, 30, 92–101. [Google Scholar] [CrossRef]
- Ludwig, B.; Millington-Smith, D.; Dattani, R.; Adair, J.H.; Posatko, E.P.; Mawby, L.M.; Ward, S.K.; Sills, C.A. Evaluation of the hydrodynamic behavior of powders of varying cohesivity in a fluidized bed using the FT4 Powder Rheometer®. Powder Technol. 2020, 371, 106–114. [Google Scholar] [CrossRef]
- Ludwig, B.; Burke, T.T. Infrared spectroscopy studies of aluminum Oxide and metallic aluminum powders, Part I: Thermal dehydration and decomposition. Powders 2022, 1, 47–61. [Google Scholar] [CrossRef]
- Ludwig, B. Infrared spectroscopy studies of aluminum oxide and metallic aluminum powders, Part II: Adsorption reactions of organofunctional silanes. Powders 2022, 1, 75–87. [Google Scholar] [CrossRef]
- ASTM B527-06; Standard Test Method for Determination of Tap Density of Metallic Powders and Compounds. ASTM: West Conshohocken, PA, USA, 2006.
- Yang, W.C. Bubbling Fluidized Beds. In Handbook of Fluidization and Fluid-Particle Systems; Marcel Dekker: New York, NY, USA, 2007; pp. 53–105. [Google Scholar]
- Wilhelm, R.H.; Kwauk, M. Fluidization of solid particles. Chem. Eng. Process 1948, 44, 201–217. [Google Scholar]
- Nase, S.T.; Vargas, W.L.; Abatan, A.A.; McCarthy, J.J. Discrete characterization tools for cohesive granular material. Powder Technol. 2001, 2, 214–223. [Google Scholar] [CrossRef]
- Capece, M.; Ho, R.; Strong, J.; Gao, P. Prediction of powder flow performance using a multi-component granular Bond number. Powder Technol. 2015, 286, 561–571. [Google Scholar] [CrossRef]
- Goosenns, W.R. Classification of fluidized particles by Archimedes number. Powder Technol. 1998, 98, 48–53. [Google Scholar] [CrossRef]
- Pan, Y.; Khan, N.; Lu, M.; Jeon, J. Organic microelectromechanical relays for ultralow-power flexible transparent large-area electronics. IEEE Trans. Electron Devices 2015, 63, 832–840. [Google Scholar] [CrossRef]
- Jenike, A.W. Storage and flow of solids. In Bulletin of the University of Utah; Utan Engineering Station: Salt Lake City, UT, USA, 1964. [Google Scholar]
Disclaimer/Publisher’s Note: The statements, opinions and data contained in all publications are solely those of the individual author(s) and contributor(s) and not of MDPI and/or the editor(s). MDPI and/or the editor(s) disclaim responsibility for any injury to people or property resulting from any ideas, methods, instructions or products referred to in the content. |
© 2023 by the author. Licensee MDPI, Basel, Switzerland. This article is an open access article distributed under the terms and conditions of the Creative Commons Attribution (CC BY) license (https://creativecommons.org/licenses/by/4.0/).