Article

Analysis of the Influence of Process and Formulation Properties on the Drying Behavior of Pharmaceutical Granules in a Semi-Continuous Fluid Bed Drying System

1
Department of Data Analysis and Mathematical Modelling, BIOMATH, Ghent University, B-9000 Ghent, Belgium
2
Laboratory of Pharmaceutical Process Analytical Technology, Department of Pharmaceutical Analysis, Ghent University, B-9000 Ghent, Belgium
3
Discovery, Product Development & Supply, Janssen R&D, B-2340 Beerse, Belgium
4
UCB Pharma S.A, B-1420 Braine-l’Alleud, Belgium
*
Author to whom correspondence should be addressed.
Powders 2023, 2(2), 232-258; https://doi.org/10.3390/powders2020016
Submission received: 1 February 2023 / Revised: 9 March 2023 / Accepted: 30 March 2023 / Published: 4 April 2023
(This article belongs to the Special Issue Feature Papers in Powders)

Abstract

:
In the last decade, twin-screw wet granulation became an essential technology for continuous pharmaceutical tablet production. Consequently, interest in (semi-)continuous fluidized bed drying systems as a subsequent processing unit has grown. In parallel, it has become pivotal to fully understand and control manufacturing processes in line with in the quality-by-design paradigm. Formulation-generic prediction models would enormously facilitate digitally enhanced process development and require dedicated experimental data collection and process knowledge. To obtain this knowledge, three experimental campaigns were performed in this work. Firstly, an investigation into the effect of dryer process settings on drying behavior is presented. Secondly, the effect of active pharmaceutical ingredient properties on drying was assessed by producing granules of similar particle size and porosity and evaluating their drying and breakage behavior. Finally, additional experiments with varying active pharmaceutical ingredients and drug load were conducted to increase the genericity of the data set. This knowledge can be used in mathematical process modelling.

1. Introduction

A commonly used technique for particle enlargement in pharmaceutical manufacturing is granulation. Based on the European Public Assessments Reports, Leane et al. [1] calculated that 55% of the formulations include a wet granulation step in the tablet manufacturing pathway. At the same time, continuous manufacturing technology has gained interest from pharmaceutical companies, as this production method is supported by the Food and Drug Administration. Since then, the redesign of production processes and the establishment of continuous wet granulation lines in the pharmaceutical industry has manifested itself [2]. However, the number of industrial applications is limited, which highlights the complexity of developing and applying the scientific understanding of this innovative method in actual pharmaceutical products [2,3].
During twin-screw wet granulation (TSWG), powder mixtures are agglomerated into semi-permanent aggregates by means of the addition of a binder and liquid to the processed material [4]. The granulation liquid, together with the binder, binds the powder particles together in the wet granule, through a combination of capillary and viscous forces. Subsequently, more permanent bonds are formed through binder solidification by a pivotal drying step [5]. Despite the requirement of both unit operations in a continuous process line, the scientific literature has mainly focused on the optimization of the granulation settings (liquid-to-solid (LS) ratio, mass flow rate (MFR), screw speed) [6,7,8] or screw configurations [9,10,11]. To the authors’ knowledge, only the studies of De Leersnyder et al. [12] and Ryckaert et al. [13] have experimentally investigated the influence of process parameters on the breakage and drying behavior of pharmaceutical granules in semi-continuous fluid bed drying (FBD) processes after wet granulation.
However, both studies focused on a single formulation, making it difficult to generalize the results. To establish knowledge over a range of formulations, it is important to compare the breakage and drying behavior of multiple formulations. Especially, for the development and validation of generic FBD models, more accurate data, most notably on residual moisture content (RMC) and granule size, are necessary [14]. For this reason, three different experimental campaigns were executed in this study on a continuous TSWG manufacturing device. The first two campaigns had a different focus, allowing us to quantify the impact of, respectively, the process settings and active pharmaceutical ingredient (API) properties on the drying behavior of wet granules. The third campaign aimed to further generalize the data set through adding experiments with different formulations in order to increase the genericity of the data set.

2. Materials and Methods

A ConsiGma™-25 system (GEA engineering, Wommelgem, Belgium) was used to produce and dry the granular material, as described by Fonteyne et al. [15]. This continuous manufacturing equipment is composed of a twin-screw granulator, a six-segmented fluid-bed dryer, and a product control hopper.
All experiments were performed with a fixed excipient base: 30% w / w Pharmatose 200M (DFE Pharma, Goch, Germany), 15% w / w Avicel PH-101 (DuPont, Wilmington, DE, USA), 5% w / w Methocel E15 (DuPont, Wilmington, DE, USA) and 50% w / w API. The API component is the only formulation fraction that cannot be substituted during formulation optimization. To quantify the effect of the API properties on the overall drying behavior, formulations with different components were compared in this study. Furthermore, none of the API components under study exhibit degradation behavior within the temperature range tested.
Before granulation, a batch blending procedure at 25 rpm for 15 min with a 20 L tumbling blender (Inversina-Bioengineering, Basel, Switzerland) was performed with the aforementioned powder mixtures. The load of each batch never exceeded 5 kg, to ensure sufficient free volume during blending.
The preblend was fed into the granulator using a twin-screw loss-in-weight feeder (KT20, K-Tron Soder, Niederlenz, Switzerland). The MFR was evaluated during the J1F50 experiments. However, no major effect was observed with respect to the MFR. Consequently, a fixed MFR value of 20 kg/h was used for the remaining experiments. The temperature of the cooling jacket was kept constant at 25 °C with an active cooling system. The granulator is composed of two co-rotating self wiping screws of 25 mm diameter, with a length-to-diameter ratio of 20:1. The configuration of each screw was composed of four different zones or compartments: an initial zone of conveying elements, followed by two kneading compartments (six kneading elements at 60° forward angle) and a size control compartment (three size control elements at 60° forward angle) right before the granulator outlet. Each compartment was separated by conveying elements of the same length, equal to 1.5 times the diameter of each kneading compartment [16]. The screw speed was kept constant at 675 rpm. The LS ratio was varied according to the research focus of each campaign (see Section 2.1). Distilled water was used as granulation liquid for all experiments since the preblend already contained a dry-added binder component.
After granulation, the wet granules were pneumatically transferred to the six-segmented fluid bed dryer. The inlet air temperature was varied between 40 °C and 60 °C, while the inlet airflow was kept constant at 400 m 3 /h. A fixed nominal value for the inlet airflow was used during this study to limit the experimental workload. However, during each experiment, the fluidization quality was checked and found to be acceptable by visual assessment. Additionally, before each experimental run, a preheating period in an empty dryer was performed to ensure a stable environment in terms of inlet air temperature and velocity from the beginning of the run. Furthermore, each first-filled cell after start-up or a change in granulator settings was considered as a waste cell on which no samples were collected.
After the desired drying time had elapsed, the dried granules were removed from the dryer and pneumatically transferred to the product control hopper, where they were collected for further granule characterization. The contents of one drying cell were considered to be one population, representative of the drying process.

2.1. Experimental Design

In this study, three experimental campaigns, each with a different focus, were conducted. Different active pharmaceutical ingredients (APIs) with different material properties were used to perform the experiments. The APIs used are denoted by J1, J2, J3, U1, U2 or G1. An overview of the API properties, scaled between zero and one, is given in Table A1. To further distinguish clearly the powder mixtures used, the filling grade (semi-fine SF, fine F, regular R, or dense D) and API loading (mass percentage) were also added to the formulation code per experiment.

2.1.1. Impact of Process Parameters

The first experimental campaign was performed to unravel the effect of the different process settings on the overall drying behavior of pharmaceutical granules. The selected APIs, J1F50, and U1R50 are both highly soluble in water, as this property facilitates the production of granules by the TSWG process.
A two-level full factorial design for two factors ( 2 2 ) was used for this set of drying experiments. The factors were the inlet air temperature and the fill level of the drying cells. Furthermore, three centerpoint runs were included to measure process reproducibility and inherent variability. This design of experiments (DoE)DoE was performed for both formulations at two LS ratios close to the limits of the formulation-specific workable LS ratio. Table A2 summarizes the performed experiments for the first campaign. Furthermore, the order of execution was randomized to avoid bias.
To evaluate the effect of drying time on the RMC, granules were sampled at four different drying times. To obtain an estimation of the granule moisture content at the beginning of the drying process, the shortest drying time was set as 20 s after the filling time. The filling time is the time necessary to fill one drying cell and can be calculated by dividing the desired fill level with the MFR. The longest drying time was equal to six times the filling time due to the design and working principle of the equipment. However, to allow for the continuous flow of material, the total drying time had to be slightly reduced. Evaporation is an endothermic process, resulting in a decrease of both the bed and outlet air temperature when wet granules are being dried. After evaporation, the granules will heat up, because the drying rate on the surface of the granules is faster than the diffusion of water from inside the granules to the surface. Both, the second and third data points are taken before the bed temperature in the cell started to increase. This way, it could be assumed that the granules still contained moisture after sampling. Thus, taking samples of the granules at these drying times provided relevant information about the drying process. The granule temperature profile of the longest drying experiment was used to define these two sampling times (Figure 1). A summary of the first campaign experiments with their corresponding drying times is provided in Table A2.

2.1.2. Impact of API Properties

To unravel the effect of API properties on the drying behavior of wet granules, a second experimental campaign with varied drug characteristics was performed. The U2R50 and U2SF50 blends were more hydrophilic compared to the hydrophobic G1R50 formulation. U2R50 and U2SF50 were blends with the same API but varied milling grades; in this way, differences in flowability could be observed.
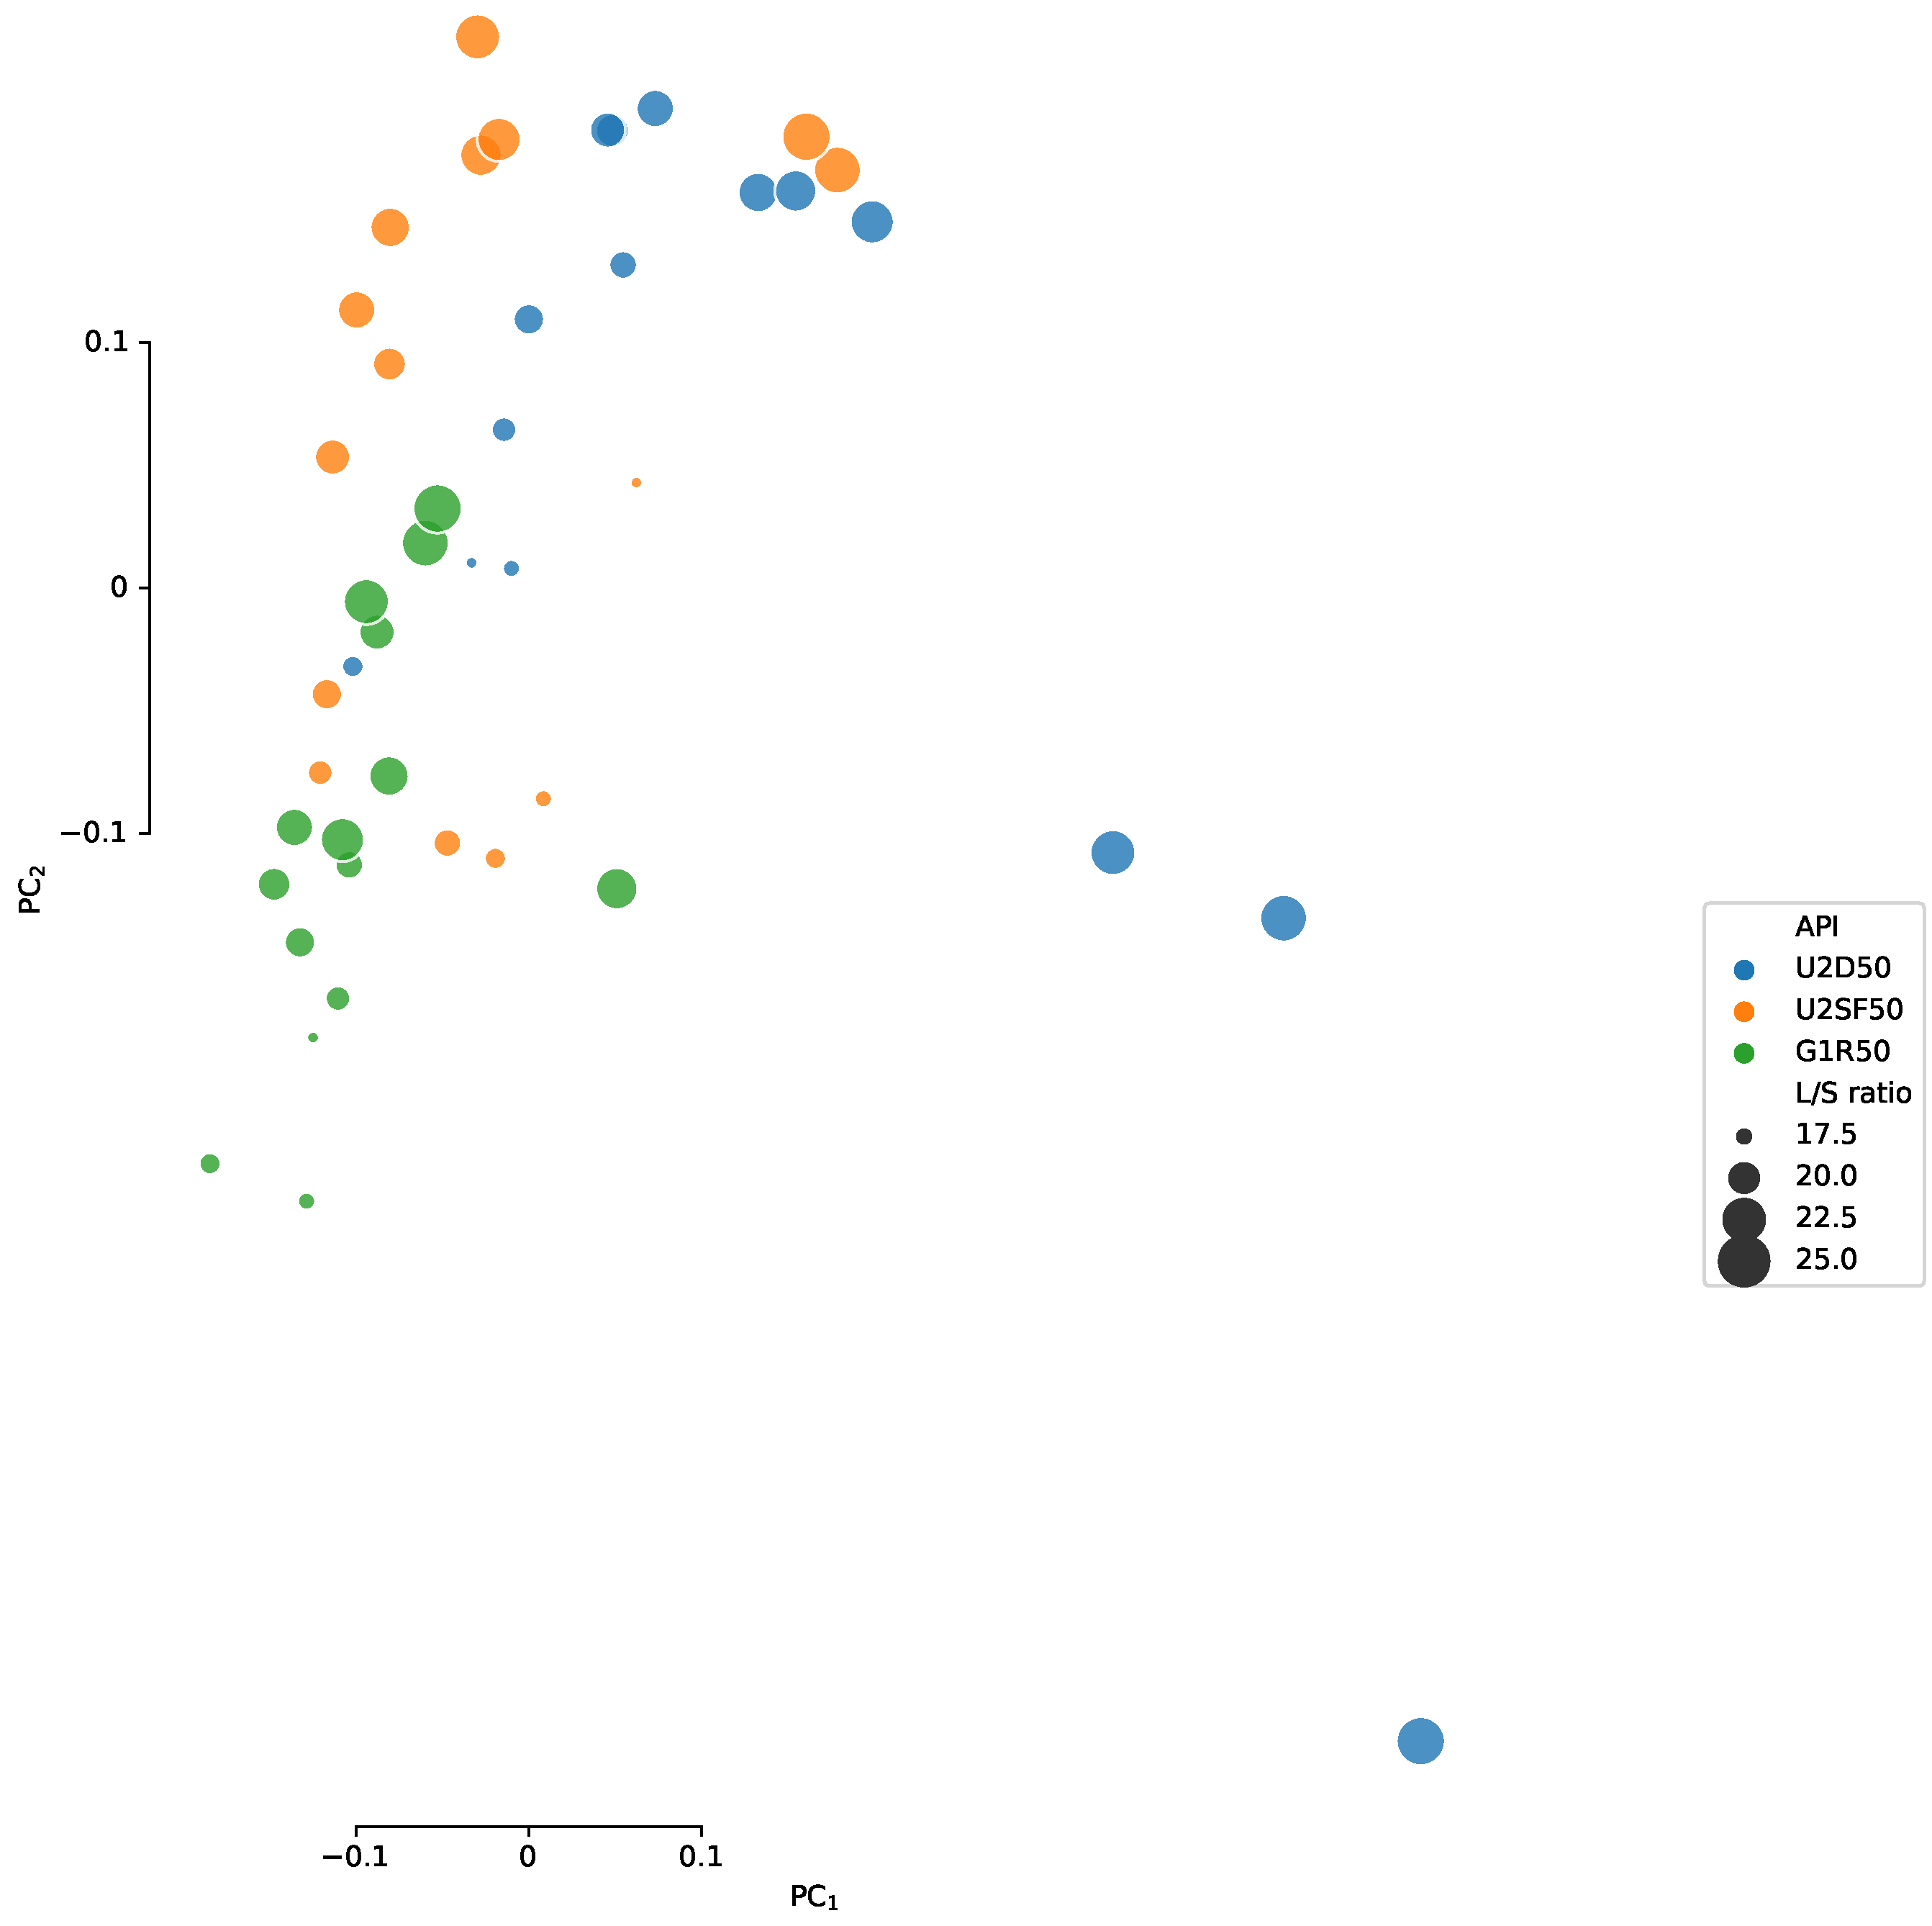
To isolate the effect of API, granules with similar properties needed to be created with the various blends. Preliminary granulation experiments, with a step-wise increase of the LS ratio at increments of 0.5% w / w , were conducted to determine those granulation settings at which granules with similar granule properties could be obtained (e.g., granule size distribution (GSD), granule porosity and initial moisture content). The LS ratio was varied between 18 and 25% w / w and within this range granules could be produced for all formulations in study. Next, the volume-based GSDs were subjected to the kernel principle component analysis (KPCA) technique, by which the distributions were transformed into a single point in a dimensional space described by principal components [17]. The results are visualized in Figure A1.
The maximum mean discrepancy (MMD) is a distance-measure between distributions, which is defined as the squared distance between their embeddings in a dimensional space [18]. The more similar the distributions are, the lower the MMD value is. The MMD was calculated between the distributions obtained with the same granulation settings, Figure A2. Those granulation settings for which the MMD is the lowest have the most similar GSD [17]. Based on this analysis, the LS ratios of 18.5% w / w , 19.5% w / w and 21.5% w / w were chosen to perform the drying experiments.
It is assumed that the same LS ratio results in a similar initial moisture content. Furthermore, based on expert knowledge, it was assumed that using the same LS ratio also resulted in similar granule porosity values after granulation. This was additionally measured and confirmed using He-pycnometry (Accupyc 1330 pycnometer, Micromeritics Instruments Inc., Norcross, GA, USA).
The experimental plan of the second campaign investigated trends in the drying behavior of the granules under investigation, by varying the LS ratio, fill level and inlet air temperature. The inlet air temperature was varied from 40 °C to 60 °C and the filling degree from 500 g to 1000 g. Each process setting was varied one by one while the other process settings were kept at the values of the baseline experiment. An LS ratio of 21.5% w / w and inlet air temperature of 40 °C were chosen for this experiment. To minimize material consumption, a fill level of 500 g was used in the baseline experiment. Three repetitions were conducted of this experiment in order to have a measure of the experimental variability. Table A3 gives an overview of the conducted experiments during the second experimental campaign.
To analyze the drying curves, different samples were taken at different drying times during each experiment. These sample points were determined similarly to the method used in the first experimental campaign. However, in this case, only the baseline experiments were used to determine the sample times. Subsequently, the same time steps were used, making a one-to-one comparison between the different experiments possible.

2.1.3. Generalisation of the Data Set

A third experimental campaign was conducted to further increase the generic nature of the data set with the aim to enable the development of a mathematical model that predicts the drying process based on the API properties. Additionally, these experiments could also be used to confirm previously observed phenomena or to validate drying model predictions. Experiments for three additional blends were performed: J1R50, J2F5, and J3R50. Within the previously tested process settings ranges, three additional experiments were defined for each blend. One experiment where a slow drying rate was expected, one where this rate was expected to be fast, and an intermediate situation. The J2F5 experiments were performed with a 5% drug load to diversify the overall data set. An overview of the conducted experiments is given in Table A4.

2.2. Granule Size Measurements

Granule size was analyzed via dynamic image analysis (frame rate 70 Hz) using the QICPIC™ system (Sympatec, Clausthal-Zellerfeld, Germany) equipped with a vibrating dosing unit (VIBRI/L™) for gravimetrical feeding of the granules (feed rate 20%. The WINDOX software (Sympatec, Clausthal-Zellerfeld, Germany) was used, to report the measured GSD, visualizations were made in Python using the Seaborn package [19].

2.3. Residual Moisture Content

The RMC of the dried samples was determined using the loss-on-drying (LoD) method. Immediately after sampling at the hopper, the dried granules were sieved using a sieve tower (mesh sizes of 150 μm, 300 μm, 710 μm, 1000 μm, 1400 μm, 1700 μm, 2000 μm and 3150 μm). Subsequently, for each size class, a representative sample was taken and weighed ( m 1 ). Then, the dishes were placed in an oven (Memmert N60, Memmert GmbH+Co.KG, Schwabach, Germany) for at least 24 h at 105 °C after which they were reweighed ( m 2 ). Of each measured weight, the mass of the aluminum dish ( m 0 ) was subtracted after which the LoD ( % w / w ) could be calculated according to Equation (1).
L o D = ( m 1 m 0 ) ( m 2 m 0 ) m 1 m 0

2.4. Flowability Test

The granule flowability was characterized using the GranuHeap™ (Granutools, Belgium), an automated heap shape measurement method. At the start of the measurement, a cylindrical tube was loaded with a volume of powder (60 mL) and lifted at a constant speed of 5 mm/s, resulting in a granule heap on the support plate. Next, an image recognition algorithm was used to determine the angle of the isosceles triangle or Angle of Repose (AoR) from 17 pictures, each taken with an angular difference of 10.5°. In addition, during the same measurement, the static cohesive index, a measure for the cohesive strength of the granules, was quantified. The static cohesive index indicates the deviation between the real heap interface and the isosceles triangular heap.

2.5. Friability Test

To quantify the mechanical stability, the friability (F) was measured by using a friabilator (Pharma Test Friabilator, PTFE, Hamburg, Germany) equipped with an abrasion drum. During this procedure, 10 g of granules ( m F , 1 ) with a granule size above 250 μ m and 200 glass beads (diameter: 4 mm, mass: 8.5 mg) were rotated for 10 min at 25 rpm in the abrasion drum. Afterward, the glass beads and the fraction with diameter smaller than 250 μ m were separated by sieving. The remaining granules were reweighed ( m F , 2 ). With m F , 1 and m F , 2 , F can be computed as expressed in Equation (2).
F = m F , 1 m F , 2 m F , 1 × 100 .

3. Results and Discussion

The experimental results of the first (Section 2.1.1) and second (Section 2.1.2) experimental campaigns are discussed in Section 3.1, Section 3.2, Section 3.3 and Section 3.4. The experimental results are presented and discussed by data type, i.e., GSD, RMC, flowability, and friability, respectively. Subsequently, Section 3.5 discusses the experimental results of the third campaign (Section 2.1.3) in which the previously described consistent drying behavior of pharmaceutical granules was verified for three new formulations.

3.1. Granule Size Distribution

The GSDs were visualized for all experiments in function of the drying time. Note that the filling time was varied during the experiments as it is proportional to the desired fill level of the drying cell. To allow comparison between the experiments, all results were reported as a function of absolute drying time after cell filling.
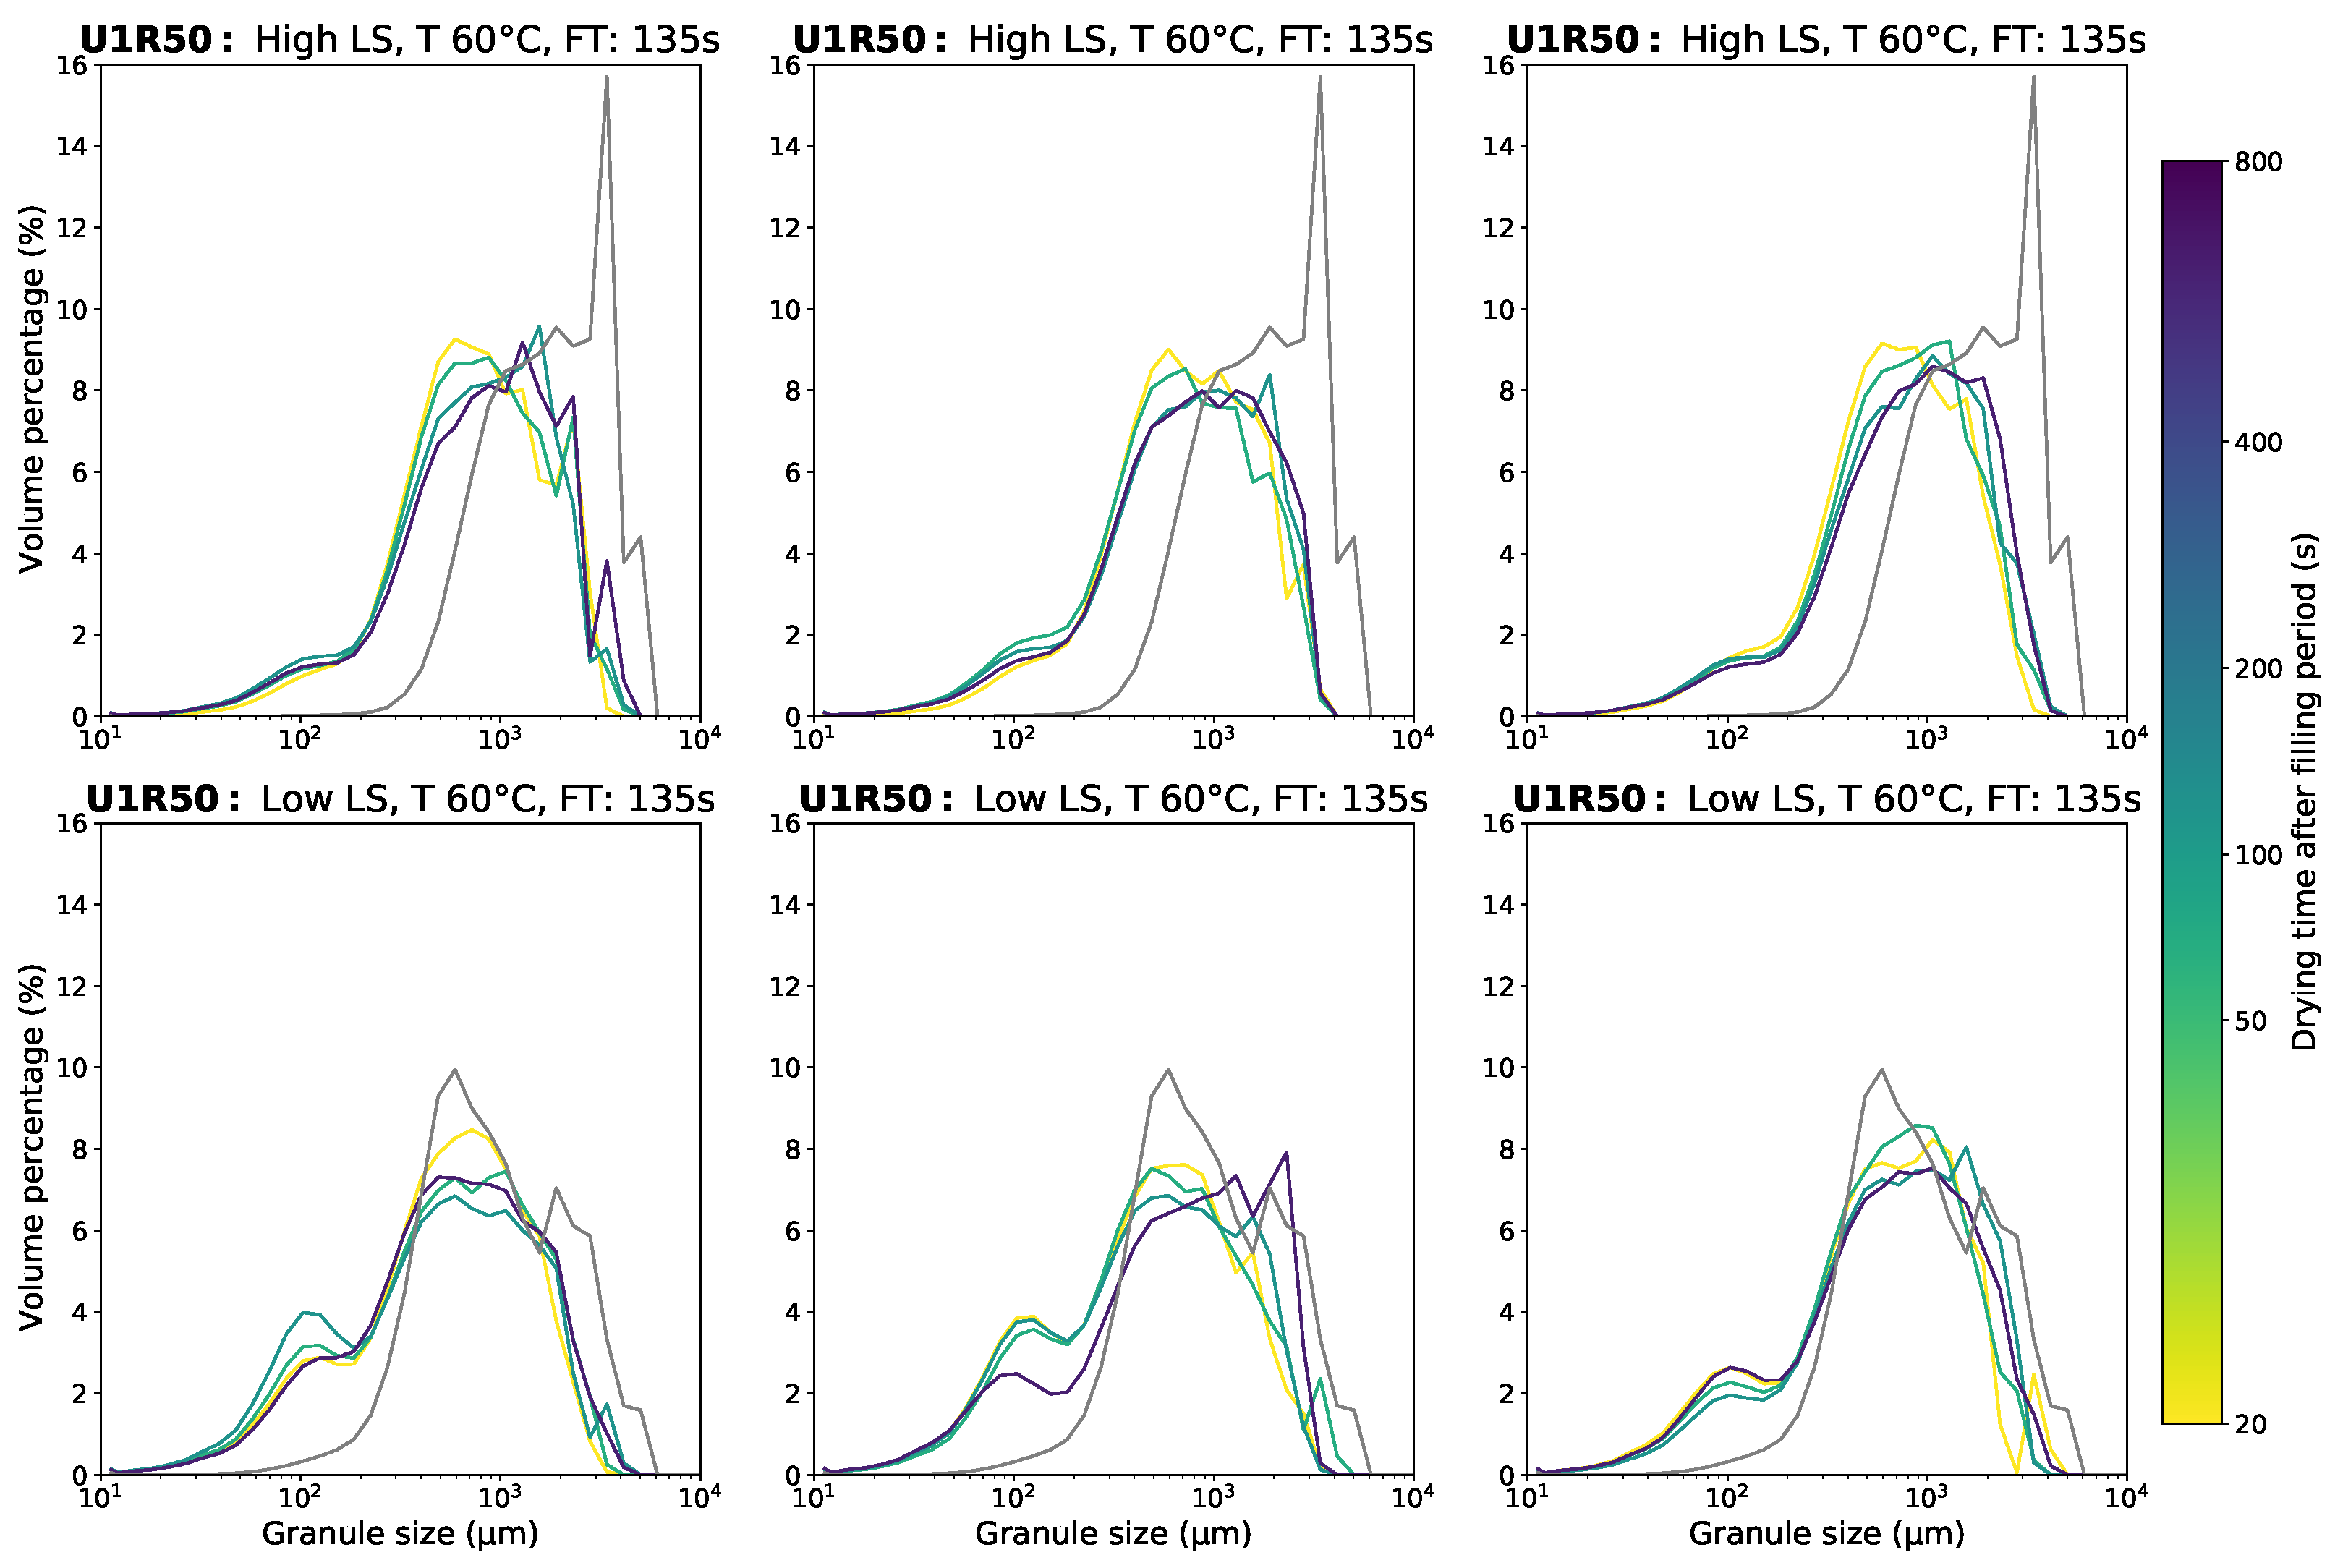
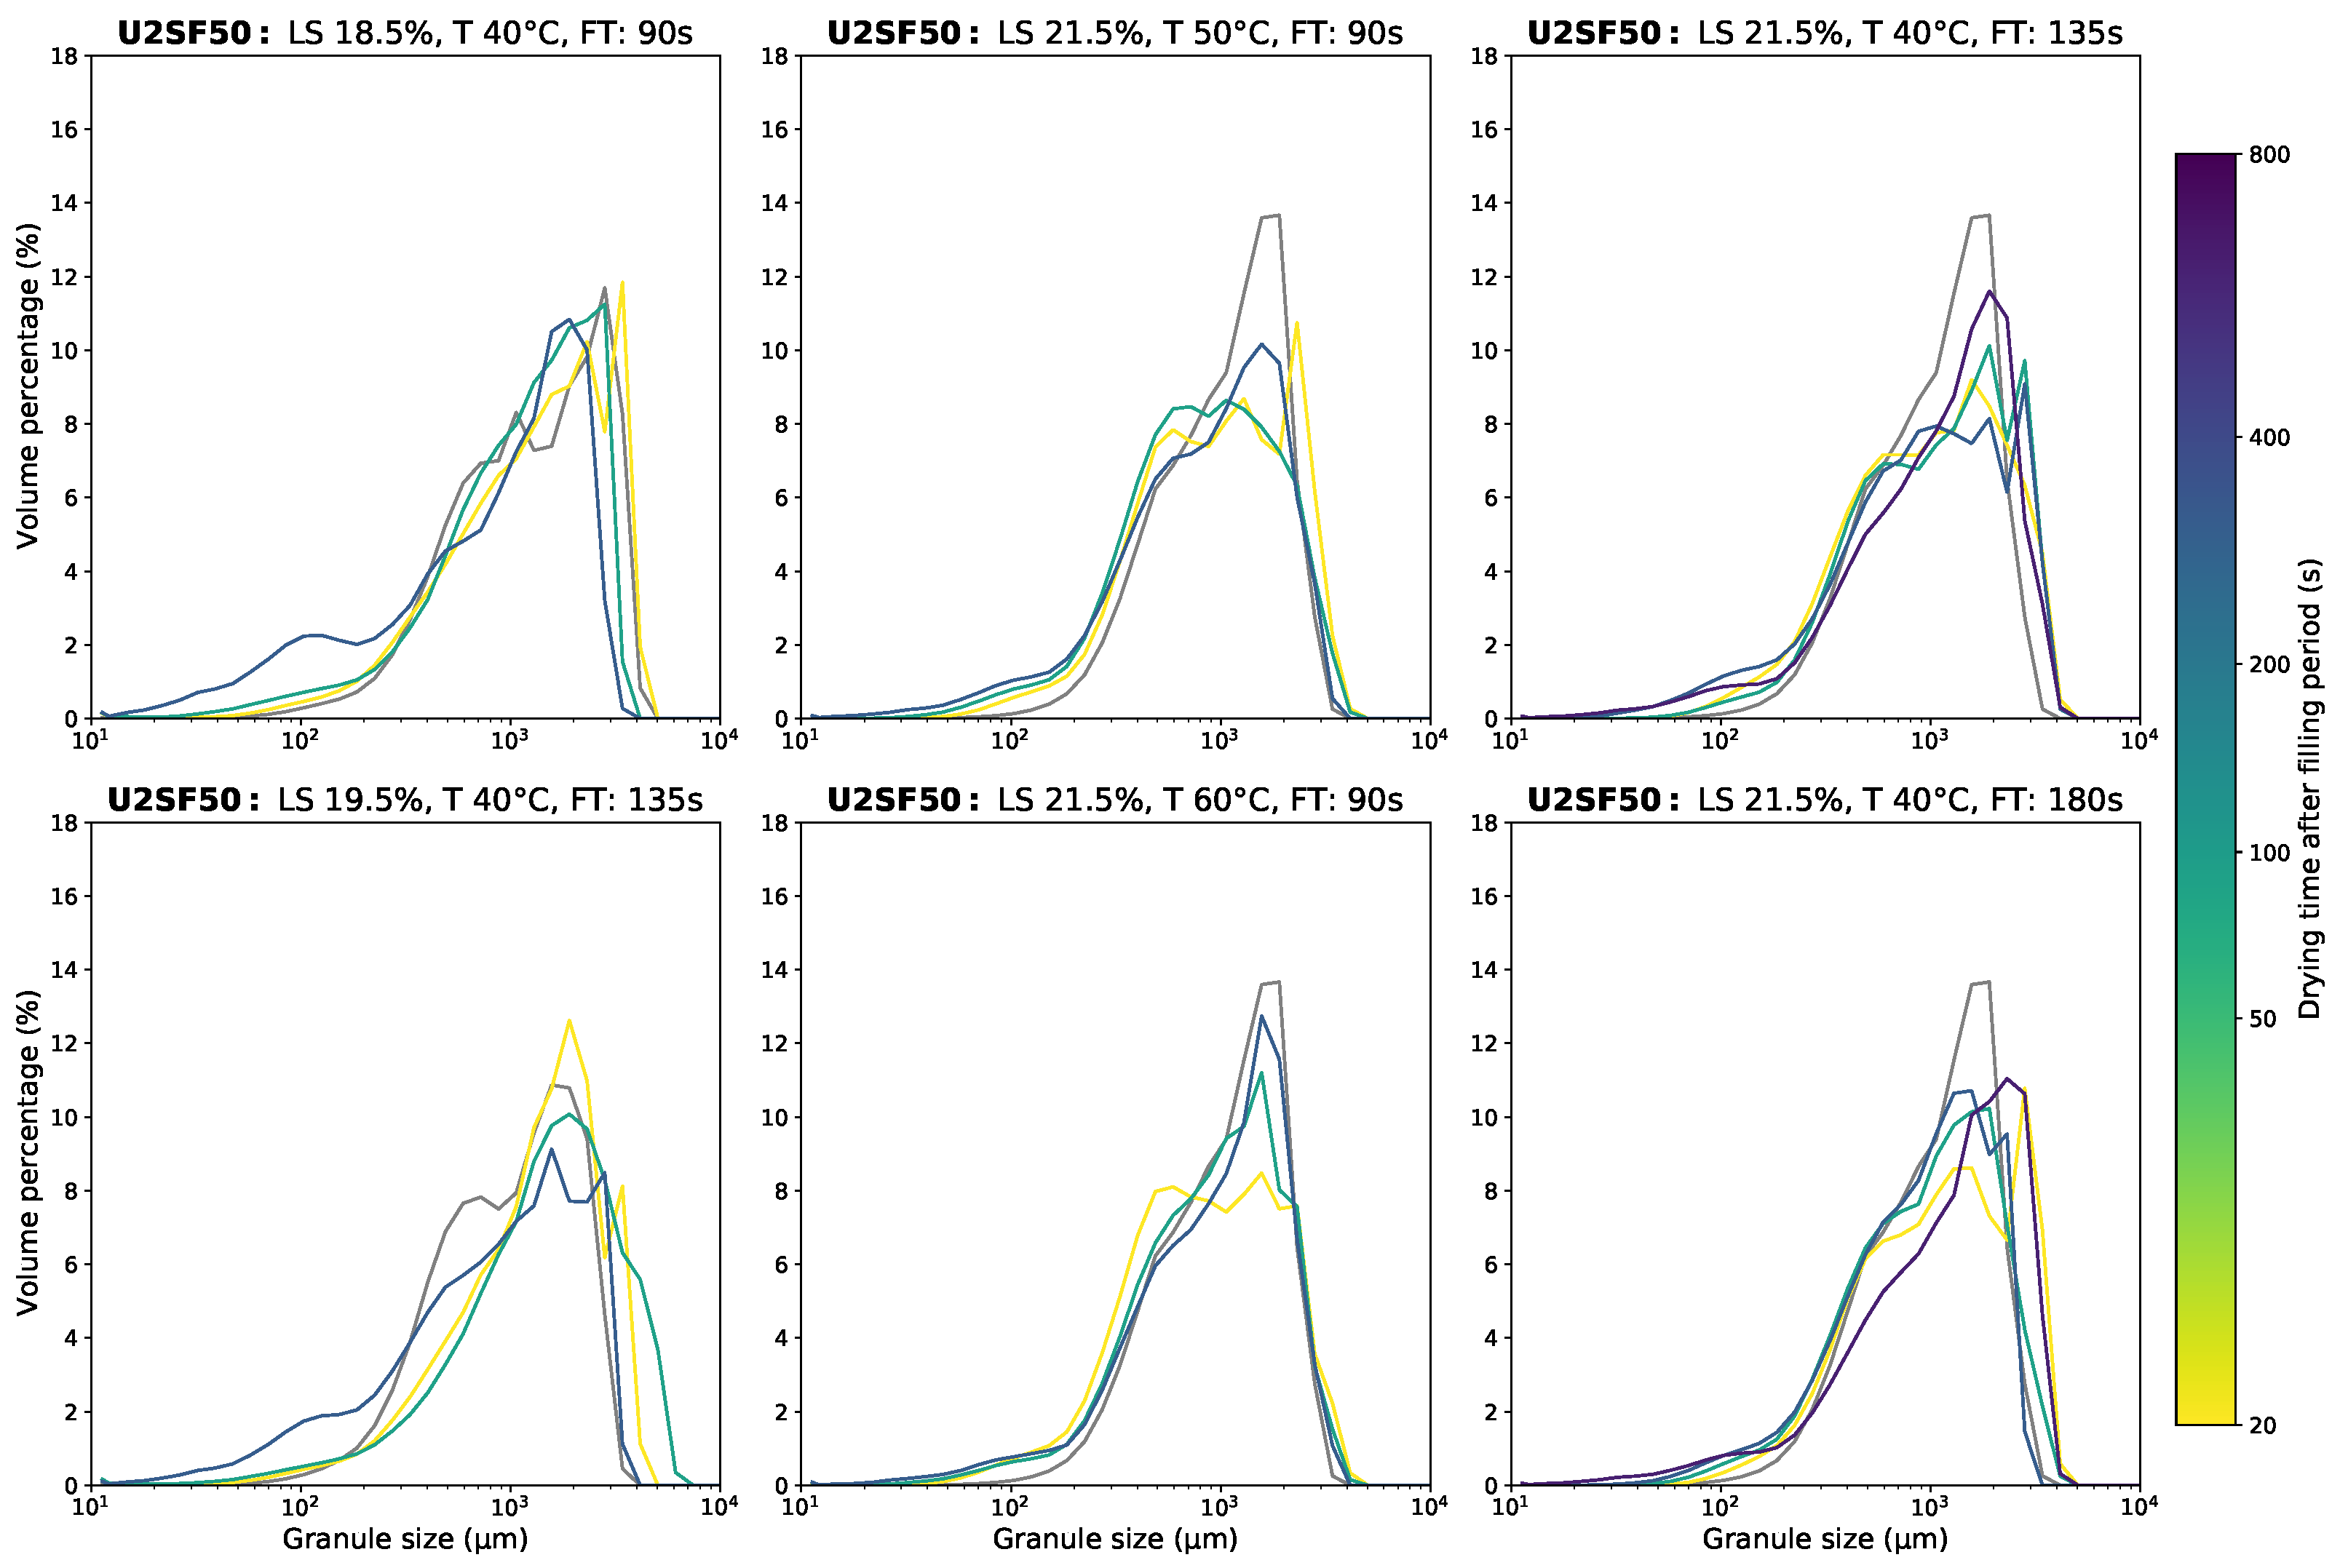
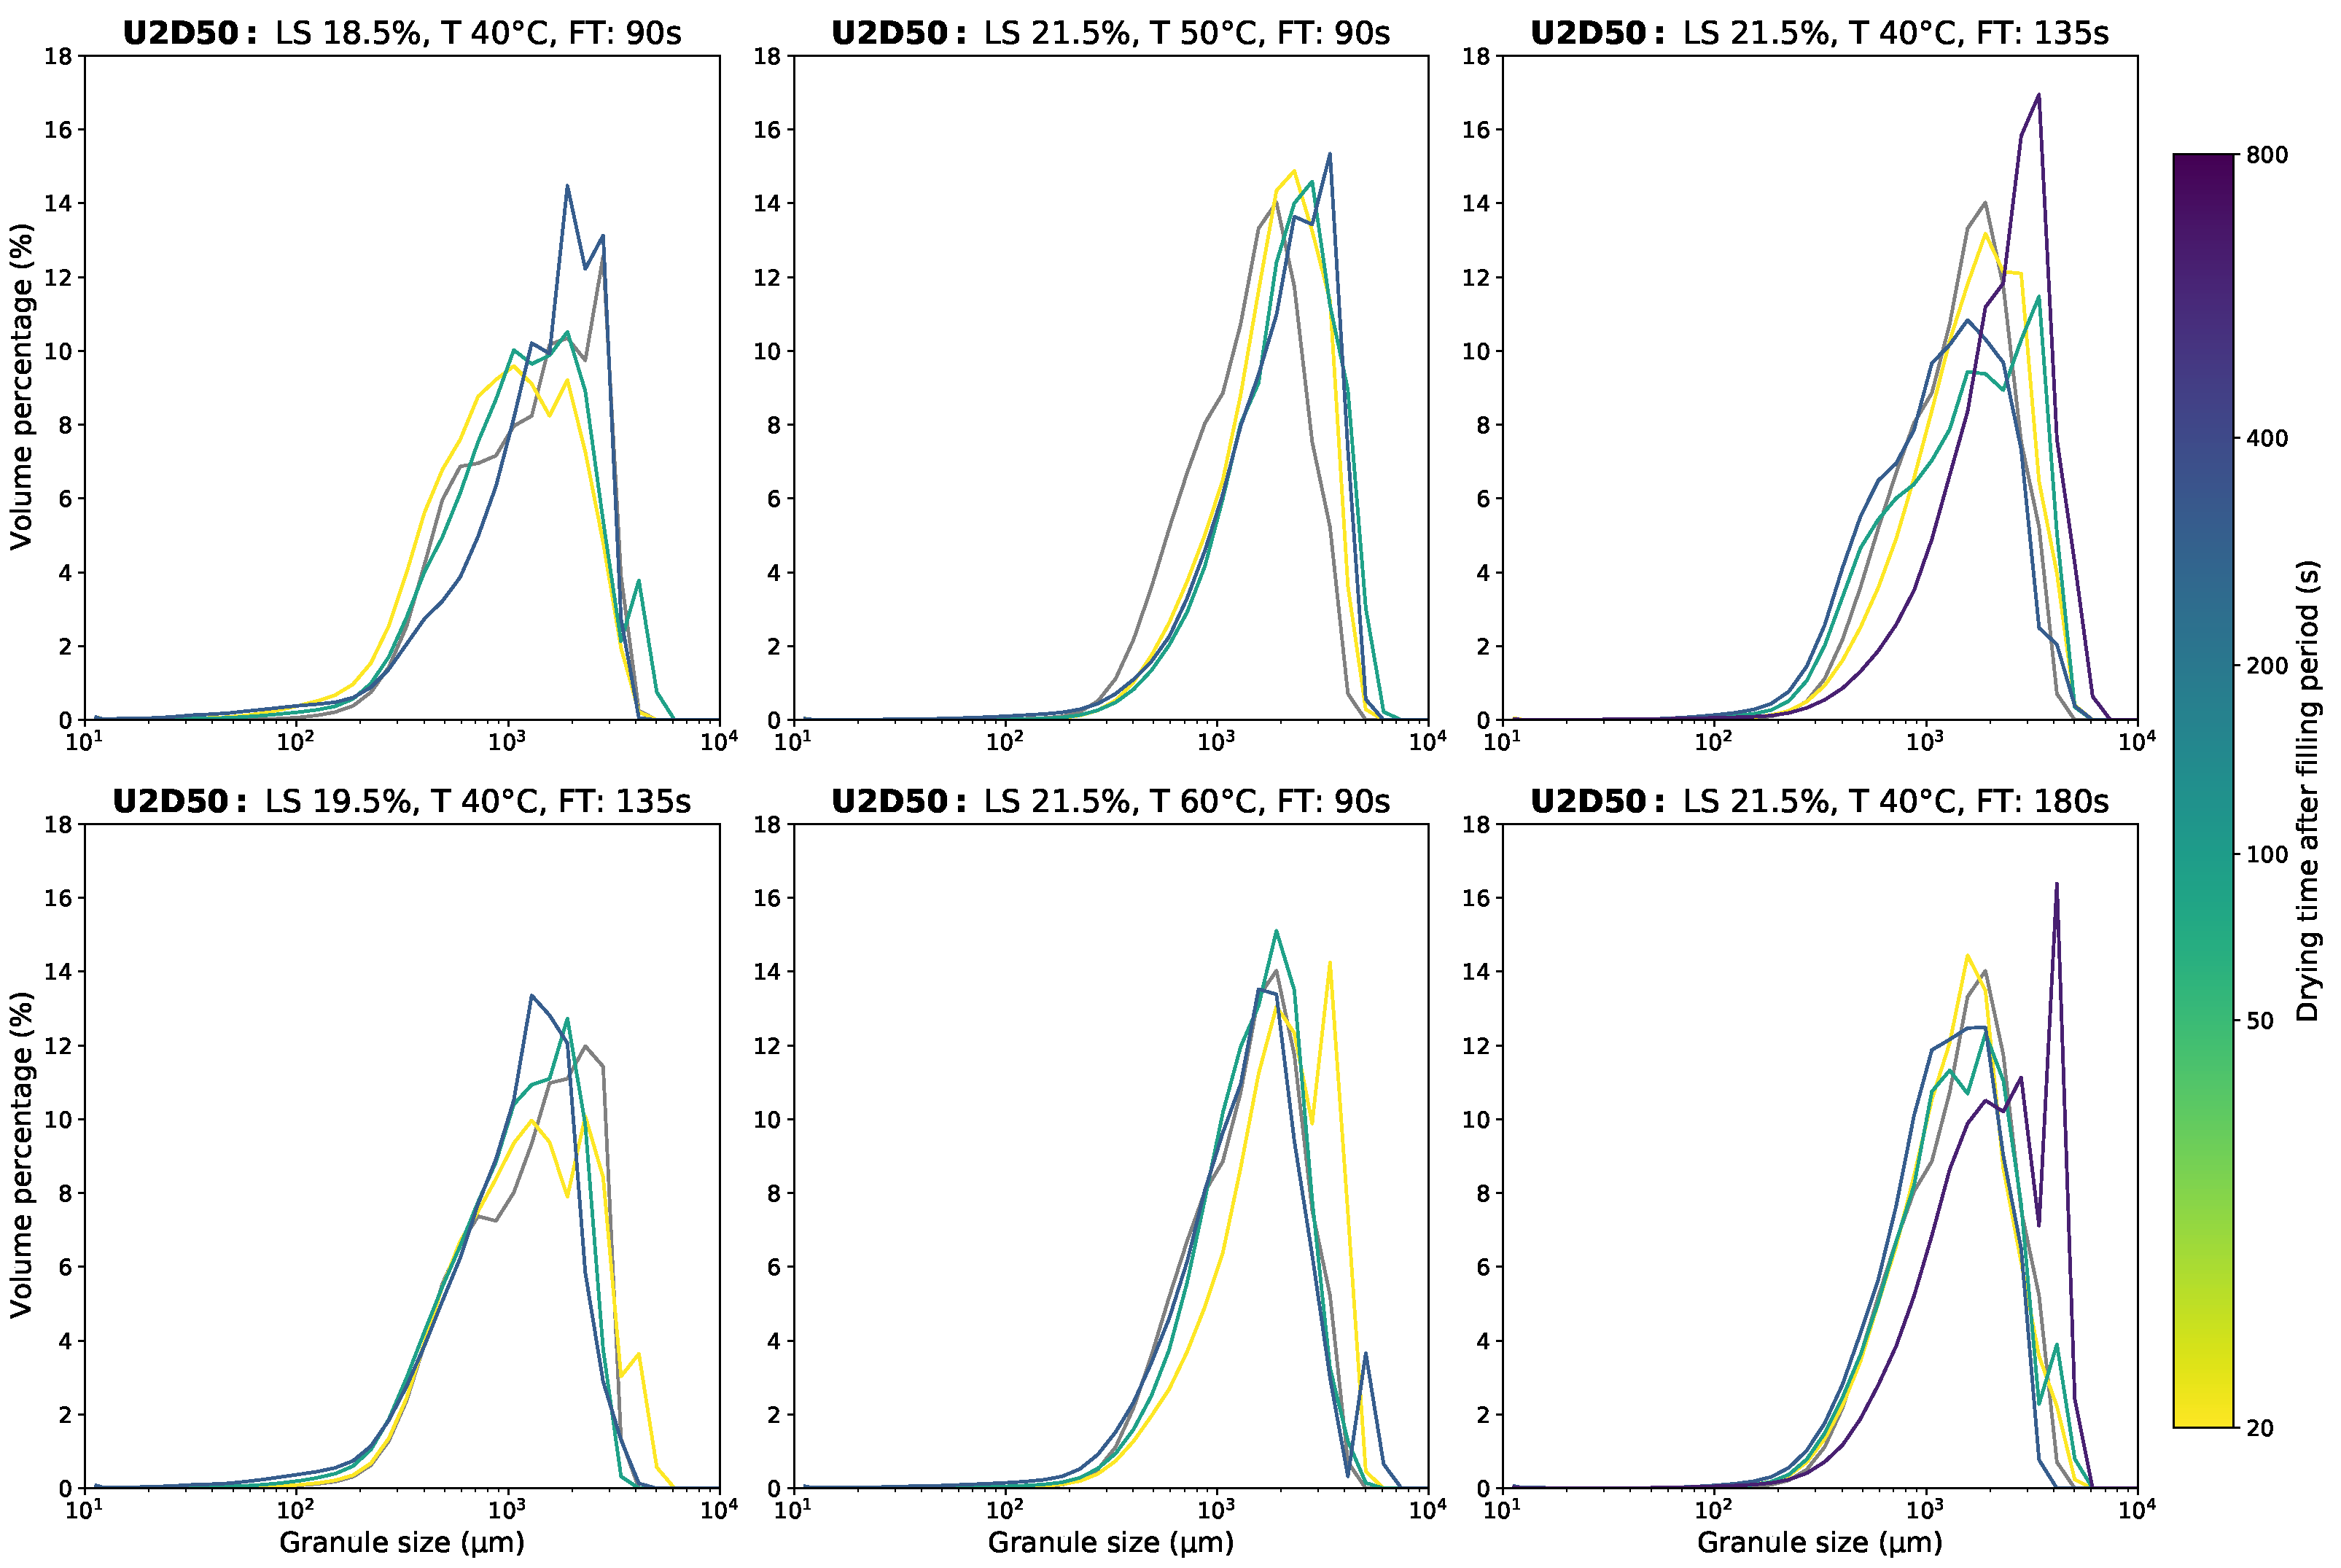
Furthermore, for each experiment, a comparison was made with the oven dried GSD collected at the outlet of the granulator, the initial GSD. This GSD provides a good indication of the GSDs that were entering the ConsiGma™-25 drying system excluding the impact of the wet transfer line. Only the J1F50 experiments are shown in this section, Figure 2 and Figure 3. A full overview of the results can be found in Appendix D.1 (Figure A3, Figure A4, Figure A5, Figure A6, Figure A7, Figure A8, Figure A9 and Figure A10). For each formulation, the center point experiments were reported separately so that a measure of repeatability could be observed easily.
Furthermore, a modified screw configuration was used for the U1R50 experiments, which is different from the one discussed in Section 2. Although the screw configuration was very similar, the size-control compartment was excluded during the U1R50 experiments. The length and sequence of the other screw compartments remained unchanged concerning all other formulations. This adaption was necessary to obtain usable U1R50 granules for the corresponding drying experiments. Further investigation into the effect of formulation properties on the granulation behavior was considered to be beyond the scope of this study due to the focus on the FBD process.
For all experiments, even those with a short drying time, an increase in fine material was observed compared to the samples taken at the outlet of the granulator. This indicates that breakage and attrition occurs after the granulation process. However, this breakage and attrition cannot be directly ascribed to the drying stage only, since two pneumatic transfer lines were also involved prior to sampling. These are the wet and dry transfer lines before and after the fluidization process, respectively. If the breakage and attrition are caused by the drying process, the fines fraction should increase in function of drying time.
However, an increase of the fines fraction in function of process time is not observed. From the experiments with varied granulation settings (Figure 2) it can be seen that breakage and attrition were much more pronounced for the low LS granules in comparison to the high LS granules. Badawy and Pandery [20] reported that wet granules are more prone to plastic deformation as opposed to breakage and attrition. This results in less breakage in the wet transfer line and early in the drying process. During the drying process, liquid bridges will be solidified, resulting in strong interparticle bridges. This process is more pronounced at high LS ratios, as more liquid bridges are present. The solidified interparticle bridges contribute to a higher granule strength at the later stage of the drying cycle or the dry transfer line. It seems that an optimal moisture content, to minimize breakage by pneumatic transport, could be reached. At that point, an optimal granule strength was obtained: a balance between weakly bound wet granules and overly brittle dry granules. This observation is in line with the work of Ryckaert et al. [13], who stated that the extent of breakage and attrition caused by the dry transfer line is positively correlated to the RMC of the granules above the optimal moisture content for granule strength. Furthermore, Ryckaert et al. [13] demonstrate that the dry transfer line generates extensive breakage, as the drying cells are forcefully emptied pneumatically.
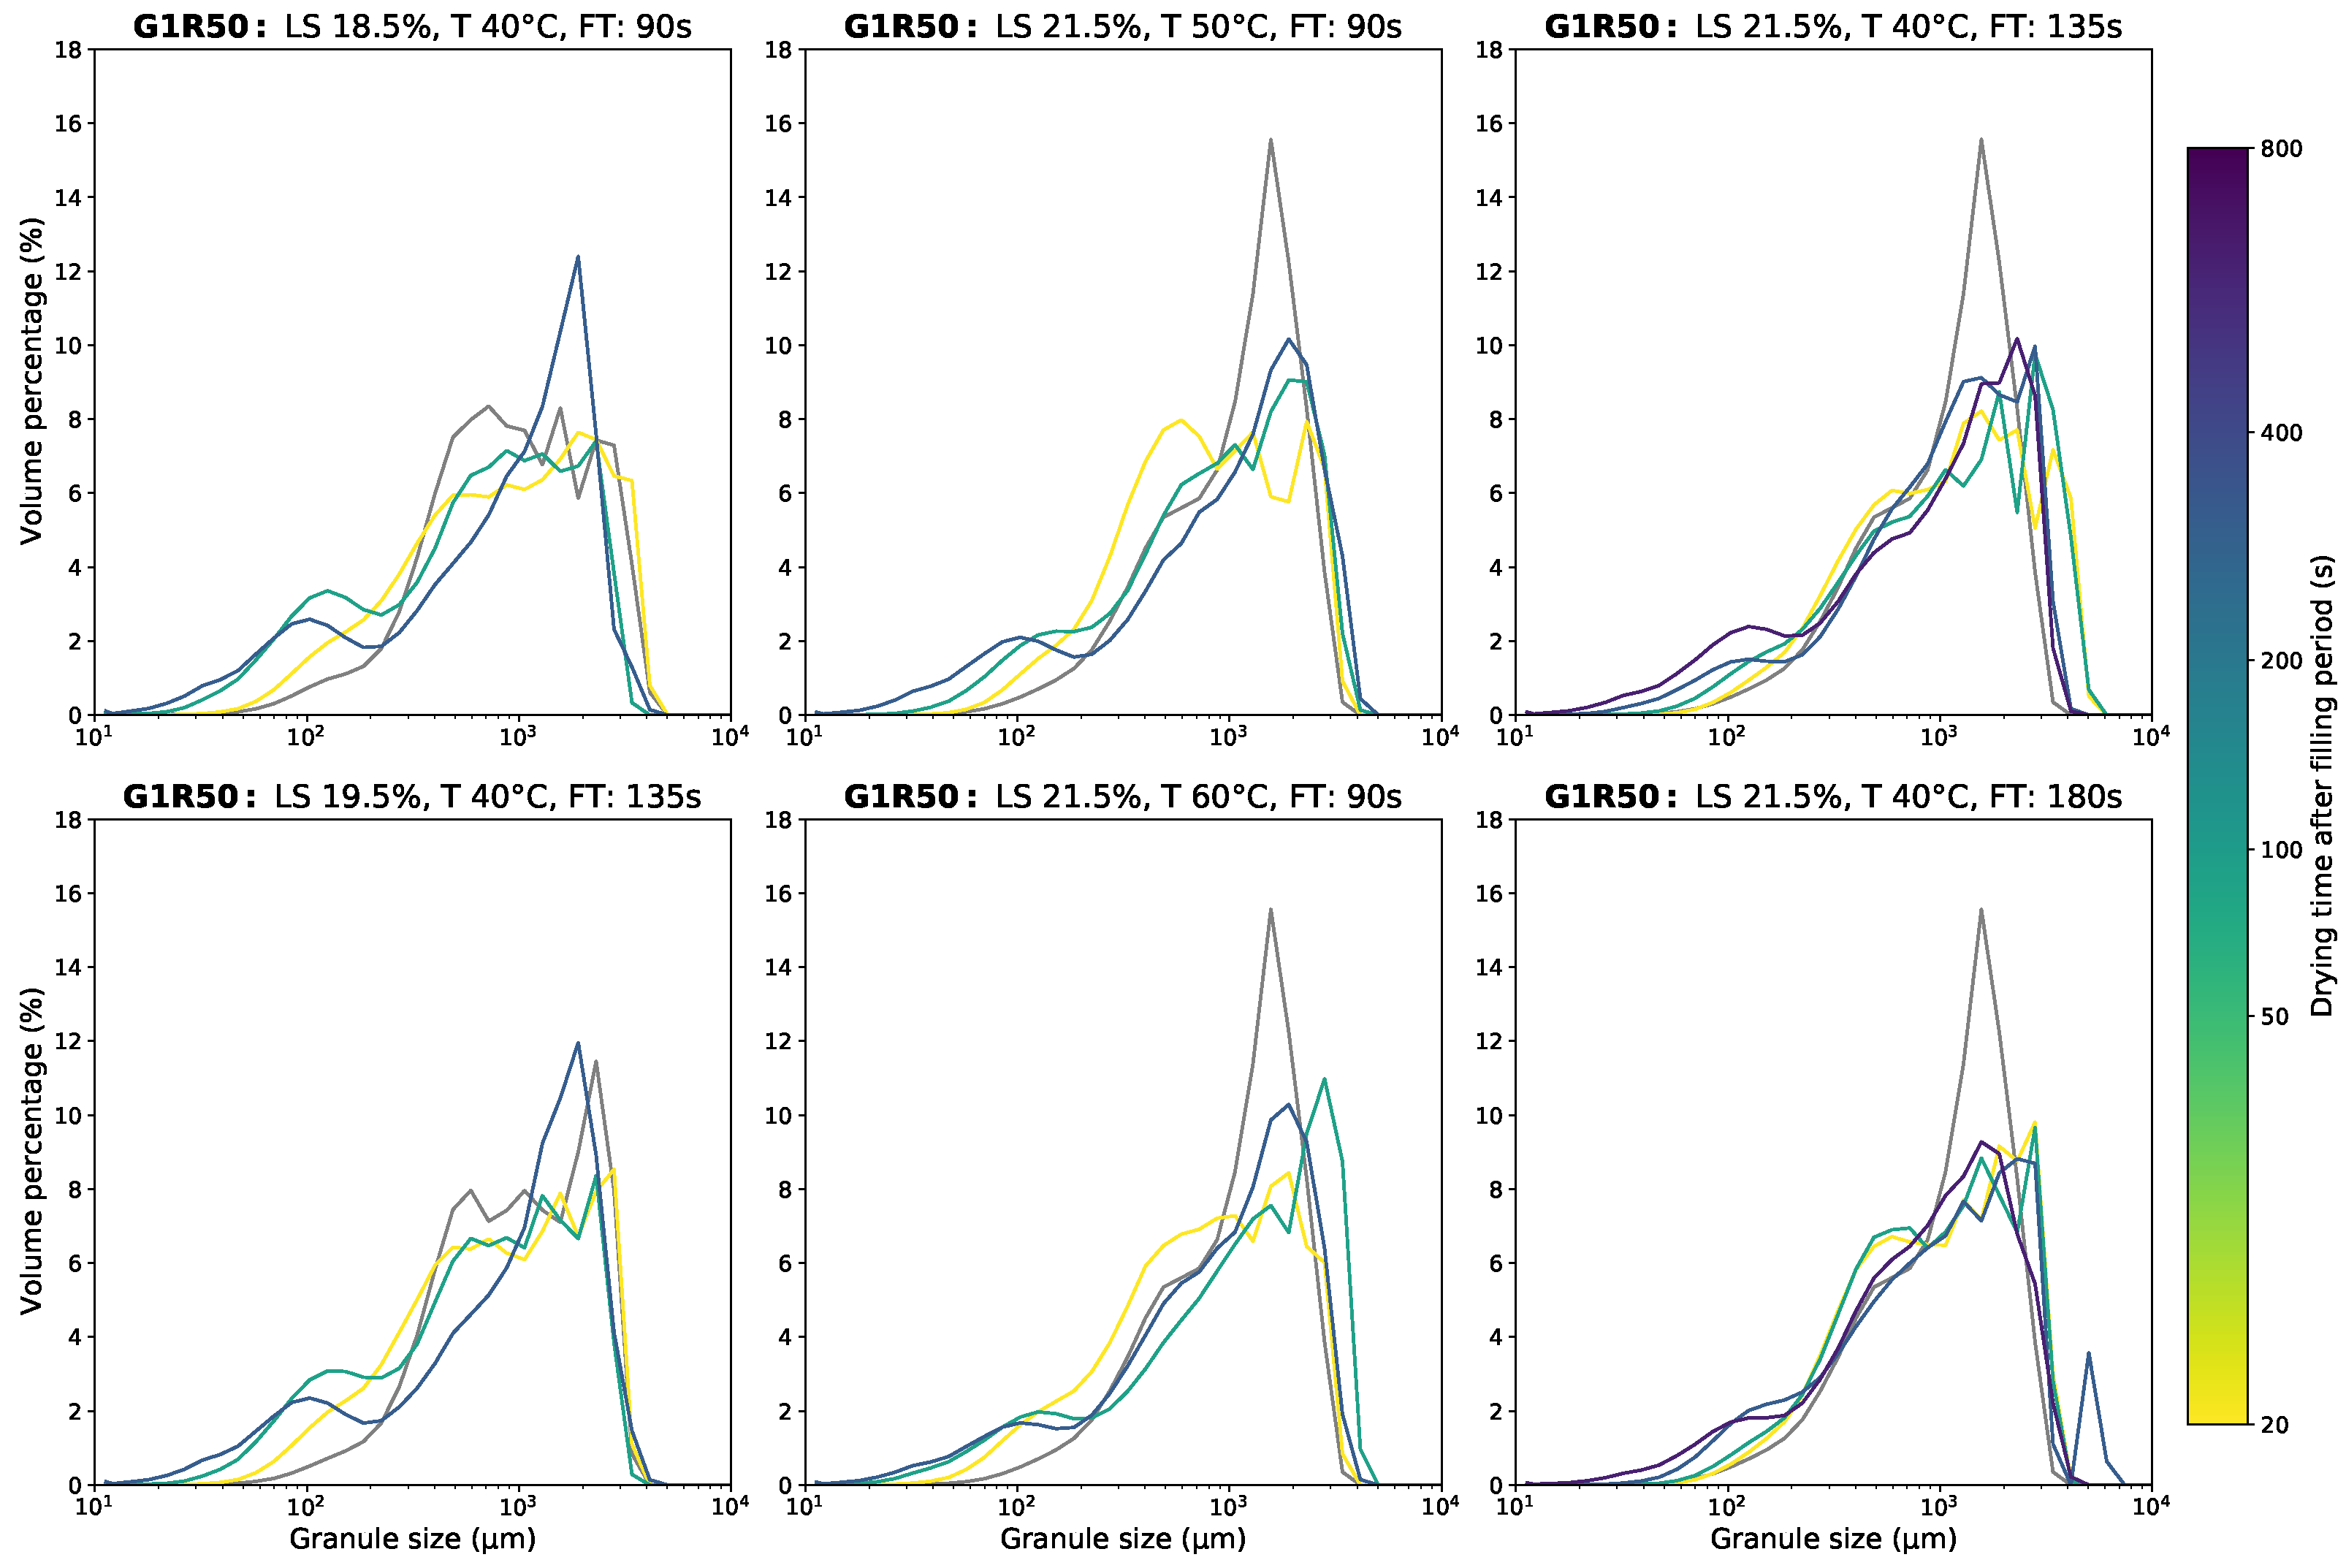
In addition, Ryckaert et al. [13] described that higher drying rates will change the internal structure of granules, as a result of vapor accumulation in the granule pores. This accumulation result in an increase of the internal granule temperature and pressure, which can alter the microstructure making the granules more susceptible to mechanical stress. As a result, an effect of the inlet air temperature was expected. In contrast, based on Figure 2, Figure A3, Figure A5, Figure A7 and Figure A9, no clear trend was observed by considering the inlet air temperature in the collected generic data set. The results obtained are more in line with the observations of De Leersnyder et al. [12], which also did not observe any effect of the inlet air temperature on the GSDs after drying.
Leersnyder et al. [12] demonstrate that there is a positive link between inlet airflow and the yield fraction, at the expense of the oversized granules. The increase in interparticle and particle-wall collisions is considered to be the main cause for this correlation. Thus, a similar effect was expected at higher fill levels, due to the fact that increasing the amount of granular material also makes interparticle collisions more likely. In contrast, no clear effect of the fill level on the GSDs was observed for all formulations in the present work.
It must, however, be noted that the drying airflow rate was kept constant at 400 m 3 /s since the fluidization was acceptable across the different fill levels for all experiments. It might be possible that the fluidization was less optimal at higher fill levels, since the amount of material present was higher in the dryer cells. In that case, the granules would have had a lower velocity, resulting in fewer collisions. Further studies, with an adjusted experimental design, must be performed to prove whether the impact of filling degree on granule breakage and attrition behavior can be completely neglected during fluid bed drying.
The preliminary granulation experiments of the second experimental campaign resulted in granules of similar GSD for the U2SF50, U2D50, and G1R50 experiments at the beginning of the drying process. However, despite the similar GSD in the prior experiments, the drying process affected the different formulations differently. U2D50 (Figure A8) showed the least and G1R50 (Figure A10) the most granule degradation after drying. This observation could be attributed to the lower water solubility of G1R50 compared to U2SF50 and U2D50. Lower water solubility reduces the ability to form interparticle bridges. Fewer interparticle water bridges lead to more fragile G1R50 granules compared to the others. This phenomenon was most pronounced at the higher LS ratios, as more granulation liquid is available in that case.
In addition, a difference in granule degradation was observed between both API grades. It was expected that the grade with the smaller particles or higher contact area of the semi-fine formulation would permit more contact points or liquid bridges between the colliding particles. These bindings may then lead to stronger granules [21]. However, the opposite effect was observed—the U2D50 granules (Figure A8) were stronger than the U2SF50 granules (Figure A6). This is in line with the findings of Zuurman et al. [22], who stated that an increase in bulk density of lactose granules results in a decrease in its ability to consolidate, as the bulk is more porous and more difficult to pack.

3.2. Residual Moisture Content Distribution

The sampling times were chosen using the procedure described in Section 2.1.1 and Section 2.1.2. Consequently, the drying times were not identical between the experiments of the different formulations which made direct comparison difficult. Therefore, the residual moisture content distributions were reported taking into account the drying time after filling. In this way a direct comparison between the different fill level experiments is possible.
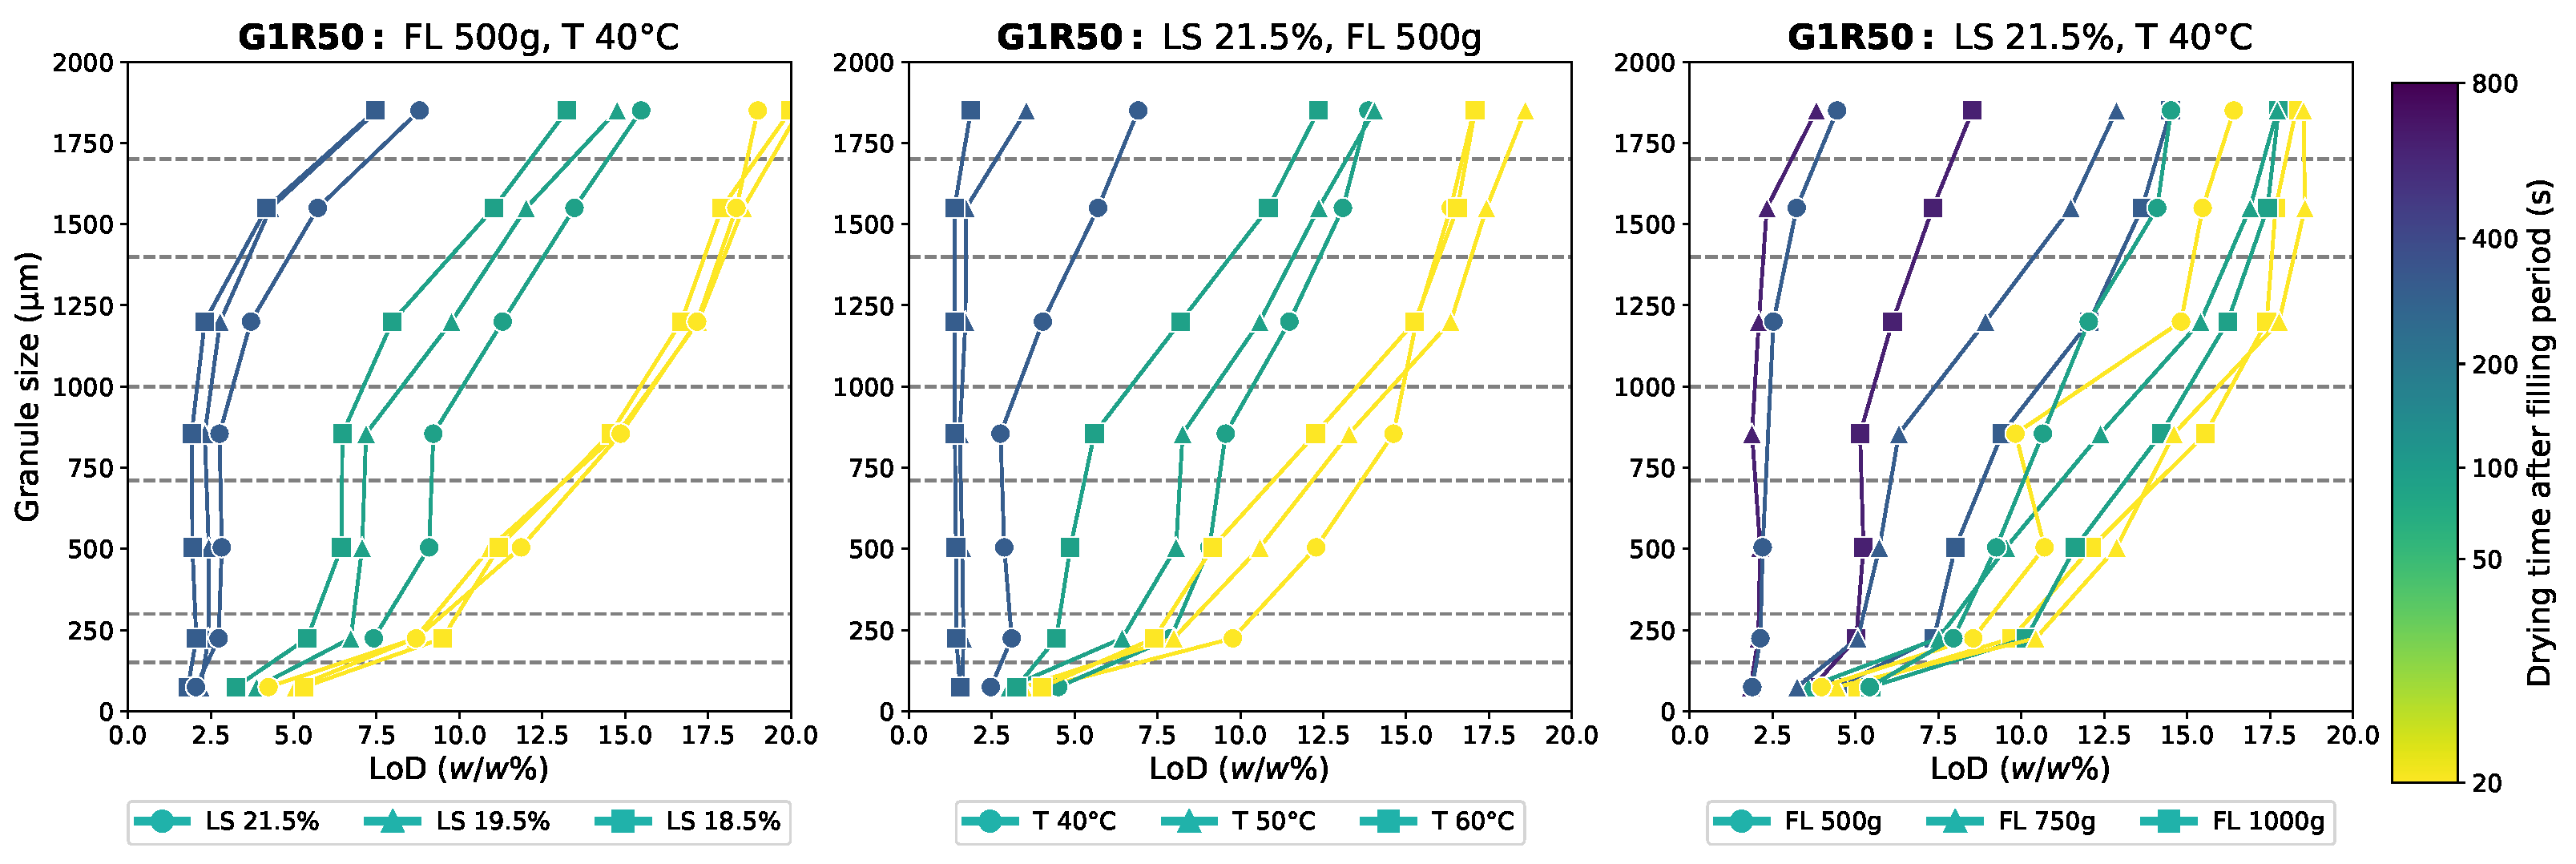
Since the experimentally observed LoD behavior for all formulations was aligned with the behavior observed during the J1F50 experiments, solely the RMC data in the function of the process settings of the J1F50 experiments are reported in Figure 4. A detailed overview of the other collected data points can be found in Appendix D.2 (Figure A11, Figure A12, Figure A13 and Figure A14).
The fact that the GSD were optimized before the drying experiment resulted in small sample sizes for the fines and oversized fractions. Consequently, those LoD measurements (standard deviation over repeated experiments, averaged over different formulations: 21%) were less reliable and more sensitive to variability compared to the yield fraction (standard deviation: 5%). Only qualitative conclusions could be made for the more extreme granule sizes, while the middle-sized classes (710–1400 µm) also allow a quantitative interpretation.
Based on the experimental data, it was concluded that granulation at low LS ratios results in shorter drying times compared to the higher LS ratios. This was expected, as the granules at low LS ratios contain less moisture. However, differences in initial moisture distributions in function of particle size were observed between high and low LS granulation settings. The distribution of the moisture across the sieve fractions seemed less uniform at low LS ratios. For the latter case, the larger granules contained more moisture compared to the smaller granules (e.g., Figure 4). This indicates less efficient distribution of the granulation liquid at low LS ratios, leading to wet and dry regions within the granulator.
Furthermore, Figure 4 reveals a systematic increase of the moisture content with the granule size. However, the size-based RMC variation became narrower with increasing drying time. This observation indicates a proportional drying rate with granule size. However, this observation does not take into account the LoD measurements of the extreme size classes, which may give a biased result. Implementation and calibration of these phenomena in model structures contributes to the further knowledge development and quantification of the observed nonlinear drying processes.
The LoD measurements revealed that increasing the inlet air temperature resulted in a decreased necessary drying time for granule batches with similar properties. For example, the LoD values at the second drying time of experiments N1 and N3 were almost identical (Figure 4). However, the second drying time of N3 was shorter than the second drying time of N1 with a lower inlet air temperature. This correlation was expected, since an increase in inlet air temperature results in higher drying rates. In other words, the RMC declined faster before the equilibrium moisture content was reached.
Considering the other drying parameters, it was observed that the LoD changes similarly at the shortest drying times for variable fill levels. However, after longer drying times, higher LoD values were observed at the high cell loads compared to the lower fill levels. As discussed in Section 3.1, there was probably less optimal fluidization apparent at the higher filling rates, which may have resulted in lower drying rates due to less contact between the drying air and the drying granules. In addition, at a higher fill level, there is more material in the dryer cell, so more liquid has to evaporate. The drying air in the cell will be more saturated, which may lead to a decrease in drying rate. However, by extending the total drying time, the equilibrium moisture content could be reached for all experiments. In conclusion, the rate at which the RMC was changing was dependent on the fill level, but this process variable is not a limiting factor. Analyzing the influence of the incoming air velocity was beyond the scope of this study.
In general, when comparing the G1R50, U2SF50 and U2D50 experiments, which were performed with the same granule porosity, GSD, and process settings, slight differences in drying rate were observed. For all sampled drying times, the G1R50 granules consistently contained the most moisture, while the U2D50 granules were the driest. However, this cannot be stated with certainty, since the differences were minimal and not greater than the standard deviation.
In any case, a consistent trend in RMC was observed with respect to the heat capacity (Cp) values or energy requirements for heating. G1R50, U2SF50 and U2D50 have a slightly lower Cp value, respectively. As such, more heat energy was required to heat up the solid fraction of G1R50 compared to the other formulations. This energy could no longer be used to evaporate moisture, resulting in lower drying rates or higher RMC values after a constant drying time.

3.3. Flowability

The flowability of the granules after drying was evaluated in this study, because one of the objectives of wet granulation is to improve this critical quality attribute (CGA). Poor flow characteristics can cause problems downstream during tableting. Both the AoR and the static cohesive index (CI) were measured to characterize the granule flowability.
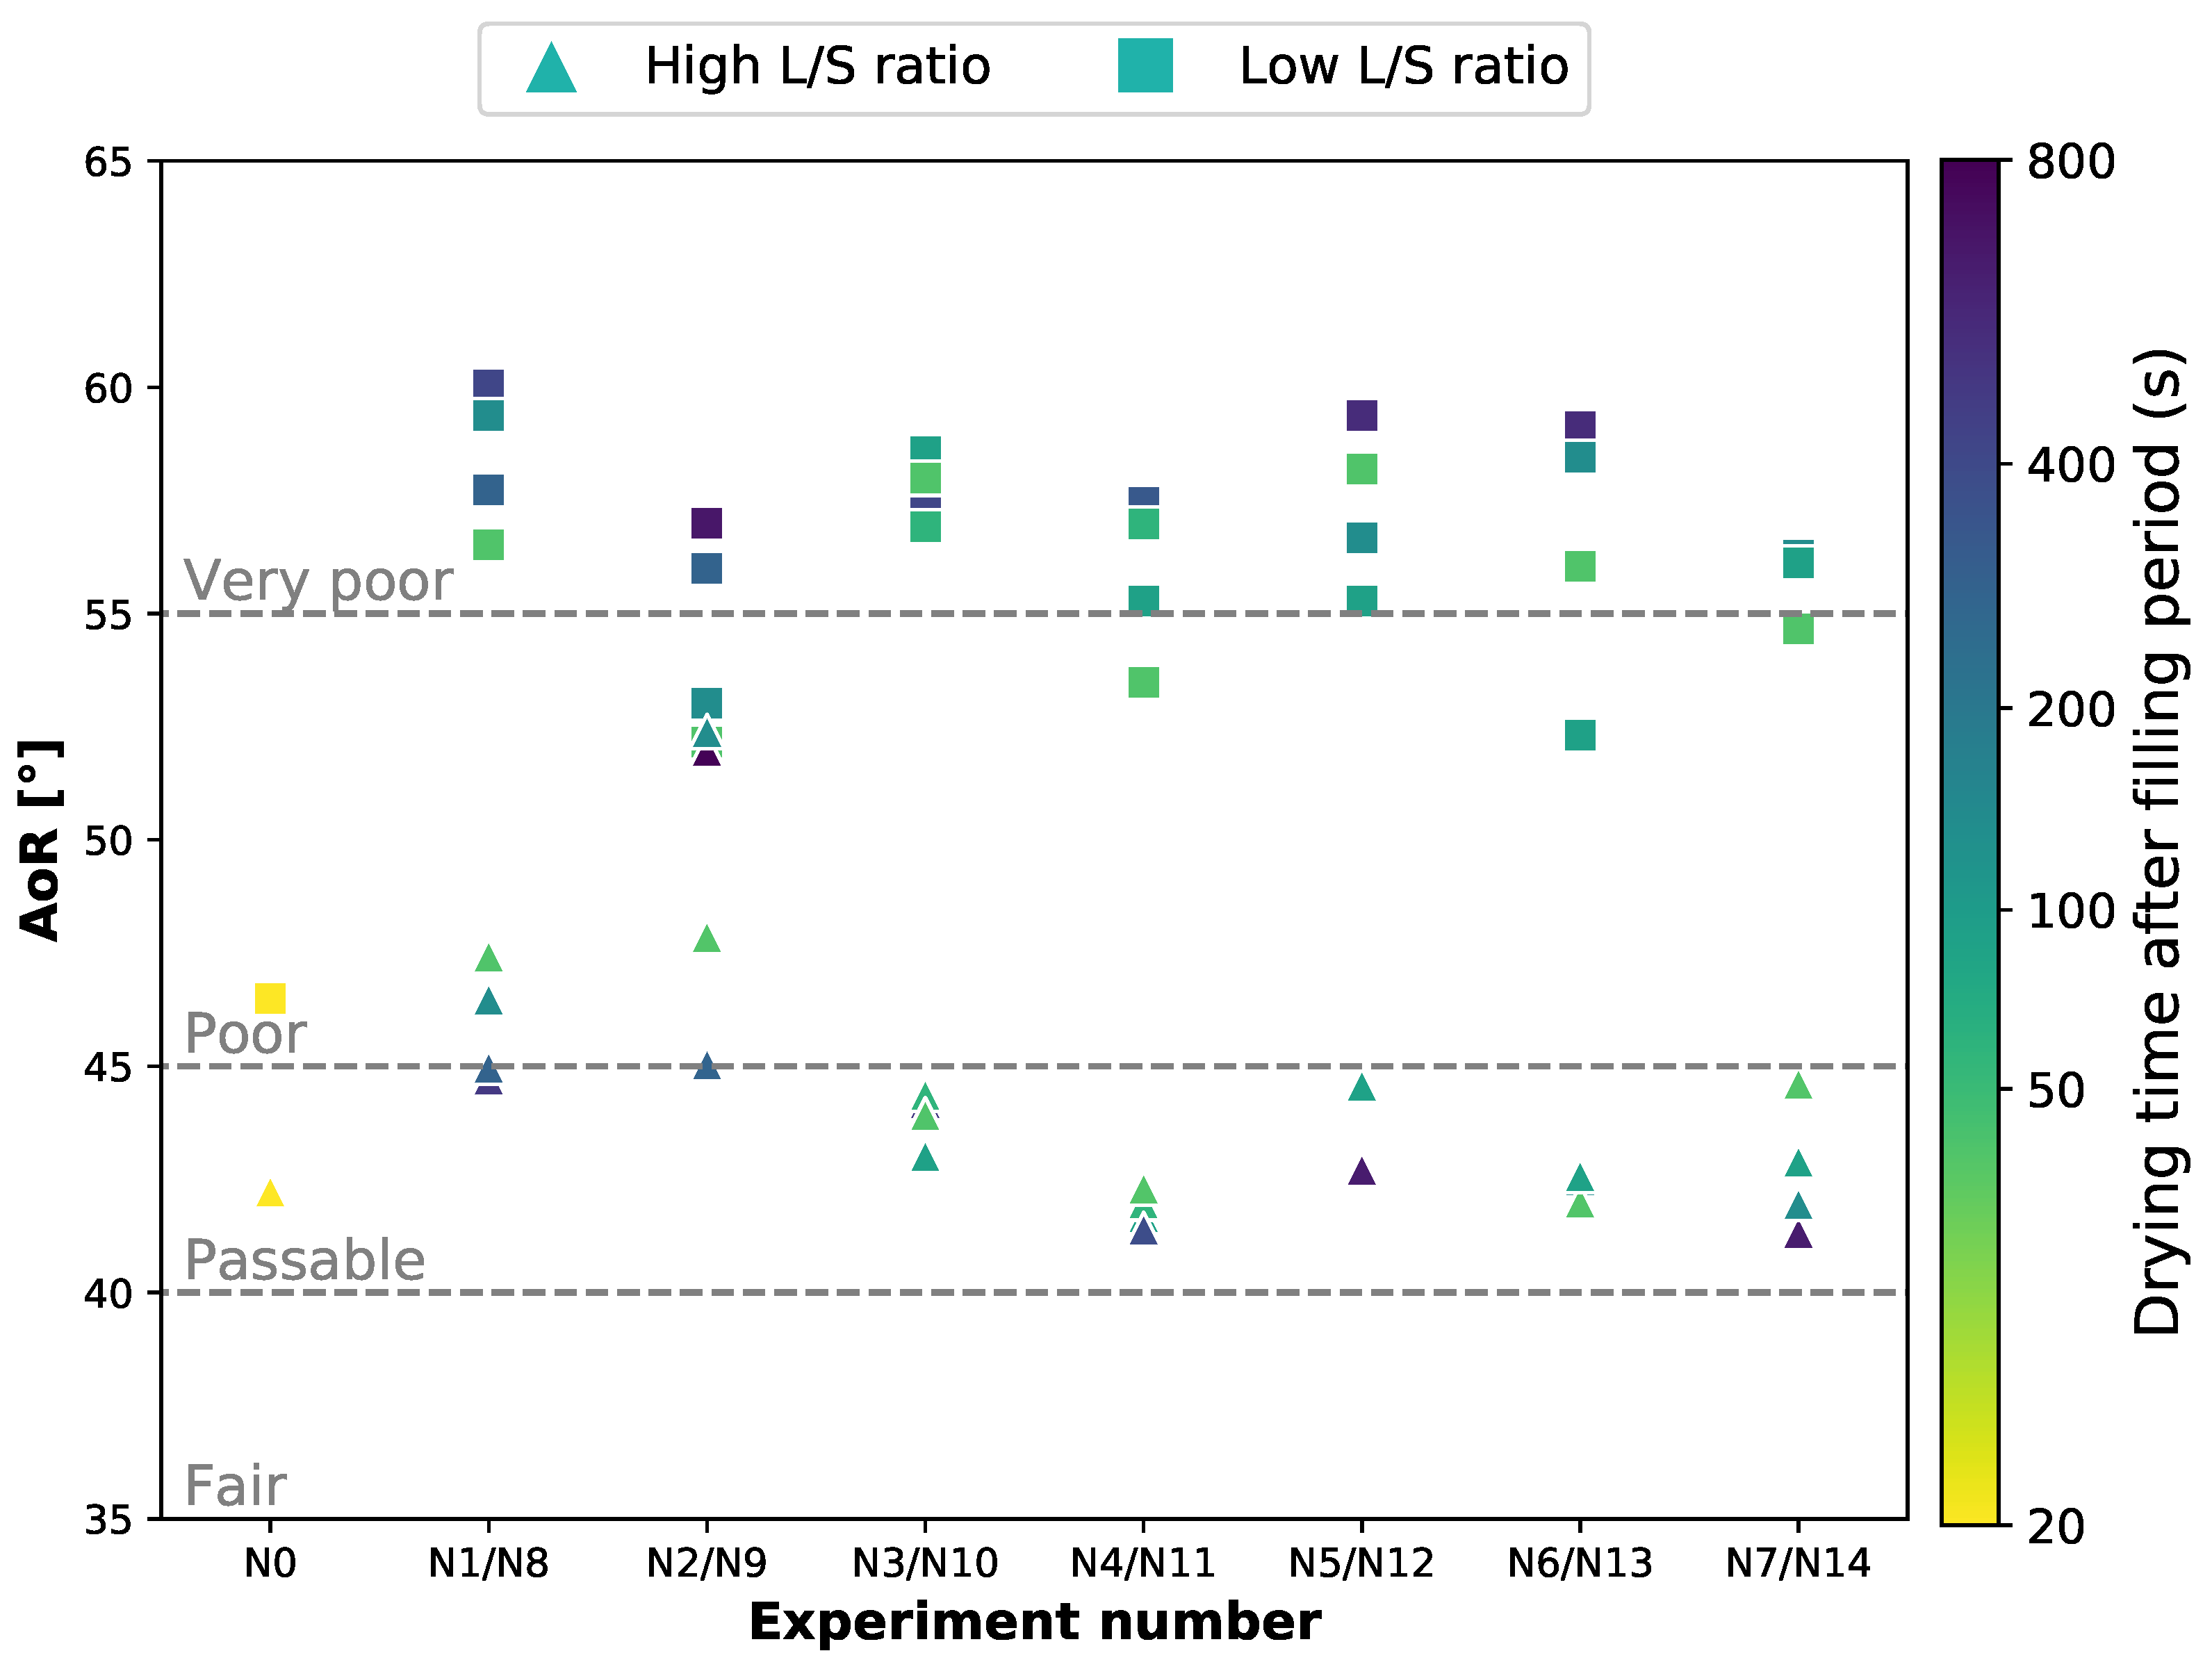
The resulting AoRs following from the J1F50 experiments are reported in Figure 5. This data set contains the AoR in function of the LS ratio and drying time for the various drying scenarios.
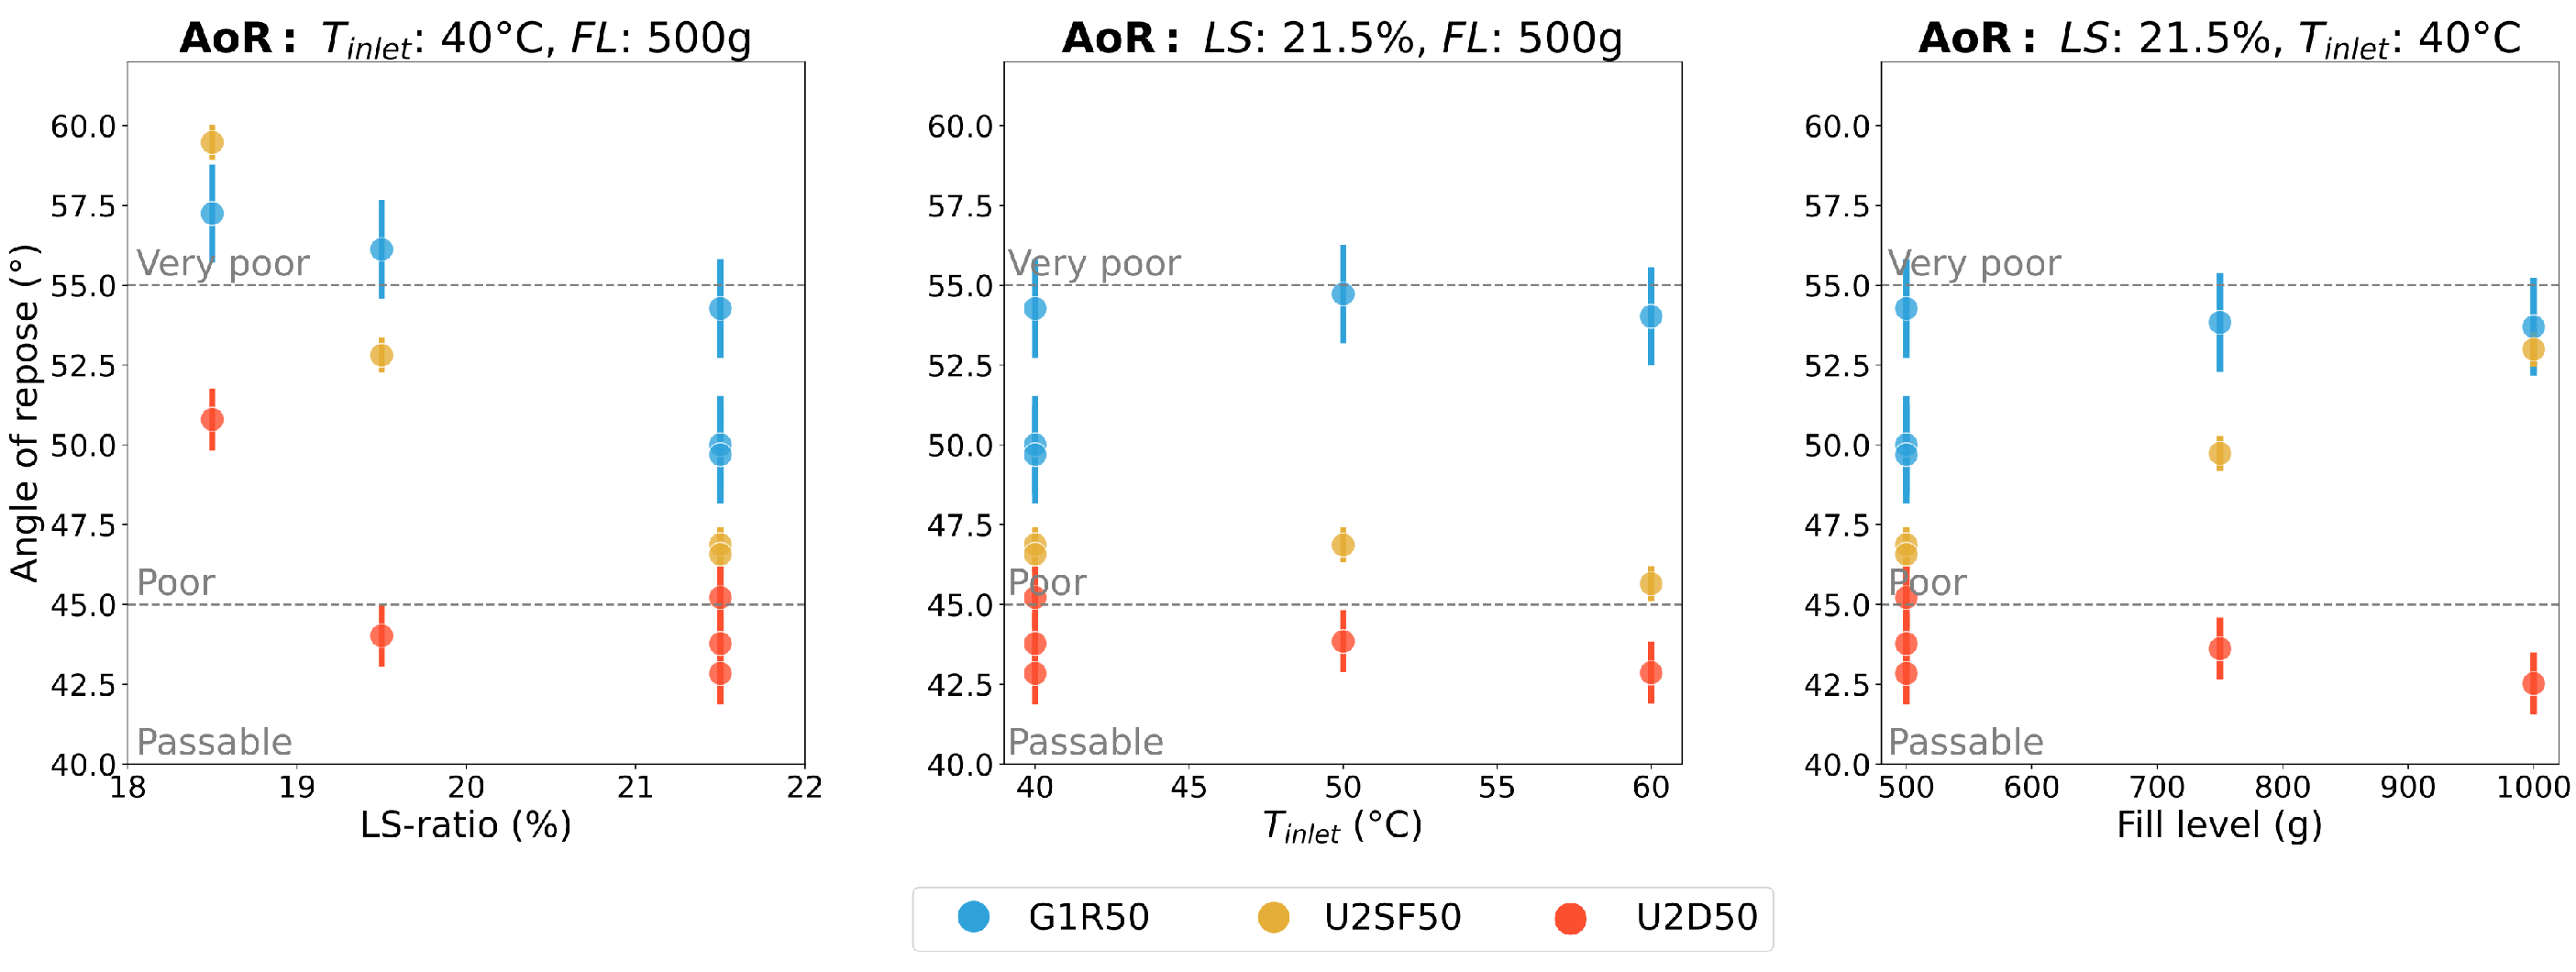
Figure 6 compares the U2SF50, U2D50, or G1R50 experiments, as they were conducted with similar granule properties. The AoR measurement is only reported for the samples with the longest drying time, as these drying times are most likely to be used for industrial applications. The effect of LS ratio, fill level (FL) and inlet air temperature were investigated. In addition, the flowability classification system described by GranutoolsTM [23] is given as a qualitative measure in Figure 5 and Figure 6. Furthermore, the obtained CI results were in line with the measured AoR values, and can be found in Appendix D.3 (Figure A17 and Figure A18).
Figure 5 shows that the variability in the AoR had no relation to the drying time. Furthermore, no clear difference was observed between the J1F50 experiments, provided that the granulator settings were the same. This suggested that the fill level and the inlet air temperature do not affect the AoR. Figure 6 confirms these observations for three additional formulations. This graph reveals no clear influence of the inlet air temperature on the granule flowability. This is in line with the observation that the inlet air temperature did not have an observable influence on the GSD. The granule size and shape are reported to be the granule characteristics that have the largest correlation to the flowability [24].
With respect to the FL, it is difficult to make an unequivocal conclusion. The U2SF50 results showed a positive correlation between the AoR and the FL of the dryer cell, while this is not observed for the other formulations. This trend could not be explained so far as these values could not be related to the GSD results.
For both experimental campaigns, a clear difference in granule flowability was observed between the different granulator settings. The AoR was negatively impacted by the LS ratio, which corresponded to worse flowability. This can be fully attributed to the increase in fine material after granulation at lower LS ratios. The amount of fines has a negative impact on the observed AoR [24]. However, it is important to note that this difference was less visible in the samples taken at the end of the granulator before the drying process. So, it was concluded that the FBD unit induced the negative correlation between the LS ratio and the flowability. Once again, the reduced flowability could be attributed to breakage and attrition during fluidization.
Lastly, Figure 6 provides the opportunity to quantify the isolated blend effect, due to the fact that the granule porosity and GSD were similar across the tested formulations. G1R50 has the highest AoR values, while U2D50 showed the best flowability. This difference in flowability between G1R50 becomes more apparent with an increasing LS ratio. Again, the GSD is considered to be the best explanation of this phenomenon. As discussed in Section 3.1, the differences in GSDs could be attributed to the difference in solubility of both APIs.
Section 3.1 also indicates that breakage and attrition were more pronounced for the U2SF50 granules compared to the U2D50 granules. An increased fine fraction and lower flowability for the U2SF50 granules was described. The observed difference in flowability between the two blends with different API grades decreases with the LS ratio. At lower LS ratios, less liquid is added, which reduces the formation of strong internal liquid bridges. This caused a decrease in strong granules and a more pronounced effect of degradation during fluidization or pneumatic transport. At the higher LS ratios, stronger granules are formed, which result consequently in a decreased difference of the flowability.

3.4. Friability

To avoid problems downstream in the tablet manufacturing process, the friability of the dried granules should be below 30% [25]. As such, another important CQA of wet granulation is friability. This property was measured for the U2SF50, U2D50, and G1R50 experiments on the samples with the longest drying time. These results are visualized in Figure 7.
For all the applied settings and blends, the observed friability was below 30%, which was within the favourable range. Nevertheless, some changes in friability could be observed when the varying process phenomena were taken into account, Figure 7. The LS ratio has a negative correlation with the friability, when considering the results of the blends separately. This was in line with the conclusions of Kotamarthy et al. [26], who showed that an increased LS ratio leads to denser and harder granules and therefore a decreased friability of the granules. Lower LS ratios lead to fewer hydrogen bonds and fewer strong internal liquid bridges after drying, making the granules weaker. However, this trend is not proven to be significant based on these experimental data set, as the 95% confidence intervals within one blend overlapped.
Considering the inlet air temperature, no clear effect was observed as for all formulations an overlap of the confidence intervals was observed. Nevertheless, the lowest friability was always obtained at 50 °C. Higher friability was expected at low inlet air temperatures after a constant drying time, since a higher moisture content leads to less internal solid bridges or weaker granules. However, in Section 3.1, it was discussed in detail that a high inlet air temperatures also leads to granule degradation during FBD. The decrease in granule plasticity at higher drying temperature, might have led to a similar friability as the experiments from 40 °C. The granules dried at 50 °C, have the best balance between plasticity and formed internal bridges, causing them to have the lowest friability in this data set.
Considering the fill level, no influence on the friability of the output granules was observed. With exception of the G1R50 experiment at the highest mass load, all 95% confidence intervals overlap across filling level as well as across formulation type. Indirectly, an effect of filling degree was expected through the fact that the moisture content decreases more slowly at higher cell loads. Wetter granules will show more degradation, so higher friability values were expected as well. On the other hand, when breakage occurs during the drying process, the weakest granules have already broken up and only the strongest granules remained after FBD.

3.5. Generalisation of the Data Set

This study showed consistent drying behavior given the process settings and API properties studied. However, in order to develop a general mathematical drying model, only a limited number of formulations were considered during the first two experimental campaigns. Therefore, during the third experimental campaign, both the GSD and RMC after drying were measured for three new formulations. For each formulation, three different combinations of process settings were considered, Table A4. The process settings were selected to evaluate a situation where fast, slow, or intermediate granule drying rates were expected. Only the J2F5 experiments are shown in this section, as the J1R50 and J3R50 results are consistent with the J2F5 results. A complete overview of the experimental data is in the Appendix A, Appendix B, Appendix C and Appendix D.
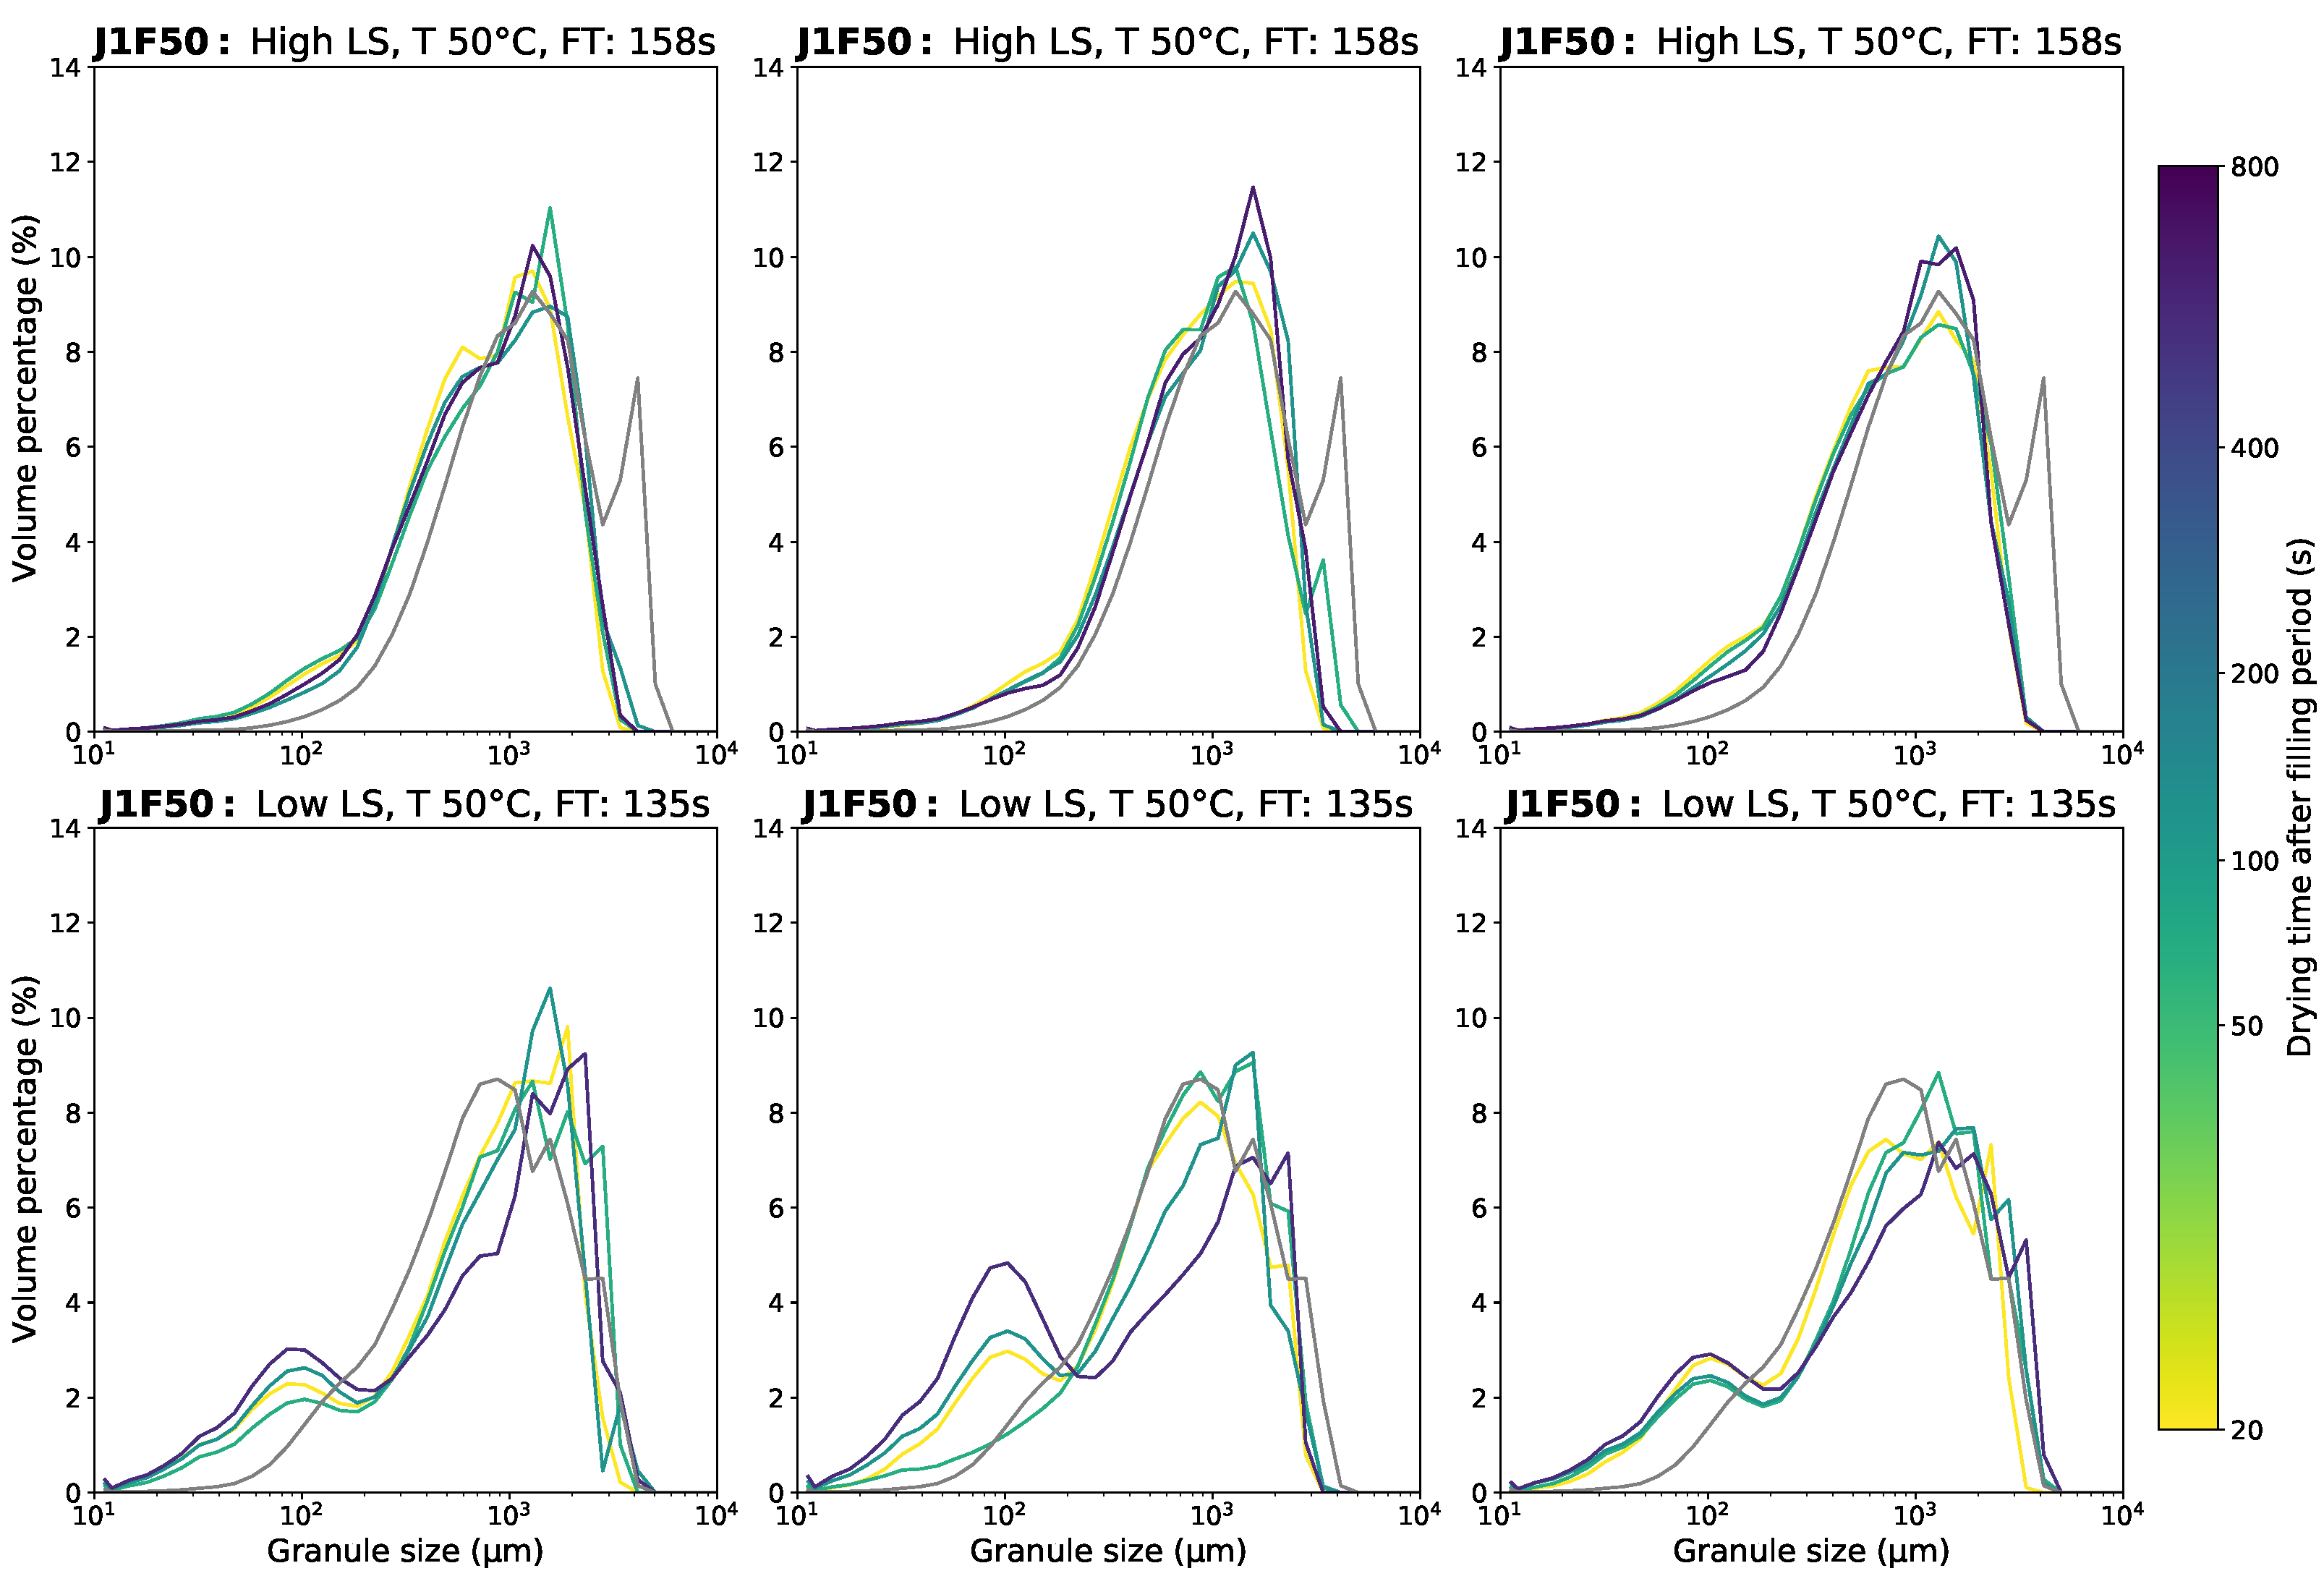
Figure 8 shows the granule size distributions of the J2F5 experiments in function of the LS ratio and drying time. The resulting GSDs shows a similar non-linear behavior as expected from the discussion in Section 3.1. Once more, it was evident that the drying granules reached an optimum strength point during the drying process. More granule breakage after transport through the dry transfer line occurred when the drying time was shorter or longer than the optimum time point, due to more brittle granules.
Figure 9 gives the RMC data in function of the granule size and drying time for the same J2F5 experiments as reported in Figure 8. Once again, it is concluded that the drying behavior of the investigated granules was aligned with the expectations discussed previously. Increasing the LS ratio or the degree of filling or decreasing the drying air temperature extends the required drying time to reach the equilibrium moisture content for the granules in all size classes.
In general, the third experimental campaign provides a valuable source of additional data that can be used for the calibration and validation of generic predictive models for semi-continuous fluid bed drying (FBDs), as already proposed by Ghijs et al. [14] or Nitert and Hounslow [27]. Such mathematical models are tools able to capture the experimentally gained knowledge; they can be used as a virtual test environment to make predictions of the critical quality attributes at process conditions, which have not been tested before. Furthermore, such models can be used for the development of control systems, soft sensors, or a production device-specific digital twin. Especially, within the quality-by-design (QbD) framework, to which the pharmaceutical sector is transitioning, such models will provide tremendous benefits. From this perspective, this study provides an excellent experimental base for the further development of mathematical models that consider both process conditions and API properties.

4. Conclusions

This study elucidated the relationships between the general drying behavior in semi-continuous fluidized bed dryers and both the process settings and formulation properties were studied. It was found that, though API properties influence the drying and breakage behavior through water solubility, heat capacity, and powder particle size, the granulator LS ratio and dryer inlet air temperature dominated the process outcomes.
Similar trends concerning the residual moisture content were found across all experiments. The only process setting under study which showed a strong correlation with the drying rate was the inlet air temperature. Due to the sampling method used, this study revealed that the RMC increased with the granule size at the same drying conditions. Consequently, the mean LoD values could be biased. The width of these RMC distributions decreased with drying time. Next to that, the LS ratio was negatively impacting the breakage and attrition behavior. The largest granule size degradation was, however, not attributed to process settings but rather to the connection of the consecutive unit processes.
Additionally, different pharmaceutical blends with varying API characteristics were also considered, to increase the generic value of the obtained data set. Generic data sets are essential in the development of mathematical prediction models to make reliable predictions for blends with unknown processability. The water solubility and heat capacity could be identified as the major influencing formulation properties on the breakage and drying behavior during the fluidization process, respectively. Additionally, to a lesser extent, a negative effect of the bulk density was observed on the granule degradation behavior. Still, it was found that the effect of the process settings on the critical quality attributes was much greater than the API or blend properties. Nevertheless, it must be noted that the surface properties of the granules were not considered in this study. However, for follow-up studies, it might be useful to further investigate the influence of the granule surface properties on the drying behavior, for example with the BET (Brunauer–Emmett–Teller) analysis.
In addition to the breakage and evaporation behavior, the flowability and friability were also monitored during this study. Variations in both critical quality attributes (CQAs) have been fully explained by the observed differences in degradation and drying behavior. Consequently, the influential process settings and formulation properties were also found to be capable of describing the latter CQA.
Finally, this work provides an important source of data for the development of mathematical drying models for process optimization and process control, firstly through the unique generic nature of the data set and secondly through the recording of the RMC (after drying) as a function of granule size.

Author Contributions

Conceptualization, T.V. (Tuur Vandeputte), M.G., M.P. and T.D.B.; methodology, T.V. (Tuur Vandeputte), M.P., T.V. (Tamas Vigh) and F.S.; formal analysis, T.V. (Tuur Vandeputte), M.G., D.V.H. and E.D.S.S.; investigation, T.V. (Tuur Vandeputte), M.G., M.P. and A.D.M.; data curation, T.V. (Tuur Vandeputte); writing—original draft preparation, T.V. (Tuur Vandeputte); writing—review and editing, M.G., D.V.H., E.D.S.S., T.V. (Tamas Vigh), F.S., I.N. and T.D.B.; visualization, T.V. (Tuur Vandeputte) and D.V.H.; supervision, I.N. and T.D.B.; project administration, I.N. and T.D.B.; funding acquisition, E.D.S.S., T.V. (Tamas Vigh) and F.S. All authors have read and agreed to the published version of the manuscript.

Funding

This work is supported by the Consortium Agreement between Janssen Pharmaceutica, UCB and Ghent University.

Data Availability Statement

Not applicable.

Conflicts of Interest

The authors declare no conflict of interest.

Abbreviations

The following abbreviations are used in this manuscript:
AoRAngle of Repose
APIactive pharmaceutical ingredient
CIstatic cohesive index
Cpheat capacity
CQAcritical quality attribute
DoEdesign of experiments
FBDfluid bed drying
FLfill level
FTfill time
GSDgranule size distribution
KPCAkernel principle component analysis
LoDLoss-on-drying
LSliquid-to-solid
MFRmass flow rate
MMDmaximum mean discrepancy
QbDquality-by-design
RMCresidual moisture content
Tinlet air temperature
TSWGtwin-screw wet granulation

Appendix A

Table A1. Summary of the API properties. All API properties were rescaled between zero and one for confidentiality reasons.
APIHeat Capacity [-]Water Solubility [-]Flowability [-]d0.1 [-]d0.5 [-]d0.9 [-]
J1F1.000.930.000.330.330.09
U1R0.630.980.351.001.000.83
U2SF0.410.990.050.350.360.06
U2R0.000.100.260.230.500.21
G1R0.690.050.140.090.030.00
J1R0.781.000.150.390.770.30
J2F0.650.000.020.000.000.54
J3R0.400.001.000.240.311.00

Appendix B

Table A2. Summary of the process settings and sampling times for the first experimental campaign. From left to right, the tables gives respectively the number of the experiment, the formulation type, the LS ratio, the inlet air temperature, the mass flow rate, the total fill level of the dryer cell, the screw speed and the drying times for sampling.
EXPNFORMLS (% (w/w))T (°C)MFR (kg/h)FL (kg)SS (rpm)t1 (s)t2 (s)t3 (s)t4 (s)
N1J1F5010.6040200.50675110210360450
N2J1F5010.6040201.00675200300450853
N3J1F5010.6060200.50675110130160500
N4J1F5010.6060201.00675200220250500
N5J1F5010.6050200.75675155205255684
N6J1F5010.6050200.75675155205255684
N7J1F5010.6050200.75675155205255684
N8J1F5013.804017.030.50809126226376585
N9J1F5013.804017.031.008092313314811000
N10J1F5013.806017.030.50809126146176585
N11J1F5013.806017.031.00809231251281585
N12J1F5013.805017.030.75809178228278800
N13J1F5013.805017.030.75809178228278800
N14J1F5013.805017.030.75809178228278800
N15U1R506.3640200.50675110210360450
N16U1R506.3640201.006752003004501000
N17U1R506.3660200.50675110160210450
N18U1R506.3660201.006752002503001000
N19U1R506.3650200.75675155205255755
N20U1R506.3650200.75675155205255755
N21U1R506.3650200.75675155205255755
N22U1R509.7840200.50675110210360450
N23U1R509.7840201.006752003004501000
N24U1R509.7860200.50675110160210450
N25U1R509.7860201.006752002503001000
N26U1R509.7850200.75675155205255755
N27U1R509.7850200.75675155205255755
N28U1R509.7850200.75675155205255755
Table A3. Summary of the process settings and sampling times for the second experimental campaign. From left to right, the tables gives respectively the number of the experiment, the formulation type, the liquid-to-solid (LS) ratio, the inlet air temperature, the mass flow rate, the total fill level of the dryer cell, the screw speed and the drying times for sampling.
EXPNFORMLS (% (w/w))T (°C)MFR (kg/h)FL (kg)SS (rpm)t1 (s)t2 (s)t3 (s)t4 (s)
N29U2SF5018.540200.50675100180400-
N30U2SF5019.540200.50675100180400-
N31U2SF5021.560200.50675100180400-
N32U2SF5021.550200.50675100180400-
N33U2SF5021.540201.00675145270490800
N34U2SF5021.540200.75675145225445755
N35U2SF5021.540200.50675100180400-
N36U2SF5021.540200.50675100180400-
N37U2SF5021.540200.50675100180400-
N38U2R5018.540200.50675100180400-
N39U2R5019.540200.50675100180400-
N40U2R5021.560200.50675100180400-
N41U2R5021.550200.50675100180400-
N42U2R5021.540201.00675145270490800
N43U2R5021.540200.75675145225445755
N44U2R5021.540200.50675100180400-
N45U2R5021.540200.50675100180400-
N46U2R5021.540200.50675100180400-
N47G1R5018.540200.50675100180400-
N48G1R5019.540200.50675100180400-
N49G1R5021.560200.50675100180400-
N50G1R5021.550200.50675100180400-
N51G1R5021.540201.00675145270490800
N52G1R5021.540200.75675145225445755
N53G1R5021.540200.50675100180400-
N54G1R5021.540200.50675100180400-
N55G1R5021.540200.50675100180400-
Table A4. Summary of the process settings and sampling times for the third experimental campaign. From left to right, the tables contain respectively the number of the experiment, the formulation type, the liquid-to-solid (LS) ratio, the inlet air temperature, the mass flow rate, the total fill level of the dryer cell, the screw speed and the drying times for sampling.
EXPNFORMLS (% (w/w))T (°C)MFR (kg/h)FL (kg)SS (rpm)t1 (s)t2 (s)t3 (s)t4 (s)
N56J1R501640201.006753003604201000
N57J1R501450200.75675255375555-
N58J1R501260200.50675210330510-
N59J2F52340201.006753004807801000
N60J2F521.550200.75675255435735-
N61J2F52060200.50675210390670-
N62J3R502140201.006753004807801000
N63J3R501950200.75675255435735-
N64J3R501660200.50675210390690-

Appendix C

Figure A1. Scatterplot of all preliminary granulation experiments using the first two principal components of the KPCA applied to GSD data. The experiments are colored by formulation type.
Powders 02 00016 g0a1
Figure A2. Scatterplot of the MMD between the data points obtained with the same granulation settings but different formulation types: U2D50 VS U2SF50 (left), U2SF50 VS G1R50 (middle) and U2D50 VS G1R50 (right).
Powders 02 00016 g0a2

Appendix D

Appendix D.1. Granule Size Data

Figure A3. Observed granule size distribution (GSDs) for U1R50 experiments. The gray curve represents the GSD after granulation or the initial GSD entering the dryer. The other curves were sampled after the fluid bed dryer, the drying time after filling is indicated by color. Each of the 8 subplots indicates a change in ether liquid-to-solid (LS), inlet air temperature or FT.
Powders 02 00016 g0a3
Figure A4. Observed GSDs for U1R50 center point experiments. The gray curve represents the GSD after granulation or the initial GSD entering the dryer. The other curves were sampled after the fluid bed dryer, the drying time after filling is indicated by color. Each of the 6 subplots indicates a repeated center point experiment at both LS ratios.
Powders 02 00016 g0a4
Figure A5. Observed GSDs for U2SF50 experiments. The gray curve represents the GSD after granulation or the initial GSD entering the dryer. The other curves were sampled after the fluid bed dryer, the drying time after filling is indicated by color. Each of the 6 subplots indicates a change in ether LS, T or fill time (FT).
Powders 02 00016 g0a5
Figure A6. Observed GSDs for U2SF50 center point experiments. The gray curve represents the GSD after granulation or the initial GSD entering the dryer. The other curves were sampled after the fluid bed dryer, the drying time after filling is indicated by color. Each of the 3 subplots indicates a repeated center point experiment.
Powders 02 00016 g0a6
Figure A7. Observed GSDs for U2D50 experiments. The gray curve represents the GSD after granulation or the initial GSD entering the dryer. The other curves were sampled after the fluid bed dryer, the drying time after filling is indicated by color. Each of the 6 subplots indicates a change in ether LS, T or FT.
Powders 02 00016 g0a7
Figure A8. Observed GSDs for U2D50 center point experiments. The gray curve represents the GSD after granulation or the initial GSD entering the dryer. The other curves were sampled after the fluid bed dryer, the drying time after filling is indicated by color. Each of the 3 subplots indicates a repeated center point experiment.
Powders 02 00016 g0a8
Figure A9. Observed GSDs for G1R50 experiments. The gray curve represents the GSD after granulation or the initial GSD entering the dryer. The other curves were sampled after the fluid bed dryer, the drying time after filling is indicated by color. Each of the 6 subplots indicates a change in ether LS, T or FT.
Powders 02 00016 g0a9
Figure A10. Observed GSDs for G1R50 center point experiments. The gray curve represents the GSD after granulation or the initial GSD entering the dryer. The other curves were sampled after the fluid bed dryer, the drying time after filling is indicated by color. Each of the 3 subplots indicates a repeated center point experiment.
Powders 02 00016 g0a10

Appendix D.2. Moisture Content Data

Figure A11. Observed LoD for U1R50 experiments. The gray curve represents the initial moisture content after granulation, while the other curves were sampled after the fluid bed dryer. The drying time after the filling period is indicated by color. The markers indicate the total fill level, while the column is positive correlated with the inlet air temperature.
Powders 02 00016 g0a11
Figure A12. Observed LoD for U2SF50 experiments. The gray curve represents the initial moisture content after granulation, while the other curves were sampled after the fluid bed dryer. The drying time after the filling period is indicated by color. The markers indicate the varied process setting LS ratio (left), inlet air temperature (middle), total fill level (right).
Powders 02 00016 g0a12
Figure A13. Observed LoD for U2D50 experiments. The gray curve represents the initial moisture content after granulation, while the other curves were sampled after the fluid bed dryer. The drying time after the filling period is indicated by color. The markers indicate the varied process setting LS ratio (left), inlet air temperature (middle), total fill level (right).
Powders 02 00016 g0a13
Figure A14. Observed LoD for G1R50 experiments. The gray curve represents the initial moisture content after granulation, while the other curves were sampled after the fluid bed dryer. The drying time after the filling period is indicated by color. The markers indicate the varied process setting LS ratio (left), inlet air temperature (middle), total fill level (right).
Powders 02 00016 g0a14
Figure A15. Observed LoD for J1R50 experiments. The gray curve represents the initial moisture content after granulation, while the other curves were sampled after the fluid bed dryer. The drying time after the filling period is indicated by color. The markers indicate the varied process setting LS ratio (left), inlet air temperature (middle), total fill level (right).
Powders 02 00016 g0a15
Figure A16. Observed LoD for J3R50 experiments. The gray curve represents the initial moisture content after granulation, while the other curves were sampled after the fluid bed dryer. The drying time after the filling period is indicated by color. The markers indicate the varied process setting LS ratio (left), inlet air temperature (middle), total fill level (right).
Powders 02 00016 g0a16

Appendix D.3. Static Cohesion Index
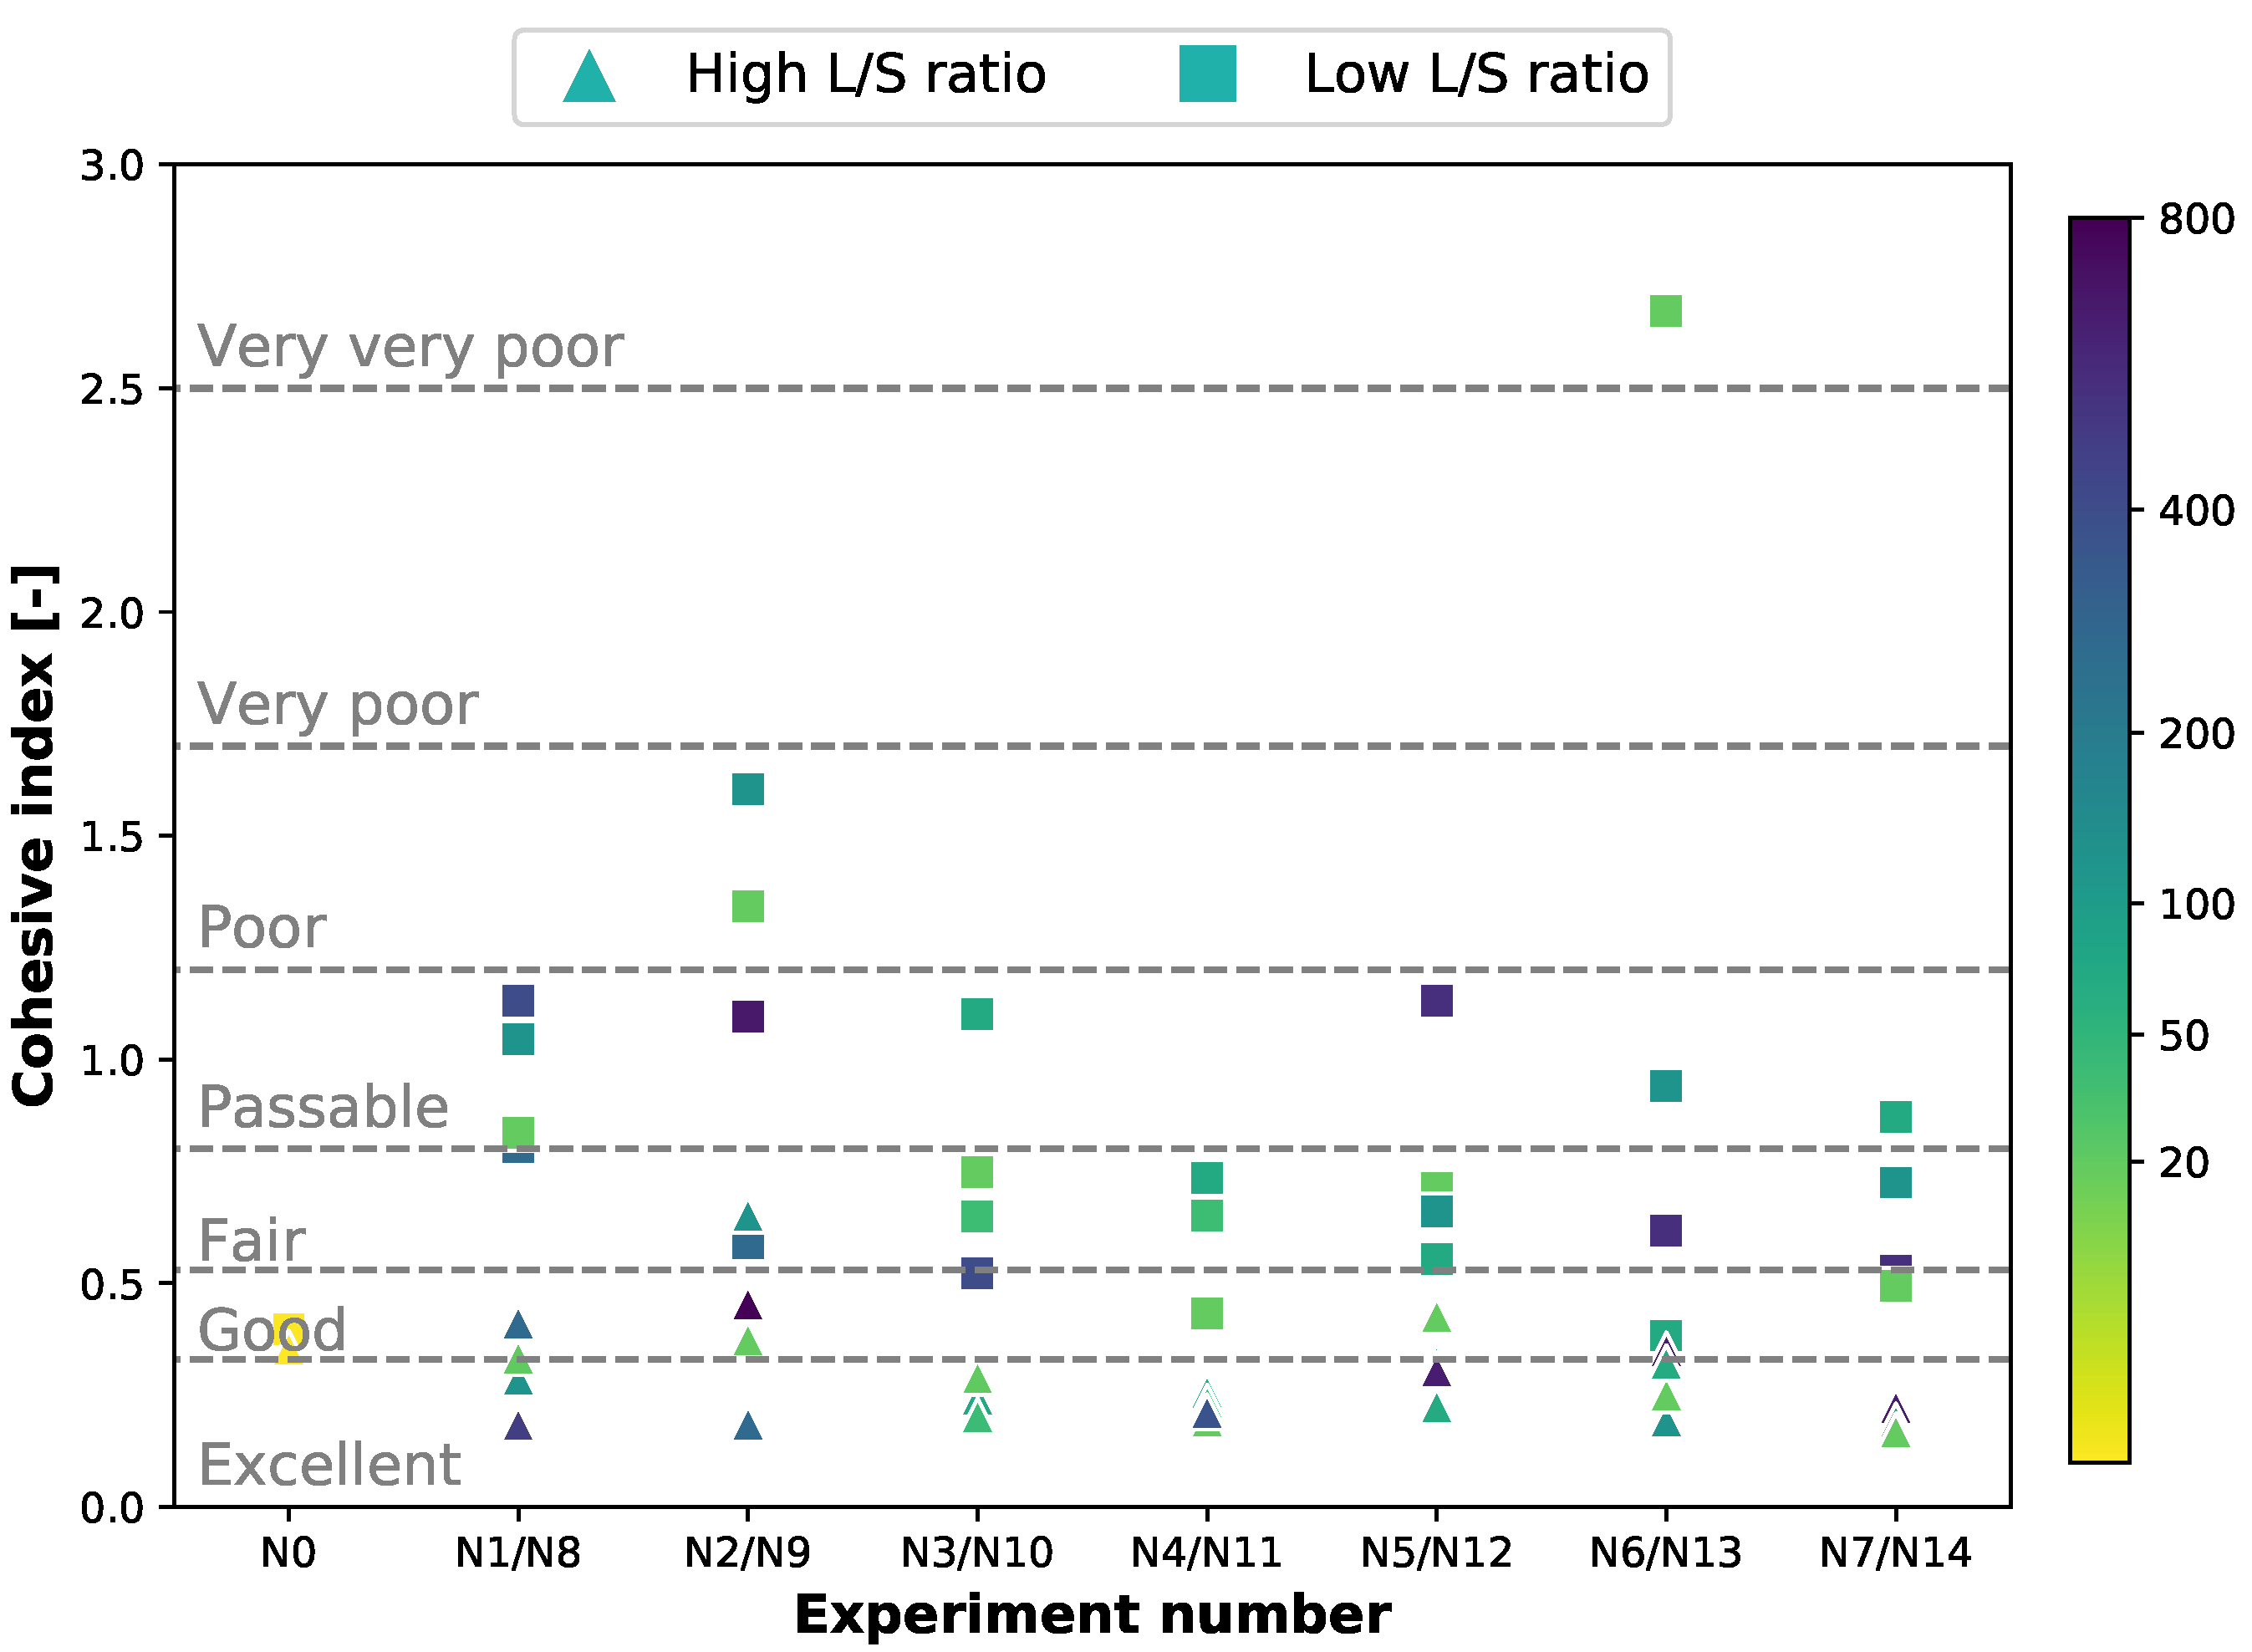
Figure A17. Measured static cohesive indexs (CIs) across all J1F50 experiments. Results are compared between the low LS and high LS for air-dried granules, dot color corresponds to the drying times after the filling period.
Powders 02 00016 g0a17
Figure A18. Measured CIs for the U2SF50, U2D50 and G1R50 experiments varying the LS ratio (left), inlet air temperature (middle) and fill level (right). Dot color corresponds to the formulation type. Both the average and 95% confidence interval are shown for each experiment.
Powders 02 00016 g0a18

References

  1. Leane, M.; Pitt, K.; Reynolds, G.K.; Dawson, N.; Ziegler, I.; Szepes, A.; Crean, A.M.; Dall Agnol, R.; The Manufacturing Classification System (MCS) Working Group. Manufacturing classification system in the real world: Factors influencing manufacturing process choices for filed commercial oral solid dosage formulations, case studies from industry and considerations for continuous processing. Pharm. Dev. Technol. 2018, 23, 964–977. [Google Scholar] [CrossRef] [PubMed]
  2. Stauffer, F.; Boulanger, E.; Pilcer, G. Sampling and diversion strategy for twin-screw granulation lines using batch statistical process monitoring. Eur. J. Pharm. Sci. 2022, 171, 106126. [Google Scholar] [CrossRef] [PubMed]
  3. Lee, S.L.; O’Connor, T.F.; Yang, X.; Cruz, C.N.; Chatterjee, S.; Madurawe, R.D.; Moore, C.; Yu, L.X.; Woodcock, J. Modernizing pharmaceutical manufacturing: From batch to continuous production. J. Pharm. Innov. 2015, 10, 191–199. [Google Scholar] [CrossRef] [Green Version]
  4. Iveson, S.M.; Litster, J.D.; Hapgood, K.; Ennis, B.J. Nucleation, growth and breakage phenomena in agitated wet granulation processes: A review. Powder Technol. 2001, 117, 3–39. [Google Scholar] [CrossRef]
  5. Cheong, Y.S.; Mangwandi, C.; Fu, J.; Adams, M.J.; Hounslow, M.J.; Salman, A.D. Chapter 26 A Mechanistic Description of Granule Deformation and Breakage. In Particle Breakage; Salman, A.D., Ghadiri, M., Hounslow, M.J., Eds.; Elsevier Science B.V.: Amsterdam, The Netherlands, 2007; Volume 12, pp. 1055–1120. [Google Scholar] [CrossRef]
  6. Fonteyne, M.; Correia, A.; De Plecker, S.; Vercruysse, J.; Ilić, I.; Zhou, Q.; Vervaet, C.; Remon, J.P.; Onofre, F.; Bulone, V.; et al. Impact of microcrystalline cellulose material attributes: A case study on continuous twin screw granulation. Int. J. Pharm. 2015, 478, 705–717. [Google Scholar] [CrossRef] [PubMed]
  7. Meier, R.; Moll, K.P.; Krumme, M.; Kleinebudde, P. Impact of fill-level in twin-screw granulation on critical quality attributes of granules and tablets. Eur. J. Pharm. Biopharm. 2017, 115, 102–112. [Google Scholar] [CrossRef] [PubMed]
  8. Vercruysse, J.; Díaz, D.C.; Peeters, E.; Fonteyne, M.; Delaet, U.; Van Assche, I.; De Beer, T.; Remon, J.P.; Vervaet, C. Continuous twin screw granulation: Influence of process variables on granule and tablet quality. Eur. J. Pharm. Biopharm. 2012, 82, 205–211. [Google Scholar] [CrossRef] [Green Version]
  9. Li, H.; Thompson, M.; O’donnell, K. Understanding wet granulation in the kneading block of twin screw extruders. Chem. Eng. Sci. 2014, 113, 11–21. [Google Scholar] [CrossRef]
  10. Vercruysse, J.; Burggraeve, A.; Fonteyne, M.; Cappuyns, P.; Delaet, U.; Van Assche, I.; De Beer, T.; Remon, J.P.; Vervaet, C. Impact of screw configuration on the particle size distribution of granules produced by twin screw granulation. Int. J. Pharm. 2015, 479, 171–180. [Google Scholar] [CrossRef]
  11. Djuric, D.; Kleinebudde, P. Impact of screw elements on continuous granulation with a twin-screw extruder. J. Pharm. Sci. 2008, 97, 4934–4942. [Google Scholar] [CrossRef]
  12. De Leersnyder, F.; Vanhoorne, V.; Bekaert, H.; Vercruysse, J.; Ghijs, M.; Bostijn, N.; Verstraeten, M.; Cappuyns, P.; Van Assche, I.; Vander Heyden, Y.; et al. Breakage and drying behaviour of granules in a continuous fluid bed dryer: Influence of process parameters and wet granule transfer. Eur. J. Pharm. Sci. 2018, 115, 223–232. [Google Scholar] [CrossRef] [PubMed]
  13. Ryckaert, A.; Ghijs, M.; Portier, C.; Djuric, D.; Funke, A.; Vervaet, C.; De Beer, T. The influence of equipment design and process parameters on granule breakage in a semi-continuous fluid bed dryer after continuous twin-screw wet granulation. Pharmaceutics 2021, 13, 293. [Google Scholar] [CrossRef]
  14. Ghijs, M.; Schäfer, E.; Kumar, A.; Cappuyns, P.; Van Assche, I.; De Leersnyder, F.; Vanhoorne, V.; De Beer, T.; Nopens, I. Modeling of semicontinuous fluid bed drying of pharmaceutical granules with respect to granule size. J. Pharm. Sci. 2019, 108, 2094–2101. [Google Scholar] [CrossRef] [PubMed]
  15. Fonteyne, M.; Soares, S.; Vercruysse, J.; Peeters, E.; Burggraeve, A.; Vervaet, C.; Remon, J.P.; Sandler, N.; De Beer, T. Prediction of quality attributes of continuously produced granules using complementary pat tools. Eur. J. Pharm. Biopharm. 2012, 82, 429–436. [Google Scholar] [CrossRef] [PubMed] [Green Version]
  16. Barrera Jiménez, A.A.; Van Hauwermeiren, D.; Peeters, M.; De Beer, T.; Nopens, I. Improvement of a 1D Population Balance Model for Twin-Screw Wet Granulation by Using Identifiability Analysis. Pharmaceutics 2021, 13, 692. [Google Scholar] [CrossRef] [PubMed]
  17. Van Hauwermeiren, D. On the Simulation of Particle Size Distributions in Continuous Pharmaceutical Wet Granulation. Ph.D. Thesis, Ghent University, Ghent, Belgium, 2020. [Google Scholar]
  18. Smola, A.; Gretton, A.; Song, L.; Schölkopf, B. A Hilbert space embedding for distributions. In Proceedings of the International Conference on Algorithmic Learning Theory, San Diego, CA, USA, 13–15 June 2007; pp. 13–31. [Google Scholar]
  19. Waskom, M.L. Seaborn: Statistical data visualization. J. Open Source Softw. 2021, 6, 3021. [Google Scholar] [CrossRef]
  20. Badawy, S.; Pandey, P. Design, development, and scale-up of the high-shear wet granulation process. In Developing Solid Oral Dosage Forms; Elsevier: Amsterdam, The Netherlands, 2017; pp. 749–776. [Google Scholar]
  21. De Simone, V.; Caccavo, D.; Dalmoro, A.; Lamberti, G.; d’Amore, M.; Barba, A.A. Inside the phenomenological aspects of wet granulation: Role of process parameters. In Granularity in Materials Science; InTech: London, UK, 2018; pp. 63–84. [Google Scholar]
  22. Zuurman, K.; Riepma, K.; Bolhuis, G.; Vromans, H.; Lerk, C. The relationship between bulk density and compactibility of lactose granulations. Int. J. Pharm. 1994, 102, 1–9. [Google Scholar] [CrossRef]
  23. Granutools™. Small Doses Analysis Using Granuheap™. Available online: https://www.granutools.com/en/news/92_small-doses-analysis-using-granuheap (accessed on 20 May 2021).
  24. Kudo, Y.; Yasuda, M.; Matsusaka, S. Effect of particle size distribution on flowability of granulated lactose. Adv. Powder Technol. 2020, 31, 121–127. [Google Scholar] [CrossRef]
  25. Vandevivere, L.; Denduyver, P.; Portier, C.; Häusler, O.; De Beer, T.; Vervaet, C.; Vanhoorne, V. Influence of binder attributes on binder effectiveness in a continuous twin screw wet granulation process via wet and dry binder addition. Int. J. Pharm. 2020, 585, 119466. [Google Scholar] [CrossRef]
  26. Kotamarthy, L.; Metta, N.; Ramachandran, R. Understanding the Effect of Granulation and Milling Process Parameters on the Quality Attributes of Milled Granules. Processes 2020, 8, 683. [Google Scholar] [CrossRef]
  27. Nitert, B.J.; Hounslow, M.J. Moisture content distribution in semibatch drying processes, part II. Falling particle drying rate. AIChE J. 2012, 58, 3708–3717. [Google Scholar] [CrossRef]
Figure 1. Schematic representation of the procedure followed to determine the four different sampling times by considering the filling time and bed temperature. To illustrate, this figure shows the bed temperature curve of experiment N9 with a total drying time of 1000 s.
Powders 02 00016 g001
Figure 2. Observed GSDs for J1F50 experiments. The gray curve represents the GSD after granulation or the initial GSD entering the dryer. The other curves were sampled after the fluid bed dryer, the drying time after filling is indicated by color. Each of the 8 subplots indicates a change in either LS, T or FT.
Powders 02 00016 g002
Figure 3. Observed GSDs for J1F50 center point experiments. The gray curve represents the GSD after granulation or the initial GSD entering the dryer. The other curves were sampled after the fluid bed dryer, the drying time after filling is indicated by color. Each of the 6 subplots indicates a repeated center point experiment at both LS ratios.
Powders 02 00016 g003
Figure 4. Observed LoD for J1F50 experiments. The gray curve represents the initial moisture content after granulation, while the other curves were sampled after the fluid bed dryer. The drying time after the filling period is indicated by color. The markers indicate the total fill level. From left to right, the dry inlet air temperature is increased. While the LS ratio is decreased from top to bottom.
Powders 02 00016 g004
Figure 5. Measured AoRs across all J1F50 experiments. Results are compared between the low LS and high LS for air-dried granules, marker color corresponds to the drying times after the filling period. The x-axis corresponds with the experimental number as given in Table A2.
Powders 02 00016 g005
Figure 6. Measured AoRs for the U2SF50, U2D50 and G1R50 experiments varying the LS ratio (left), inlet air temperature (middle) and fill level (right). Marker color corresponds to the formulation type. Both the average and 95% confidence interval are shown for each experiment.
Powders 02 00016 g006
Figure 7. Measured friability for the U2SF50, U2D50 and G1R50 experiments varying the LS ratio (left), inlet air temperature (middle) and fill level (right). Marker color corresponds to the formulation type. Both the average and 95% confidence interval are shown for each experiment.
Powders 02 00016 g007
Figure 8. Observed GSDs for J2F5 center point experiments. The gray curve represents the GSD after granulation or the initial GSD entering the dryer. The other curves were sampled after the fluid bed dryer, the drying time after filling is indicated by color. Each of the 3 subplots indicates a repeated center point experiment.
Powders 02 00016 g008
Figure 9. Observed LoD for J2F5 experiments. The gray curve represents the initial moisture content after granulation, while the other curves were sampled after the fluid bed dryer. The drying time after the filling period is indicated by color. The markers indicate the varied process setting LS ratio (left), inlet air temperature (middle), total fill level (right).
Powders 02 00016 g009
Disclaimer/Publisher’s Note: The statements, opinions and data contained in all publications are solely those of the individual author(s) and contributor(s) and not of MDPI and/or the editor(s). MDPI and/or the editor(s) disclaim responsibility for any injury to people or property resulting from any ideas, methods, instructions or products referred to in the content.