1. Introduction
Surface wind climatologies have shown a general decline in wind speed observations across the Earth during the 20th century [
1]. Much of the research has focused on two variables to explain the decreasing spatial and temporal surface wind speed patterns found across regional and global studies. The first explanation is that changes in wind speed are related to a poleward shift in the latitude of the steepest temperature and pressure gradients, leaving more of the Earth’s surface under the influence of weak pressure gradients [
2,
3,
4,
5,
6,
7,
8,
9]. The second reason is that urbanization [
4,
10,
11,
12,
13,
14] and land cover change [
9,
15,
16,
17,
18,
19] across North America, South America, Europe, Asia, and Australia have weakened surface winds by increasing surface friction. Klink (1999) suggested that modifications in the pressure gradient and surface roughness could affect not only surface winds but also vertical mixing of atmospheric winds [
2]. In fact, analyses have examined the relationship between surface wind speeds and evapotranspiration to understand how changes in vertical forcing could impact hydrological processes [
1,
20,
21,
22,
23,
24].
Atmospheric teleconnection indices are also frequently used to explain changes in surface wind speed trends [
6,
13,
19,
25,
26,
27,
28,
29,
30]. For example, Chen et al. (2013) identified surface wind speed patterns based on the temporal phases of the Arctic Oscillation (AO) and El Niño–Southern Oscillation (ENSO) for China between 1971 and 2007 [
25]. The study found that under positive AO, wind speeds declined across most of China, while increased (decreased) speeds were observed over northern (southern) China during positive ENSO (Niño 3.4 region) phases. This spatial shifting of wind speeds across the continent of Asia under the different phases of ENSO could influence the position of the East Asian monsoon [
31,
32,
33,
34]. Therefore, studies have analyzed alterations in macro-scale atmospheric circulations to explain near-surface wind trends across the globe [
7,
19,
35,
36]. However, many of these studies only examined a single level of the troposphere (850 or 500 hPa) to evaluate changes in macro-scale circulation and its possible relationship with surface winds.
The most complete upper-level wind trend analysis has been performed by Vautard et al. (2010) [
15]. It revealed positive annual mean upper-level (i.e., 850, 700, 500, and 200 hPa) wind trends for western Europe and North America during 1979–2008, which does not support the present literature on terrestrial wind speed changes. As a result, Vautard et al. (2010) suggested that increases in surface roughness due to vegetation could explain the reduction in surface winds observed across Western Europe and North America, while changes in the Asian Monsoon from climate change and air pollution could be attributed to the decreasing surface and tropospheric winds across China [
15]. However, a more recent study by Wang et al. (2023) described an increasing (decreasing) winter trend in upper-level winds north (south) of 25° N and above 500 hPa for China between 1979 and 2021 [
37]. Their work concluded that meridional temperature changes could be attributed to the transition of wind speeds in the upper atmosphere. Wang et al. (2023) also highlighted that lower tropospheric wind trends (850 and 700 hPa) have shifted from a negative to positive trend after 2004 because of changes in surface roughness length, aerosol optical depth, and ground sensible heat flux [
37].
McVicar et al. (2012) documented that near-surface wind trend climatology research has focused on North America, Europe, and Asia at the expense of Central and South America over the last decade [
1]. Much of the research on Latin America has focused on evaluating the geographical and temporal surface wind speed trends and the potential implications on wind energy production for northeastern and southeastern Latin America [
38,
39,
40,
41,
42,
43,
44,
45,
46,
47,
48,
49,
50]. In addition, recent studies have examined upper-level tropospheric wind trends through the comparison of radiosonde and reanalysis products across the Northern Hemisphere [
37,
51,
52,
53]. However, the only study to date that has examined upper-level wind trends in South America with radiosonde and reanalysis climate data was performed by Merino and Gassmann (2022) [
9]. Their work investigated annual and seasonal tropospheric wind trend changes in Argentina during 1990–2020. Therefore, this provides an opportunity to analyze whether upper-level wind trend characteristics over Brazil match trends observed elsewhere. Wind energy is a growing industry in Brazil and accounts for more than 70% of the installed capacity in Latin America [
54]. Any modification in tropospheric winds may influence current and potential onshore energy production for northeastern and southeastern Brazil, where most of the renewable energy is generated. As a result, the goal of this study is to examine the spatial and temporal patterns of upper-level wind trends based on radiosonde data and climate reanalysis products for Brazil. The results show how atmospheric winds changed from a three-dimensional (3D) perspective and provide a foundation to understand how wind speeds vary not only from a vertical but also from a spatial (horizontal) standpoint for Brazil from 1980 to 2022.
2. Materials and Methods
An overview of the radiosonde and reanalyses used to identify the spatial and temporal upper-level wind speed trends of Brazil is shown in
Table 1. The first dataset considered is the Integrated Global Radiosonde Archive, version 2 (IGRAv2) [
55,
56]. IGRAv2 is a global radiosonde repository maintained by the National Centers for Environmental Information (NCEI). This database is composed of daily (0 and 12 UTC) radiosonde and pilot balloon records from more than 2800 global stations that consists of pressure, temperature, geopotential height, dewpoint depression, wind direction, and wind speed for surface and significant levels of the atmosphere. Based on the data available from IGRAv2, this study selected wind speed observations from 7 standard atmospheric pressure levels (850, 700, 500, 400, 300, 250, and 200, hPa) to characterize the austral summer (DJF) and winter (JJA) upper-level wind trends across Brazil for the period of 2000 to 2022. The 23-year period was based on a frequency criterion used to select radiosonde stations for the study area. Sites were selected when more than half (12 years) of the years are present for each season. This selection process follows the guidelines described by Vautard et al. (2010) [
15].
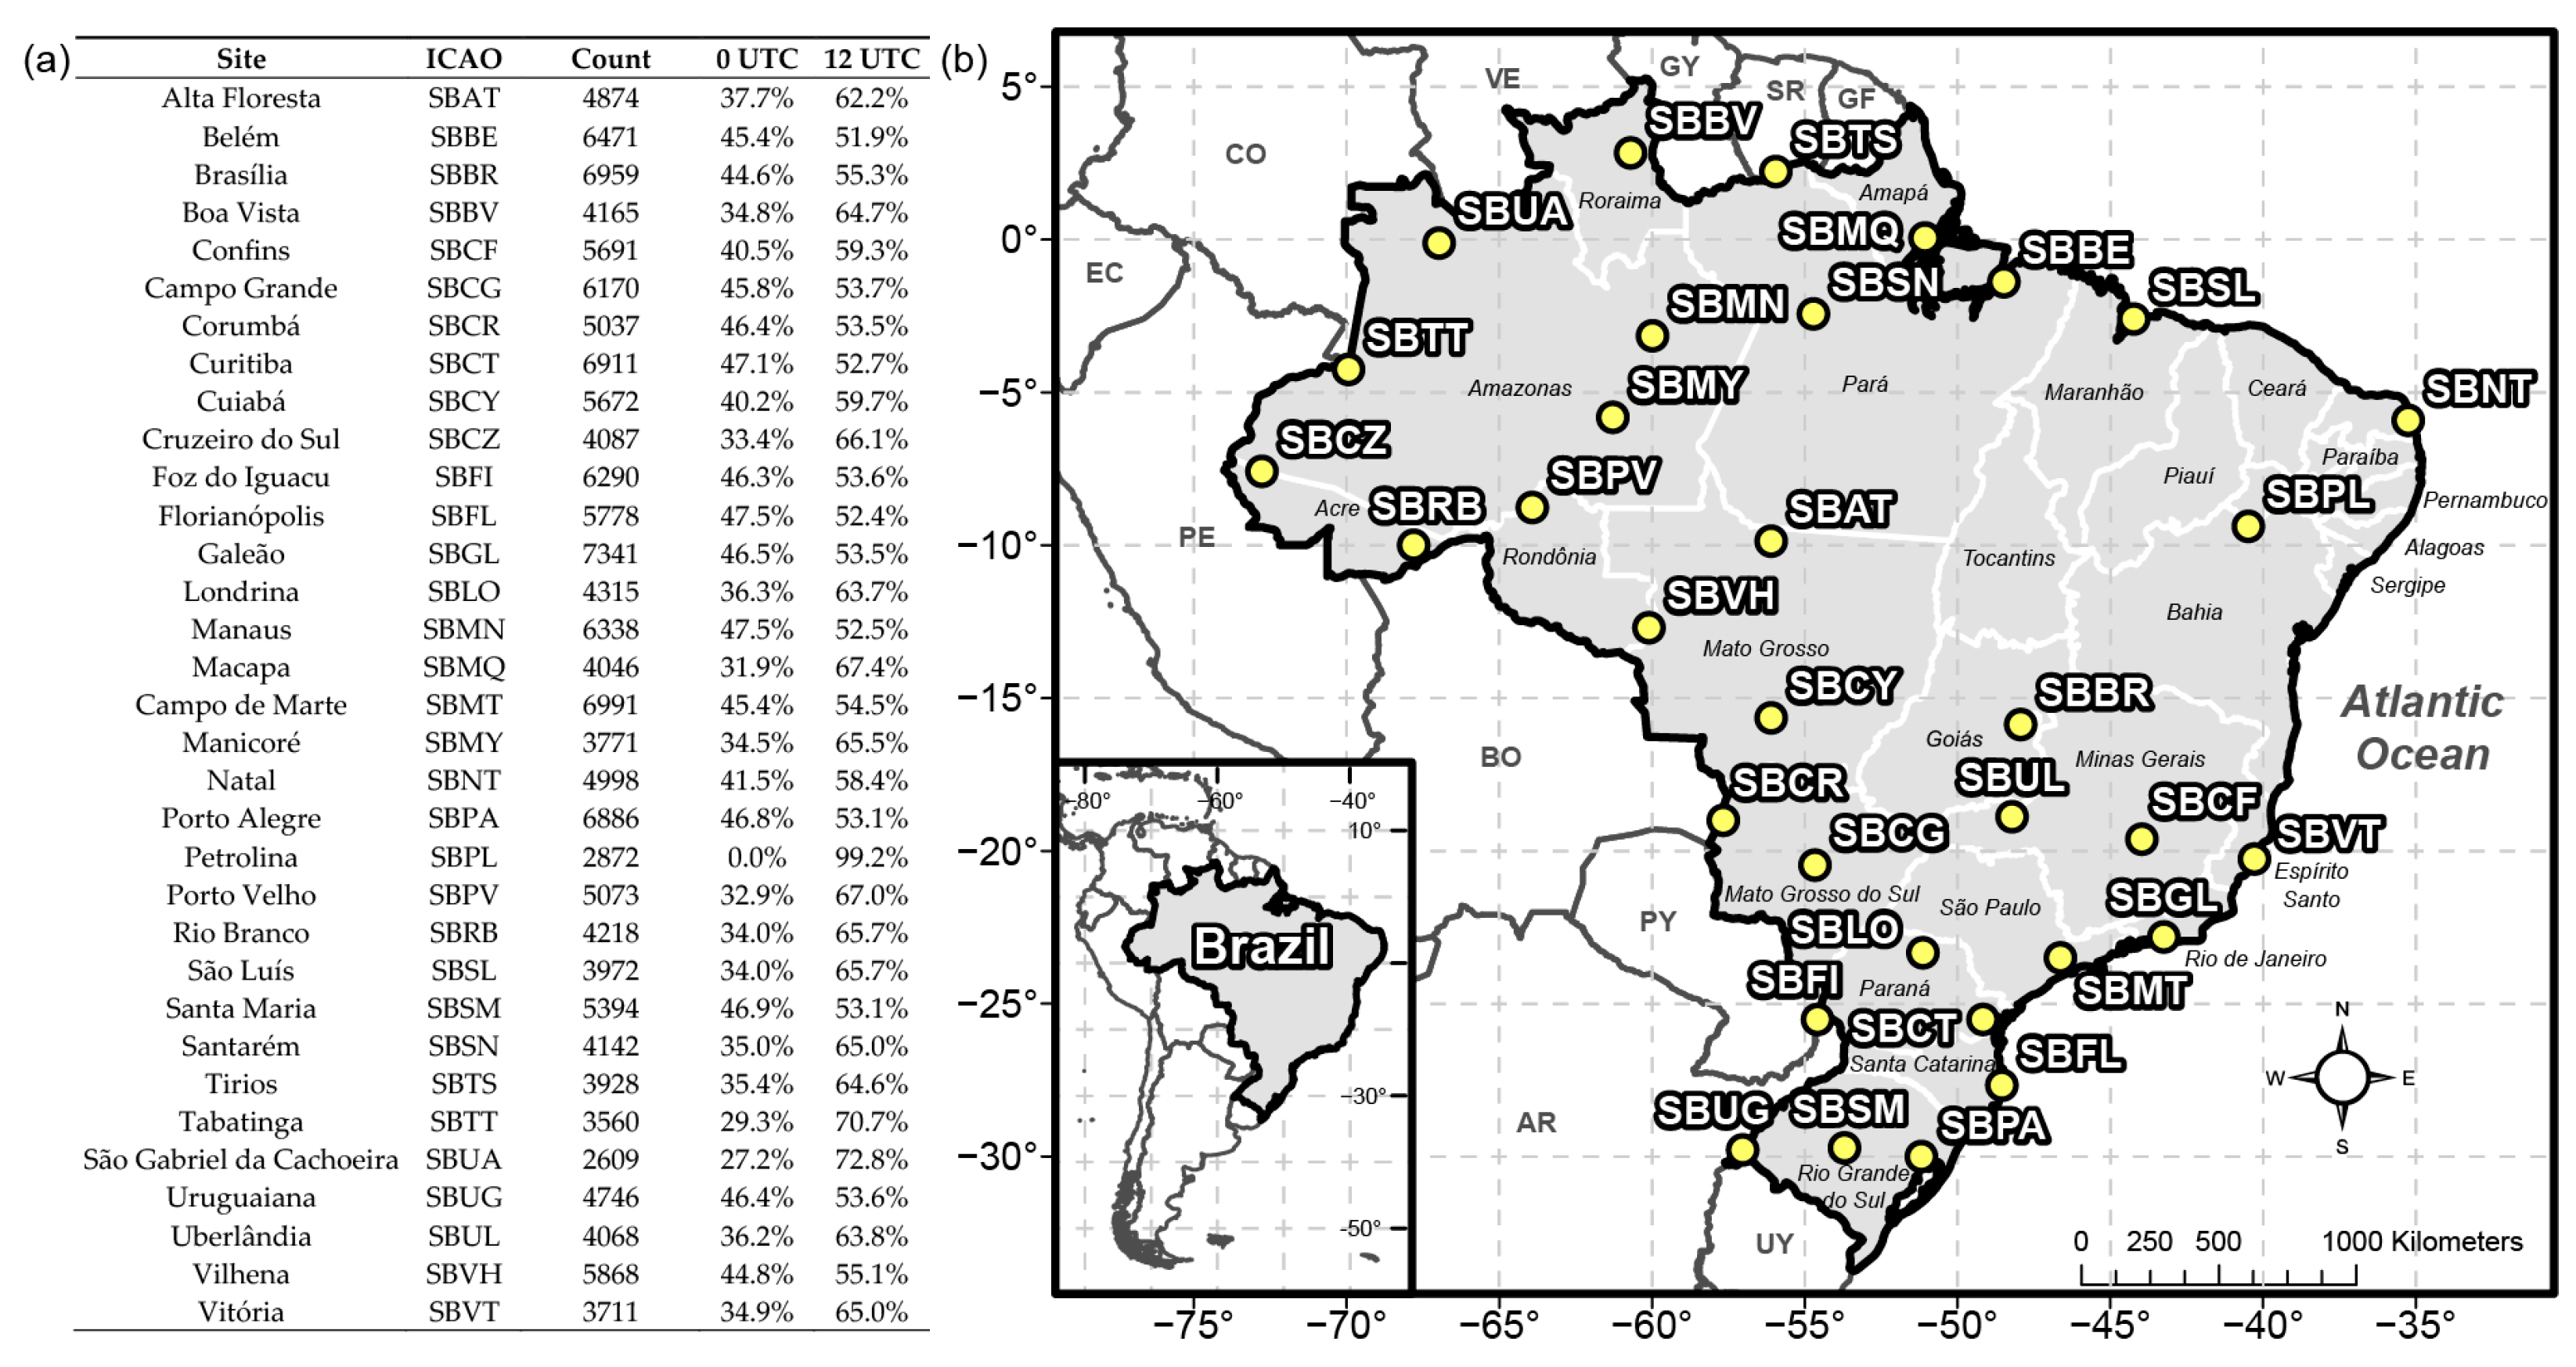
Figure 1 shows the count frequency (based on UTC) of sounding observations and the geographic location of the 33 radiosonde stations used to describe the upper-level wind trends of Brazil.
Reanalysis products were included because of the limited temporal and spatial coverage of radiosonde data available for Brazil. Five reanalyses were used to describe the upper-level wind speed trends for Brazil from 1980 to 2022. The data period selected was based on the temporal accessibility of each reanalysis. First, the National Center for Environmental Prediction/National Center for Atmospheric Research (NCEP/NCAR) reanalysis (Reanalysis 1—R1) is a 28-global-level numerical model that assimilates surface and atmospheric variables at a horizontal resolution of 2.5° × 2.5° (T62) beginning in 1948 [
57]. Second, the National Center for Environmental Prediction and Department of Energy (NCEP/DOE) reanalysis (Reanalysis 2—R2) is an updated version of NCEP/NCAR R1, with improved parameterization of physical processes and fixed errors found with NCEP/NCAR R1 [
58]. NCEP/DOE R2 is similarly constructed at a horizontal grid scale of 2.5° × 2.5° (T62) for each pressure field (28 levels), like NCEP/NCAR R1, but with a temporal resolution starting in 1979. It is important to acknowledge that NCEP/NCAR R1 and NCEP/DOE R2 are first and second-order generation reanalyses. They are described with upper-level atmospheric variables (e.g., temperature, geopotential heights, and zonal and meridional winds) assimilated in NCEP/NCAR R1, which are particularly influenced by the observed (radiosonde) data [
57].
Since these initial first- and second-generation reanalyses, improved assimilation schemes and enhanced datasets (satellite) have been developed and implemented into the latest state-of-the-art reanalysis products. Consequently, this study examined 3 of the latest reanalysis products as part of this work. First, the European Centre for Medium-Range Weather Forecasts (ECMWF) Reanalysis Version 5 (ERA5) is a fifth-generation reanalysis dataset constructed at a 0.25° × 0.25° (T639) resolution for 137 atmospheric pressure levels during the period of 1940 to present [
59]. Second, the Climate Forecast System Reanalysis (CFSR) and the Climate Forecast System Reanalysis, version 2 (CFSRv2), hereafter known as CFSR, were constructed at a spatial resolution of 0.5° × 0.5° (T382) for 37 pressure levels of the atmosphere between 1979 and 2010 [
60,
61]. CFSRv2 is a continuation of the original CFSR dataset implemented since 2011. The final state-of-the-art reanalysis product used is the Modern-ERA Retrospective Analysis for Research and Applications, version 2 (MERRA-2) [
62]. MERRA-2 is devised at a horizontal resolution of 0.5° × 0.625° for 72 hybrid sigma/pressure levels starting in 1980. MERRA-2 is an updated version of MERRA, which includes modifications to the forecasting model, analysis algorithm, observing system, radiance assimilation, correction of aircraft observations, mass conservation and water balance, boundary conditions of sea surface temperature and sea ice concentration, and reanalysis production [
63].
Data obtained from the 5 reanalyses consisted of u (west–east) and v (south–north) wind components (m s−1), geopotential height (m), and temperature (K) values for 7 mandatory pressure levels (850, 700, 500, 400, 300, 250, and 200 hPa) of the atmosphere from 1980 to 2022. Upper-level wind speeds for each grid point are calculated from the u and v wind components extracted from each reanalysis.
Austral summer and winter mean wind speeds, geopotential heights, and temperatures were calculated based on the 7 mandatory pressure levels for each radiosonde and reanalysis grid field. Sen’s slope estimator, a non-parametric statistical test, was used to calculate seasonal linear trends or slopes for every radiosonde and grid field [
64]. The Mann–Kendall test was then applied to describe the association (statistical significance;
p < 0.05) between wind speed, the time period, and the reanalysis grid field located in Brazil [
65,
66]. Both statistical methods have been used to examine changes in
u and
v winds of atmospheric circulations to help explain lower-level wind trends [
5,
7,
9]. The resultant seasonal trends were finally analyzed at each mandatory pressure level through a vertical profile and by constructing a 3D model through geographical information systems (GISs). This was achieved by intersecting each individual point to its assigned field (latitude and longitude) through the generation of a tessellated grid (see
Table 1) of square polygons for each reanalysis. Grid fields that overlapped the study area were only selected to account for any bias introduced into the analysis by underlying geographic and oceanic factors. To construct a 3D model of wind, geopotential height, or temperature trend, each mandatory pressure level analyzed was designated with a given elevation value and assigned to a group. For this study, two pressure height groups were developed: the first one was used to provide an overview of the lower, middle, and upper tropospheric (850, 700, 500, and 250 hPa) trends, while the second examines only the upper atmosphere (400, 300, 250, and 200 hPa) across Brazil. After the construction of the two pressure height groups, a GIS was used to visually display how wind, temperature, and geopotential height trends changed across Brazil during the 43-year study period.
3. Results
3.1. Radiosonde Wind Trends
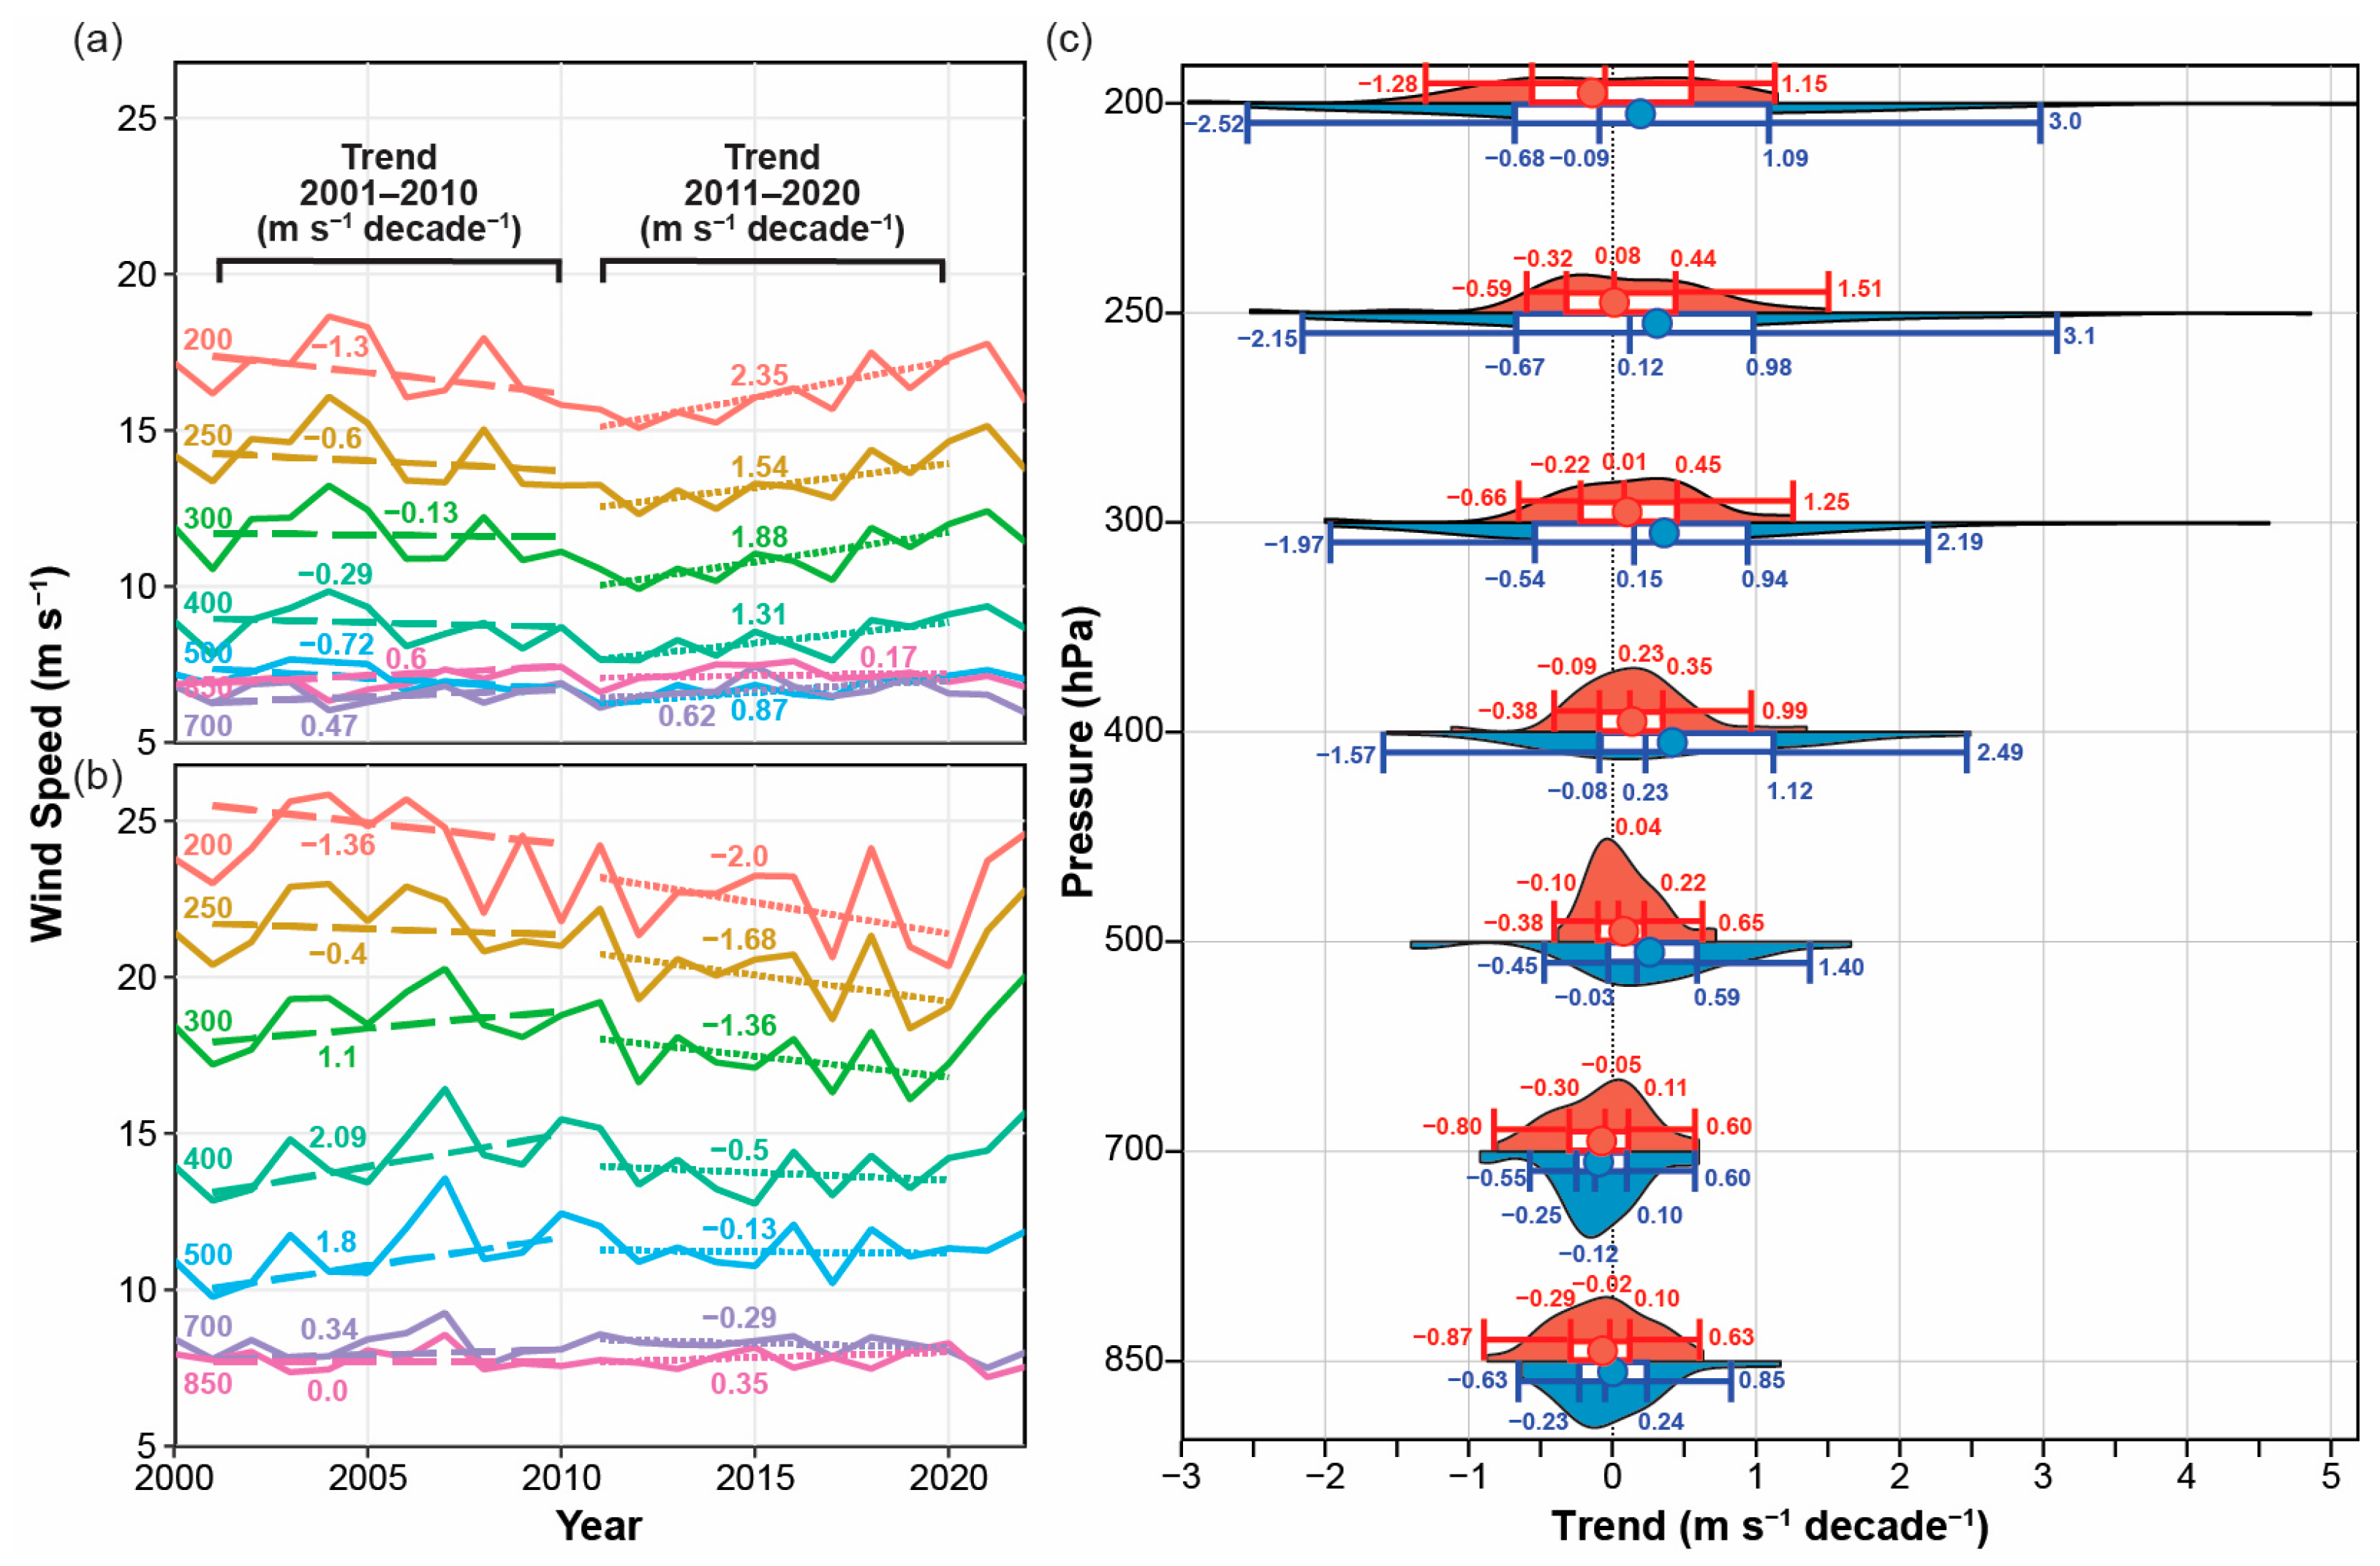
Figure 2 depicts the seasonal wind speed trends from a decadal (2001–2010 and 2011–2020) and entire study period (2000–2022) perspective based on seven mandatory pressure heights across Brazil. Austral summer reveals how middle and upper tropospheric (between 500 and 200 hPa) winds have decreased by between −0.13 and −1.3 m s
−1 decade
−1 and lower tropospheric winds have increased (0.47 to 0.6 m s
−1 decade
−1) between 2001 and 2010 (
Figure 2a). However, winter shows positive wind speed trends except for the upper tropospheric (above 300 hPa) [
Figure 2b]. The largest positive wind trends are observed in the middle atmosphere (500 and 400 hPa) where wind speeds have increased between by 1.8 and 2.09 m s
−1 decade
−1. The positive wind speed trend continues until reaching the planetary boundary layer (PBL). When examining the second decade (2011–2020), an opposing wind speed trend pattern is observed between summer and winter. All mandatory pressure levels above 850 hPa describe positive (negative) wind trends for summer (winter). The largest (smallest) wind speed trend changes are reported in the upper (lower) atmosphere across Brazil.
Figure 2c shows the vertical profile of summer (red) and winter (blue) mean wind speed trends based on 33 Brazilian radiosonde sites between 2000 and 2022. The shape of the mean summer wind speed trends appears symmetrical in the lower and middle troposphere. The mean wind trend is −0.07 and −0.8 m s
−1 decade
−1 for 850 and 700 hPa and shifts to a positive trend of 0.08 m s
−1 decade
−1 at 500 hPa. Once above the middle atmosphere, the shape of wind trends begins to spread outwards from the mean in the upper troposphere. Average wind speed trends are positive and increasing with elevation with rates of 0.14, 0.10, and 0.01 m s
−1 decade
−1 at 400, 300, and 250 hPa, respectively.
For winter, the dispersion of the mean trend follows a similar seasonal pattern compared to summer in the lower atmosphere. Average wind speeds have changed at a range of 0.002 and −0.1 m s−1 decade−1 for 850 and 700 hPa. In the middle troposphere (500 hPa), a left-skewed mean trend is established where wind speeds have increased at a rate of 0.26 m s−1 decade−1, followed by the maximum mean trend occurring at 400 hPa (0.42 m s−1 decade−1). Lastly, in the upper atmosphere, the mean trend becomes more skewed but the overall average changes lessen to a rate of 0.36, 0.31, and 0.2 m s−1 decade−1 at 300, 250, and 200 hPa.
The interquartile range (IQR) continues to reflect continuity in the lower and middle atmosphere for IGRAv2 during summer. The range between the first (25%) and third (75%) quartiles are 0.47, 0.41, and 0.32 m s−1 decade−1 for 850, 700, and 500 hPa. The largest IQR change is found in proximity of the jet stream with ranges of 0.67, 0.79, and 1.11 m s−1 decade−1 for 300, 250, and 200 hPa. In addition, the minimum (5%) and maximum (95%) are consistent with the distribution of mean wind speed trends, with the smallest difference observed at 500 hPa (1.03 m s−1 decade−1) followed by 700 and 850 hPa (1.4 and 1.5 m s−1 decade−1). Wind ranges begin to increase between the whiskers at 300 hPa, (1.91 m s−1 decade−1), with the largest deviations reported at the top of the troposphere for 250 and 200 hPa (2.1 and 2.43 m s−1 decade−1).
Winter IQRs are at their smallest in the lower troposphere, with a range of 0.47 and 0.35 m s−1 decade−1 at 850 and 700 hPa. The magnitude of the IQR begins to increase in the middle troposphere at a range of 0.62 m s−1 decade−1 and progresses to its largest deviations in the upper atmosphere. Wind speed trends have a progressing IQR of 1.2, 1.48, 1.65, and 1.77 m s−1 decade−1 at 400, 300, 250, and 200 hPa. This expanding range of the mean coincides with the minimum and maximum mean wind trends across Brazil. The range of the mean wind speed is smallest at 850 and 700 hPa (1.48 and 1.15 m s−1 decade−1). The whisker range builds in the middle atmosphere and becomes positively skewed, with the largest ranges occurring in the upper troposphere. In proximity of the jet stream, the range between the minimum and maximum isare 4.16, 5.25, and 5.52 m s−1 decade−1 for 300, 250, and 200 hPa.
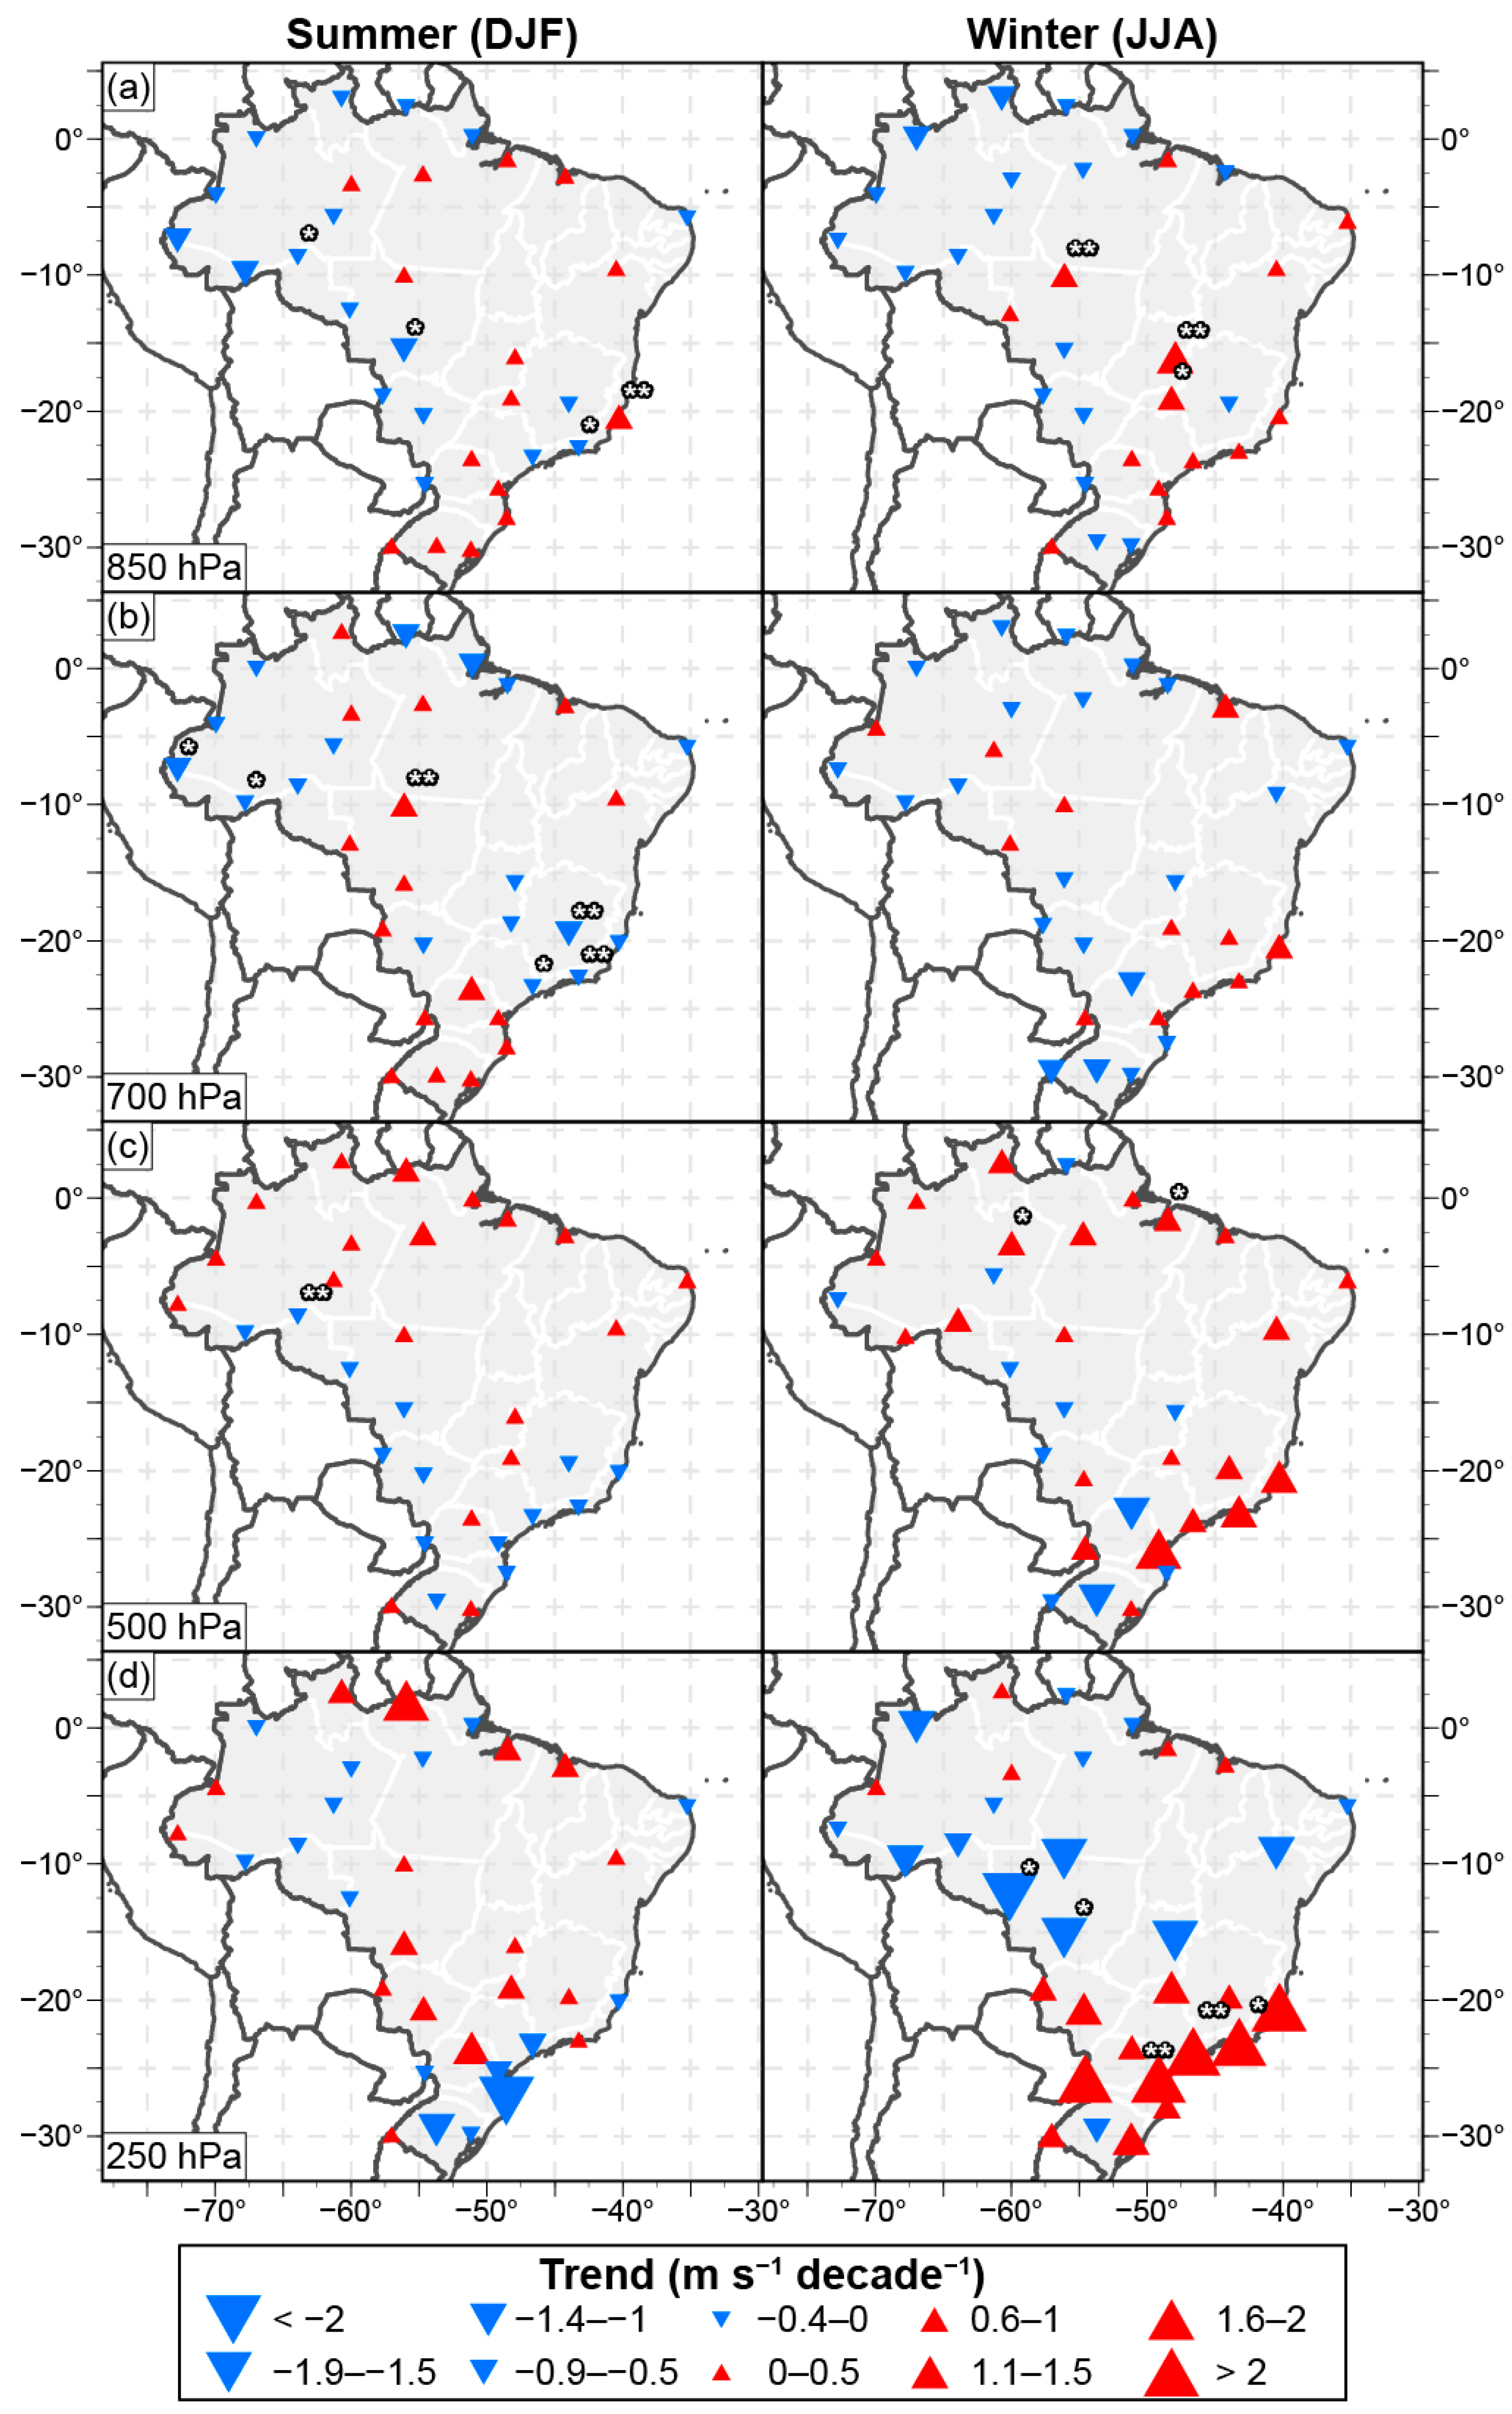
Figure 3 shows the mean summer (left column) wind speed trend at each Brazilian radiosonde site based on four mandatory pressure levels (850, 700, 500, and 250 hPa) during 2000–2022. During summer, mean wind trends are geographically linked to the lower troposphere (
Figure 3a,b). Decreasing (increasing) wind speed trends are identified in the Amazon basin (coastal Brazil). In addition, a secondary negative axis is also present in southeastern Brazil (São Paulo, Rio de Janeiro, and Minas Gerais). A geographical shift forms in the middle atmosphere where positive (negative) wind trends are noted equatorward (poleward) of 10° S, and a secondary positive axis is located within the interior Brazilian Highlands (
Figure 3c). Finally, in the upper troposphere, wind speed trends can be described in four zones at 250 hPa (
Figure 3d). First, positive wind trends are exhibited across the Guiana Highlands, where wind speeds have increased by 0.97 and 1.51 m s
−1 decade
−1 for Boa Vista (SBBV) and Óbidos (SBTS). Second, a negative wind trend (0.19–0.39 m s
−1 decade
−1) pattern is observed for eastern Amazonas and Rondônia. Next, a second negative wind trend region is noted for the interior of the Brazilian Highlands and Pantanal. Finally, a negative trend pattern is determined for southern and southeastern Brazil. Wind speeds have increased across this region at a rate of −0.46 m s
−1 decade
−1 at Porte Alegre (SBPA) and −2.5 m s
−1 decade
−1 at Florianópolis (SBFL).
The distribution of mean winter wind trends becomes clearer for Brazil (
Figure 3—right column) between 2000 and 2022. A comparable wind trend is described for the lower atmosphere (850 hPa), where most radiosonde sites exhibit a decrease in wind speeds for western Amazon, Pantanal, and the Guiana Highlands (
Figure 3a). Positive wind trends are present across eastern Amazon, the interior of the Brazilian Highlands, and a secondary forming across southeastern Brazil. The largest significant (
p < 0.05) increasing wind trends are seen at Brasília (SBBR) and Uberlândia (SBUL), with values of 1.17 and 0.85 m s
−1 decade
−1. Once above the lower troposphere, a transition is observed, with radiosondes reporting positive wind trends in the Amazon basin, coastal Brazil, and southeastern Brazil, while negative wind patterns are documented for the interior of Brazil and southern Brazil (
Figure 3c). The most prevalent upper-level wind pattern is detected in the subtropical latitudes at 250 hPa (
Figure 3d). Radiosonde sites located equatorward (poleward) of ~18° S exhibited decreasing (increasing) wind speeds over the last 23 years. The largest negative wind trends are in the states of Mato Grisso and Goiás where sites are statistically (
p < 0.05) reporting a wind decline between −1.67 and −2.15 m s
−1 decade
−1. All radiosonde sites except one observe increasing wind speeds (0.55–4.8 m s
−1 decade
−1) across southeastern and southern Brazil. The largest positive trends are found in proximity of coastal Brazil, with the cities of Curitiba (SBCT), São Paulo (SBMT), and Rio de Janeiro (SBGL) statistically reporting (
p < 0.01) wind speed increases of 4.9, 3.1, and 2.04 m s
−1 decade
−1.
3.2. Reanalysis Wind Trends
Table 2 displays the mean summer and winter wind speed trend for the five reanalyses based on seven mandatory pressure levels during 1980 to 2022. For summer, the mean distribution focuses on a marginal negative (−0.05 m s
−1 decade
−1) to positive (0.02 m s
−1 decade
−1) wind trend for each reanalysis at 850 hPa. Three (two) of the reanalyses exhibit negative (positive) trends across Brazil. This temporal pattern continues above 700 hPa, except for NCAR-NCAR R1 where the overall mean wind trend shifts from 0.02 to −0.016 m s
−1 decade
−1. The remaining four reanalyses observe a wind speed trend between −0.01 and 0.06 m s
−1 decade
−1 in this portion of the atmosphere. The range of mean trends remains normal until the middle troposphere (500 hPa). The overall mean is dependent on the generation of reanalysis but negative wind trends of −0.19, −0.07, and −0.17 m s
−1 decade
−1 are documented for NCEP-NCAR R1, NCEP/DOE R2, and CFSR, while ERA5 and MERRA-2 exhibit increasing wind speeds of 0.03 and 0.04 m s
−1 decade
−1 at 500 hPa. In the upper troposphere (300 to 250 hPa), each reanalysis excluding CFSR shows increasing wind speed trends ranging from 0.04 to 0.29 m s
−1 decade
−1. The largest positive wind trend is described for NCEP-NCAR R1, while the smallest increasing trends occur for ERA5 and MERRA-2. A divergent pattern is noted for CFSR where the mean wind trend is negative for all mandatory pressure levels during summer except at 700 hPa.
Figure 3.
Austral summer (DJF—left column) and winter (JJA—right column) wind speed trends (m s−1 decade−1) of 4 mandatory atmospheric pressure levels, (a) 850, (b) 700, (c) 500, (d), and 250 hPa, for the 33 IGRAv2 radiosonde stations used in Brazil during 1980–2022. * (**) indicates that the correlation is statistically significant at the 95% (99%) confidence level.
When evaluating winter, the magnitude of the mean wind trend is higher compared to summer. During this season, three atmospheric trend patterns are described, as shown in
Table 2. First, all reanalyses except ERA5 exhibit wind speeds that are decreasing across Brazil at 850 hPa. The largest (smallest) negative trends are seen with the older (newer) generation of reanalyses. Wind speeds have decreased at a rate of −0.14 and −0.22 (−0.04 and −0.07) m s
−1 decade
−1 for NCEP-NCAR R1 and NCEP/DOE R2 (MERRA-2 and CFSR). This negative wind trend pattern continues for NCEP-NCAR R1, NCEP/DOE, and MERRA-2 into 700 hPa. A second wind trend is observed in the middle troposphere (500 and 400 hPa) for each reanalysis except NCEP-NCAR R1. Wind speeds have increased between 0.07 and 0.34 m s
−1 decade
−1 depending upon pressure level and climate reanalysis. A final group is presented in the upper atmosphere for each reanalysis. All reanalyses show their largest decrease in wind speed at 250 or 200 hPa, except for CFSR which occurs at 300 hPa. The large negative trend change (−0.15 to −0.67 m s
−1 decade
−1) suggests that an atmospheric circulation pattern is influencing wind speed patterns in the upper atmosphere. Therefore, mechanisms contributing to spatial differences in upper-level trends across Brazil should be examined.
3.3. 3D Wind Trends
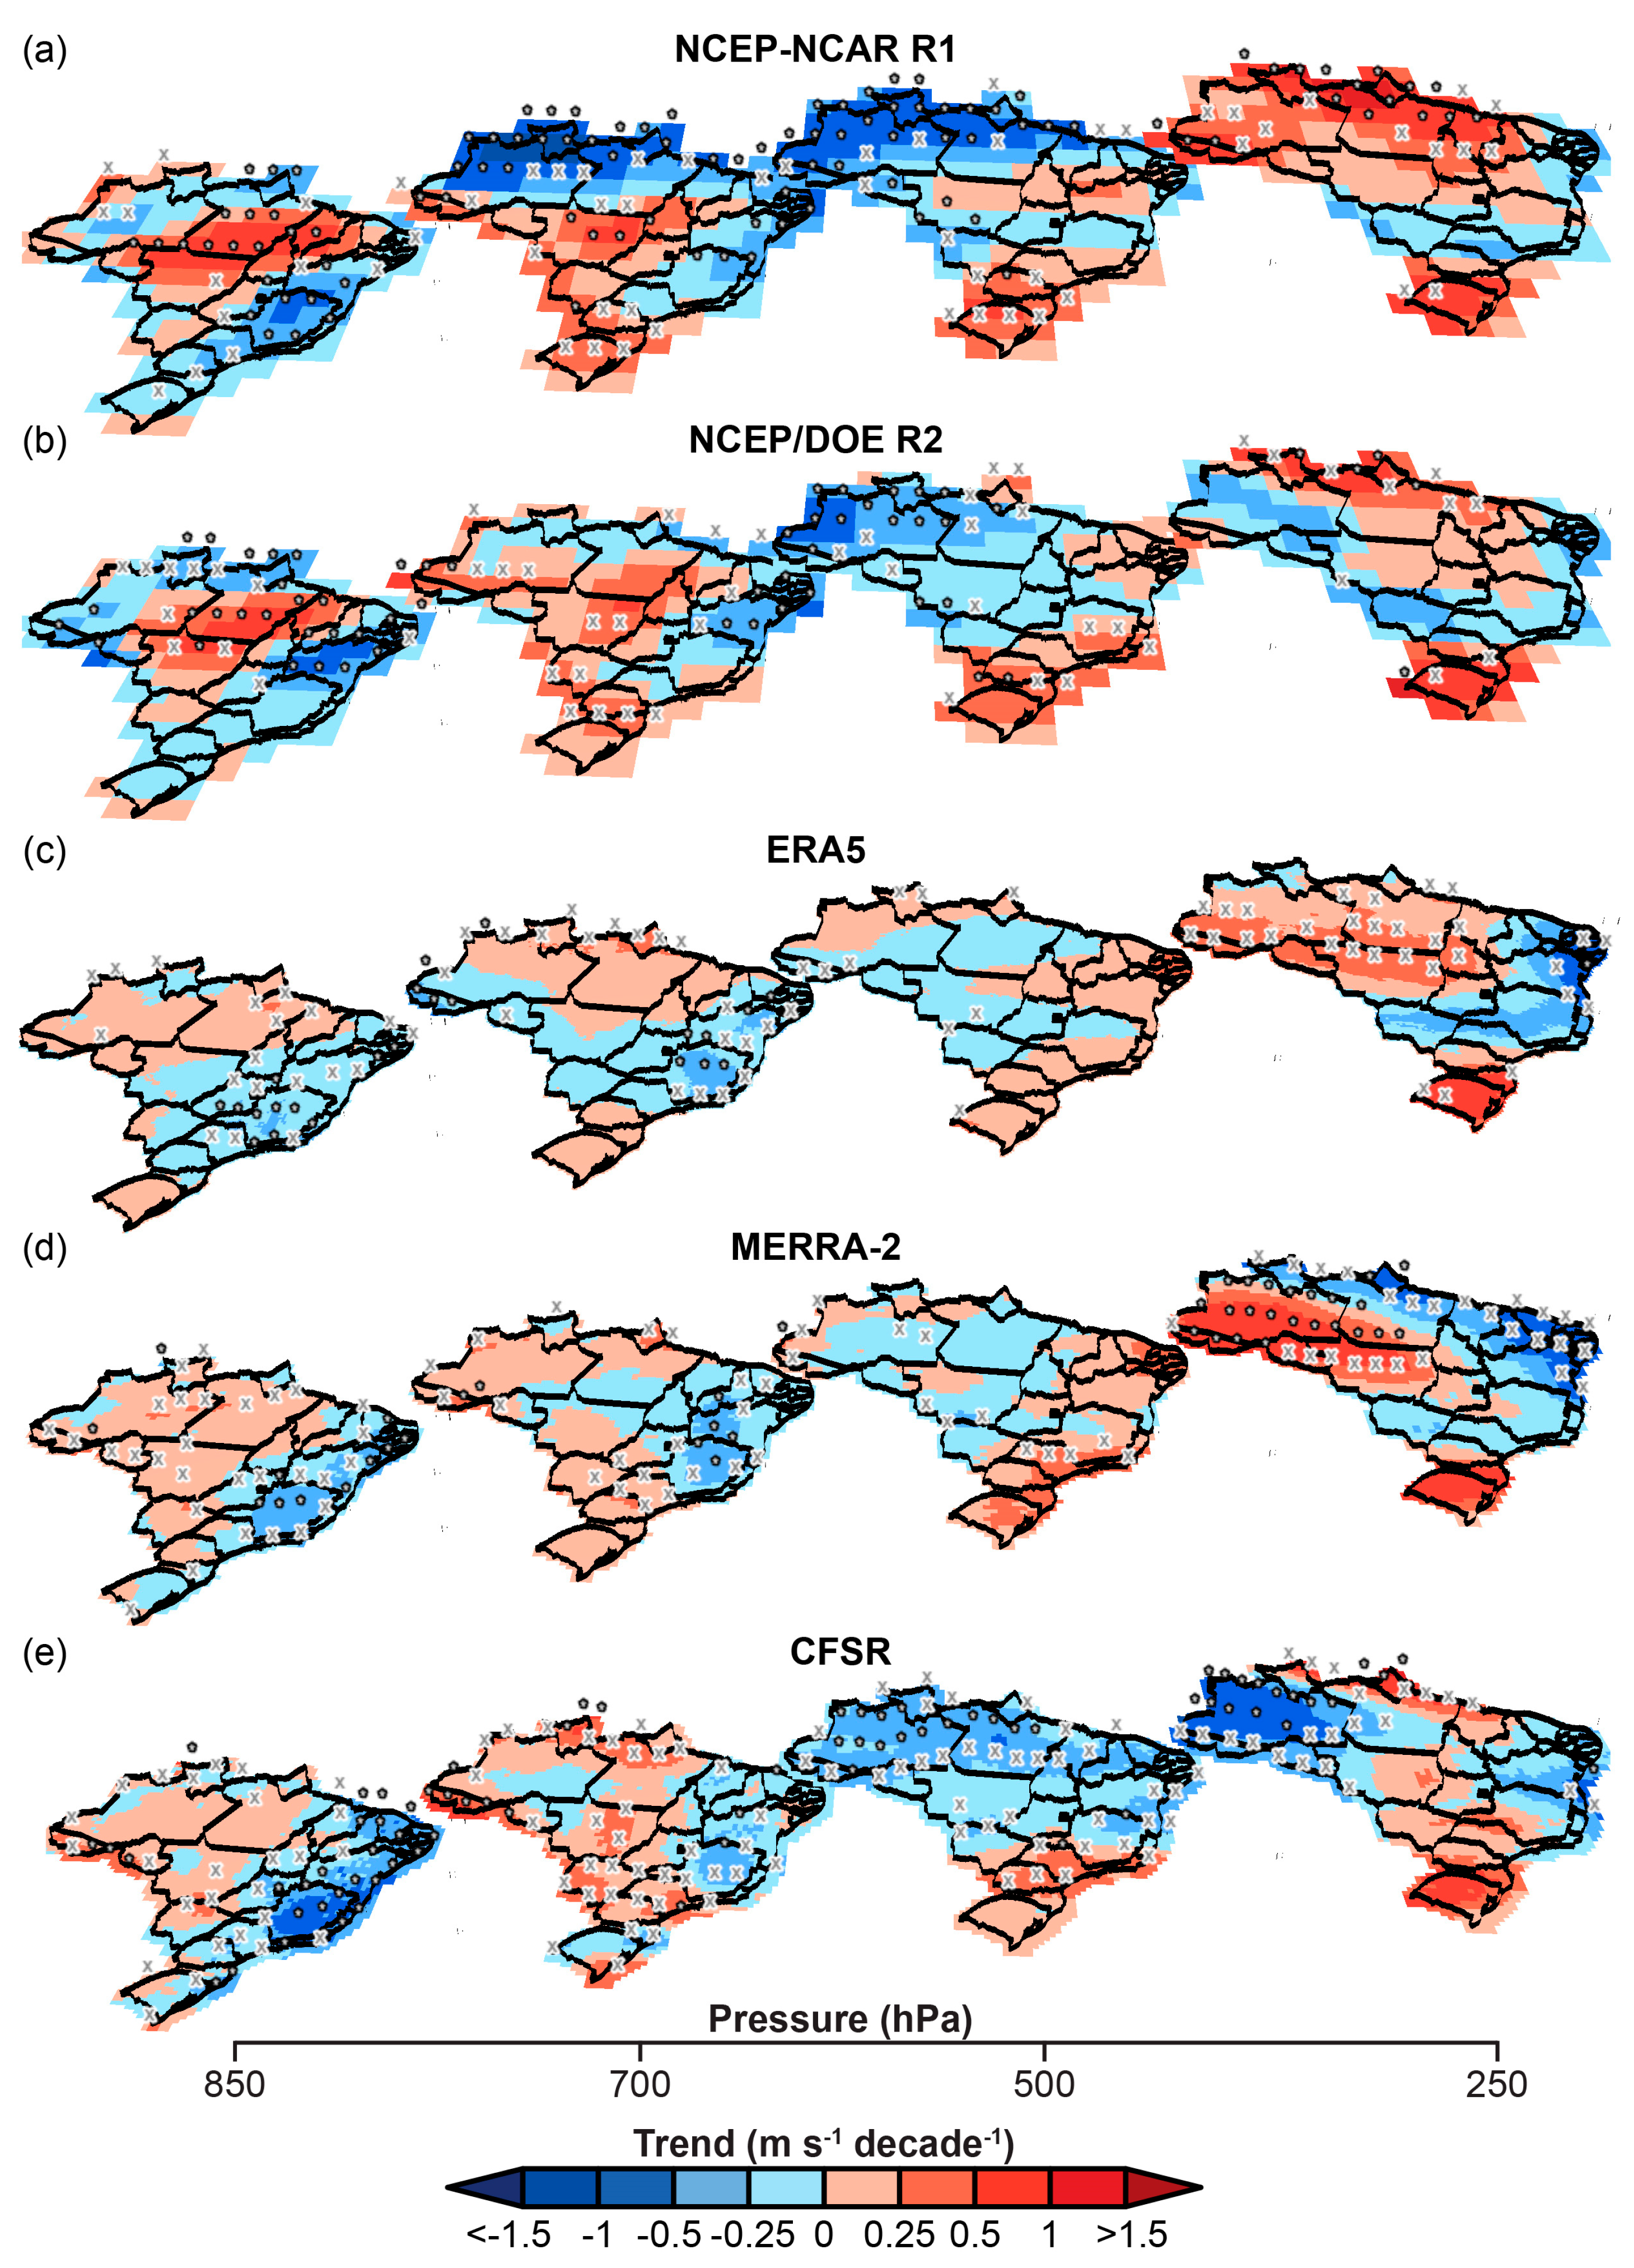
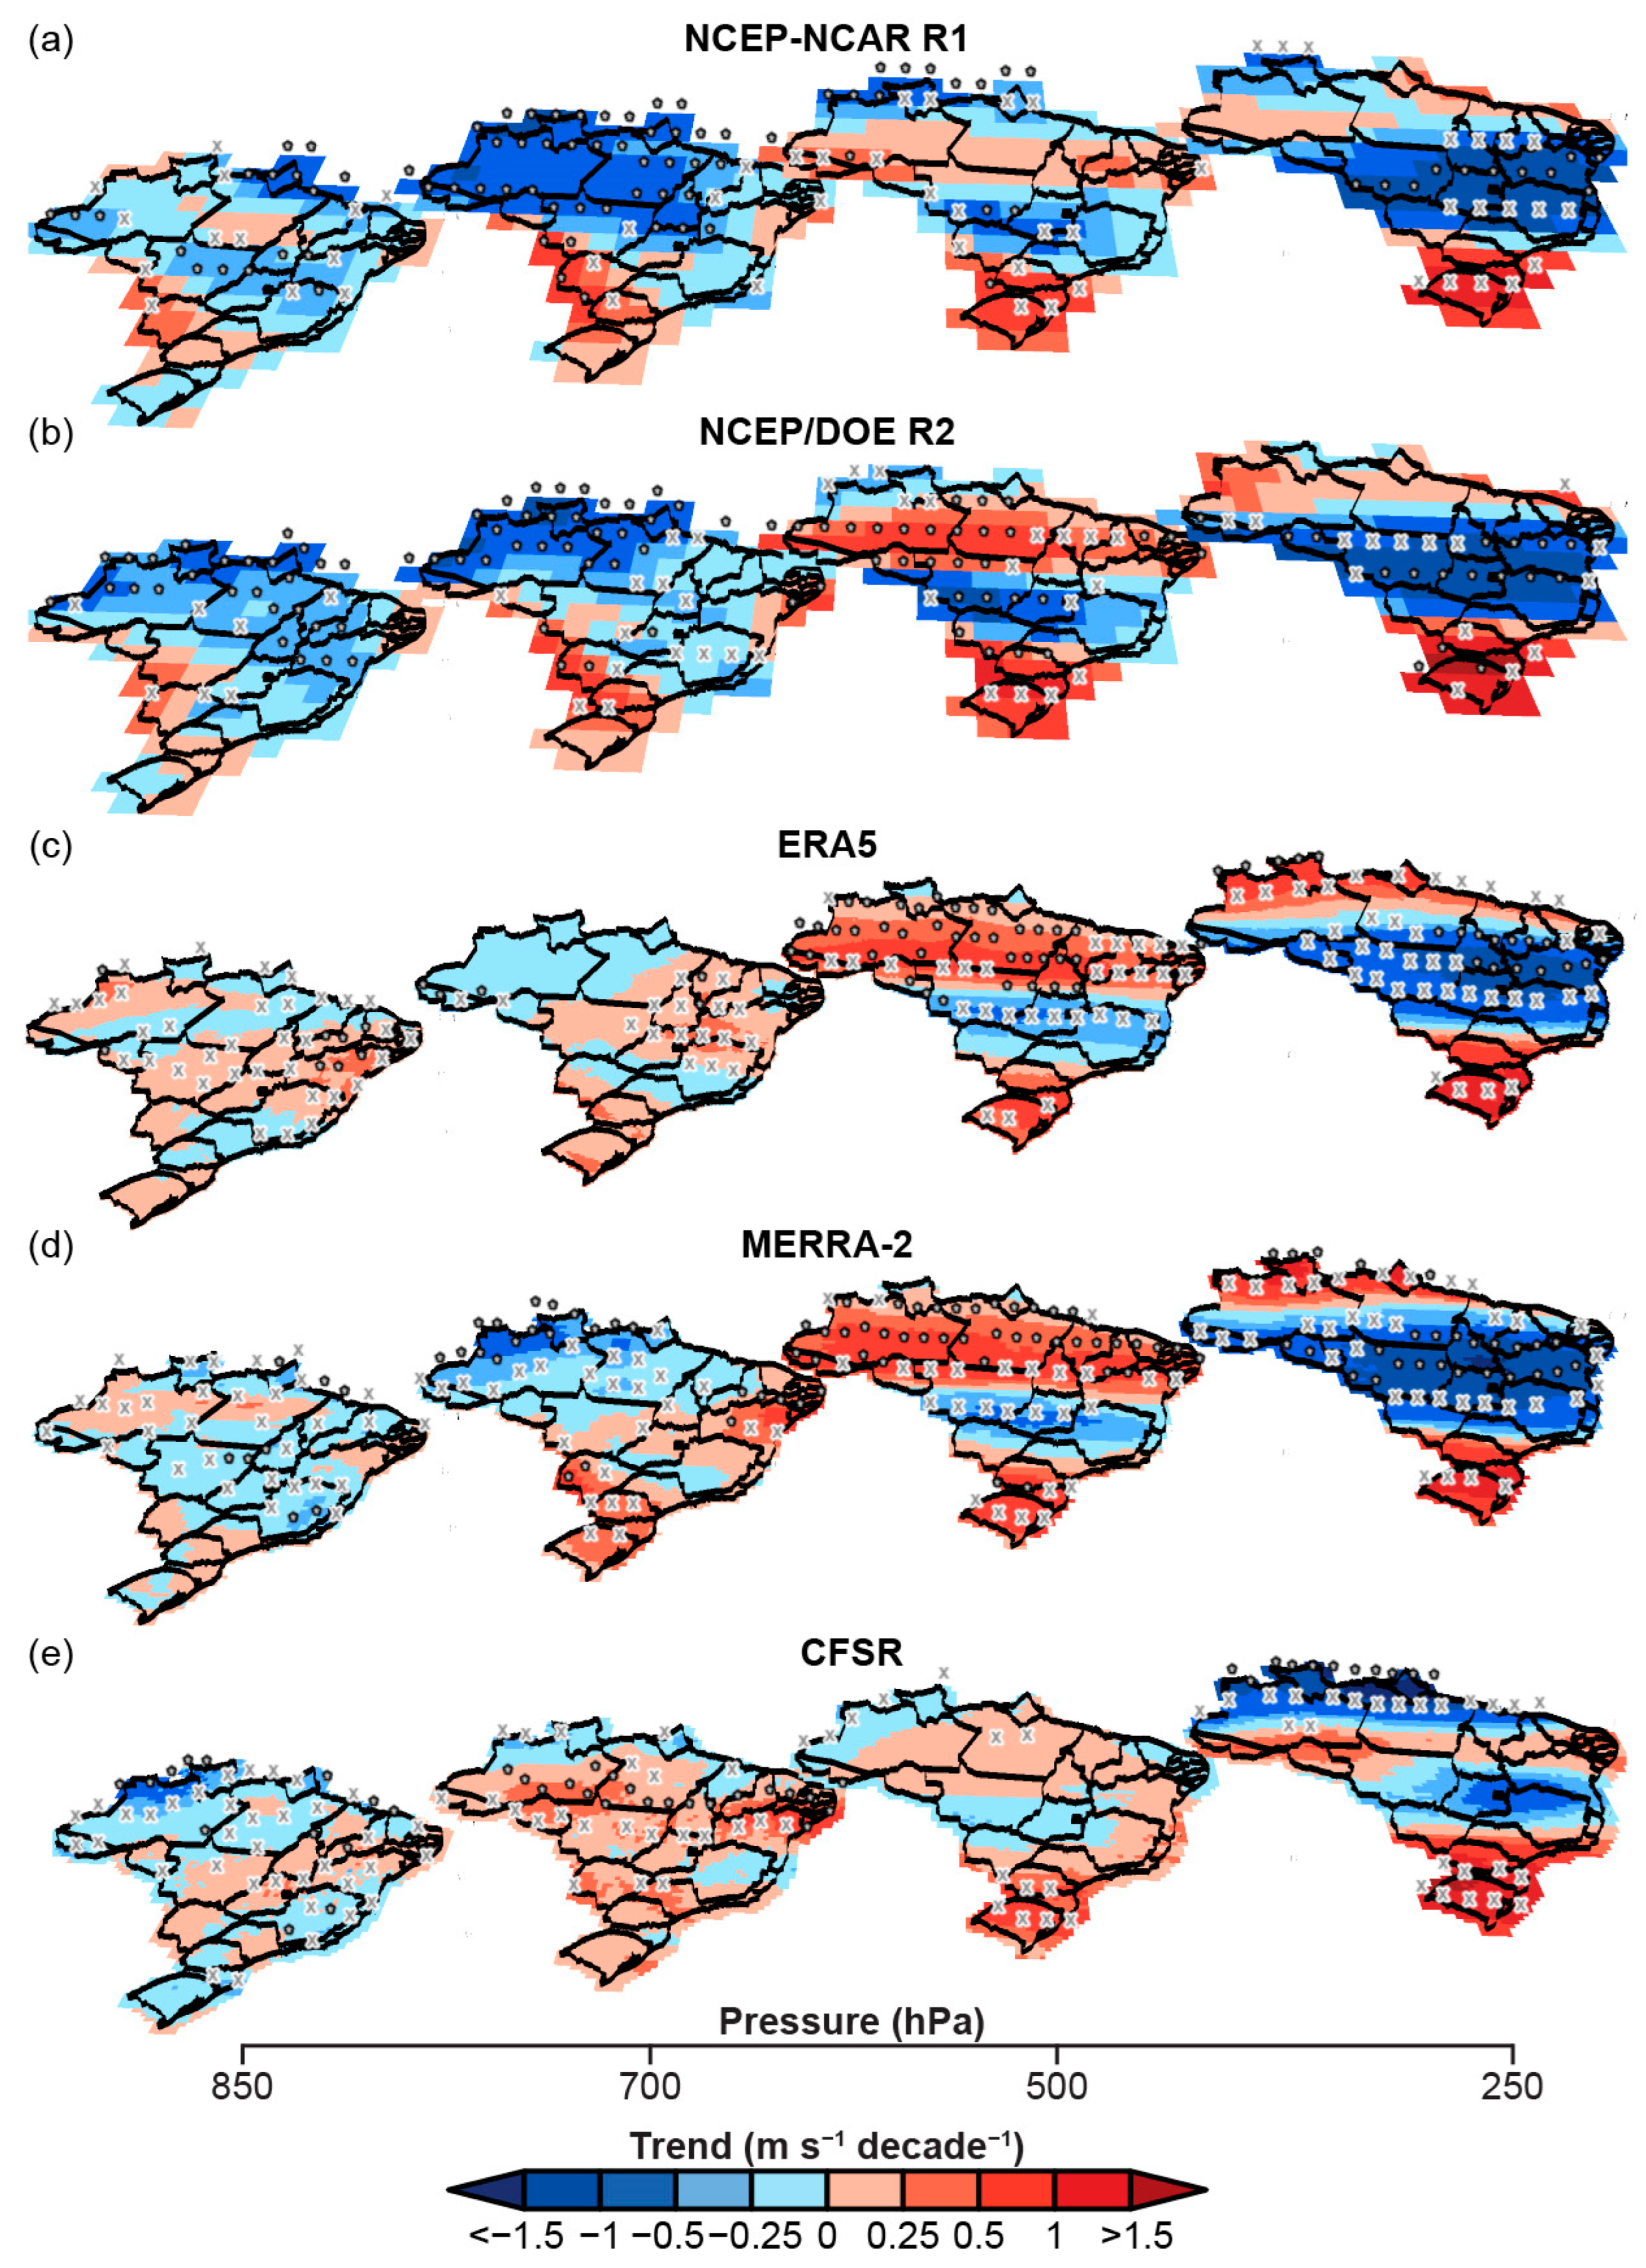
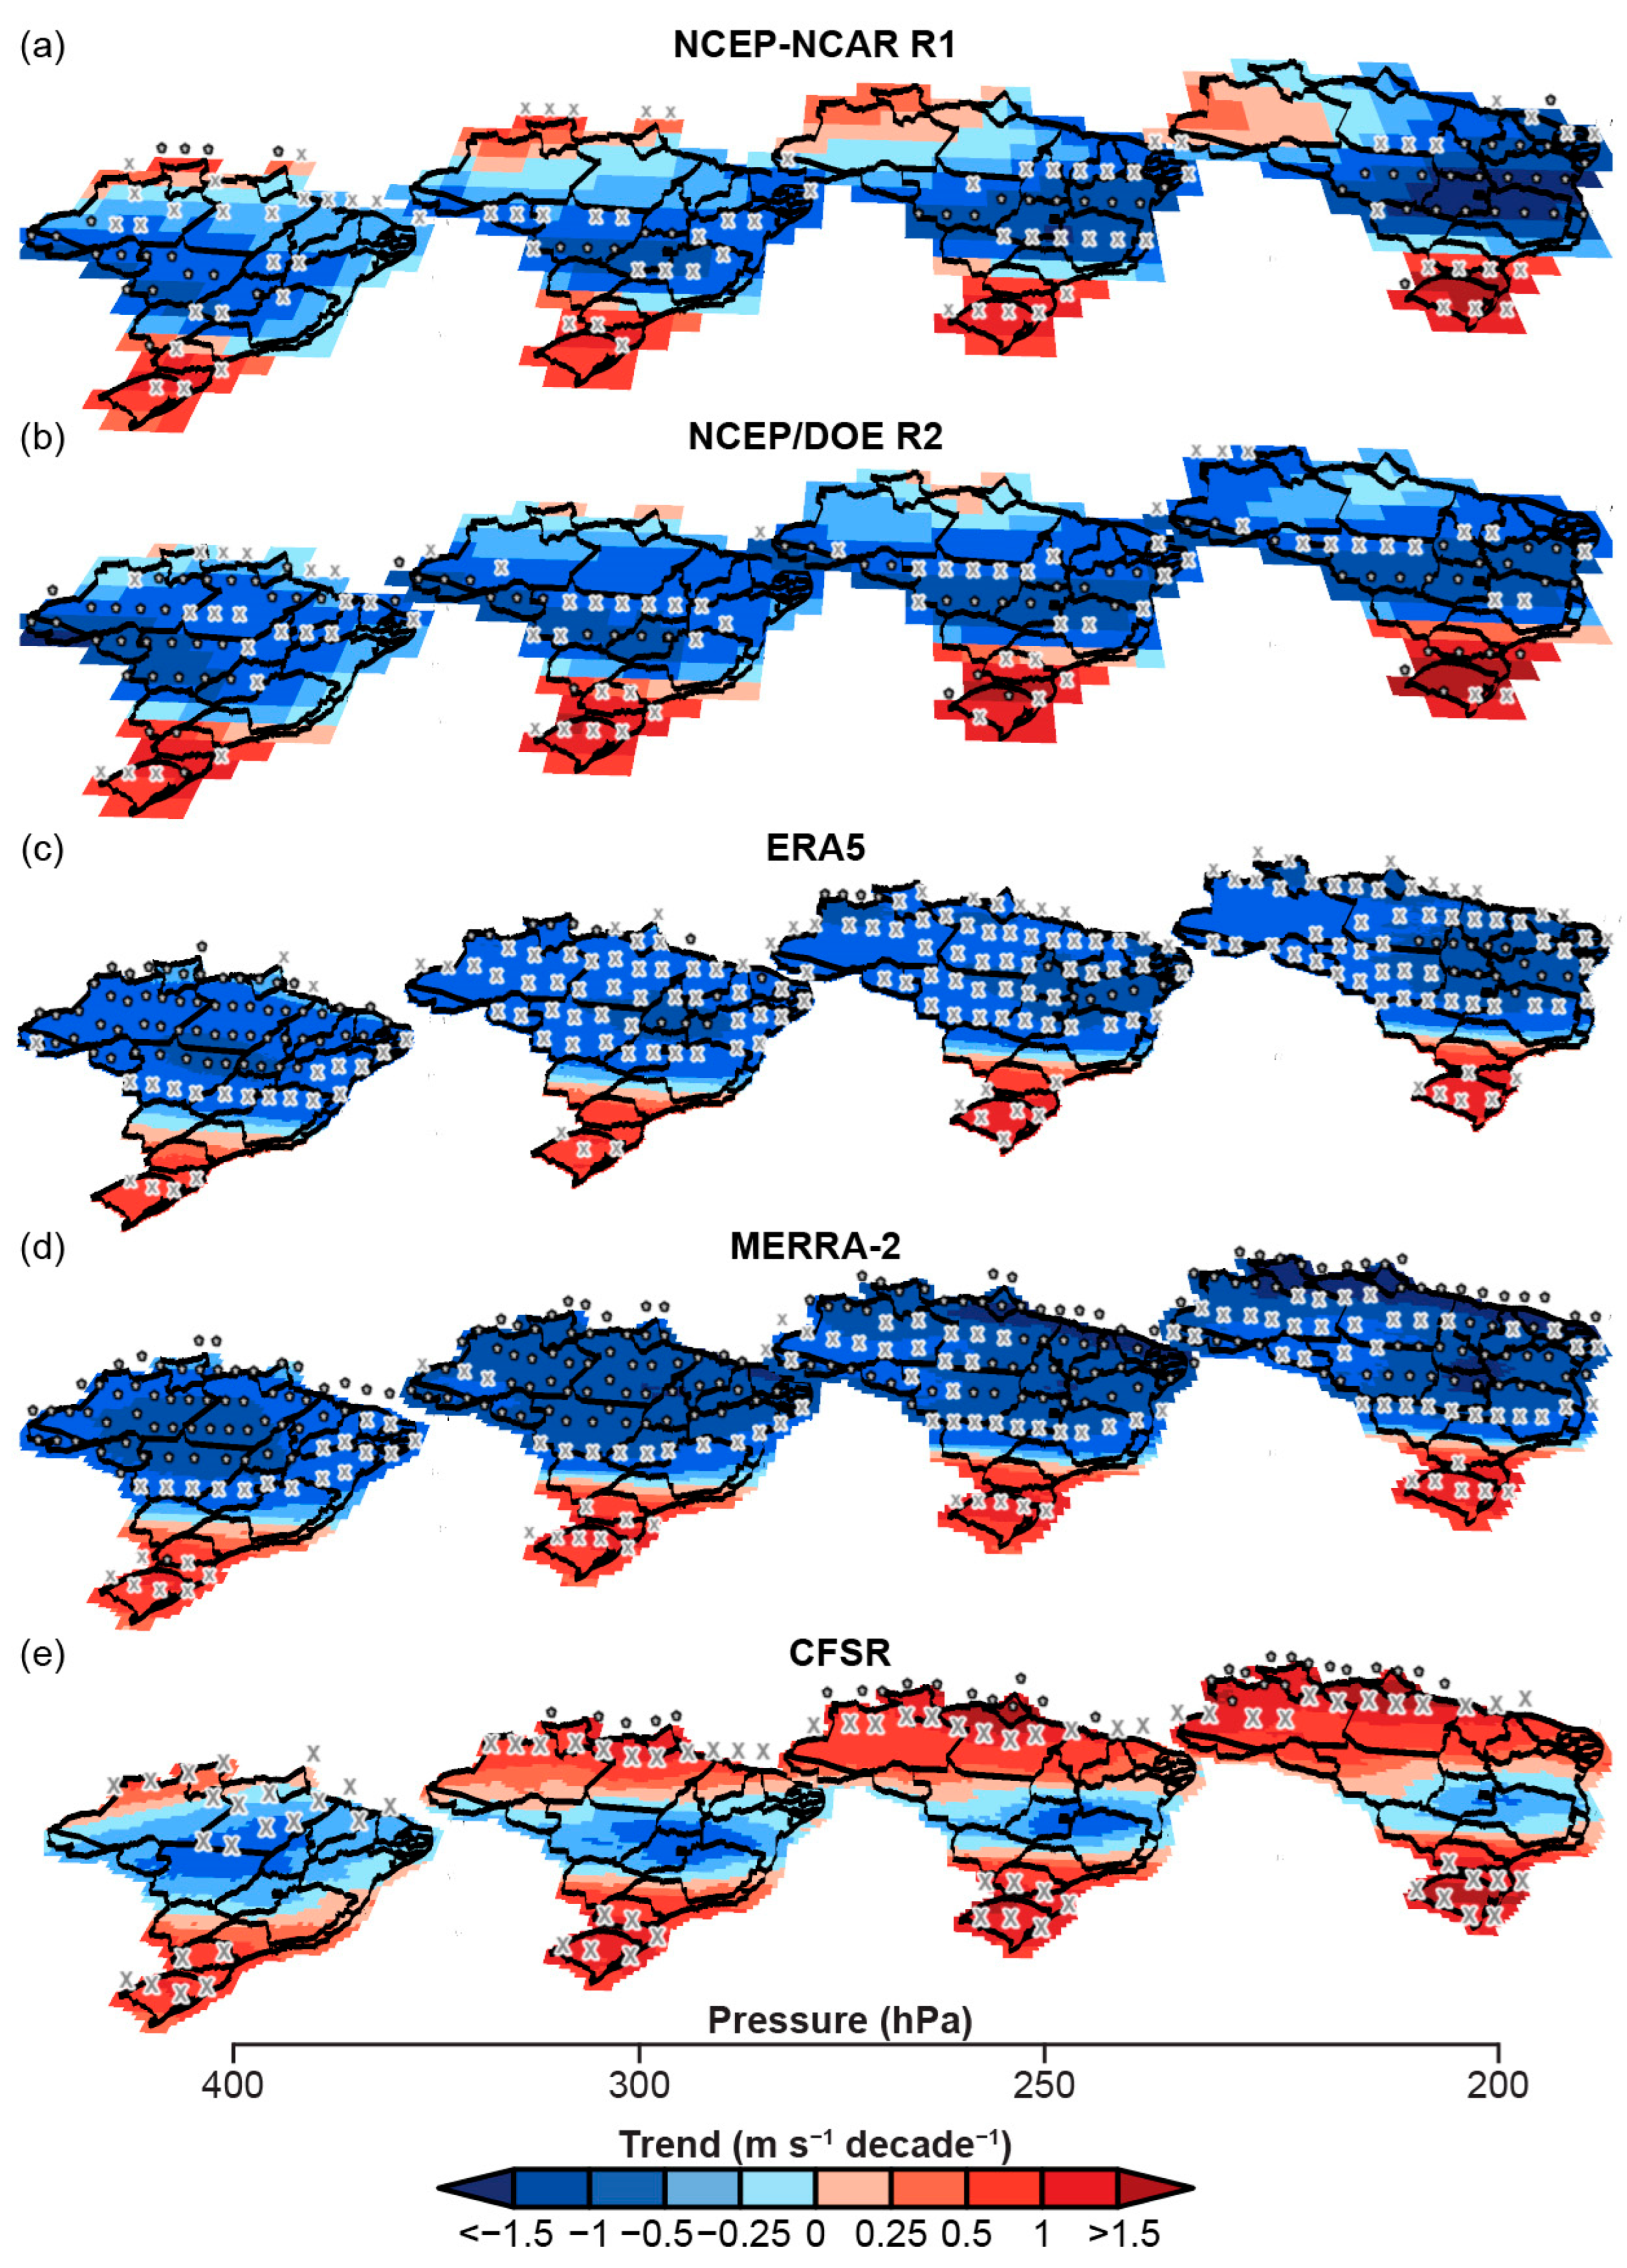
Figure 4 shows summer wind speed trends based on four pressure levels (850, 700, 500, and 250 hPa) of the troposphere for Brazil from 1980 to 2022 from a 3D view. Reanalysis products agree that lower tropospheric (850 and 700 hPa) wind trends are decreasing (increasing) across coastal Brazil (Amazon basin). The largest decrease change is observed in the state of Minas Gerais (−0.5 to −1 m s
−1 decade
−1) and is statistically significant at 95% and 99%. Wind speed increases across the western portion of Brazil are influenced by the generation of the reanalysis model. NCEP-NCAR R1 and NCEP/DOE R2 exhibit a positive concentration over the states of Pará and Mato Grosso, where wind speeds have increased at a statistically significant (
p < 0.05) rate of 0.5 to 1 m s
−1 decade
−1. For ERA5, MERRA-2, and CFSR, the geographic extent of the increasing trend is focused over western Brazil (Amazonas, Acre, Rondônia, Para, and Mato Grosso). The trend magnitude is lower (<0.25 m s
−1 decade
−1) compared to the older reanalyses.
Once outside of the PBL, mid-tropospheric wind trends (500 hPa) are less consistent between the reanalysis products with respect to decreasing winds. NCEP-NCAR R1, NCEP/DOE R2, and CFSR exhibit decreasing winds across the Guiana Highlands and the western Amazon basin. Each reanalysis shows that wind speeds have a statistically significant (p < 0.05) decrease between of −0.25 and 1 m s−1 decade−1. A negative trend (<−0.25 m s−1 decade−1) also extends geographically across central Brazil for NCEP/DOE R2 and CFSR. However, ERA5 and MERRA-2 share a different spatial pattern in the middle troposphere. Decreasing wind trends are found in the interior of the Amazon basin, where speeds have declined at a rate less than −0.25 m s−1 decade−1. The only consensus between the five reanalyses is observed for southern and southeastern Brazil. Wind speeds have increased by between 0.25 and 1 m s−1 decade−1. If NCEP-NCAR R1 and CFSR are excluded, a secondary axis of positive wind trends is noted for northeastern Brazil (Rio Grande do Norte, Paraíba, and Pernambuco). ERA5 and MERRA-2 depict that mid-tropospheric winds have increased by between 0.25 and 0.5 m s−1 decade−1, while NCEP/DOE R2 exhibits a positive trend of less than 0.25 m s−1 decade−1 for the region.
For the upper troposphere (250 hPa), wind speed trends correspond to changes in atmospheric circulation over South America. During this season, four distinct wind trends are described over the study area. First, increasing (decreasing) winds are displayed over western Brazil (Amazonas) for ERA5 and MERRA-2 (NCEP-NCAR R1, NCEP/DOE R2, and CFSR), with a secondary center over southern Brazil. The largest positive trend is concentrated at ~10° S (~0°) for ERA5 and MERRA-2 (NCEP-NCAR R1 and NCEP/DOE R2) and is statistically significant (p < 0.05). Second, a transitional zone of decreasing and increasing wind trends is documented for central-west Brazil in the upper jet stream for each reanalysis. Third, a decreasing trend (−0.5 and −0.75 m s−1 decade−1) is observed with wind speeds over northeastern Brazil. NCEP-NCAR R1, NCEP/DOE R2, and ERA5 exhibit a declining wind pattern that extends along coastal Brazil, with a secondary axis (~20° S) forming along São Paulo and Mato Grosso do Sul, while MERRA-2 (CFSR) shows an extension across coastal northern (Salvador) Brazil. Wind speeds have decreased by between −0.01 and −0.5 m s−1 decade−1 across coastal Brazil. The final upper-level trend is documented for southern Brazil. Each reanalysis describes increasing wind speeds (0.01 to 1 m s−1 decade−1) poleward of 30° S for Paraná, Santa Catarina, and Rio Grande do Sul.
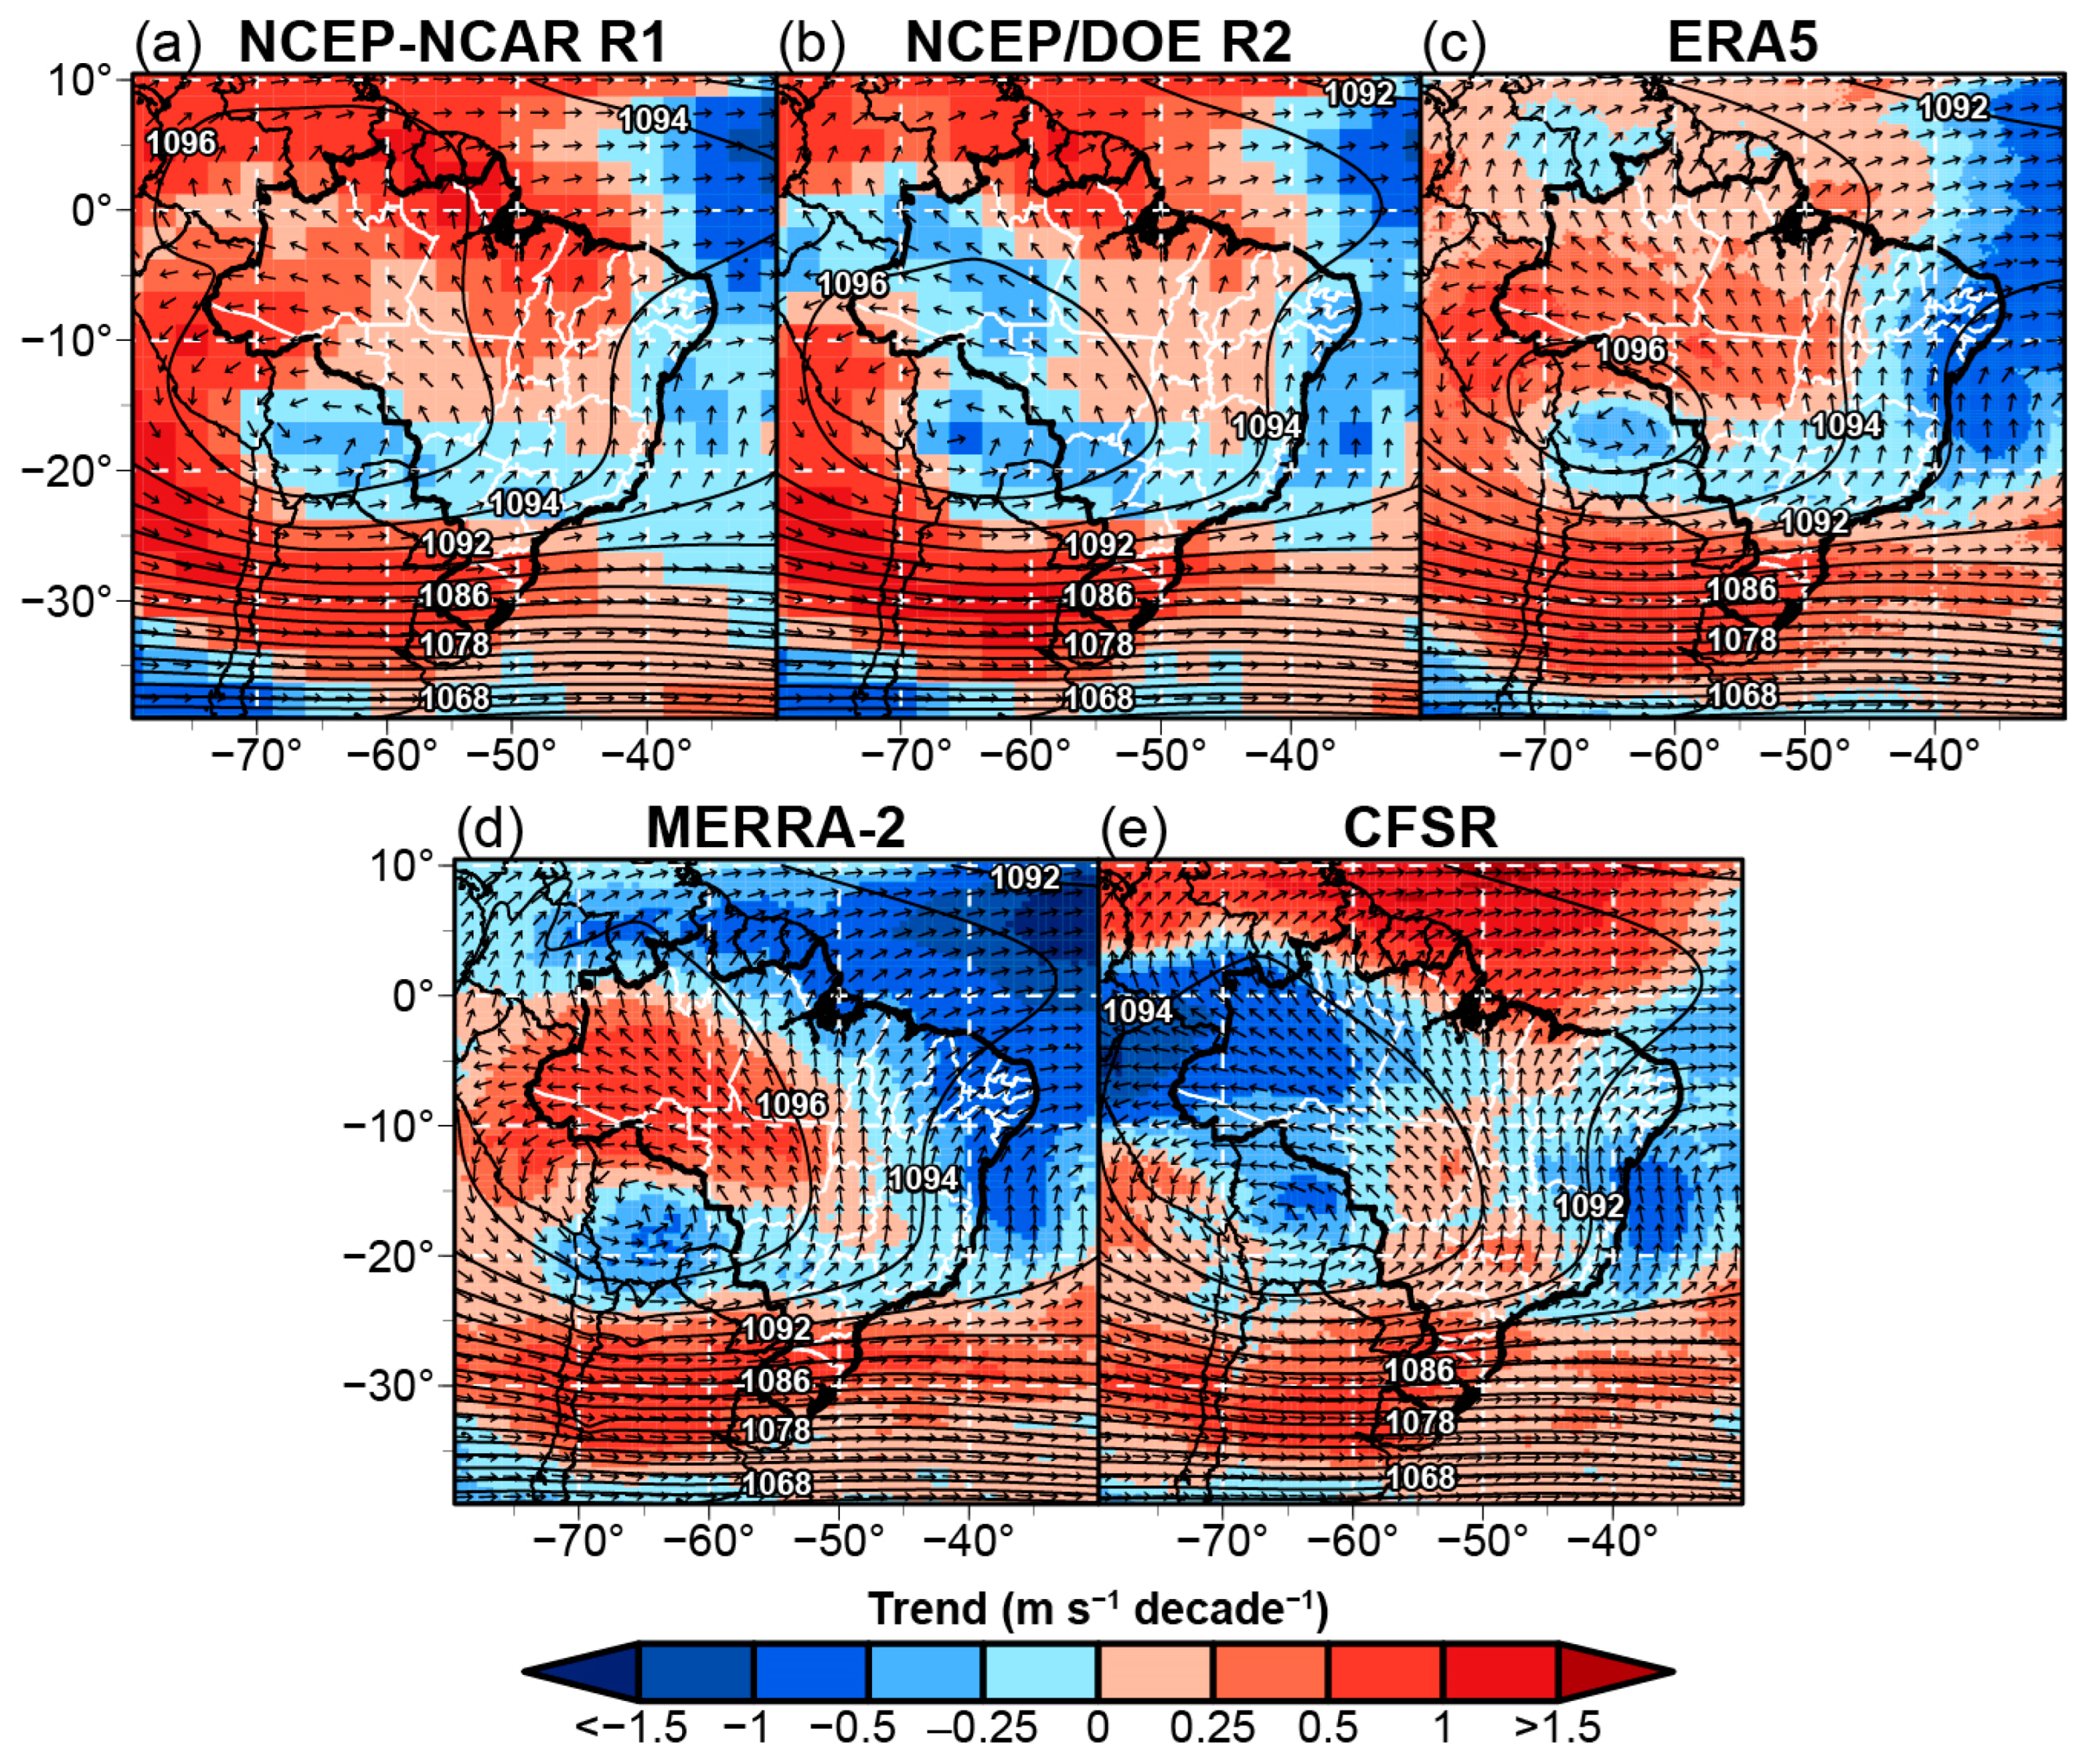
The location of these upper-level trends is possibly linked to the position of the Bolivian high (BoH) and Nordeste low (NL).
Figure 5 establishes that decreasing (increasing) upper-level winds are located between 15° S and 25° S (25° S and 35° S) for each reanalysis. It is anticipated that when the BoH weakens, upper-level wind speed trends across central-west and southeastern (southern) Brazil decrease (increase).
Table 3 shows a positive trend in the summer average temperature and geopotential height (latitude) at the core of the BoH. Our findings show that despite statistically significant (
p < 0.05) increasing temperatures (0.10–0.57 K decade
−1) and pressure heights (6.5–14.4 m decade
−1) occurring at 250 hPa, this does not necessarily support a poleward shift of the BoH. This is evident when comparing between the older and newer generation of reanalysis products which exhibit conflicting latitudinal (equatorward versus poleward) shifts of BoH between 1980 and 2022.
It is plausible that the thermal expansion of the equatorial and subtropical climates is promoting the increase in geopotential heights across the upper levels of the troposphere across Brazil.
Figure 5 shows a decrease in wind speeds across northeastern Brazil for all reanalyses. This wind decline is in proximity to the South Atlantic Convergence Zone (SACZ) and the NL. Any changes in the thermodynamic environment of the convergence zone and tropical trough can be attributed to the change in wind speeds documented over northeastern Brazil. In addition, a decline (~20 to 30 m) in geopotential heights between the BoH and subtropical jet stream (SJT) is observed at 250 hPa for each reanalysis. As described earlier, an increase in the geopotential heights and temperature is shown with the BoH during the 43-year study period (
Table 3). It is expected that as the troposphere continues to warm, the geopotential height differences developing in the subtropical and middle latitudes may allow for a steeper geopotential gradient to form and result in an increase in wind speeds between 25° S and 35° S in the future. This would be consistent with Manney and Hegglin (2018) who identified the summertime STJ poleward of 30° S and downstream of the Andes Mountains using MERRA-2 between 1980 and 2014 [
67]. Collazo et al. (2024) also described a climatological mean of STJ at 35° S with its most northern flank (branch) at 29° S from a daily vertical zonal wind composite (seven pressure levels between 400 and 100 hPa) utilizing ERA5 from 1979 to 2022 [
68].
Eventually, as the BoH dissipates and the Intertropical Convergence Zone (ITCZ) migrates equatorward, the STJ over Brazil becomes an important factor influencing upper-level wind speeds during austral winter.
Figure 6 shows winter wind trends across the upper troposphere for each reanalysis. At 500 hPa, three wind trend patterns are identified for Brazil. First, a positive wind band is found across northern Brazil (equatorward of 10° S). Wind speeds have statistically increased (
p < 0.05) between 0.25 and 1 m s
−1 decade
−1 for NCEP/DOE R2, ERA5, and MERRA-2. Second, a negative axis between 15° S and 25° S is documented, with the largest wind speed declines observed for parts of Mato Grosso and Goías. The last band returns to a positive trend for latitudes poleward of 25° S. Wind speeds have increased by between 0.25 and 1 m s
−1 decade
−1 over this region, with statistical significance (
p < 0.05) occurring for Paraná, Santa Catarina, and Rio Grande do Sul.
A similar wind trend pattern is documented but a geographical shift is noted with respect to the location of the STJ at 250 hPa. For each reanalysis, a positive trend is positioned equatorward of 5° S. Next, declining wind speeds expand further northward, cover the latitudes of 5°–25° S, and have significantly decreased (p < 0.05) by between 0.5 and 1.5 m s−1 decade−1, with the largest negative trends observed between 10° S and 15° S. Lastly, a positive wind trend remains poleward of 25° S but the trend magnitude has increased (0.5 to 1.5 m s−1 decade−1). These geographically driven trend patterns in the upper troposphere are possibly interconnected to temperature changes and warrant further investigation.
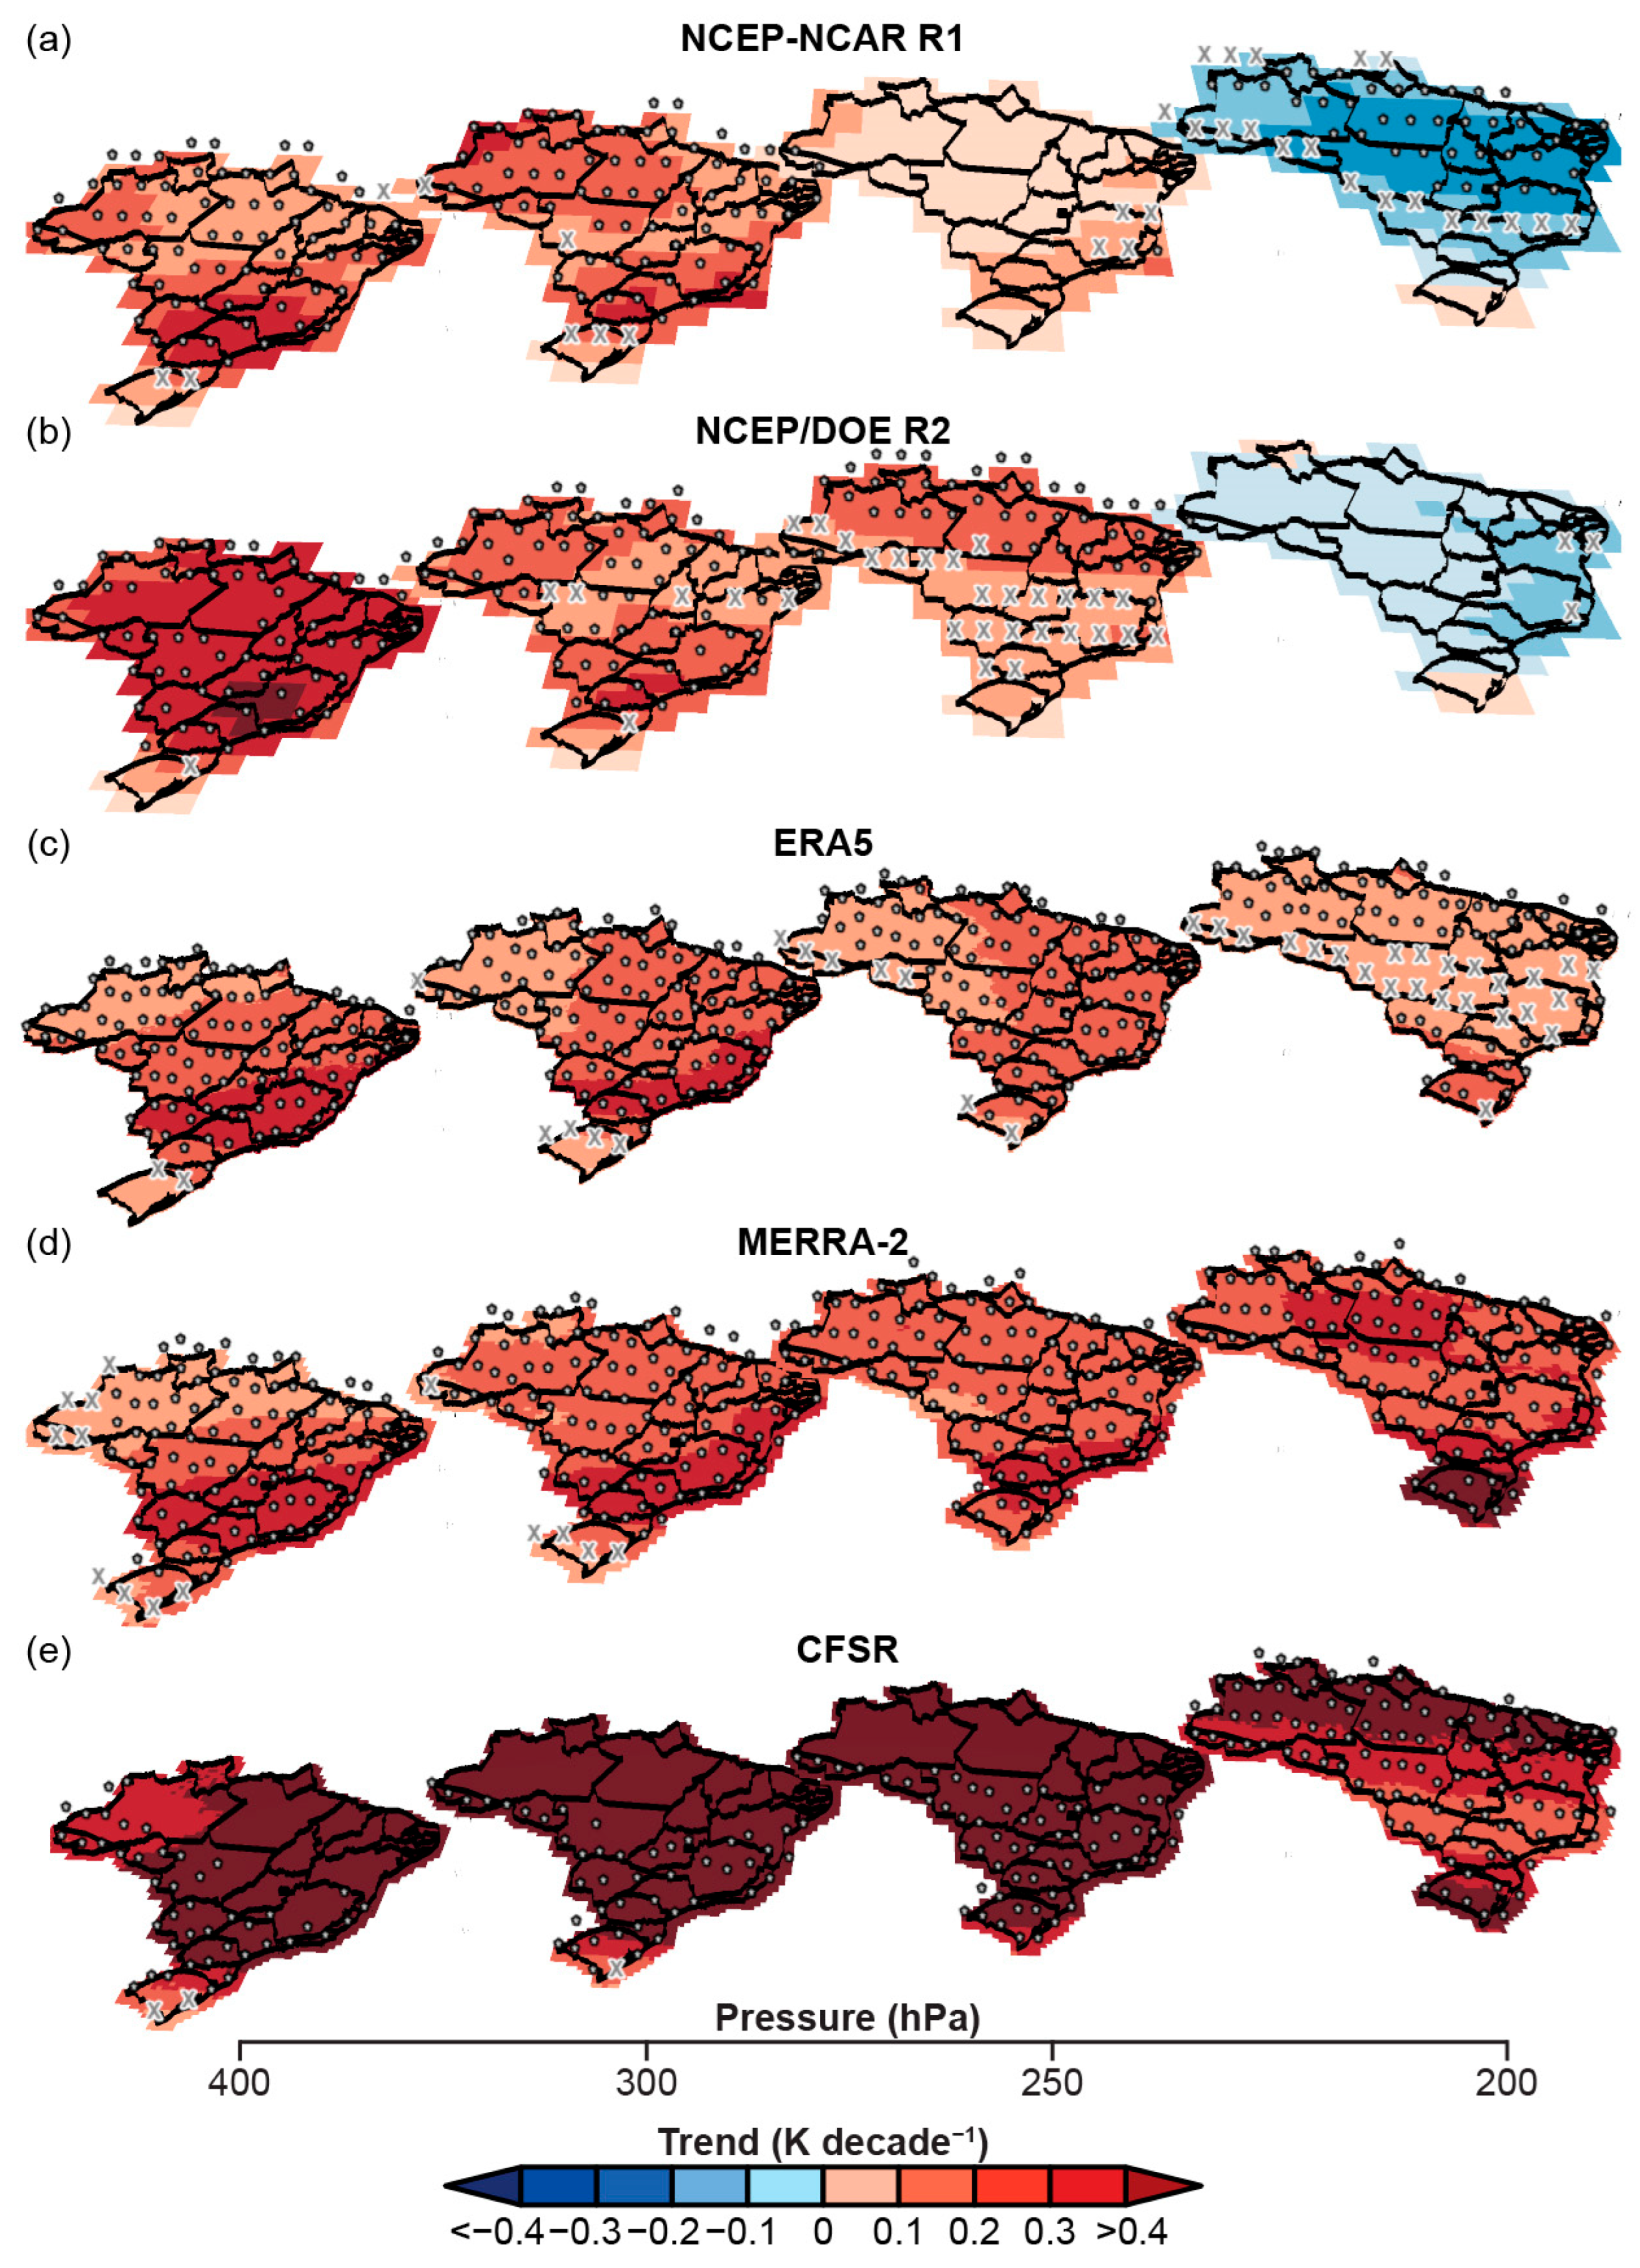
Figure 7 displays the upper-level winter temperature changes across Brazil between 400 and 200 hPa. The magnitude of temperature change varies among the five reanalyses but a consistent warming pattern is present within the location of the STJ (between 20° S and 30° S) except at 200 hPa for NCEP-NCAR R1 and NCEP/DOE R2. At 400 hPa, atmospheric temperatures have statistically increased (
p < 0.05) by between 0.2 and 0.4 K decade
−1, with a maximum concentration found at 20° S for each reanalysis except CFSR. The size of the subtropical band diminishes at lower pressure levels (300, 250, and 200 hPa) but the largest positive wind trends are still present and statistically significant (
p < 0.05) for ERA5, MERRA-2, and CFSR. When comparing the relationship between wind speed and temperature trend changes through Spearman’s rank correlation, a statistically negative (
p < 0.01) association is documented for the latest generation of reanalysis products (ERA5, MERRA-2, and CFSR). NCEP-NCAR R1 and NCEP/DOE R2 exhibit a low correlation (ρ = 0.09 and −0.07) between wind speed and temperature trends, which may be attributed to the decreasing temperature trends found for each climate reanalysis at 200 hPa.
The warming of the subtropical atmosphere in Brazil is described in the geopotential heights over the upper troposphere.
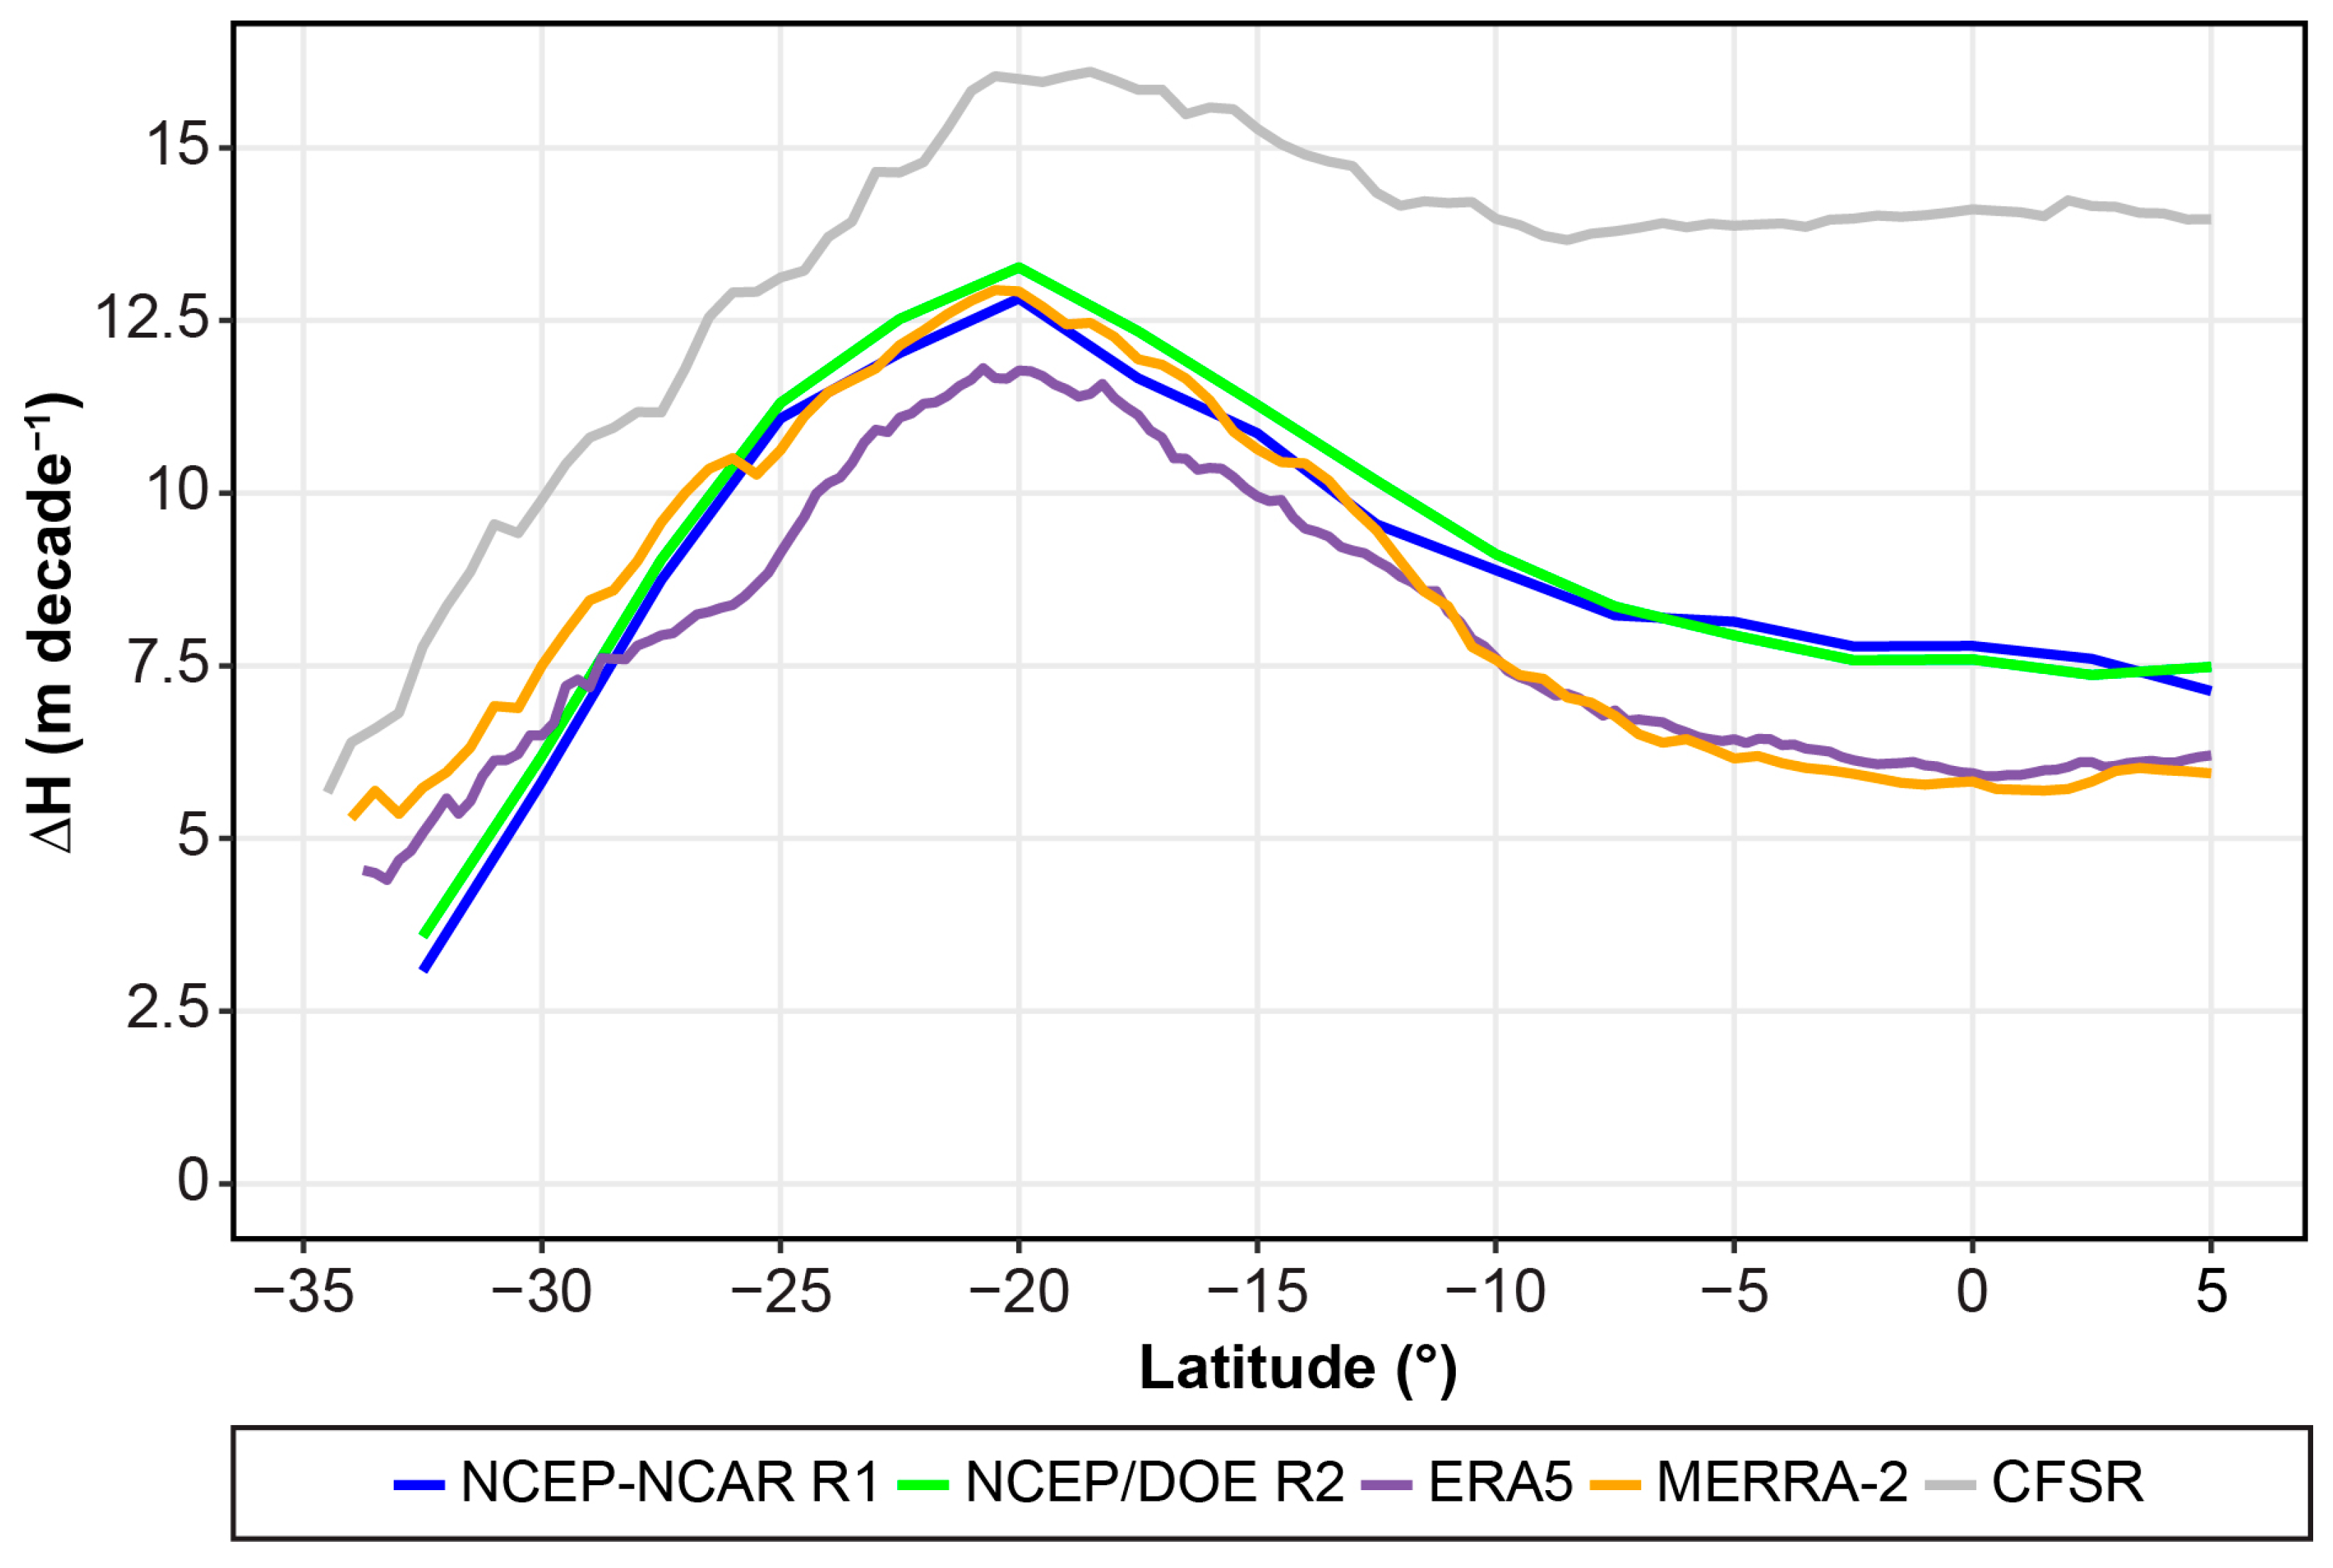
Figure 8 shows that geopotential heights between 400 and 200 hPa have increased, with the highest change documented on the northern branch of the STJ for each reanalysis. The largest change in geopotential height is at 20° S, where elevation has significantly increased (
p < 0.01) by between 11.78 and 15.99 m decade
−1. After reaching the maximum positive trend, a smaller positive magnitude of geopotential height is present until the end boundary of Brazil. This height transformation correlates with the largest temperature changes described in
Figure 7 over southern and southeastern Brazil. Spearman’s rank correlation revealed that each reanalysis except for NCE/DOE R2 corresponds to a statistically significant (
p < 0.05) negative relationship between wind speed and geopotential height trend changes between 1980 and 2022. This documented association supports the wind speed trend changes observed during winter.
Figure 9 examines how the upper-level tropospheric zonal (µ) winds have changed over Brazil during 1980–2022. The µ winds are classified into two regional patterns. Every reanalysis excluding CFSR shows a decrease (increase) in µ winds equatorward (poleward) of 20° S between 400 and 200 hPa. The magnitude of change for decreasing µ winds differs among the climate models. The reanalyses confirm that µ winds have statistically decreased (
p < 0.05) by at least −0.5 m s
−1 decade
−1 but where the largest negative trend (<−1 m s
−1 decade
−1) occurs deviates when transitioning through the upper troposphere. At 400 hPa, the largest negative µ trend is focused in the central or southern parts of the Amazon basin. This declining concentration shifts eastward toward southeastern and northeastern Brazil where the zone expands in size for each reanalysis between 300 and 200 hPa. For CFSR, decreasing µ winds contract in size, with the largest negative trends located in central Amazon at 400 hPa, and migrates toward the latitudes of 15° S and 20° S at 300, 250, and 200 hPa.
Increasing µ winds are present for each reanalysis in the subtropical latitudes (poleward of 20° S) of Brazil. Zonal winds have increased by at least 0.5 m s−1 decade−1 below 25° S, with the largest positive µ trends documented across southern Brazil (Santa Catarina and Rio Grande do Sul) between 1980 and 2022. A second positive µ axis is also defined for NCEP-NCAR R1 and CFSR. At 400 hPa, the concentration of increasing µ winds is in the Guiana Highlands for both reanalyses. However, NCEP-NCAR R1 depicts a positive µ trend over the Amazonas while CFSR exhibits an increasing footprint that increases equatorward of 10° S, with statistical significance (p < 0.05) found northward of 5° S between 300 and 200 hPa.
4. Discussion
This study examined the spatial and temporal characteristics of upper-level wind speed trend characteristics across Brazil through radiosonde and reanalysis products. Overall and decadal mean wind speed trends are described for seven mandatory pressure levels for austral summer and winter. Radiosonde (IGRAv2) sites demonstrate two vertical mean wind trend profiles between 2000 and 2022 (
Figure 2). Wind speed trends are described by a negative–positive pattern for summer followed by an increasing wind speed throughout the troposphere during winter. The largest wind trend changes are in the upper atmosphere for each season. By comparison, Merino and Gassmann (2022) examined three Argentina radiosonde sites and found an equivalent pattern in the magnitude of wind trends above 300 hPa between 1990 and 2020 [
9]. Their work suggested that modifications in upper-level atmospheric circulations such as Hadley cell expansion have led to wind speed changes across the region. A supporting upper-level wind trend pattern was also documented for radiosonde stations found over the Northern Hemisphere between 1979 and 2008 [
15]. The authors concluded that atmospheric circulation changes are attributed to near-surface wind trends but other factors including increased surface roughness can influence wind speeds in the lower atmosphere. Furthermore, Wang et al. (2023) determined that wintertime tropospheric wind trends (above 500 hPa) were interconnected to meridional temperature gradient increases between 25° N and 50° N over China during 1979–2021 [
37]. These past findings support the upper-level wind trend patterns outlined in
Figure 3 where radiosonde sites are divided into specific groups based on season and pressure level across the subtropical latitudes (10° S to 30° S) of Brazil.
With limited radiosonde data available for this study, five reanalysis datasets were examined to see if equivalent spatial and temporal patterns were observed over Brazil. During each season, the reanalyses exhibit a varying mean wind trend pattern in the lower atmosphere below 700 hPa (
Table 2). The tropospheric trend magnitude differences are influenced by the type of surface roughness climatology or the scheme used by each reanalysis. NCEP-NCAR R1 and NCEP/DOE R2 utilize the simple biosphere model (SiB) [
69], ERA5 employs the Hydrology Tiled ECMWF Scheme for Surface Exchanges over Land (H-TESSEL) scheme [
70], and finally MERRA-2 and CFSR apply the NCEP Global Land Data Assimilation System (GLDAS) [
71] to assimilate
u and
v tropospheric winds. A previous study highlights how three reanalysis products spatially differ in lower tropospheric winds across Brazil from 1980 to 2014 [
72]. The authors concluded that how land cover is incorporated into each reanalysis product may influence the type of wind trend pattern documented across the country. This finding is supported by Lima et al. (2024) who revealed that modifications in midlatitude dynamics along with urbanization influenced the lower tropospheric wind speeds across Brazil from 1991 to 2020 [
50]. In addition, Correia et al. (2022) found that topography (surface roughness) and geography (latitude and distance to coast) influenced the speed and direction of wind speeds across southeastern Brazil from 2008 to 2019 [
44]. This outcome is supported by the magnitude of wind speed change for each reanalysis investigated as part of this study. The largest positive and negative wind speed trends occur in the upper portion of the atmosphere, while lower-level winds exhibit minimum or opposing trends to their upper-level counterparts. These findings indicate that winds located below the PBL are affected by changes in surface roughness rather than changes in large-scale atmospheric circulation, as pointed out by Vautard et al. (2010) [
15]. This notion was similarly concluded by Merino and Gassmann (2022) who found a decrease in wind speeds with a negative Normalized Difference Vegetation Index (NDVI) for central and eastern Argentina [
9]. However, additional research with respect to surface roughness and other climatological variables must be completed before a conclusive statement can be made.
Above the lower troposphere, reanalyses begin to share a consensus on mean wind speed trends in the upper atmosphere (
Table 2). Most reanalyses agree that average wind speeds are increasing (decreasing) between 300 and 200 hPa for summer (winter). A possible mechanism that may explain these changes may be related to atmospheric warming forming in the upper troposphere and lower stratosphere in the equatorial and subtropical latitudes of the Southern Hemisphere. Allen and Sherwood (2008) showed that µ winds decreased across the upper pressure levels (above 200 hPa) between 5° S and 35° S during 1979–2005, despite the increase in upper-level tropospheric wind shear [
73]. This increase in vertical wind shear develops when the troposphere warms and stratosphere cools, which allows the meridional temperature gradients to be enhanced toward the poles [
74]. Any thermal enhancement would support the findings of increasing upper-level wind speeds documented in subtropical Brazil. Past research has documented a higher frequency of convection (thunderstorm activity) for three cities in southeastern Brazil from 1951 to 2009 [
75]. Such work concluded that enhanced urbanization and large atmospheric circulation variations are attributed to the frequency of convection across the region. This thunderstorm increase across subtropical Brazil is associated with a possible shift in convective available potential energy (CAPE) and wind shear occurring in the Amazon basin during 1979–2019 [
76]. Consequently, research has proposed that deforestation and water cycle balance reductions have promoted a decrease in thunderstorm activity across the basin since the 1980s [
77].
To understand these seasonal wind changes, this study constructed a 3D model of upper-level wind trends across Brazil using reanalysis data. During summer, a wind speed trend pattern is documented in the lower and upper atmosphere (
Figure 4). Below the PBL, wind speed decreases (increases) are identified for western (southeastern) Brazil). This finding suggests that lower atmospheric winds of Brazil are associated with surface roughness changes. Recent studies have suggested that land cover modifications have occurred during the last several decades over Brazil [
78,
79,
80,
81]. Reanalysis data have confirmed a comparable spatial pattern for near-surface winds (10 m) in the Amazon basin and southeastern Brazil during 1980–2014 [
72].
After exiting the lower troposphere, another wind pattern is described in the upper atmosphere (above 300 hPa) during summer. First, wind speeds increased across the Amazon basin over the 43-year study period. This geographical wind trend is possibly related to the position of the BoH and NL (
Figure 5). The BoH is a warm-core anticyclone that forms over the Altiplano from latent heat released within the Amazon basin and moisture convergence from the SACZ, while the NL is a cold-core sinking cyclone that develops downstream of the Bolivian ridge [
82]. Second, wind speeds have decreased in proximity of the SACZ for southeastern and northeastern Brazil. This climate pattern coincides with the location of the Brazilian Northeast Jetstream (BNEJS) Type 1b which accounts for most synoptic systems during December, January, and February [
83]. Third, a positive westerly wind trend is determined for southern Brazil. This pattern is consistent with a study that identified increasing wind speeds for northern Argentina during summer [
9]. However, these three spatial wind trends do not necessarily support a shift in the BoH (
Table 3). Despite statistically significantly (
p < 0.05) increasing temperatures and pressure heights, discrepancies remain between the reanalyses and how the BoH is shifting over time. It is possible that the geographic location of the BoH is highly variable during summer. Lenters and Cook (1997) identified five geopotential height (200 hPa) scenarios of the BoH’s location with respect to Altiplano for eight summer seasons (1985/1986–1992/1993) based on empirical orthogonal function (EOF) analysis [
82]. The five EOF locations positioned the BoH over the center (25° S), southwest, southeast, east, and south of Altiplano. This evidence demonstrates that performing a seasonal composite on the spatial location of the BoH does not adequately explain spatial changes occurring with upper-level wind speeds across Brazil.
The interannual variability of the BoH may be coupled with a broader synoptic circulation referred to as the South American Monsoon System (SAMS). As part of the SAMS, the SACZ forms a northeast–southeast orientation of clouds and precipitation bands that start in south Amazon and move eastward toward southeastern Brazil [
84]. Past research has identified that the strongest surface winds occur between October and February for southeastern Brazil [
44].
Figure 4 shows that summer wind speeds have decreased in the lower troposphere (850 hPa) for each reanalysis. This decrease in wind speed may be related to a climatological shift in the SACZ. Zilli et al. (2019) found a poleward shift in the SACZ between 1979 and 2014 [
85]. Their work concluded that decreasing wind speeds found along the eastern Brazilian coastline is a result of increasing subsidence developing in the middle troposphere. This outcome is consistent with the five reanalysis products studied as part of this analysis where wind speeds (700 hPa) have decreased across coastal Brazil.
Another global circulation possibly attributed to the upper-level wind speed trend patterns across South America is ENSO. The phase of ENSO can influence the type of synoptic weather patterns observed across Brazil. Rodrigues et al. (2011) found that the intensity and duration of El Niño influenced precipitation patterns (wet and dry) observed across northeast Brazil [
86]. Their work highlighted how changes in the Walker and Hadley cells and South Atlantic Anticyclone can impact the synoptic pattern of
µ and
v winds, divergence, and vertical vorticity anomalies during summer and proceeding seasons after a given type of El Nino event occurred over the region. This finding is supported by dos Sanots and Silva (2013) who documented above-normal surface wind speeds during El Niño events across northeastern Brail between 1986 and 2011 [
40]. Therefore, ENSO is likely prompting the wind trend patterns documented in
Figure 3 and
Figure 4 for radiosonde and reanalysis datasets.
Upon reaching winter, the largest wind trends develop in the middle and upper troposphere (500 and 250 hPa).
Figure 6 displays how the decrease and increase in wind speeds are in proximity to the STJ. The boundary separating the wind trends associated with the STJ (20° to 25° S) is present for each reanalysis above 500 hPa. An STJ climatology documented that the maximum extent of the STJ occurs south of 20° S, with the highest distribution developing poleward of 25° S for winter during 1979–1993 [
87]. This is consistent with recent work that found that the maximum winter location of the STJ is located equatorward of 30° S [
67,
88,
89,
90]. Therefore, if the frequency or intensity of the STJ in lower latitudes (>25° S) has changed temporally, it is predictable that upper-level winds situated between 10° S and 20° S across Brazil would decline in each reanalysis. Archer and Calderia (2008) also examined the annual mean position and strength of the STJ using ERA-40 data and found that it shifted poleward (−0.06 degrees decade
−1) and weakened (−0.41 hPa decade
−1) between 1979 and 2001 [
91]. Their study mentions atmospheric warming and Hadley cell expansion as factors responsible for the latitudinal position and intensity changes occurring with global jets. A comprehensive review performed by Xian et al. (2021) correlates that the Hadley cell has expanded poleward no more than 1° degree per decade
−1 in the Southern Hemisphere [
92]. This thermal heating or expansion is related to the location of increasing and decreasing wind trends found along the STJ.
Allen and Sherwood (2008) explain that increasing meridional temperatures within the upper troposphere (~200 hPa) have led to a decline in atmospheric wind speeds for the equatorial zone [
73].
Figure 7 highlights how the magnitude of temperature change varies among the reanalyses but a constant warming pattern is present within the location of the STJ (20° S–30° S). In our study, the maximum positive temperature trends become more concentrated over the subtropical states of Mato Grosso do Sul, Goías, São Paulo, and Rio de Janeiro between 300 and 250 hPa. With these meridional temperature increases, we also correlated the largest magnitude changes in geopotential heights (
Figure 8) and µ winds (
Figure 9) over the subtropical latitudes. Based on this information, we can interpret that upper-level wind changes are influenced by the poleward shift in the STJ across subtropical Brazil during winter.
Lastly, a comparison between radiosonde and climate reanalyses should be considered as part of the analysis.
Figure 2c and
Figure 3 highlight the mean wind speed trends for seven mandatory pressure heights. Radiosonde (IGRAv2) data show a negative to positive trend in the mean vertical wind speed profile during summer. The only reanalysis product that follows a similar profile is ERA5, which represents a decreasing (increasing) wind speed at 850 and 700 (500 to 200) hPa. Each of the remaining four reanalyses depicts conflicting vertical mean wind trends. CFSR (MERRA-2) exhibits decreasing (increasing) wind speeds for almost all pressure levels, while the older generation of reanalyses (NCEP-NCAR R1 and NCEP/DOE R2) show a zig-zag effect (changing pattern) in wind trends. This trend inconsistency is present for winter as well. IGRAv2 exhibits increasing wind speeds for all pressure heights except for 700 hPa between 2000 and 2022. Reanalysis data show a negative–positive–negative trend in the vertical mean wind profile. ERA5 is the only reanalysis to exhibit increasing wind speeds in the lower troposphere (850–400 hPa) before transitioning to a decreasing wind speed trend in the upper troposphere. These reanalysis differences in the wind trend profile indicate that completing a temporal (time-series) analysis may not fully explain radiosonde data patterns for Brazil. Merino and Gassmann (2022) also concluded that climate reanalysis (NCEP-NCAR R1 and ERA5) has difficulty replicating radiosonde wind data from three sites in Argentina between 1990 and 2020 [
9].
Figure 3,
Figure 4 and
Figure 6 describe the spatial changes in wind speed based on radiosonde and climate reanalyses for summer and winter. This study determined that wind trends are geographically identified for both radiosonde and reanalysis data. During summer, IGRAv2 shows that wind speeds have decreased across southeastern Brazil in the lower and middle troposphere (
Figure 3a,b) before transitioning further poleward to southern Brazil in the upper troposphere (
Figure 3c,d). A spatial pattern is also present for each radiosonde where wind speeds have declined but with a geographic footprint that extends equatorward along the Brazilian coastline in the lower troposphere (
Figure 4). However, reanalyses exhibit positive wind trends for southern Brazil at 500 and 250 hPa. A secondary axis of negative (positive) wind trends is present in the Amazon basin but it is dependent on pressure height and data type. NCAR-NCAR R1 and NCEP/DOE R2 exhibit negative (positive) wind trends across the Guianan Highlands and western Amazon basin (central Amazon), while ERA5, MERRA-2, and CFSR confirm increasing wind speeds across the majority of the Amazon basin for the lower atmosphere. When compared to IGRAv2, stations display negative wind trends for the Guiana Highlands and western Amazon, while positive trends are found in the interior of the Amazon at 850 and 700 hPa. This geographical pattern best matches the older-generation models of NCEP-NCAR R1 and NCEP/DOE R2. Upon reaching 500 and 250 hPa, radiosonde data follow a positive trend primarily focused on equatorial Brazil, while negative wind trends shift from Pantanal to the Amazon basin. Reanalyses show a transition zone between the lower to middle atmosphere before a consensus exists for increasing wind speeds in the Amazon at 250 hPa. For winter, an agreement exists between radiosonde and reanalyses in the middle (500 hPa) and upper atmosphere (250 hPa) where a delineation of negative and positive wind trends is observed at 20° S. Below these two geopotential heights, the relationship between the two data types begins to diminish. In the lower troposphere, IGRAv2 shows a latitudinal wind pattern of negative–positive–negative trend at 700 and 850 hPa. Negative and positive wind trends are dependent upon the geopotential height for each reanalysis. Based on this information, we can infer that upper-level wind trends tend to be spatially driven and no one dataset can fully explain or correlate the wind trend changes documented with radiosonde data for Brazil. This finding is supported by Merino and Gassmann (2022) who describe how climate reanalysis data performed poorly in reproducing upper atmosphere wind trends for radiosonde data located at middle and high latitudes across Argentina [
9].
