Abstract
Four observational results: the intermittency of air temperature; its correlation with ozone photodissociation rate; the diurnal variation of ozone in the upper stratosphere; and the cold bias of meteorological analyses compared to observations, are reviewed. The excitation of photofragments and their persistence of velocity after collision is appealed to as a possible explanation. Consequences are discussed, including the interpretation of the Langevin equation and fluctuation–dissipation in the atmosphere, the role of scale invariance and statistical multifractality, and what the results might mean for the distribution of isotopes among atmospheric molecules. An adjunct of the analysis is an exponent characterizing jet streams. Observational tests are suggested.
1. Introduction
The excited states of the fragments recoiling from the dissociative absorption of a photon by molecules, photodissociation, were examined theoretically [1,2] and experimentally [3]. It became possible to measure the translational energies of the recoiling photofragments and assign their rovibronic energies and states [3,4]. A book of more recent provenance is available [5].
The chemical state of the upper stratosphere and its coupling to the temperature there has been and still is hampered by the paucity of in situ observations of adequate spatial and temporal resolution. Although satellite observations can give global coverage, their weighting functions integrate over vertical depths of kilometres and their horizontal resolution is determined largely by the velocity of the satellite, typically several km/second. Nevertheless, observations from the Nimbus 4 satellite in September 1970 during a Southern Hemisphere sudden stratospheric warming showed a correlation between ozone concentration and the reciprocal of temperature in the upper stratosphere [6]. The observations were made at local noon.
A diurnal variation was observed in a carefully calibrated long-term series of ground-based observations of the total ozone overhead column of 1–2% in Antarctica by Dobson spectrophotometers [7]. A series of numerical integrations with a photochemical column (1D) revealed that the diurnal variation had a minimum in early morning and a maximum in late afternoon as observed, and that the diurnal variation boosted the ozone by about 20% compared to a model with averaged insolation [8]. When coupled to a radiative transfer model with nitrogen-hydrogen-oxygen chemistry, the model showed that upper stratospheric cooling, caused by a doubling of carbon dioxide, increased stratospheric ozone substantially [9,10], via the temperature dependence of the chemical reactions, an effect which increased when chlorine chemistry was included [11,12]. The extension to 2D enabled the effects of meridional circulation and its transport to be included [13].
Further modelling efforts calculated a substantial underestimate of ozone, particularly in the upper stratosphere, when compared to observations [14,15]. These models were, respectively, 2D and 1D and used steady state approximations to calculate the chemistry. A modelling effort using fully diurnal chemistry integrated along 3D trajectories showed a discrepancy in the same calculated deficit sense but was much less and barely significant [16]. Note that earlier efforts had been made to calculate the translational velocity of oxygen atoms in the lower atmosphere [17]. The vertical profiles of O(3P) had been measured by balloon from the upper to the lower stratosphere [18]; the ratio of O atoms to O3 molecules was established [19].
Nevertheless, using photofragment spectroscopy, a substantial laboratory effort was triggered into the photodissociation of ozone, with the aim of quantifying the production of odd oxygen (atoms + ozone). From a large wealth of the literature, [20] was chosen to represent the laboratory observed and modelled effects of photofragment excitation on the production of odd oxygen. The atmospheric observations of the diurnal variation are represented by [21,22]. The added effect considered here is the behaviour of ozone and temperature; the correlation of the ozone photodissociation rate with the intermittency of temperature in the lower stratosphere was originally proposed in [23] and included recently in a discussion of scale invariance from molecular to meteorological scales [24]. The cold biases in many model representations of the stratosphere also have a large body of literature—here we focus mainly but not exclusively on the problem in the upper stratosphere discussed in [25].
A consequence of the issues raised in [20,21,22,23,24,25] is the possibility of influence on isotope effects [26]; they will require further investigation if local thermodynamic equilibrium (LTE) does not pertain in the stratosphere. LTE is known not to be a universally good approximation above the stratopause, about 50 km altitude.
In this paper, the primary focus is on the correlation between the intermittency of temperature C1(T) and the ozone photodissociation rate J[O3]. A secondary effort involves the scaling characteristics of jet streams, via H(s) and H(T), describing the behaviour of wind speed s and temperature T. A primary motive is to suggest observations in the present atmosphere, which has warmed significantly since the 1987–2006 period when the data analysed here were taken. Will there be a signature of warming from ‘greenhouse’ gases?
2. Photodissociation
In addition to [5], a book that may be consulted on the electronic structure, electronic excited states, and the resultant spectra of polyatomic molecules is [27]. Recent theoretical descriptions of photodissociation use ‘on the fly’ trajectory and roaming techniques. Since the Great Oxygenation Event 2400 million years ago, the initiation of atmospheric chemistry is almost entirely via the photodissociation of ground state molecular oxygen:
O2 (3Σg−) + hυ → O(3P) + O(3P)
The wavelength threshold for this process is 242.4 nm and O(3P) is the ground state of the oxygen atom. Higher energy lower wavelength thresholds exist for the production of O(3P) + O(1D) at 175 nm and at 133.2 nm for the production of O(3P) + O(1S). The rules for determining these processes are quantum mechanical, using group theory and symmetry principles to derive selection rules [27,28]. The word ‘rovibronic’ is used to describe the energy states and spectra of molecules. It refers to the spectra resulting from the rotational, vibrational, and electronic transitions, which typically occur in the microwave, infrared, and visible/ultraviolet, respectively. The vibrational transitions can occur as fine structure on electronic transitions and may themselves have rotational fine structure. The transitions are between energy levels illustrated on the potential energy curves in Figure 1. What matters to the arguments here are the experimental values of the photofragment energies.
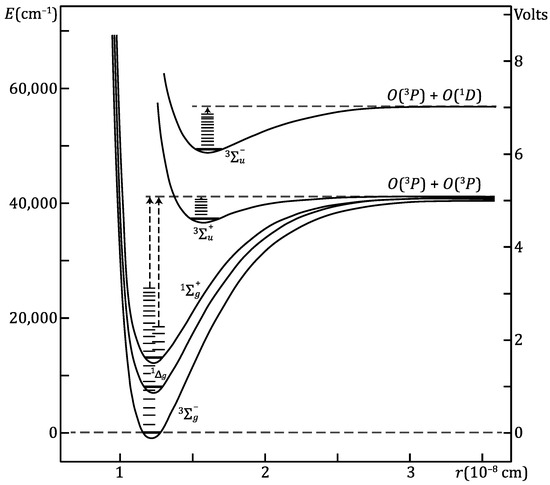
Figure 1.
Potential curves for electronic and vibrational states observed for the O2 molecule. There are states above 100,000 cm−1 that are not relevant for the present argument. The lowest three vibrational levels of the 3Σ+u state are not shown. See Table 1 for further information. Adapted from Figure 195 of [28] by C. Thompson.
The ground state oxygen atoms combine with ground state oxygen molecules in a 3-body reaction to form ozone:
O(3P) + O2(X3Σ−g) + M → O3(1A1) + M
Because a third body, M, is needed to remove the energy brought to the reaction by the reactants by collision, R2 has a negative temperature dependence—it accelerates as temperature decreases and the reactant molecules slow.
Ozone photodissociates across a wide wavelength range, from the vacuum ultraviolet to the near infrared. That is the result of its low bond energy, 1.04 eV (96.49 kJ mol−1, 23.06 kcal mol−1, 8066 cm−1). The X1A1 ground state has several low-lying excited states that are accessible by photons ranging from the near infrared to the vacuum ultraviolet. The transitions to the A, B, C, and D states correspond to the Wulf, Chappuis, Huggins, and Hartley bands, with some overlapping. The relative intensities of these absorptions vary by orders of magnitude [29]; all are diffuse, with vibrational structure evident in the Chappuis–Wulf bands, Huggins bands, and weakly near the peak of the Hartley band. The closeness of the low-lying triplet and singlet A states causes predissociation that produces diffuseness [27]. See Figure 2 for the absolute and relative strengths in the ozone spectrum. Note that other triatomic molecules relevant in the stratosphere, such as NO2, SO2, HO2, and OClO have rather strong bonds and structured electronic spectra in the visible and UV. N2O is different, having a continuum absorption in the UV.
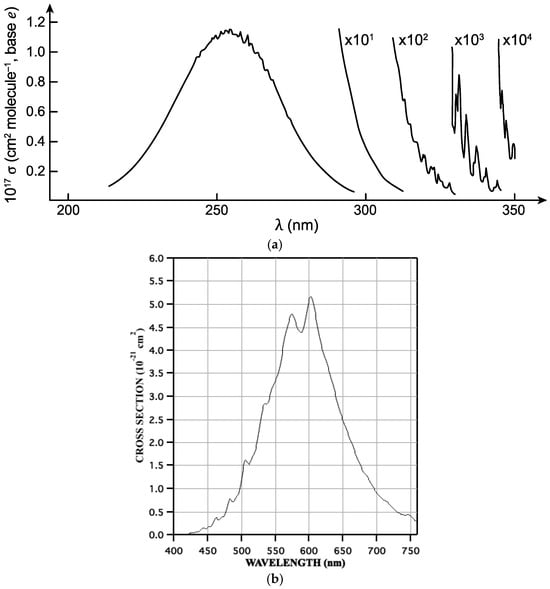
Figure 2.
(a) Absorption spectra at 298 K in the ultraviolet wavelengths shown on the abscissa. The Hartley band is the main feature centered at 255 nm, overlapping the Huggins bands at longer wavelengths. The photofragments produced and their wavelength thresholds are specified in Table 1. Adapted by C. Thompson from [29]. (b) Absorption in the Chappuis band of ozone. Note context on cross-section strength in Figure 2a. Reaction R4 describes the photofragment products from the photodissociation associated with this spectral band. Courtesy J. B. Burkholder.
The photofragments from ozone photodissociation have internal and translational energy. The possible pairings of O atoms and O2 molecules allowed for by the selection rules are given in Table 1, along with the wavelength thresholds below which they are energetically possible [29]. A thorough discussion is available in Chapter 4 of [29].

Table 1.
Wavelength thresholds for producing ozone photofragments. Rows are labelled by O atom electronic states, columns by O2 molecule electronic states. After [29,30].
The following processes are dominant in terms of their contribution to J[O3]:
where J is the photodissociation coefficient of O3. Note, however, that the photodissociation in the Huggins, Chappuis, and Wulf bands, although less intense, are to ground state O(3P) atoms, which will have high translational energy enabled by tapping into the electronic excitation energy that went into producing the O(1D) atoms in the Hartley band, potentially some 16,000 cm−1. They are also more numerous owing to their production across the near UV through the visible and near IR and so can be produced lower down in the atmosphere; their flux is about two orders of magnitude greater.
O3(1A1) + hυ → O(1D) + O2(a1Δg)
O3(1A1) + hυ → O(3P) + O2(X3Σg−)
Reactions R3 and R4 occur in the Hartley band situated between 200 and 300 nm and are more intense than the other bands. The observed energies of the photofragments in the laboratory can be seen in [29,30,31] and have been calculated in [32]. In the air, the translational energies of the photofragments will be up to an order of magnitude greater than that of thermalized N2 and O2 molecules. Vibrational excitation of the molecular oxygen photofragment in R4 up to levels v ≥ 26 provides potential for odd oxygen production effects [20]. It may also make for the enhancement of the velocities of air molecules in general by vibration–translation energy transfer. Note that laboratory photofragment spectroscopy is performed collision-free at high vacuum, so there are no effects from collisional quenching, upon which the assumption of LTE in the atmosphere depends. Under LTE, the translational and rotational energies of air molecules are assumed to instantaneously relax to a Boltzmann population distribution, while the vibrational modes of N2 and O2 are too energetic to be excited above the v = 0 ground state. However, the hot atoms and fragments do not recoil into a thermalized bath, but into a field of vorticity structures that exist in air on all scales up from the mean free path [23]. The collisional deactivation becomes less and less efficient as altitude increases; nevertheless, non-equilibrated effects are evident in the lower stratosphere [23,24].
The Hartley and Huggins bands operate in the middle–lower stratosphere to define the cut-off at 310–320 nm; wavelengths lower than this do not penetrate into the troposphere in flux amounts that are significant compared to the fluxes in the Chappuis and Wulf bands.
3. Temperature
Temperature T in a gas may be defined in two ways: by macroscopic thermodynamics as:
and by Maxwell–Boltzmann statistics as:
These equations, defined in [33] by Equations (3.16) and (5.1), respectively, contain a fundamental difficulty in application to atmospheric temperature. There is no generally agreed method of calculating entropy S in open systems, especially when the air is as far from equilibrium [34], thus vitiating Equation (1). The difficulty posed by using Equation (2) lies in the possibility that the molecular translational velocities v are not thermalized. This effect is illustrated in Figure 3. There is observational evidence for this occurrence that is reported in [23,24] and discussed in Section 6 and Section 7 below.
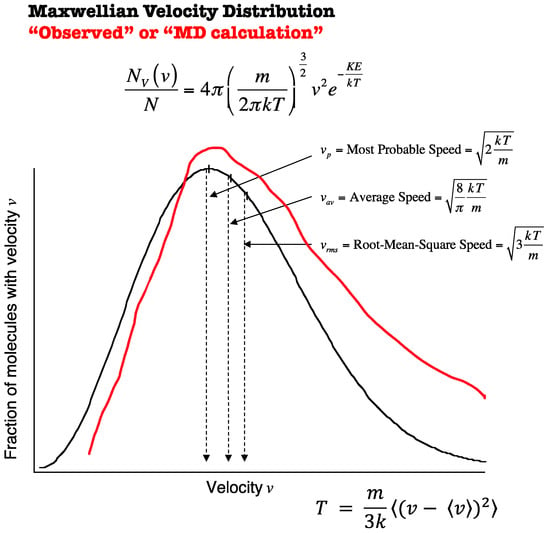
Figure 3.
Relationship of molecular velocity to temperature. The red curve is hypothetical, illustrating non-LTE conditions arising from translationally hot photofragments.
Atmospheric temperature will be discussed further in the light of the ensuing sections and their insight on molecular processes and how they scale up to macroscopic observables. Nonlinearities, scale invariance, and statistical multifractality are evident [35] and deployed [33,34].
4. Atmospheric Ozone
Ozone is produced primarily in the upper and middle stratosphere at low latitudes and is transported poleward and downward at middle and high latitudes, particularly in and around the winter polar vortices in the Arctic and Antarctic, modelled for example in [36]. From there, transport to the lower stratosphere at middle and high latitudes occurs, followed mainly via tropopause folding downward across the tropopause and into the troposphere [37]. That process is exemplified in [38] and its consequences for tropospheric chemistry discussed in [39]. The vertical profile of ozone from the tropopause to the unpolluted boundary layer and surface is approximately at an average constant number density of 1012 molecules cm−3, resulting in a mixing ratio profile that increases with altitude [37,39]. That implies the significance of import downward across the tropopause and that ozone is needed to make ozone in the troposphere—nonlinearity ensues.
5. Statistical Multifractals
During the airborne polar ozone missions in the lower stratosphere between 1987 and 2000, and tropical and midlatitude missions up to 2006 in the troposphere and lower stratosphere, it became apparent that the atmospheric variability in both the horizontal and vertical was much larger than the instrumental noise analysed at 1 Hz for most instruments and further at 5 Hz for the meteorological measurements on the ER-2. Gaussian, Poisson, or random distributions and white noise were a sign of instrumental variation rather than atmospheric. Accordingly, a search was made for a suitable mathematical framework, and was found laid out as used in [40]. In the present context, references [23,24,33,34,35] contain detailed expositions and discussions. Fat-tailed probability distributions were seen, particularly of temperature, as seen for example in Fig. 11 of [24]. Such tails are symptomatic of long-range correlation in the data. For the present purpose, we illustrate the calculation of intermittency of temperature for a particular flight leg, shown in Figure 4. The intermittency of temperature, C1(T), is an exponent that can range between 0 and 1. Zero corresponds to random noise unity to a Dirac delta function. The scaling variables and their equivalences to those of equilibrium statistical thermodynamics are given in Table 2.
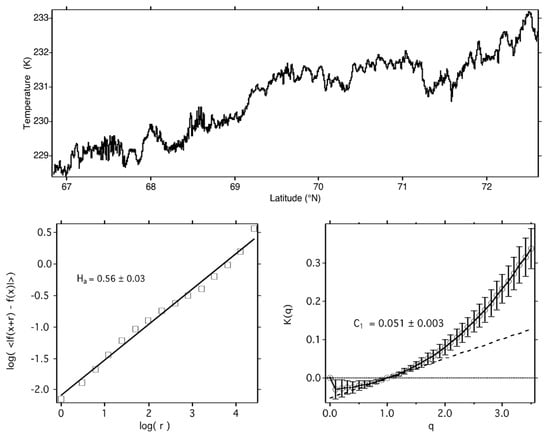
Figure 4.
Upper: temperature trace measured from the ER-2 at approximately 55 mbar, 19970506 (yyyymmdd format) in low wind speed conditions. Lower left: log–log graph from which H(T) was calculated, corresponding to the 5/9 theoretical value. Lower right: graph from which C1(T), the intermittency of temperature was calculated using scaling variables K(q) and q, see Equation (3).

Table 2.
Equivalence between statistical thermodynamic and scaling variables.
The variables are obtained as follows. q defines the qth order structure function of the observed quantity. The scaling exponent K(q) is derived from the slope of a log–log plot [33,35].
and examination of energy E in terms of a scale ratio produces an expression for the fractal co-dimension c(γ). C1 is the co-dimension of the mean, characterizing the intensity of the intermittency. The Lévy exponent α characterizes the generator of the intermittency which is the logarithm of the turbulent flux; for a real system, its value may not be confined to the theoretical range. Means converge but the variance does not, a result expressed as 2.0 > α >1.5.
Intermittency as calculated applies over all observed scales, 40 m to an Earth radius. It is consistent with the concentration of thermal energy into local vorticity structures, such as the rolls, slabs and sheets characterised in the laboratory [41].
6. Aircraft Observations
The airborne observations from which the results in this paper are derived were taken during the missions in Table 3, from the ER-2. All flights were in the lower stratosphere, at an average pressure of approximately 55 mb. The flight legs were largely flown as segments of a great circle, although some were flown during POLARIS as racetrack segments across the terminator in slow-moving air masses, a manoeuvre that took the ozone photodissociation rate to zero.

Table 3.
Observations used to calculate air temperature intermittency and ozone photodissociation rate.
A detailed account of the flights contained within Table 3 can be found in [23]. Here, we focus on the results for the correlation between J[O3], the ozone photodissociation rate, where J is the actinic flux at the ER-2 and [O3] is the local ozone number density, and the measured temperature T and its calculated intermittency C1(T). Note that the correlation of C1(T) is not with J or with [O3] but with their product.
During the racetrack flights across the terminator, it was noticed that the temperature ‘in the same air’ was 0.4 K cooler in the dark than in sunlight [23,33]. That is evidence in support of the hypothesis that the translational energy of the photofragments is not quenched instantaneously as required by LTE but finds expression in the intermittency of temperature in sunlight.
In seeking an explanation for the correlations in Figure 5, attention was eventually drawn to the molecular dynamics computations reported in [48]. A population of Maxwellian ‘billiards’—elastic, impenetrable spheres—produced hydrodynamic behaviour on very short time and space scales when subjected to a symmetry-breaking energetic flux of such ‘molecules’. How can this result be squared with the formulation of atmospheric dynamics?
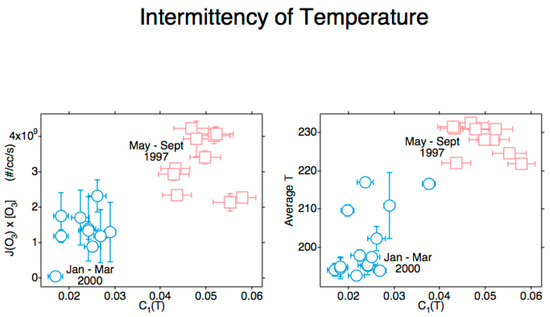
Figure 5.
These data are from Arctic flights POLARIS [42] and SOLVE [43], see Table 3. J[O3] is averaged along the flight segment and shown on the ordinate of the left plot, with T similarly averaged and displayed on the right plot. The abscissa on both shows the intermittency of T, calculated from the lower right graph in Figure 4. The vertical and horizontal bars are standard deviations.
7. Fluid Mechanical Effects
The emergence of organized flow from a population having continuous translational, random symmetry in [48] is illustrated in Figure 6.
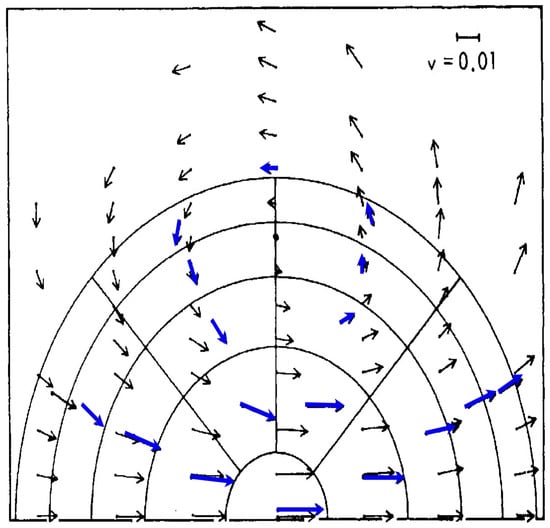
Figure 6.
The emergence of ring currents or vortices in an initially thermalized population of 220 Maxwellian atomic ‘billiards’ subjected to a symmetry-breaking flux of energetic atoms. Original molecular dynamics simulation by [48]. Blue arrows are averages of the atom vectors after 9.9 collisions, black arrows are from a fluid mechanical Navier–Stokes equation integration. Later calculations show disagreements between the two approaches.
To compute the emergence of hydrodynamic behaviour from a simulated thermal molecular population subjected to an anisotropic flux, use:
v is the molecular velocity field and taking its curl yields the vorticity ω. The coordinates for momentum p and position q are necessary because real molecules do not have spherical symmetry and the anisotropies of the gravitational field, the solar beam, and the planetary rotation also break the continuous translational symmetry of a Maxwellian gas.
ω = ∇ × v(p,q)
The following equation, Equation (5), may be deployed to compute enstrophy ε; the LHS expresses twice its value. Note that the LHS is correct here and in [23] but is incorrect where it appears as Equation (3) in [24].
⟨ω · ω′⟩ = −∇⟨v · v′⟩
Enstrophy is useful in analyzing the vorticity form of the Navier–Stokes equation for fluid flow, which is represented by:
here, κ is kinematic viscosity. Using Equations (4) and (5), the autocorrelation function for vorticity, A(t), can be related to enstrophy by:
Enstrophy is expressed by:
here, Strij is the strain rate on a fluid element. The first term on the RHS is the generation of vorticity by stretching or compression, the second term is viscous dissipation, the third term is the divergence. Divergence is often assumed to be zero, but that is not true if ozone photodissociation is generating vorticity, as it is in Figure 6, and from the smallest scales up. Nonlinearity is inherent in Equation (6); vorticity advects itself.
In statistical multifractal analysis, it is necessary to calculate up to the nth moment, which for the molecular speed is given by:
Equation (9) would be used in computing for a molecular dynamics simulation of a molecular fluid, such as air.
The derivation of the hydrodynamic equations from a molecular basis is discussed, for example, in Appendix 5 of [49]. Meteorologically, means are treated as organization, while departures from the mean, ‘eddies’, are regarded as dissipation. That convention will be considered in the next section.
8. Langevin Equation
Langevin originally formulated his equation to partition the motion of a particle moving randomly in a fluid into systematic and noisy components. The noise was the fluctuating part, the systematic part was the friction. The extension of this basic framework to fully nonlinear systems far from equilibrium becomes very complicated [49]; see Chapter 9 therein. One simplification involves treating some variables as ‘slow’, a technique used to implicitly justify the integration of the Navier–Stokes equation in atmospheric models. Its limitations are encountered when, for example, the fluid velocity becomes a significant fraction of the most probable molecular velocity. That circumstance is encountered in the stratospheric polar night jet stream (particularly in the upper stratosphere), in the polar front jet stream, in the subtropical jet stream, and in hurricanes and tornadoes. The equivalences in Table 2 offer an observationally based alternative, at least in principle. Scaling exponents obtained in that manner could provide an alternative to the problems associated with subgrid scale parametrizations in general circulation and forecast models.
is one of many versions of the Langevin equation. m is the particle mass, v is its velocity, κ is kinematic viscosity, and δF(t) is a fluctuating force. While this might be applicable to an atmospheric aerosol particle, by using the sum representing the average value of the forces acting on the particle (organization) and the fluctuations about the mean (dissipation), it will not work for air molecules. In that case, the fluctuations represent the emergent organization, and the mean of the molecular motions represents dissipation, see chapter 3 of [33].
The result of the emergence of organized flow in [48], as illustrated in Figure 6, entails the view that the molecules of the high velocity tail in the fluctuations drive organization, while the rapid exchange of energy among the molecules near the most probable define an operational temperature and represent dissipation. The fluctuations are what manifest as emergent turbulence; the operational temperature is what enables numerical models to average out the effects of much of the observed variability in the air, a problem discussed in [50]. Atomistic simulations have yielded scaling behaviour [51].
9. Chemical and Radiative Consequences
9.1. Isotope Distributions
Isotope distributions across atmospheric molecules have been used to interpret atmospheric processes [26,52], especially the 16O, 17O, 18O in O2, O3, H2O, SO2, and N2O. Carbon isotopes 12C, 13C, and 14C have also been used, along with 14N, 15N and 32S, 33S, 34S. Water has also been studied with H and D isotopes. It is the distribution of O isotopes across O2 and O3 [53] that will primarily concern us here. The RRKM (Rice–Ramsperger–Kassel–Marcus) theory of unimolecular transition states was used with some success to predict some observations; however, discrepancies with observation remain [54]. The persistence of molecular velocity after collision [55], coupled with our observed correlation between ozone photodissociation rate and the intermittency of temperature, via translationally hot ground state O(3P) atoms, could affect the observed isotopic distributions. That possibility is enhanced by the result displayed in Figure 6. Instantaneous quenching to a thermal distribution is not likely. Symmetry breaking will play an important role [24,56]. Symmetry selection rules mean that every second rotational line is missing in the electronic spectra of 16O16O, but not in the asymmetric 16O18O. Since ozone photochemistry is initiated by the photodissociation of molecular oxygen in the Schumann–Runge bands, 50O3 will be produced at a faster rate than 48O3, while the oxygen column is optically thin, because there is more absorption in the rotational fine structure. Once it becomes optically thick, the actinic flux for the production of the heavier ozone will decrease. A chemical bond between a 16O and a 18O, whether in molecular oxygen or ozone, will have a lower zero-point bond dissociation energy than one between two 16O atoms. That will require more energy input to dissociate it, making it more stable. Given the evidence that LTE does not apply in the lower stratosphere, making it even less likely in the lower pressures of the upper stratosphere, it seems as though rigorous calculation of the oxygen isotope distribution will require detailed molecular dynamics calculations—equilibrium assumptions probably will not suffice. The J-values for R1, R3, and R4 will need careful consideration and high resolution to accommodate the effects of 16O16O and 16O18O upon the downward actinic solar flux. 34O2 is the 4th most abundant molecule in the atmosphere.
9.2. Chemical Kinetics Effects
Reactions with an activation energy are accelerated by a rise in temperature because the increased kinetic energy of the reacting molecules allows for more of them to surmount the energy barrier leading to products. If, as we postulate, there is an overpopulation of faster molecules relative to a Maxwell-–Boltzmann distribution, we may expect such reactions to go faster. That will apply in particular to reactions involving the translationally hot O(3P) atoms from R1 and R4. On the other hand, reactions like R2 will be decelerated—there will be more reactive atoms and free radicals and fewer reservoir molecules, including ozone. The combined effect on ozone in the upper stratosphere will be a decrease in its abundance and altered diurnal variation.
Below the stratospheric ozone number density maximum, the effects of hot O(3P) atoms will need to be modelled carefully, given the diversity of molecular species in the lower stratosphere and troposphere. The possibility of rotational and even vibrational excitation of air molecules in general, including N2 and O2, should be considered. While hot O(3P), even with orders of magnitude greater number densities, cannot compete with O(1D) in terms of reactivity with H2O to produce OH [17], it may react with hydrocarbons and the evidence shows it could affect C1(T), the intermittency of temperature. A 23/9 dimensionality of the atmosphere [35,57] means that compared to a medium in which the law of mass action is satisfied—random access on relevant time scales to the entire 3D volume—reactions involving reactants of a given number densities will be accelerated in 23/9 dimensions.
9.3. Radiative Effects
The incoming solar flux has a radiation field showing a high degree of intermittency in its spectral distribution [58]. That will affect the course of the photodissociative evolution.
The calculation of spectral line shapes from first principles has long been [59] and still is [60] a complicated and difficult problem. The variation in line shape with pressure, temperature, and identity of collidants leads to great difficulty in a priori calculation of radiative transfer through the atmosphere from surface to stratopause. Accordingly, equilibrated laboratory experimental data are generally used. That makes the putative effect of hot photofragments somewhat speculative in the absence of the necessary laboratory experiments. If the effects are mainly evident in the far wings of a line, as they might be on the crude basis of impact theory, they will have spectral separation from the line centre where self-absorption is often limiting and so the wings will be more effective at absorbing and emitting radiation in the atmosphere.
In conjunction with the correlation of temperature and the ozone photodissociation rate with the intermittency of temperature, it should be noted that the temperature difference across the terminator in the ER-2 racetrack flights was consistent with direct solar heating of the sunlit air compared to that in the dark [23,33].
10. Meteorological Implications
Statistical multifractal analysis of airborne data yielded two further exponents beyond the intermittency C1, namely H and α which are described in Section 5 above. They could be evaluated, using double precision for C1, for wind speed, temperature, and ozone for many flight segments from the NASA ER-2, WB57F and with the DC-8 ranging from pole to pole. The NOAA Gulfstream 4SP was also used over the east Pacific Ocean in the Northern Hemisphere in the upper troposphere and lower stratosphere, and deployed GPS dropsondes that enabled examination of the vertical scaling of wind speed, temperature, and humidity [61,62]. The vertical scaling of the horizontal wind speed is shown in Figure 7.
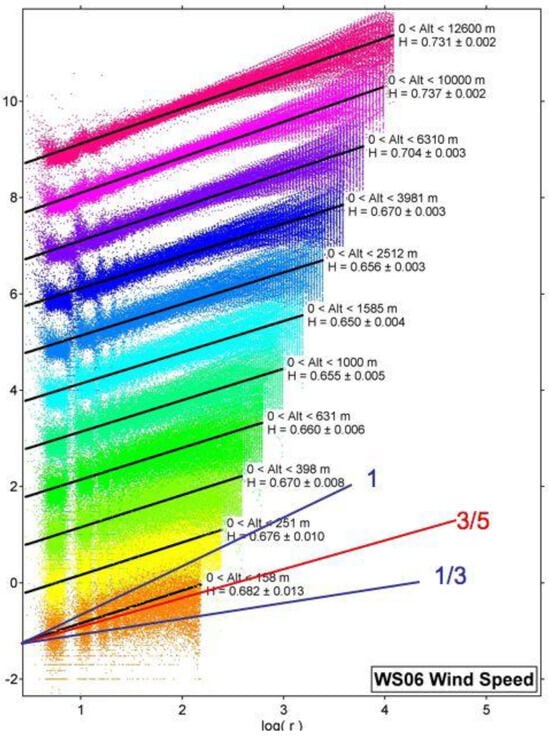
Figure 7.
H is the scaling exponent in the vertical of the horizontal wind speed recorded by 315 GPS dropsondes from the NOAA G4-SP aircraft flying at an altitude of approximately 12–13 km in January–March 2006 [61] in the area bounded (21°–60° N, 128°–172° W). Each coloured set of points represents H and the black lines are the r.m.s. fits to the vertical shear across layers, increasing logarithmically upwards and labelled by the corresponding value of H. The three lines labelled by fractions are predictions by different theories. Gravity waves 1, Bolgiano–Obukhov 3/5, Kolmogorov 1/3. H increases to near 0.75 at 12 km, where jet streams were encountered. Isotropy (Kolmogorov) is nowhere evident but is closest in the marine boundary layer.
The results in Figure 7 do not display a constant scaling parameter for the vertical scaling of the horizontal wind speed through the depth of the troposphere. The results suggest an effect of the presence of jet streams. During the Winter Storms missions during the January–March periods of 2004, 2005, and 2006, three kinds of jet streams were encountered [61,62]. For the three: PFJ (polar front jet), STJ (subtropical jet), and the SPNJ (stratospheric polar night jet) the scaling exponent H(s), where s is the wind speed is plotted against two conventional meteorological measures of jet stream strength in Figure 8. Both the jet stream depth (Figure 8a) and the difference between the maximum and minimum wind speeds (Figure 8b) showed a positive correlation with H(s), spread over latitude bands stretching from 15° N to 45° N.
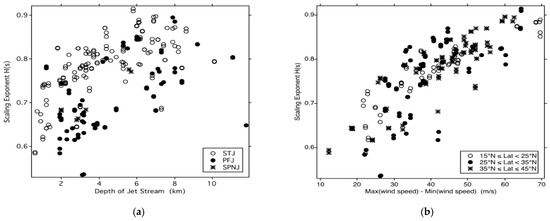
Figure 8.
Scaling exponent H in the vertical for the horizontal wind speed from GPS dropsonde data; scatterplot against vertical observed measures of jet stream strength. Left (a), versus jet stream depth. Right (b), versus maximum wind shear. Note the positive correlation and consistency with Figure 7 and Figure 9. The STJ is more organized than the PFJ.
Figure 8a shows that, on average, the subtropical jet stream has a higher value of H(s) than the polar front jet stream does. We will return to the possible consequences and implications stemming from this result in Section 11.3 below.
Since the scaling analysis of wind speed in the vertical gave a measure of jet stream strength, it was decided to extend the technique to the horizontal. That widened the scope considerably, via use of all suitable aircraft flight segments, from pole to pole. We note that there is strong evidence of connections between the tropospheric and stratospheric jet streams [63,64,65,66], including direct evidence of tropospheric air engaged in splitting the stratospheric vortex during sudden stratospheric warmings.
Plotting the H against the cross-jet wind shear (Figure 9a) and against the cross-jet temperature gradient (Figure 9b) for the five polar missions listed shows a positive correlation. Taken together, the correlations displayed establish the ability of the multifractal analysis to characterize jet stream dynamics. Comparison of the few along-jet segments with the numerous cross-jet segments revealed the minimum H as occurring along the jet, while the maximum was associated with flight across a very strong jet [67], as discussed in [24].
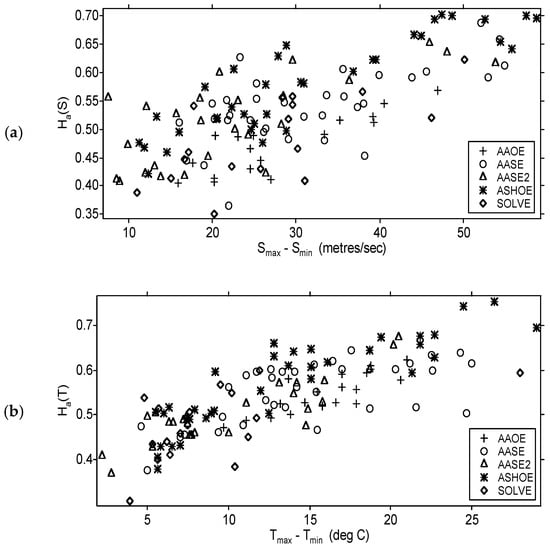
Figure 9.
Upper (a), scaling exponent H for horizontal wind speed from ER-2 plotted versus the difference between the maximum and minimum winds in the jet. Missions shown in inset. Lower (b), the scaling exponent H for temperature, same data. Note the positive correlation [67].
A further feature of the stratospheric polar night vortex in both the Arctic and the Antarctic was that the intermittency of ozone stayed constant even while the H and α exponents evolved as the ozone loss developed as described in Chapter 4.3 of [33]. That was accompanied by the constancy of all three exponents for wind speed. Figure 8 of [24] shows how the strength of the polar night jet stream varies between the cross-jet and along jet directions.
Recent work indicates that the Arctic polar front jet stream has become ‘wavier’ under global heating from so-called greenhouse gases, resulting in severe winter weather outbreaks in midlatitudes [68,69,70]. That suggests that the multifractal techniques used on Arctic jet streams from 1989 to 2006 described above could be repeated two to three decades later to see if the scaling exponents have indeed changed under the influence of increased global heating.
11. Observational Tests
Statistical multifractal analysis of airborne observations has yielded, in the shape of scaling exponents H, C1, and α, insight into some physical processes operative in the atmosphere. In this section, some tests are suggested which have the potential to further this approach as regards the cold bias in free-running models, and to see if the scaling of jet streams offers any insight of their ‘waviness’ under the last three decades of global heating.
11.1. Laboratory Tests of Photodissociation in Nonequilibrium Air
The excitation of photofragments from O2 and O3 in R1, R3, and R4 was measured in high vacuum. Simulating the sun with a Xenon arc lamp using gas mixtures similar to air as a function of pressure and temperature would enable a test of whether the excited photofragments affected both the chemical composition, including the isotopes, of the ‘air’ and the line shapes of the radiatively significant gases such as CO2, H2O, CH4, N2O, and CFCs. Suitable analytical and spectroscopic diagnostic techniques would be required.
11.2. Airborne Observational Tests of the J[O3] vs. C1(T) Correlation
A payload that could measure J[O3] is being deployed on the NASA WB57F [71]. It has a radiometer set up to measure J[NO2]. Measurements of J[O3] would enable comparison with the Arctic measurements of ozone photodissociation and temperature intermittency made in 1997 and 2000. Isotopic measurements would enhance the results. Repeating the decades old observations with modern instrumentation would expand the database and the confidence that could be placed in it. That platform can operate in the lower stratosphere and upper troposphere. Given the intermittency of the incident solar spectrum [58], J[O3] should also be intermittent. Positive correlation of C1(J[O3]) versus C1(T) along flight segments would be conclusive.
An outstanding problem in the stratosphere occurs far above aircraft altitudes, regarding the cold bias in meteorological analyses compared to lidar observations [22,25]. A high-altitude balloon would seem to be the only option to test the J[O3] vs. C1(T) correlation, possibly combined with dropsondes through the depth of the stratosphere.
Whether excited photofragments, especially translationally hot O(3P) atoms, have any detectable effects below the tropopause [17] could be tested from several research aircraft.
Large 4-engined turboprop aircraft such the C130 have investigated exchange around jet streams [38,72]. Other aircraft such as the MRF BAe 146, NOAA G4-SP, and the NCAR G5 could investigate the extratropical lower stratosphere and the troposphere. NASA has a fleet of research aircraft that operate throughout the atmosphere up to 21 km.
11.3. Airborne Observations of H(s) and H(T) along and across Jet Streams
All the aircraft listed are capable of testing whether the scaling exponents around the Arctic polar front jet stream reflect any increased ‘waviness’ from global heating arising from the increases in ‘greenhouse’ gases [68,69,70] since 1997–2006. That would be reflected in a decrease in H(s) in the current atmosphere compared to that of 2–3 decades ago. If the results justified it, such flights could be extended to the Southern Hemisphere. Any such independent confirmation by high quality in situ observations would add insight to any dynamical changes in jet stream dynamics. More flights along jet streams in addition to transverse ones should be executed. Figure 8a shows the results from the NOAA G4-SP GPS dropsondes during the Winter Storms 2004-5-6 missions, illustrating the result that higher H(s) values are generally associated with more organization in the jet stream.
11.4. Translational and Rotational Energies of N2 and O2
The major constituents of the atmosphere do have bands in atmospheric spectra, despite being homonuclear diatomic molecules and therefore having no first order electric dipole moment. Their line shapes could be examined for departures from those expected from an atmosphere having local thermodynamic equilibrium. O2 has a triplet sigma ground state: it is a Hund’s Case (b) molecule [28] and the electron spins are coupled to the rotational axis, causing a magnetic dipole moment. The resulting spectra have been used to sound temperature profiles from the ER-2 [73].
A more demanding experiment would be to directly measure the translational velocities of N2 and O2 in air. Modern molecular beam techniques could be tried, and if successful could settle the issue of possible departures from local thermodynamic equilibrium.
12. Discussion and Conclusions
From Alder [48] to Zwanzig [49], it is clear what the basic principles are for molecular dynamical and nonequilibrium statistical mechanical approaches to the atmospheric state. It is equally clear that there are very substantial difficulties in solving the equations. Nevertheless, their work does point the way for the application of experimental and observational results to the problem, via statistical multifractality. A clear principle is that the generation of organized and disorganized parts of fluid motion are not independent. That implies that the fluctuations are organized in the mechanisms revealed in [48], while the intimately linked generation of an operational temperature is disorganized. Respectively, they are the result of the work conducted by the Gibbs free energy and the dissipation enabled by entropy production, each resulting from the incoming solar beam of UV and visible photons and the outgoing IR flux from the entire planet. The fluctuations are manifested as the emergence of turbulence in observations and the dissipation as an operational temperature accompanied by IR emission to space.
The success of numerical models in weather prediction suggests that the assumption of local thermodynamic equilibrium in the troposphere and stratosphere works, provided the models are fed continually with observations. However, it is also true that small variations in initial conditions can take forecasts into large errors in a time scale of days [74]. The cumulative nonlinear effects of scaling and intermittency on temperature, spectral line shapes, and jet streams could significantly influence model projections of climate.
Tests are proposed to understand two current issues in the atmosphere. One is the extent of effects from photofragment excitation on temperature intermittency, especially in the upper stratosphere where a cold bias in model-based meteorological analyses exists relative to observations. Those effects could extend upwards into the mesosphere [22,75] and also affect the area of the winter polar vortex in the Southern Hemisphere stratosphere, which has been historically problematic in free running models, with the vortex area decreasing rather than increasing with altitude [76]. The other is whether the scaling exponents for temperature and wind speed in the polar front jet stream and its ‘waviness’ show any changes caused by global heating since they were last measured up to three decades ago. The present fleet of research aircraft are capable of making the necessary tests.
Funding
This research received no external funding.
Data Availability Statement
Data used are available on the NASA Airborne Database https://earthdata.nasa.gov/esds/impact/admg/the airborne-inventory (accessed on 5 June 2021).
Acknowledgments
Conflicts of Interest
The author declares no conflict of interest.
Correction Statement
This article has been republished with a minor correction to add the missing equal sign in Equation 8, this changes does not affect the scientific content of the article.
References
- Zare, R.N. Molecular Fluorescence and Photodissociation. Ph.D. Thesis, Harvard University, Cambridge, MA, USA, 1964. [Google Scholar]
- Zare, R.N.; Herschbach, D.R. Atomic and molecular fluorescence excited by photodissociation. Appl. Opt. 1965, 4, 193–200. [Google Scholar] [CrossRef][Green Version]
- Busch, G.E.; Wilson, K.R. Triatomic photofragment spectra 1. Energy partitioning in NO2 photodissociation. J. Chem. Phys. 1972, 56, 3626–3635. [Google Scholar] [CrossRef]
- Tuck, A.F. Molecular beam studies of ethyl nitrite photodissociation. J. Chem. Soc. Farad. Trans. II 1977, 73, 689–708. [Google Scholar] [CrossRef]
- Schinke, R. Photodissociation Dynamics: Spectroscopy and Fragmentation of Small Polyatomic Molecules; Cambridge University Press: Cambridge, UK, 1993. [Google Scholar]
- Barnett, J.J.; Houghton, J.T.; Pyle, J.A. The temperature dependence of the ozone concentration near the stratopause. Q. J. R. Meteorol. Soc. 1975, 101, 245–257. [Google Scholar] [CrossRef]
- Farman, J.C.; Hamilton, R.A. Measurements of Atmospheric Ozone at the Argentine Islands and Halley Bay, 1957–1972; British Antarctic Survey Atmospheric Sciences Division: Edinburgh, UK, 1975. [Google Scholar]
- Tuck, A.F. Numerical model studies of the effect of injected nitrogen oxides on stratospheric ozone. Proc. R. Soc. Lond. A 1977, A355, 267–299. [Google Scholar]
- Groves, K.S.; Mattingly, S.R.; Tuck, A.F. Increased atmospheric carbon dioxide and stratospheric ozone. Nature 1978, 273, 711–715. [Google Scholar] [CrossRef]
- Haigh, J.D.; Pyle, J.A. A two-dimensional calculation including atmospheric carbon dioxide and stratospheric ozone. Nature 1979, 279, 222–224. [Google Scholar] [CrossRef]
- Groves, K.S.; Tuck, A.F. Simultaneous effects of CO2 and chlorofluoromethanes on stratospheric ozone. Nature 1979, 280, 127–129. [Google Scholar] [CrossRef]
- Groves, K.S.; Tuck, A.F. Stratospheric O3—CO2 coupling in a photochemical-radiative column model: With chlorine chemistry. Q. J. R. Meteorol. Soc. 1980, 106, 141–157. [Google Scholar] [CrossRef]
- Haigh, J.D.; Pyle, J.A. Ozone perturbation experiments in a two-dimensional circulation model. Q. J. R. Meteorol. Soc. 1982, 108, 551–574. [Google Scholar] [CrossRef]
- Crutzen, P.J.; Schmailzl, U. Chemical budgets of the stratosphere. Planet. Space Sci. 1983, 31, 1009–1032. [Google Scholar] [CrossRef]
- Froidevaux, L.; Allen, M.; Yung, Y.L. A critical analysis of ClO and O3 in the mid-latitude stratosphere. J. Geophys. Res. 1985, 90, 12999–13029. [Google Scholar] [CrossRef]
- Austin, J.; Pallister, R.C.; Pyle, J.A.; Tuck, A.F.; Zavody, A.M. Photochemical model comparisons with LIMS observations in a stratospheric trajectory coordinate system. Q. J. R. Meteorol. Soc. 1987, 113, 361–392. [Google Scholar] [CrossRef]
- Logan, J.A.; McElroy, M.B. Distribution functions for energetic oxygen atoms in the earth’s lower atmosphere. Planet Space Sci. 1977, 25, 117–122. [Google Scholar] [CrossRef]
- Anderson, J.G. The absolute concentration of O(3P) in the earth’s stratosphere. Geophys. Res. Lett. 1975, 2, 231–234. [Google Scholar] [CrossRef]
- Anderson, J.G. The stratosphere1981: Theory and measurements. In WMO Global Ozone Research and Monitoring Project No.11; World Meteorological Organization: Geneva, Switzerland, 1982; pp. 1–60. [Google Scholar]
- Miller, R.L.; Suits, A.G.; Houston, P.L.; Toumi, R.; Mack, J.A.; Wodtke, A.M. The ozone deficit problem: O2(X, v≥26) + O(3P) from 226 nm ozone photodissociation. Science 1994, 265, 1831–1838. [Google Scholar] [CrossRef]
- Sakazaki, T.; Fujiwara, M.; Mitsuda, C.; Imai, K.; Manag, N.; Naito, Y.; Nakamura, T.; Akiyoshi, H.; Kinnison, D.; Sano, T.; et al. Diurnal ozone variations in the stratosphere revealed in observations from the Superconducting Submillimeter-Wave Limb-Emission Sounder (SMILES) on board the International Space Station (ISS). J. Geophys. Res. 2013, 118, 2991–3006. [Google Scholar] [CrossRef]
- Sauvageat, E.; Klemens, H.; Maillard Barras, E.; Shenyi, H.; Errera, Q.; Haefele, A.; Murk, A. Microwave radiometer observations of the ozone diurnal cycle and its short-term variability over Switzerland. Atmos. Chem. Phys. 2023, 23, 7321–7345. [Google Scholar] [CrossRef]
- Tuck, A.F.; Hovde, S.J.; Richard, E.C.; Gao, R.-S.; Bui, T.P.; Swartz, W.H.; Lloyd, S.A. Molecular velocity distributions and generalized scale invariance in the turbulent atmosphere. Faraday Discuss 2005, 130, 181–193. [Google Scholar] [CrossRef]
- Tuck, A.F. Scaling up: Molecular to meteorological via symmetry breaking and statistical multifractality. Meteorology 2022, 1, 4–28. [Google Scholar] [CrossRef]
- Marlton, G.; Charlton-Perez, A.; Harrison, G.; Polichtchouk, I.; Hauchecorne, A.; Keckhut, P.; Wing, R.; Leblanc, T.; Steinbrecht, W. Using a network of temperature lidars to identify temperature biases in the upper stratosphere in ECMWF reanalyses. Atmos. Chem. Phys. 2021, 21, 6079–6092. [Google Scholar] [CrossRef]
- Thiemens, M.H.; Jackson, T.; Zipf, E.C.; Erdman, P.W.; Van Egmond, C. Carbon dioxide and oxygen isotope anomalies in the mesosphere and stratosphere. Science 1995, 270, 969–972. [Google Scholar] [CrossRef]
- Herzberg, G. Molecular Structure and Molecular Spectra. III. Electronic Spectra and Electronic Structure of Polyatomic Molecules; Van Nostrand: Princeton, NJ, USA, 1967. [Google Scholar]
- Herzberg, G. Molecular Structure and Molecular Spectra. I. Spectra of Diatomic Molecules, 2nd ed.; Van Nostrand: Princeton, NJ, USA, 1950. [Google Scholar]
- Finlayson-Pitts, B.J.; Pitts, J.N., Jr. Chemistry of the Upper and Lower Atmosphere; Academic Press: San Diego, CA, USA, 1999. [Google Scholar]
- Wayne, R.P. The photochemistry of ozone. Atmos. Environ. 1987, 21, 1683–1694. [Google Scholar] [CrossRef]
- Shamsuddin, S.M.; Inagaki, Y.; Matsumi, Y.; Kawasaki, M. O(3Pj) atom formation from photodissociation of ozone in the visible and ultraviolet region. Can. J. Chem. 1994, 72, 637–642. [Google Scholar] [CrossRef]
- Baloitcha, E.; Balint-Kurti, G.G. The theory of the photodissociation of ozone in the Hartley continuum: Effect of vibrational excitation and O(1D) atom velocity distribution. Phys. Chem. Chem. Phys. 2005, 7, 3829–3833. [Google Scholar] [CrossRef]
- Tuck, A.F. Atmospheric Turbulence: A Molecular Dynamics Perspective; Oxford University Press: Oxford, UK, 2008. [Google Scholar]
- Tuck, A.F. Proposed empirical entropy and Gibbs energy based on observations of scale invariance in open nonequilibrium systems. J. Phys. Chem. A 2017, 121, 6620–6629. [Google Scholar] [CrossRef]
- Lovejoy, S.; Schertzer, D. The Weather and Climate: Emergent Laws and Multifractal Cascades; Cambridge University Press: Cambridge, UK, 2013. [Google Scholar]
- Austin, J.; Horowitz, L.W.; Schwarzkopf, M.D.; Wilson, R.J.; Levy II, H. Stratospheric ozone and temperature simulated from the preindustrial era to the present day. J. Clim. 2013, 26, 3528–3543. [Google Scholar] [CrossRef]
- Tuck, A.F.; Browell, E.V.; Danielsen, E.F.; Holton, J.R.; Hoskins, B.J.; Johnson, D.R.; Kley, D.; Krueger, A.J.; Mégie, G.; Newell, R.E.; et al. Stratosphere-Troposphere Exchange, Chapter 5. In Atmospheric Ozone 1985; World Meteorological Organization: Geneva, Switzerland, 1986. [Google Scholar]
- Bamber, D.J.; Healey, P.G.W.; Jones, B.M.R.; Penkett, S.A.; Tuck, A.F.; Vaughan, G. Vertical profiles of tropospheric gases: Chemical consequences of stratospheric intrusions. Atmos. Environ. 1984, 18, 1759–1766. [Google Scholar] [CrossRef]
- Parrish, D.D.; Derwent, R.G.; Steinbrecht, W.; Stübi, R.; Van Malderen, R.; Steinbacher, M.; Trickl, T.; Ries, L.; Xu, X. Zonal similarity of long-term changes and seasonal cycles of baseline ozone at northern midlatitudes. J. Geophys.Res. Atmos. 2020, 125, e2019JD031908. [Google Scholar] [CrossRef]
- Schertzer, D.; Lovejoy, S. Physical modeling and analysis of rain and clouds by multiplicative processes. J. Geophys. Res. Atmos. 1987, 92, 9693–9714. [Google Scholar] [CrossRef]
- Batchelor, G.K.; Townsend, A.A. The nature of turbulent wave motion at large wavenumbers. Proc. R. Soc. Lond. A 1949, 199, 238–255. [Google Scholar]
- Newman, P.A.; Fahey, D.W.; Brune, W.H.; Kurylo, M.J. Preface. J. Geophys. Res. Atmos. 1999, 104, 481–495. [Google Scholar]
- Proffitt, M.H.; Steinkamp, M.J.; Powell, J.A.; McLaughlin, R.J.; Mills, O.A.; Schmeltekopf, A.L.; Thompson, T.L.; Tuck, A.F.; Tyler, T.; Winkler, R.H.; et al. In situ ozone measurements within the 1987 Antarctic ozone hole from a high-altitude ER-2 aircraft. J. Geophys. Res. 1989, 94, 16547–16555. [Google Scholar] [CrossRef]
- Richard, E.C.; Aikin, K.C.; Andrews, A.E.; Daube, B.C., Jr.; Gerbig, C.; Wofsy, S.C.; Romashkin, P.A.; Hurst, D.F.; Ray, E.A.; Moore, F.L.; et al. Severe chemical ozone loss inside the Arctic polar vortex during winter 1999–2000 inferred from in situ airborne measurements. Geophys. Res. Lett. 2001, 28, 2197–2200. [Google Scholar] [CrossRef]
- McElroy, C.T. A spectroradiometer for the measurement of direct and scattered solar irradiance from on-board the NASA ER-2 high-altitude research aircraft. Geophys. Res. Lett. 1995, 22, 1361–1364. [Google Scholar] [CrossRef]
- Chan, K.R.; Scott, S.G.; Bui, T.P.; Bowen, S.W.; Day, J. Temperature and horizontal wind measurements on the ER-2 aircraft during the 1987 Airborne Antarctic Ozone Experiment. J. Geophys. Res. 1989, 94, 11573–11587. [Google Scholar] [CrossRef]
- Newman, P.A.; Harris, N.R.P.; Adriani, A.; Amanatidis, G.T.; Anderson, J.G.; Braathen, G.O.; Brune, W.H.; Carslaw, K.C.; Craig, M.S.; DeCola, P.L.; et al. An overview of the SOLVE/THESEO 2000 campaign. J. Geophys. Res. Atmos. 2002, 107, 8259. [Google Scholar] [CrossRef]
- Alder, B.J.; Wainwright, T.E. Decay of the velocity autocorrelation function. Phys. Rev. A 1970, 1, 18–21. [Google Scholar] [CrossRef]
- Zwanzig, R. Nonequilibrium Statistical Mechanics; Oxford University Press: New York, NY, USA, 2001. [Google Scholar]
- Stutz, J.; Ravishankara, A.R.; Tuck, A.F.; Evans, M.J.; Herrmann, H.; Chipperfield, M.P.; Pyle, J.A.; Zellner, R.; Roscoe, H.; Shallcross, D.E.; et al. General Discussion. Faraday Discuss. 2005, 130, 125–151. [Google Scholar]
- Kadau, K.; Barber, J.L.; Germann, T.C.; Holian, B.L.; Alder, B.J. Atomistic methods in fluid simulation. Philos. Trans. R. Soc. A 2012, 368, 1547–1560. [Google Scholar] [CrossRef]
- Yeung, L.Y.; Murray, L.T.; Ash, J.L.; Young, E.D.; Boering, K.A.; Atlas, E.L.; Schauffler, S.M.; Lueb, R.A.; Langenfelds, R.L.; Krummel, P.B.; et al. Isotopic ordering in atmospheric O2 as a tracer of ozone photochemistry and the tropical atmosphere. J. Geophys. Res. D 2016, 121, 12541–12559. [Google Scholar] [CrossRef]
- Gao, Y.Q.; Marcus, R.A. Strange and unconventional isotope effects in ozone formation. Science 2001, 293, 259–263. [Google Scholar] [CrossRef] [PubMed]
- Liang, M.-C.; Chen, Y.-C.; Gao, Y.-Q.; Zhang, X.; Yung, Y.L. Atmospheric effects on the isotopic composition of ozone. Atmos. 2021, 12, 1673. [Google Scholar] [CrossRef]
- Chapman, S.; Cowling, T.G. The Mathematical Theory of Non-Uniform Gases, 3rd ed.; Cambridge University Press: Cambridge, UK, 1970; pp. 93–96+327. [Google Scholar]
- Tuck, A.F. Theoretical chemistry and the calculation of the atmospheric state. Atmosphere 2021, 12, 727. [Google Scholar] [CrossRef]
- Tuck, A.F.; Hovde, S.J.; Gao, R.-S.; Richard, E.C. Law of mass action in the Arctic lower stratospheric polar vortex: ClO scaling and the calculation of ozone loss rates in a turbulent fractal medium. J. Geophys. Res. D 2003, 108, 4451. [Google Scholar] [CrossRef]
- Varotsos, C.A.; Lovejoy, S.; Sarlis, N.V.; Tzanis, C.G.; Efstathiou, M.V. On the scaling of the solar incident flux. Atmos. Chem. Phys. 2015, 15, 7301–7306. [Google Scholar] [CrossRef]
- Townes, C.H.; Schawlow, A.L. Microwave Spectroscopy; McGraw Hill: New York, NY, USA, 2013; Chapter 13. [Google Scholar]
- Goody, R.M.; Yung, Y.L. Atmospheric Radiation: Theoretical Basis, 2nd ed.; Oxford University Press: New York, NY, USA, 1989; Chapter 5; ISBN 0-19-505134-3. [Google Scholar]
- Hovde, S.J.; Tuck, A.F.; Lovejoy, S.; Schertzer, D. Vertical scaling of temperature, wind and humidity fluctuations: Dropsondes from 13 km to the surface of the Pacific Ocean. Int. J. Remote Sens. 2011, 32, 5891–5918. [Google Scholar] [CrossRef]
- Tuck, A.F. Turbulence: Vertical shear of the horizontal wind, jet streams, symmetry breaking, scale invariance and Gibbs free energy. Atmosphere 2021, 12, 1414. [Google Scholar] [CrossRef]
- Tuck, A.F. Synoptic and chemical evolution of the Antarctic vortex in late winter and early spring, 1987. J. Geophys. Res. Atmos. 1989, 94, 11687–11737. [Google Scholar] [CrossRef]
- Tuck, A.F.; Davies, T.; Hovde, S.J.; Noguer-Alba, M.; Fahey, D.W.; Kawa, S.R.; Kelly, K.K.; Murphy, D.M.; Proffitt, M.H.; Margitan, J.J.; et al. Polar stratospheric cloud processed air and potential vorticity in the Northern Hemisphere lower stratosphere at mid-latitudes during winter. J. Geophys. Res. Atmos. 1992, 97, 7883–7904. [Google Scholar] [CrossRef]
- Tuck, A.F.; Hovde, S.J.; Kelly, K.K.; Mahoney, M.J.; Proffitt, M.H.; Richard, E.C.; Thompson, T.L. Exchange between the upper tropical troposphere and lower stratosphere studied with aircraft observations. J. Geophys. Res. Atmos. 2003, 108, 4734. [Google Scholar] [CrossRef]
- O’Neill, A.; Oatley, C.L.; Charlton-Perez, A.J.; Mitchell, D.M.; Jung, T. Vortex splitting on a planetary scale in the stratosphere by cyclogenesis on a subplanetary scale in the troposphere. Q. J. R. Meteorol. Soc. 2017, 143, 691–705. [Google Scholar] [CrossRef]
- Tuck, A.F.; Hovde, S.J.; Bui, T.P. Scale invariance in jet streams: ER-2 data around the lower-stratospheric polar night vortex. Q. J. R. Meteorol. Soc. 2004, 130, 2423–2444. [Google Scholar] [CrossRef]
- Francis, J.A.; Vavrus, S.J. Evidence for a wavier jet stream in response to rapid Arctic warming. Environ. Res. Lett. 2015, 10, 014005. [Google Scholar] [CrossRef]
- Overland, J.E.; Ballinger, T.E.; Cohen, J.; Francis, J.A.; Hanna, E.; Jaiser, R.; Kim, B.-M.; Kim, S.-J.; Ukita, J.; Vihma, T.; et al. How do intermittency and simultaneous processes obfuscate the Arctic influence on midlatitude extreme weather events? Environ. Res. Lett. 2021, 16, 043002. [Google Scholar] [CrossRef]
- Steudel, M.; Francis, J.; White, R.; Williams, P.D.; Woollings, T. The Jet Stream and Climate Change. In Climate Change 2021, 3rd ed.; Elsevier: Amsterdam, The Netherlands, 2021; Chapter 15. [Google Scholar]
- NOAA SABRE Mission. Available online: https://csl.noaa.gov/projects/sabre/wb57/payload.html (accessed on 1 July 2023).
- Vaughan, G.; Tuck, A.F. Aircraft measurements near jet streams. In Atmospheric Ozone; D. Reidel Publishing Company: Dordrecht, The Netherlands, 1985; pp. 572–579. [Google Scholar]
- Gary, B.L. Observational results using the Microwave Temperature Profiler during the Airborne Antarctic Ozone Experiment. J. Geophys. Res. Atmos. 1989, 94, 11223–11231. [Google Scholar] [CrossRef]
- Palmer, T.; Williams, P. Preface. In Stochastic Physics and Climate Modelling; xi–xv; Cambridge University Press: Cambridge, UK, 2010. [Google Scholar][Green Version]
- Vaughan, G. Diurnal variation of mesospheric ozone. Nature 1982, 296, 133–135. [Google Scholar] [CrossRef]
- IPCC. Climate Change: The Scientific Basis. In Third Assessment Report; Cambridge University Press: Cambridge, UK, 2001; Chapter 8. [Google Scholar]
Disclaimer/Publisher’s Note: The statements, opinions and data contained in all publications are solely those of the individual author(s) and contributor(s) and not of MDPI and/or the editor(s). MDPI and/or the editor(s) disclaim responsibility for any injury to people or property resulting from any ideas, methods, instructions or products referred to in the content. |
© 2023 by the author. Licensee MDPI, Basel, Switzerland. This article is an open access article distributed under the terms and conditions of the Creative Commons Attribution (CC BY) license (https://creativecommons.org/licenses/by/4.0/).