1. Introduction
Ruminants contribute to anthropogenic greenhouse gas emissions, including methane (CH
4), which originates from enteric or, to a lesser extent, manure fermentation, with concerns over CH
4 emissions from the latter source growing over the past few years [
1,
2]. Alterations in ruminant diets aimed at mitigating enteric CH
4 emissions prompt shifts in nutrient digestibility, ultimately resulting in the modification of manure chemical composition. This, in turn, precipitates a change in manure CH
4 emissions [
3,
4].
Of the nutritional strategies used to reduce CH
4 emissions, lipid supplementation is a well-known method examined in many studies. Beauchemin et al. [
5] indicated that lipid supplementation in ruminant diets could potentially result in a reduction in daily CH
4 emissions by 1 to 5% for each 1% increase in dietary lipid supplementation. Such a change in CH
4 emission not only depends on the source of lipids or the profile of fatty acids included in the diet [
6] but also may be influenced by the feed composition or even by the forage-to-concentrate (FC) ratio.
In Finland, cattle produce 9.75 million tons of manure annually, which is equal to approximately 75% of all manure produced in the country’s livestock sector [
7]. Manure management creates emissions of 0.7 million tons of CO
2 equivalent in 2021, equal to 12% of agricultural greenhouse gas emissions [
8]. A cattle slurry-based system is the dominant method of manure management (40%), followed by solid storage (11%), and pasture (7%) [
8]. Manure emissions have increased by 19% in 2021 compared with 1990 due to an increase in the number of animals kept in slurry-based systems.
Cattle manure is widely employed for the start-up of agricultural biogas plants or as a co-substrate in the anaerobic digestion of lignocellulosic feedstock [
9], where gas production is assessed through biochemical methane potential (BMP) assays. The theoretical biogas yields from carbohydrates, proteins, and fats are 790–800, 700, and 1200–1250 m
3/t total solids, with theoretical CH
4 amounts of 50%, 70–71%, and 67–68%, respectively [
10]. Although ruminal microbiota are efficient plant fiber digesters, the prokaryotes found in manure may function differently. Understanding the complex interactions between diet, manure prokaryotes, and CH
4 production in systems fed with manure holds enormous promise for the biogas industry. The composition of the microbial community in an anaerobic digester is dependent on the inoculum, operational conditions, and feedstock. Although inoculum plays an important role, it has been suggested that the inoculum’s effect could fade in continuous long-term digestion as the operational conditions and feedstocks would modulate the microbial consortium; in cases where the organic loading rate was low, there was a small effect of the feedstock on the reactor populations [
11]. Genera such as
Clostridium sensu stricto,
Romboutsia, and
Turicibacter play crucial roles, as they can degrade a wide range of lignocellulosic biomasses; they are commonly found in animal manure [
12] and have been reported to be producers of volatile fatty acids (VFA) and H
2 [
13]. Methanogenic Archaea convert all the carbon present in the biomass into CH
4 and CO
2, and in cattle manure,
Methanosarcina stands out [
14]. The environmental conditions of feces, manure storage, and anaerobic digesters naturally differ, which will dictate which microorganisms are more abundant in each situation.
Studies on the simultaneous evaluation of enteric and manure CH
4 emissions, especially under different dietary conditions, are limited. Some experiments on dairy cows have shown that adding lauric acid [
15] or rapeseed [
3] to grass silage and corn silage-based diets reduces enteric CH
4 emissions with compensatory increases in manure CH
4 emissions. Hindrichsen et al. [
16] demonstrated a 5 to 22% variation in manure CH
4 as a proportion of total CH
4 emissions in cows fed diets with contrasting compositions (lignified fiber, sugar, or starch). In addition, in a meta-analysis by Huhtanen et al. [
4], mitigation of enteric CH
4 was associated with increased manure emissions, measured through BMP assays. It should be noted that these manure emissions were measured using BMP assays; however, those conditions may differ from practical farming scenarios, where manure storage conditions are often subject to fluctuations and may not align with the ideal conditions established in BMP assays (pH, temperature, and inoculum). Hence, while a single nutritional strategy or the synergy of two strategies could effectively reduce enteric CH
4 emissions, additional investigation is warranted to unveil their influence on manure CH
4 emissions and their possible trade-offs under diverse storage conditions—underscoring the novel dimension of this study.
We hypothesized that mitigation of CH4 emissions by dietary interventions known to reduce enteric CH4 emissions would not cause an increase in manure CH4 emissions when measured under conditions similar to manure storage conditions, whereas it might increase CH4 production in anaerobic digesters. Therefore, the present study aimed to examine the effects of FC ratio with or without rapeseed oil supplementation on enteric and manure CH4 emissions when measured under normal manure storage conditions (hereafter called static conditions) or used as substrate in an anaerobic digester. By elucidating these processes, we aim to shed light on diverse strategies to reduce the environmental impact of the dairy sector by capitalizing on the potential benefits that arise from harnessing the synergy between oil-rich substrates and anaerobic digestion in the context of cow manure.
2. Materials and Methods
Animal experimentation was conducted with regional State Administrative Agency approval (ESAVI/24435/2018, Hämeenlinna, Finland) in accordance with the guidelines established by the European Community Council Directive 2010/63/EU (EU 2010) and complied with the ARRIVE guidelines [
17].
2.1. Animals, Experimental Design, and Treatments
A 4 × 4 Latin square design with a 2 × 2 factorial arrangement of treatments was applied to 4 multiparous Nordic Red dairy cows in mid-lactation (mean ± standard deviation, 101 ± 16 days in milk), producing 38.8 ± 1.9 kg milk/d with 21 d experimental periods. Sample size analysis was performed based on the assumption of achieving a 20% reduction in daily CH
4 production as grams per day when the power (1 − β) of the study is 0.80 and α is 0.05 in a one-sided test, which resulted in 4 replicates. The cows were selected based on their similarities in parity, dry matter (DM) intake, milk yield, and body weight. The diets were randomly allocated to the cows in the first period, and thereafter, every diet was provided to the next cow in the next period. Each period consisted of dietary adaptation for 14 days and 7 days of sampling. Treatments comprised total mixed rations (TMR) based on grass silage containing either a high (65:35) or low (35:65) forage-to-concentrate (FC) ratio supplemented with 0 (HF and LF, respectively) or 5% rapeseed oil (RO) in diet DM (HFO and LFO, respectively; for details, refer to Razzaghi et al. [
18]). In addition, the cows received 2 × 300 g of concentrate daily from the milking parlor. To ensure ad libitum feed intake, at least 5% of refusals were targeted daily based on the previous day’s feed intake for every cow, and the diets were fed in 4 equal amounts at 0600, 0900, 1600, and 1900 h. Rapeseed oil (Avena Kantvik Ltd., Kirkkonummi, Finland) was stored at 4 °C until incorporated into the low or high FC ratio TMR, and the RO replaced concentrate pellets. The forage was restrictively fermented grass silage prepared from the primary growth of mixed timothy (
Phleum pratense) and meadow fescue (
Festuca pratensis) swards grown at Jokioinen (60°49′ N, 23°28′ E) treated with a formic-acid-based ensiling additive (5 L/tone, AIV 2 Plus, Valio Ltd., Helsinki, Finland). The cows were kept as a group in free stalls during the adaptation period and in respiratory chambers during the sampling period, with free access to water and salt blocks. The cows were milked in a 2 × 6 auto tandem milking parlor during the adaptation period and in situ in the chambers during the sampling period at 0700 and 1645 h.
2.2. Measurements and Chemical Analysis
To maintain the predetermined FC ratio and to formulate the experimental diets accurately, the DM content of grass silage was analyzed twice a week during the experiment at 105 °C for 20 h in a forced-air oven. Daily feed intake was measured by subtracting the refusals (measured daily at 1200 h before offering fresh feed) from the offered feed throughout the study, but intakes during d 17 to 21 of each experimental period were used for statistical analysis. Representative samples of silage and supplemental concentrates collected during the sample collection period were used for chemical analysis. The samples were pooled within each period before chemical analysis. Fresh silage samples were prepared for measurement of pH and analysis of VFA, lactic acid, formic acid, ethanol, water-soluble carbohydrate, soluble N, and ammonia N concentrations as described by Ahvenjärvi et al. [
19]. In addition, the method proposed by Huida et al. [
20] was used to correct silage DM content for the loss of volatiles. Concentrate pellets and leftovers were dried in a forced-air oven at 55 °C for 48 h, ground through a 1 mm screen (Sakomylly KT-120, Koneteollisuus Oy, Klaukkala, Finland), and analyzed for DM, neutral detergent fiber (NDF), ash, ether extract (EE), and crude protein (CP) as described in detail by Ahvenjärvi et al. [
19]. Indigestible neutral detergent fiber (iNDF) of silage, concentrates, and feces was determined by 12 d of ruminal incubation using nylon bags (60 × 120 mm, pore size 0.017 mm) followed by NDF analysis. Chemical analysis of silage, concentrates, and oils, plus their proportion in each diet, was used to calculate the chemical composition of each experimental TMR. Bomb calorimetry (1108 Oxygen bomb, Parr Instrument Co., Moline, IL, USA) was used to determine the gross energy (GE) of silage, concentrates, oil supplements, and excreta with benzoic acid (CAS 65-85-0, cat. no. 3415, Parr Instrument Co.) as the standard.
Milk yield was recorded throughout the experiment, but only measurements made between d 17 and 21 were used for statistical analysis. Milk samples were taken for 3 consecutive days (d 17, 18, and 19) in each experimental period during morning and evening milking, preserved with bronopol tablets (Valio Ltd., Finland), and stored at 4 °C until infrared analysis for fat, CP, lactose, urea, and somatic cells (MilkoScan FT+, Foss Electric, Hillerød, Denmark). Milk composition was calculated as the geometric average of morning and evening milk yields.
Total fecal and urine samples were collected from the cows for 3 consecutive days, starting on d 18 at 1000 h. The quantity of feces was weighed and sampled for in vitro tests (about 1 L), and a subsample (5% wt/wt) was taken for chemical and microbial composition analysis. The samples were stored at −20 °C, and at the end of the experiment, they were thawed (1–2 d at room temperature) and mixed thoroughly, and a subsample was obtained for every animal per period for chemical analysis. Feces were dried at 60 °C, and the sample was ground through a 1 mm sieve, and DM, ash, N, NDF, EE (after hydrolysis with 3 M HCl), and GE were determined as described earlier for feed samples. The urine was separated from the feces using a lightweight harness and flexible tubing attached to the vulva.
Rumen liquid (500 mL) samples for rumen fermentation and microbial community analysis were collected on d 21 of each experimental period, at 1000 h after respiratory chamber measurements, by stomach tubing using a Ruminator device (Profs Products, Wittibreut, Germany). Rumen pH was measured immediately after collection using a portable pH meter (pH110, VWR International, Radnor, PA, USA). Rumen sample processing for VFA and ammonia analyses was performed as described by Bayat et al. [
21]. For bacterial community analysis, rumen liquid samples were immediately aliquoted into 2 mL tubes, snap-frozen in dry ice, and stored at −80 °C until DNA extraction.
Four open-circuit respiratory chambers (21.5 m
3) were used to measure the gas exchanges (oxygen, carbon dioxide, methane, and hydrogen) of the cows individually over 4 d (d 17 to 21), with the first day serving as acclimatization. The measuring system is described in detail elsewhere [
21], but briefly, concentrations of the gases in the inlet and exhaust airflow were measured using a computer-controlled system using dedicated analyzers (Oxymax, Columbus Instruments, Columbus, OH, USA). Air outflow for each chamber was measured with an HFM-200 mass flow meter with a laminar flow element capable of measuring up to 3000 L/min (Teledyne Hastings Instruments, Hampton, VA, USA). Absolute gas exchanges were calculated by multiplying air flow and gas concentration differences.
2.3. Anaerobic Incubation of Manure
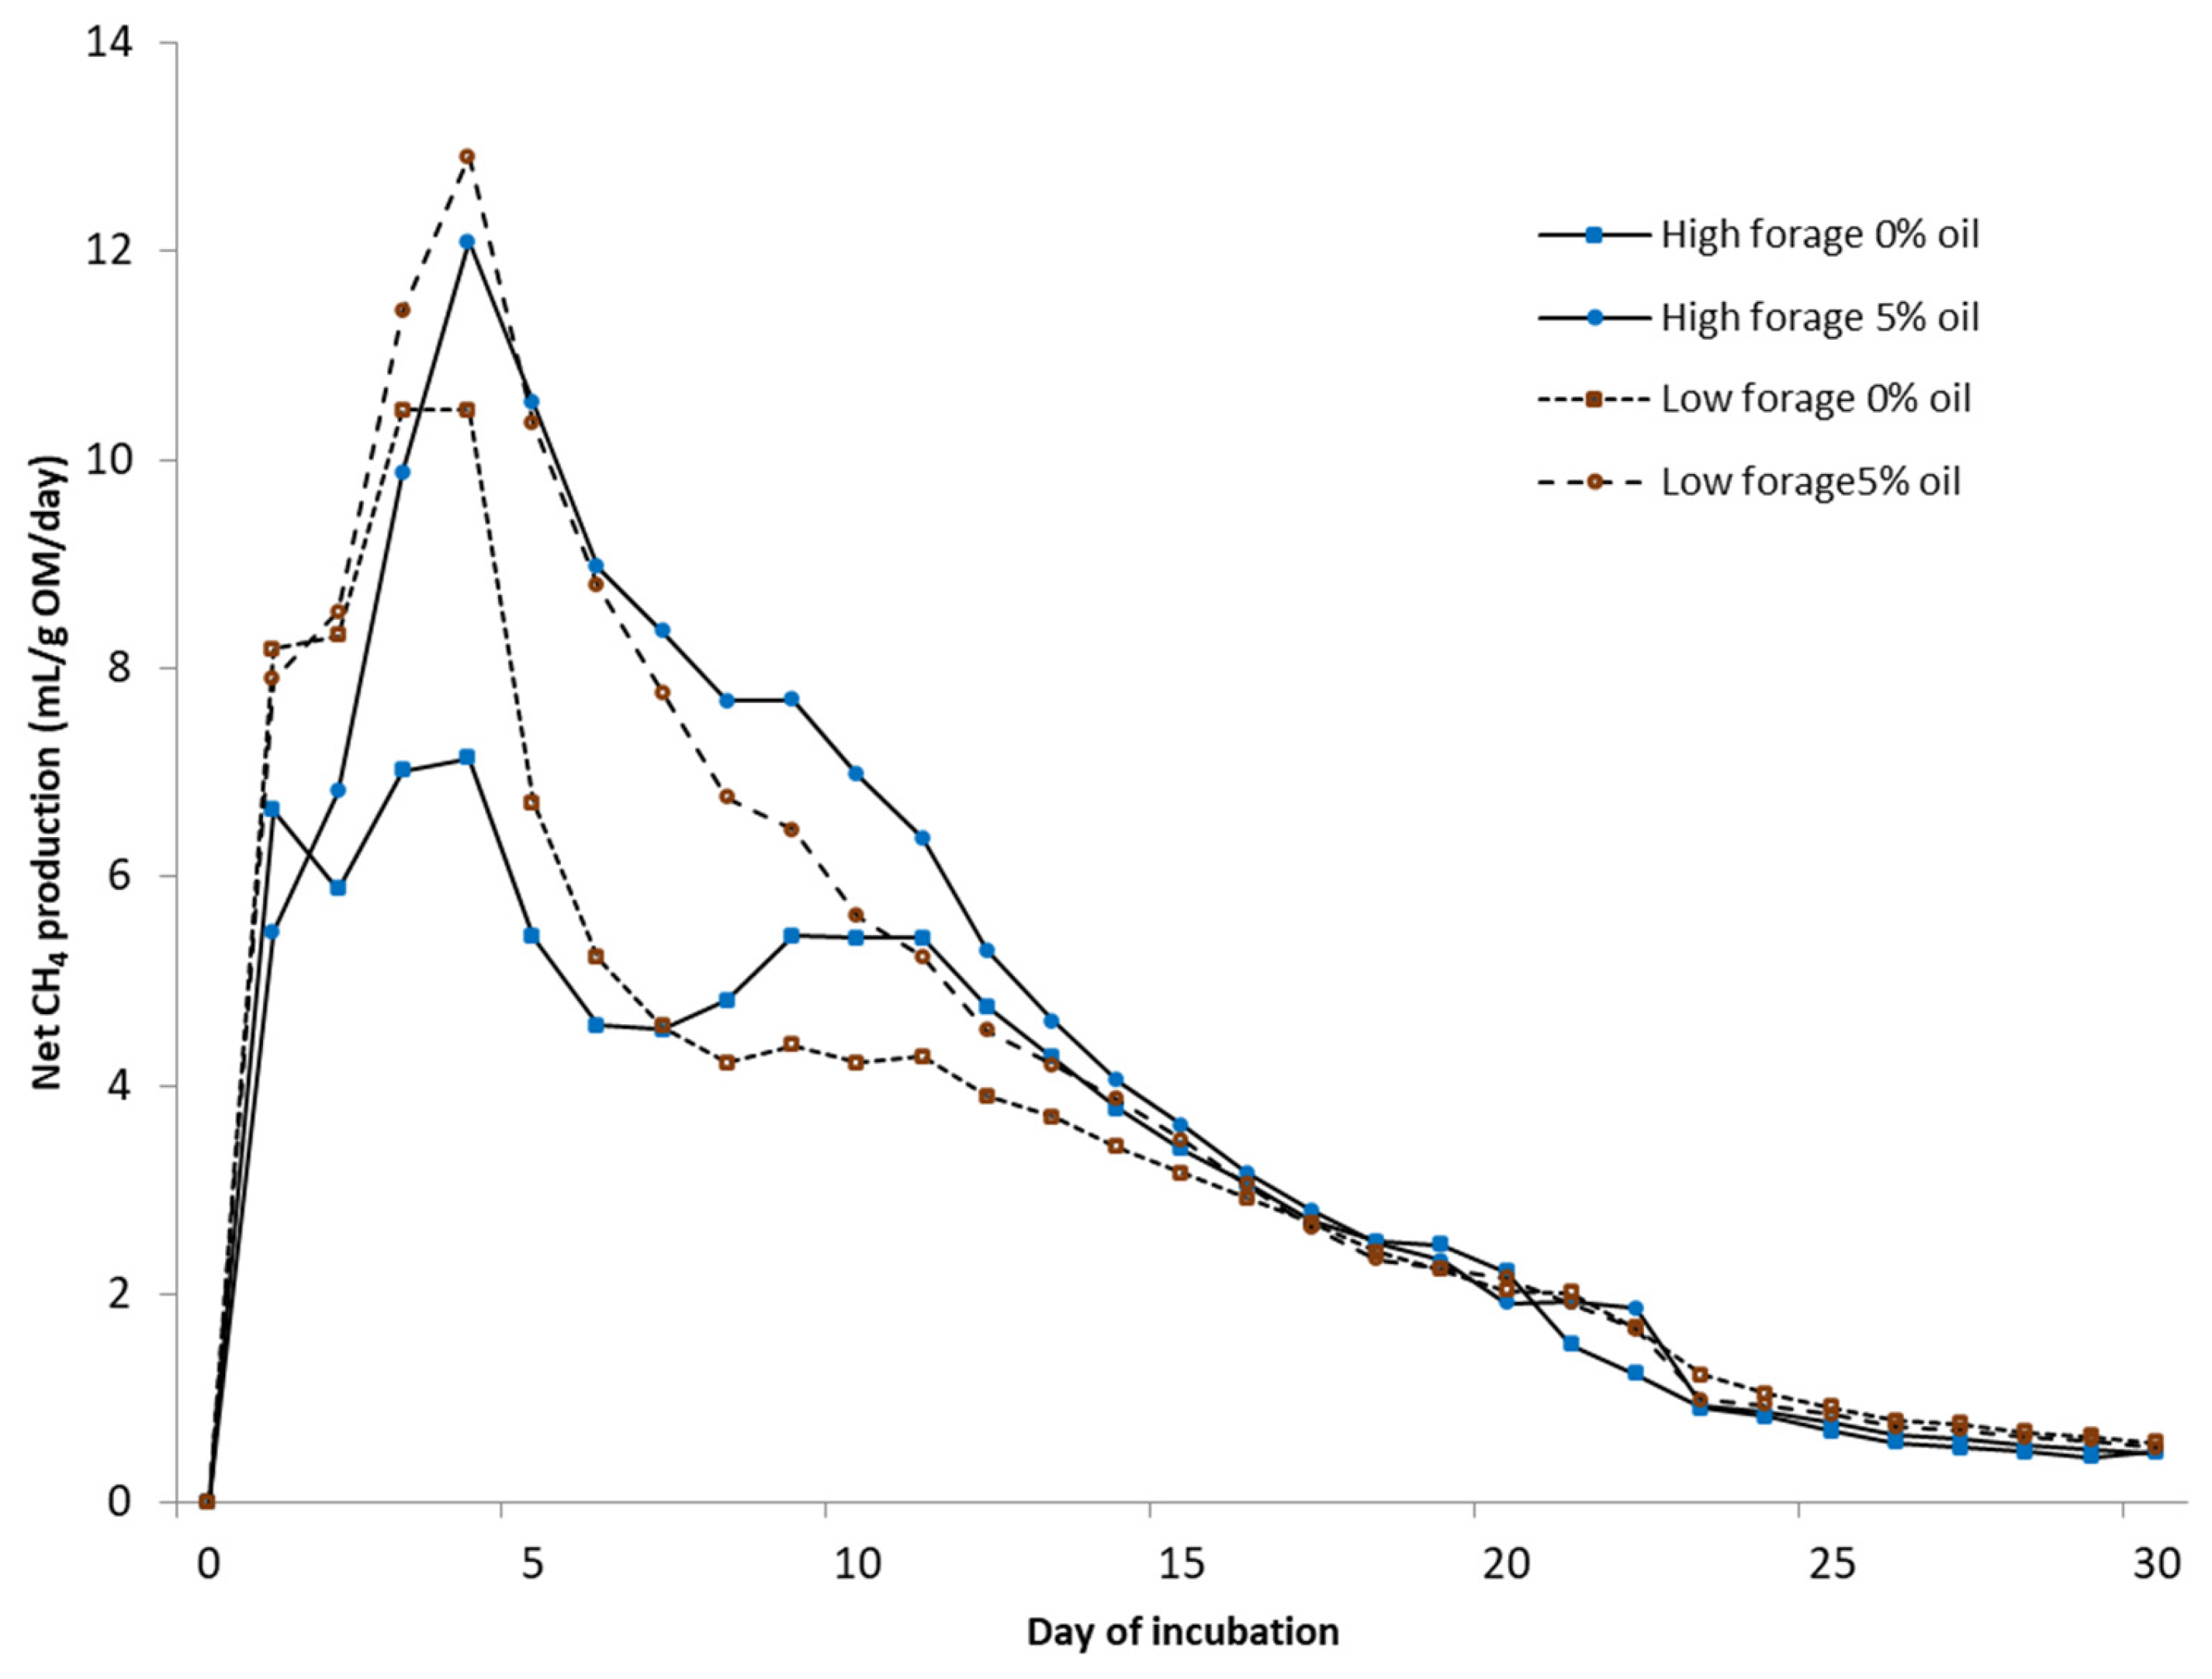
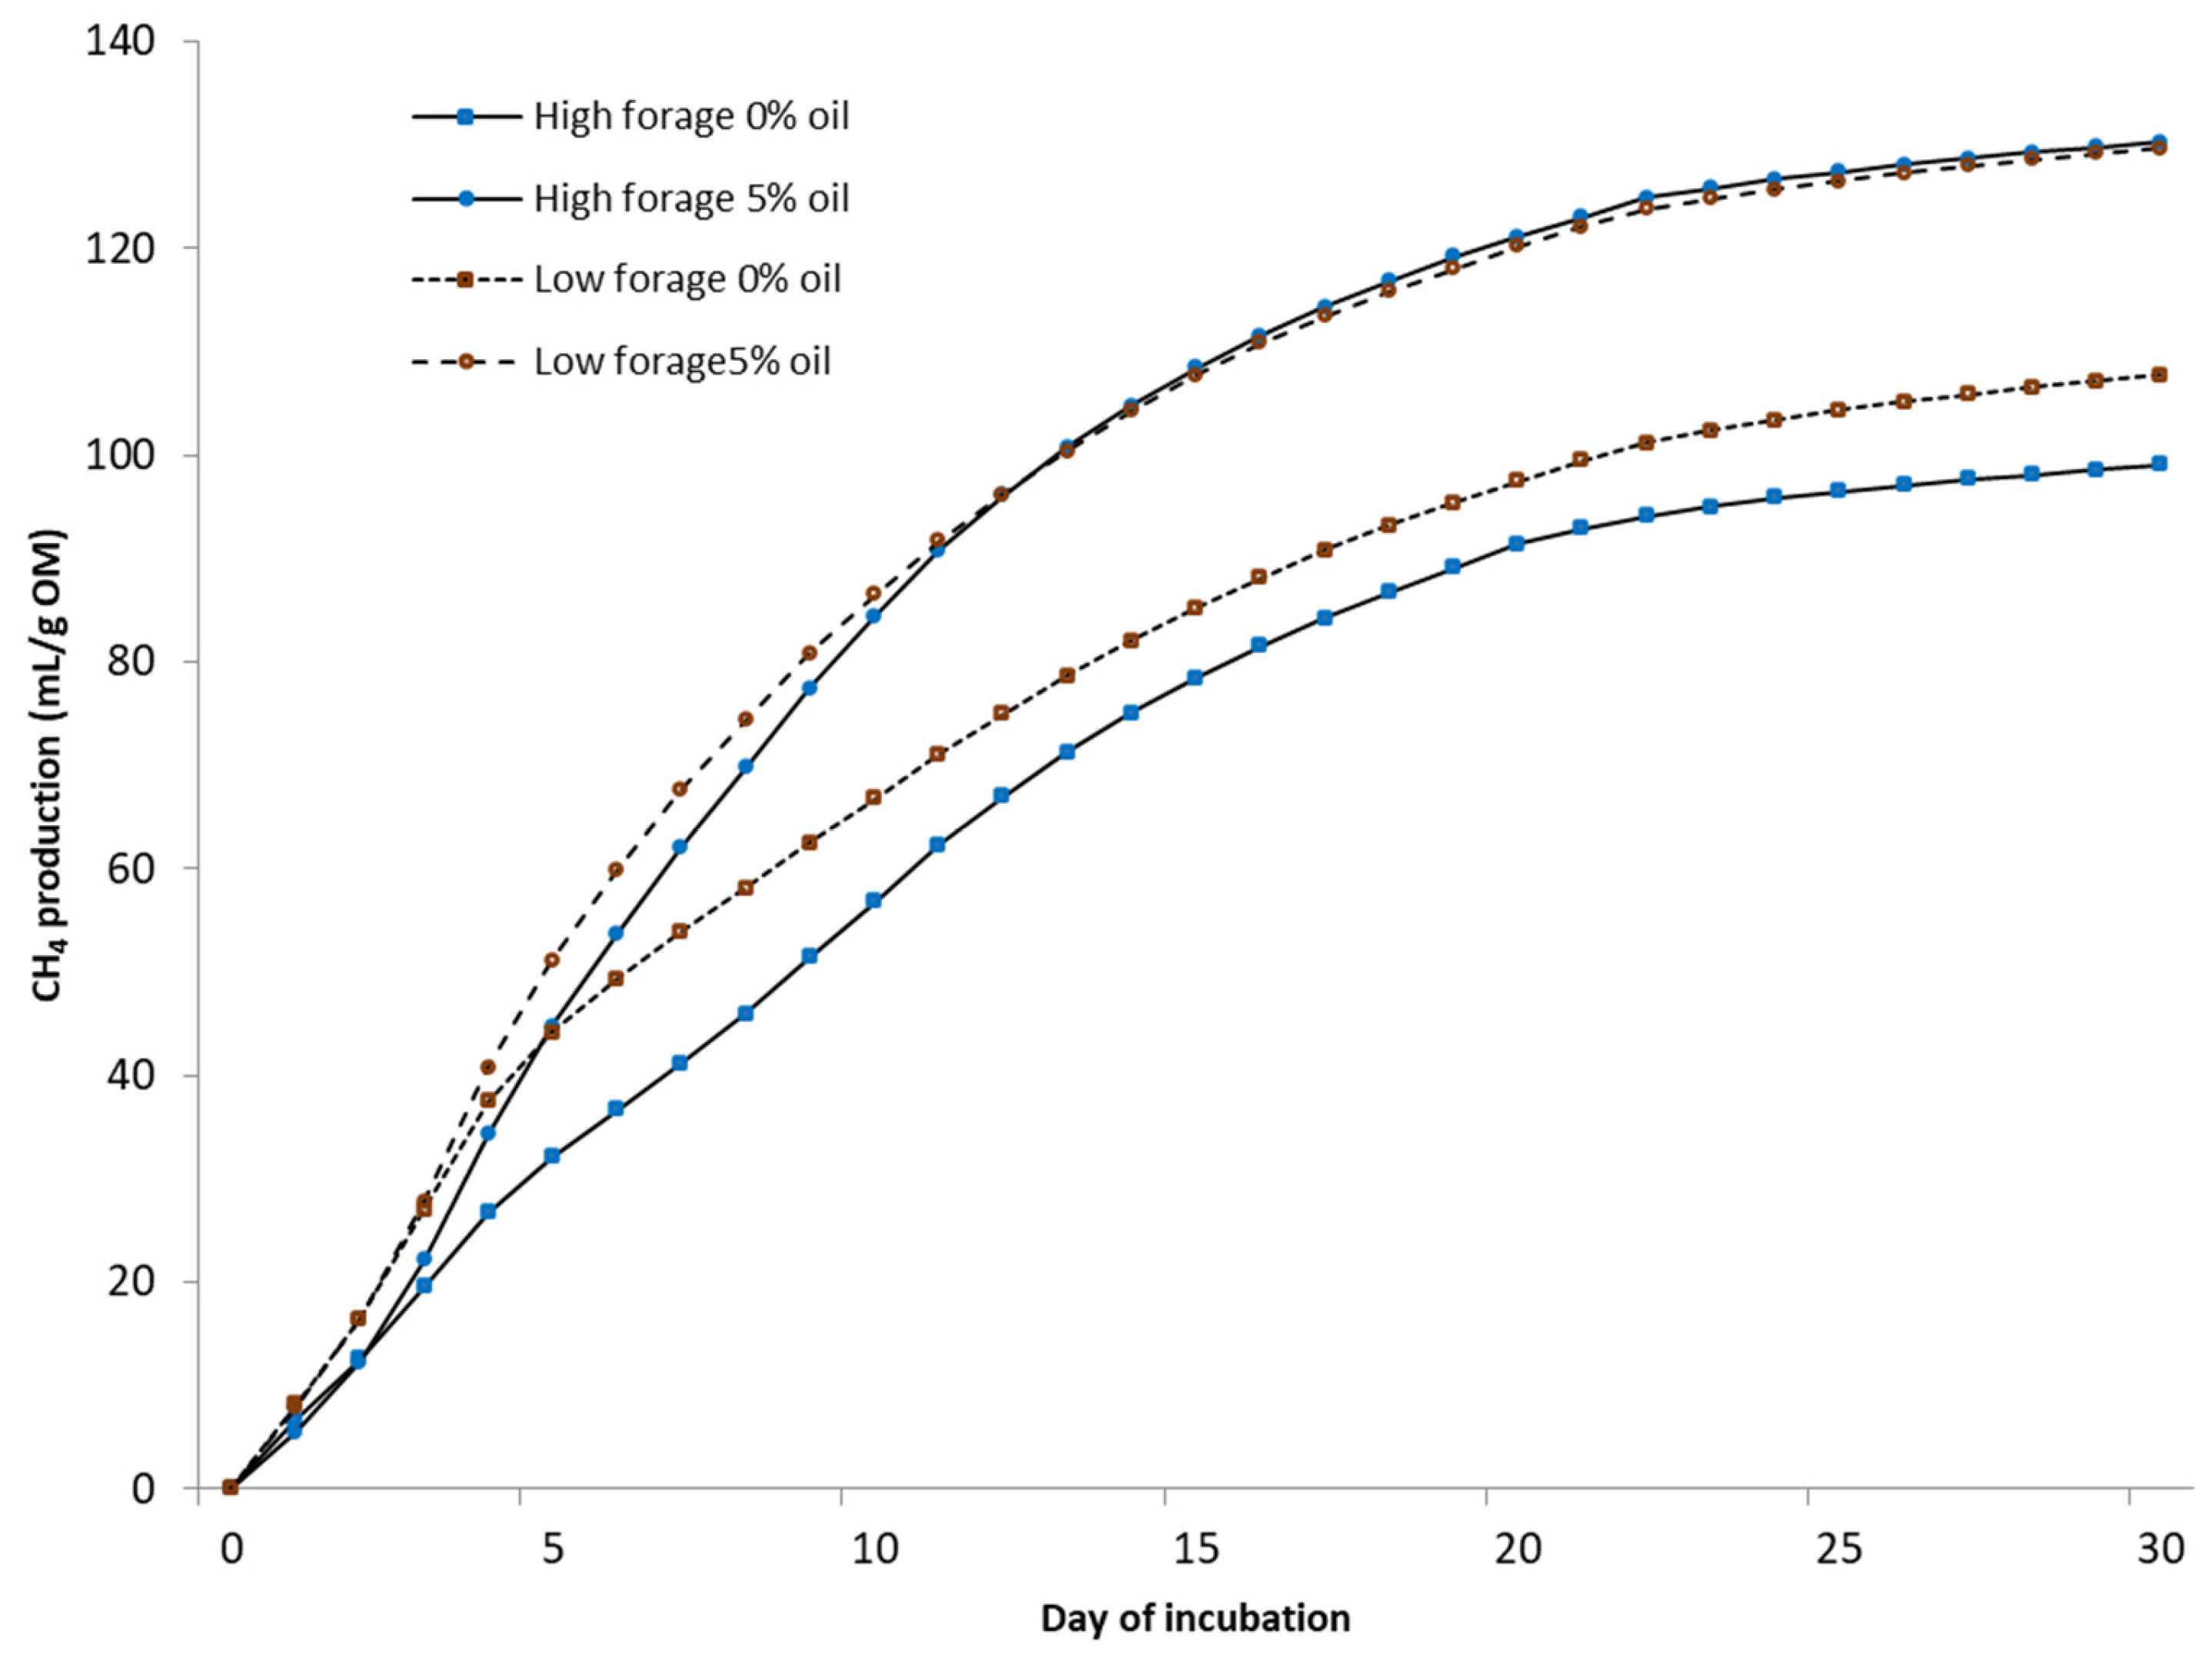
Biochemical CH
4 potential (BMP) was measured under mesophilic (37 °C) conditions using automated testing equipment (Bioprocess Control Ltd., Lund, Sweden) over 30 days. The bottles were mechanically mixed (84 rpm) for 1 min/h. Tests were conducted in 500 mL bottles with a 400 mL liquid volume in duplicate test bottles. Deionized water was added to achieve uniform gas space in every bottle. A sample-to-inoculum-organic-matter (OM) ratio of 1:1 was used. The inoculum was obtained from a farm-scale biogas plant treating cattle slurry (Luke Maaninka, Kuopio, Finland). All bottles were buffered with NaHCO
3 (3 g/L) and flushed with N
2 to obtain anaerobic conditions. The volume of the produced gas was determined via water displacement. The gas was collected in gas bags and analyzed for CH
4 and CO
2 from five to seven times during the experiment using a gas chromatograph (Perkin Elmer Arnel Clarus 500) [
22]. The daily CH
4 content between analyses was estimated by dividing the change in CH
4 content between the measurement days.
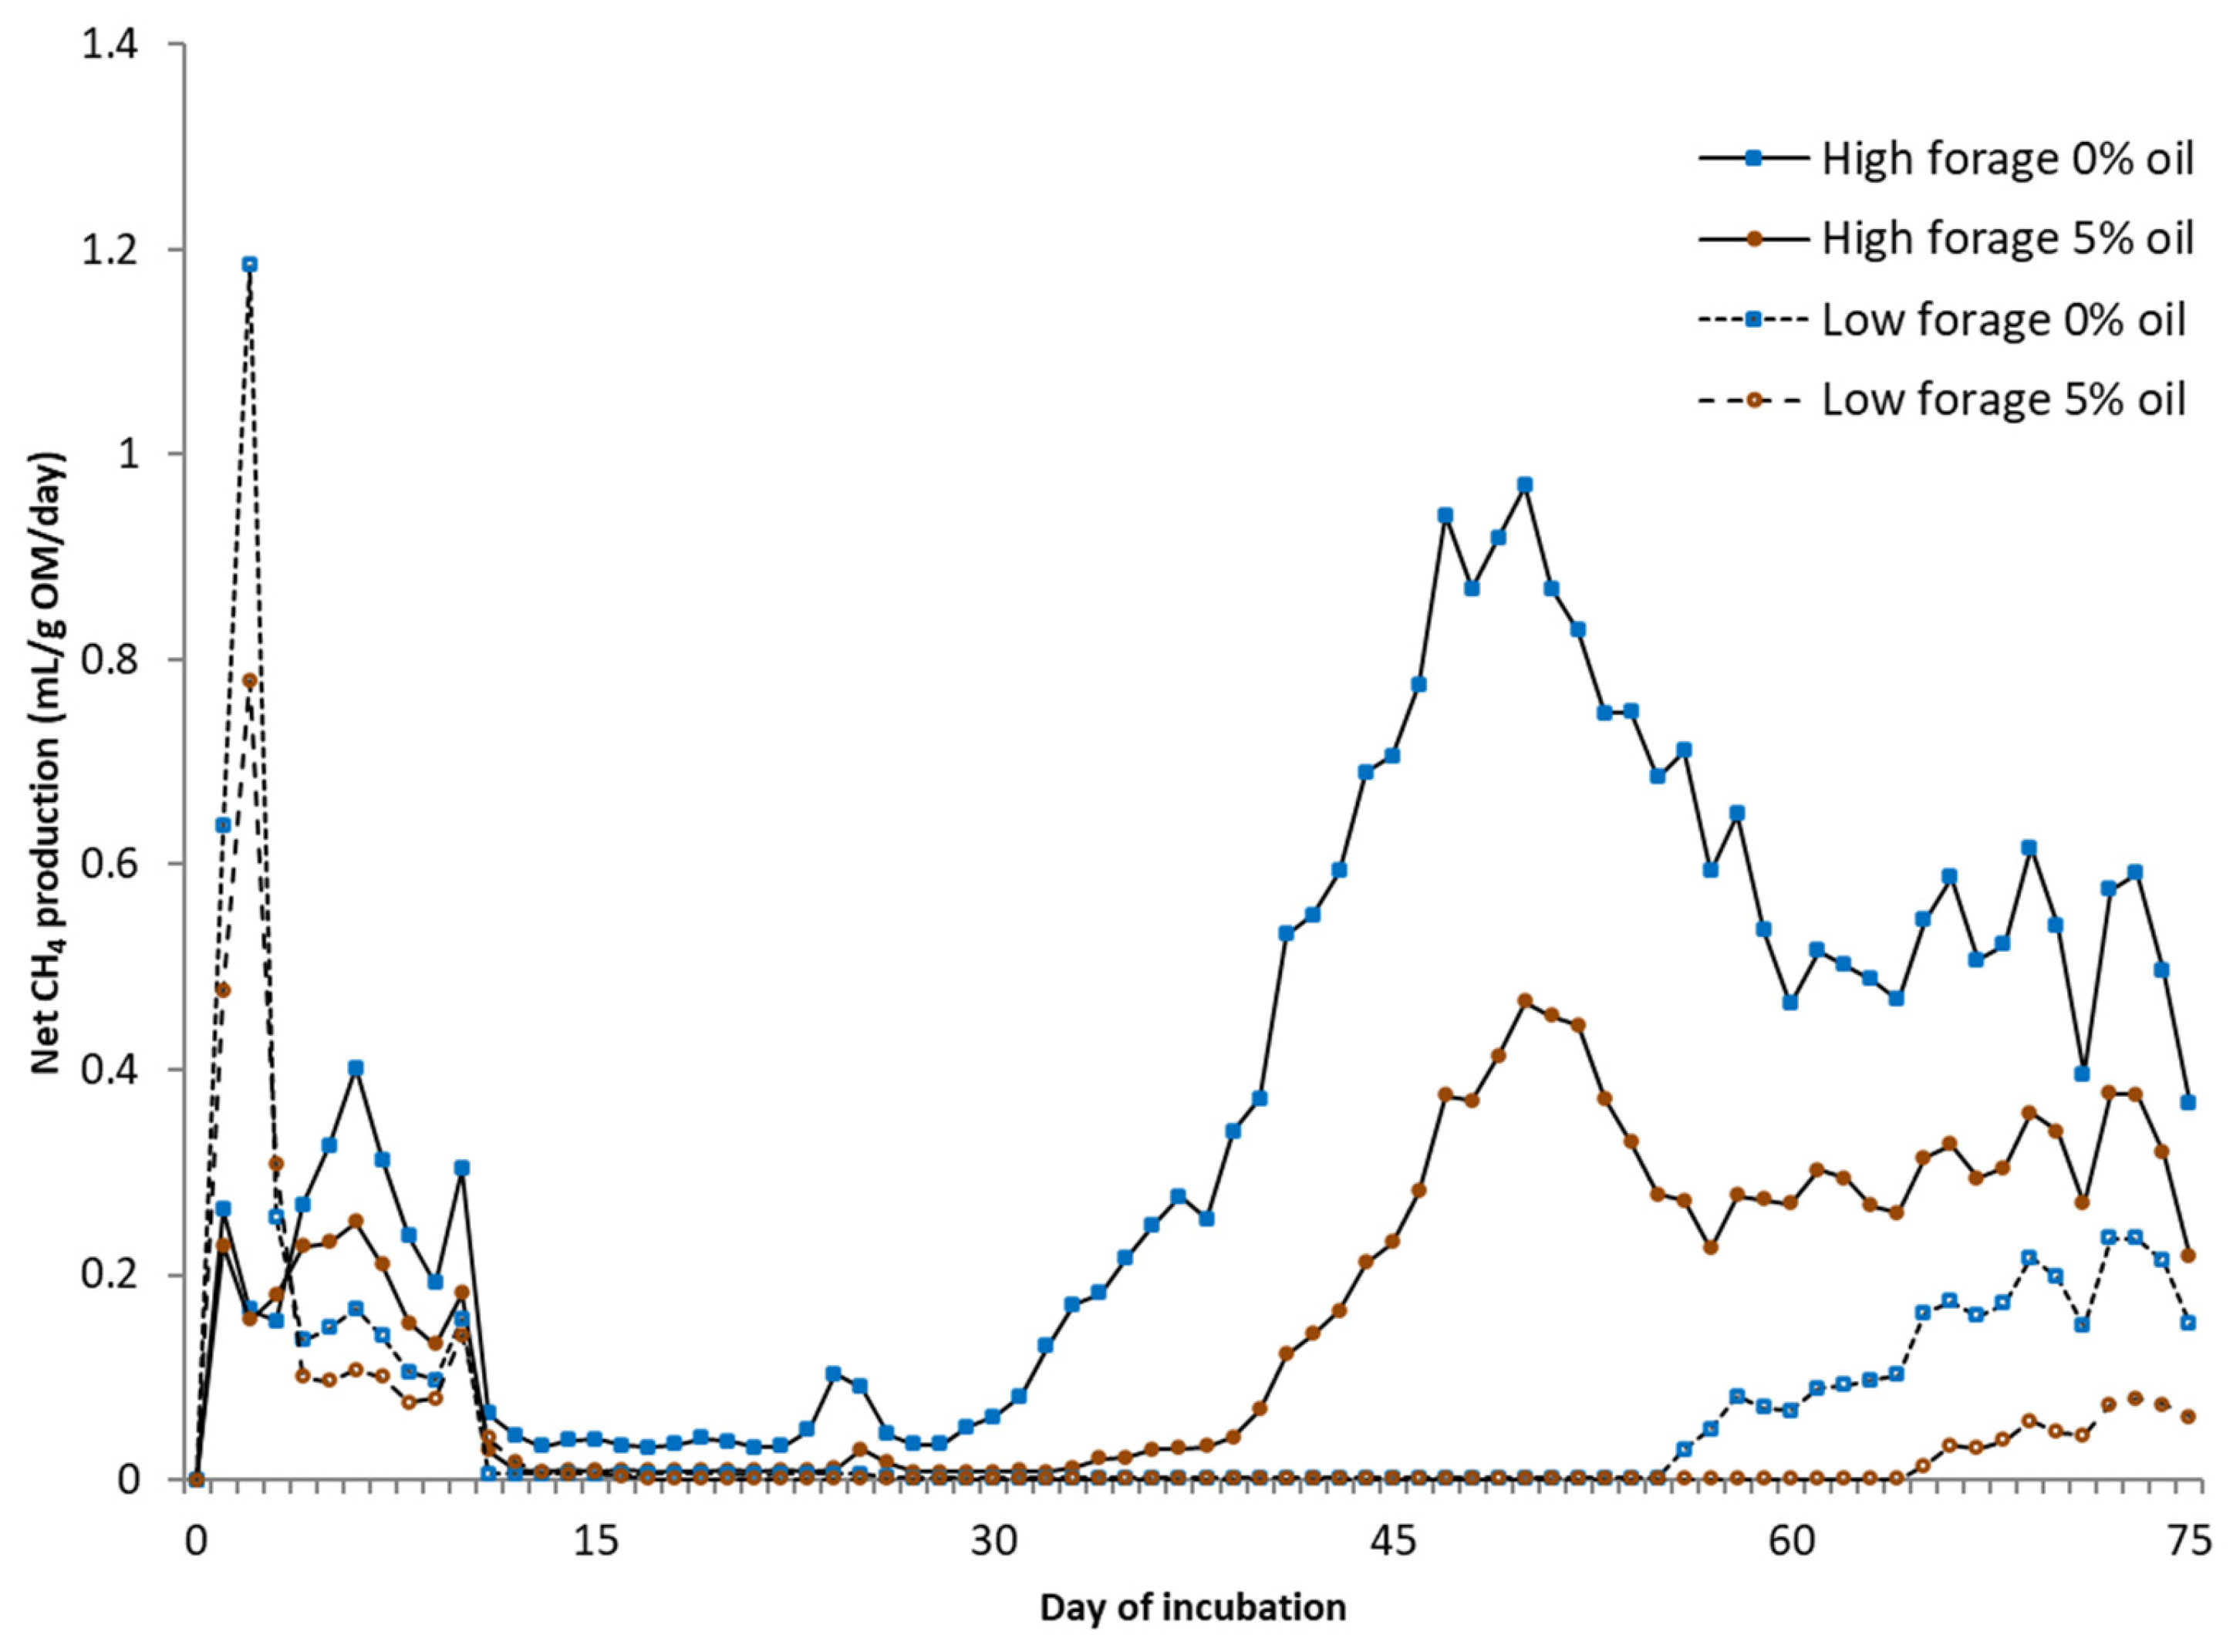
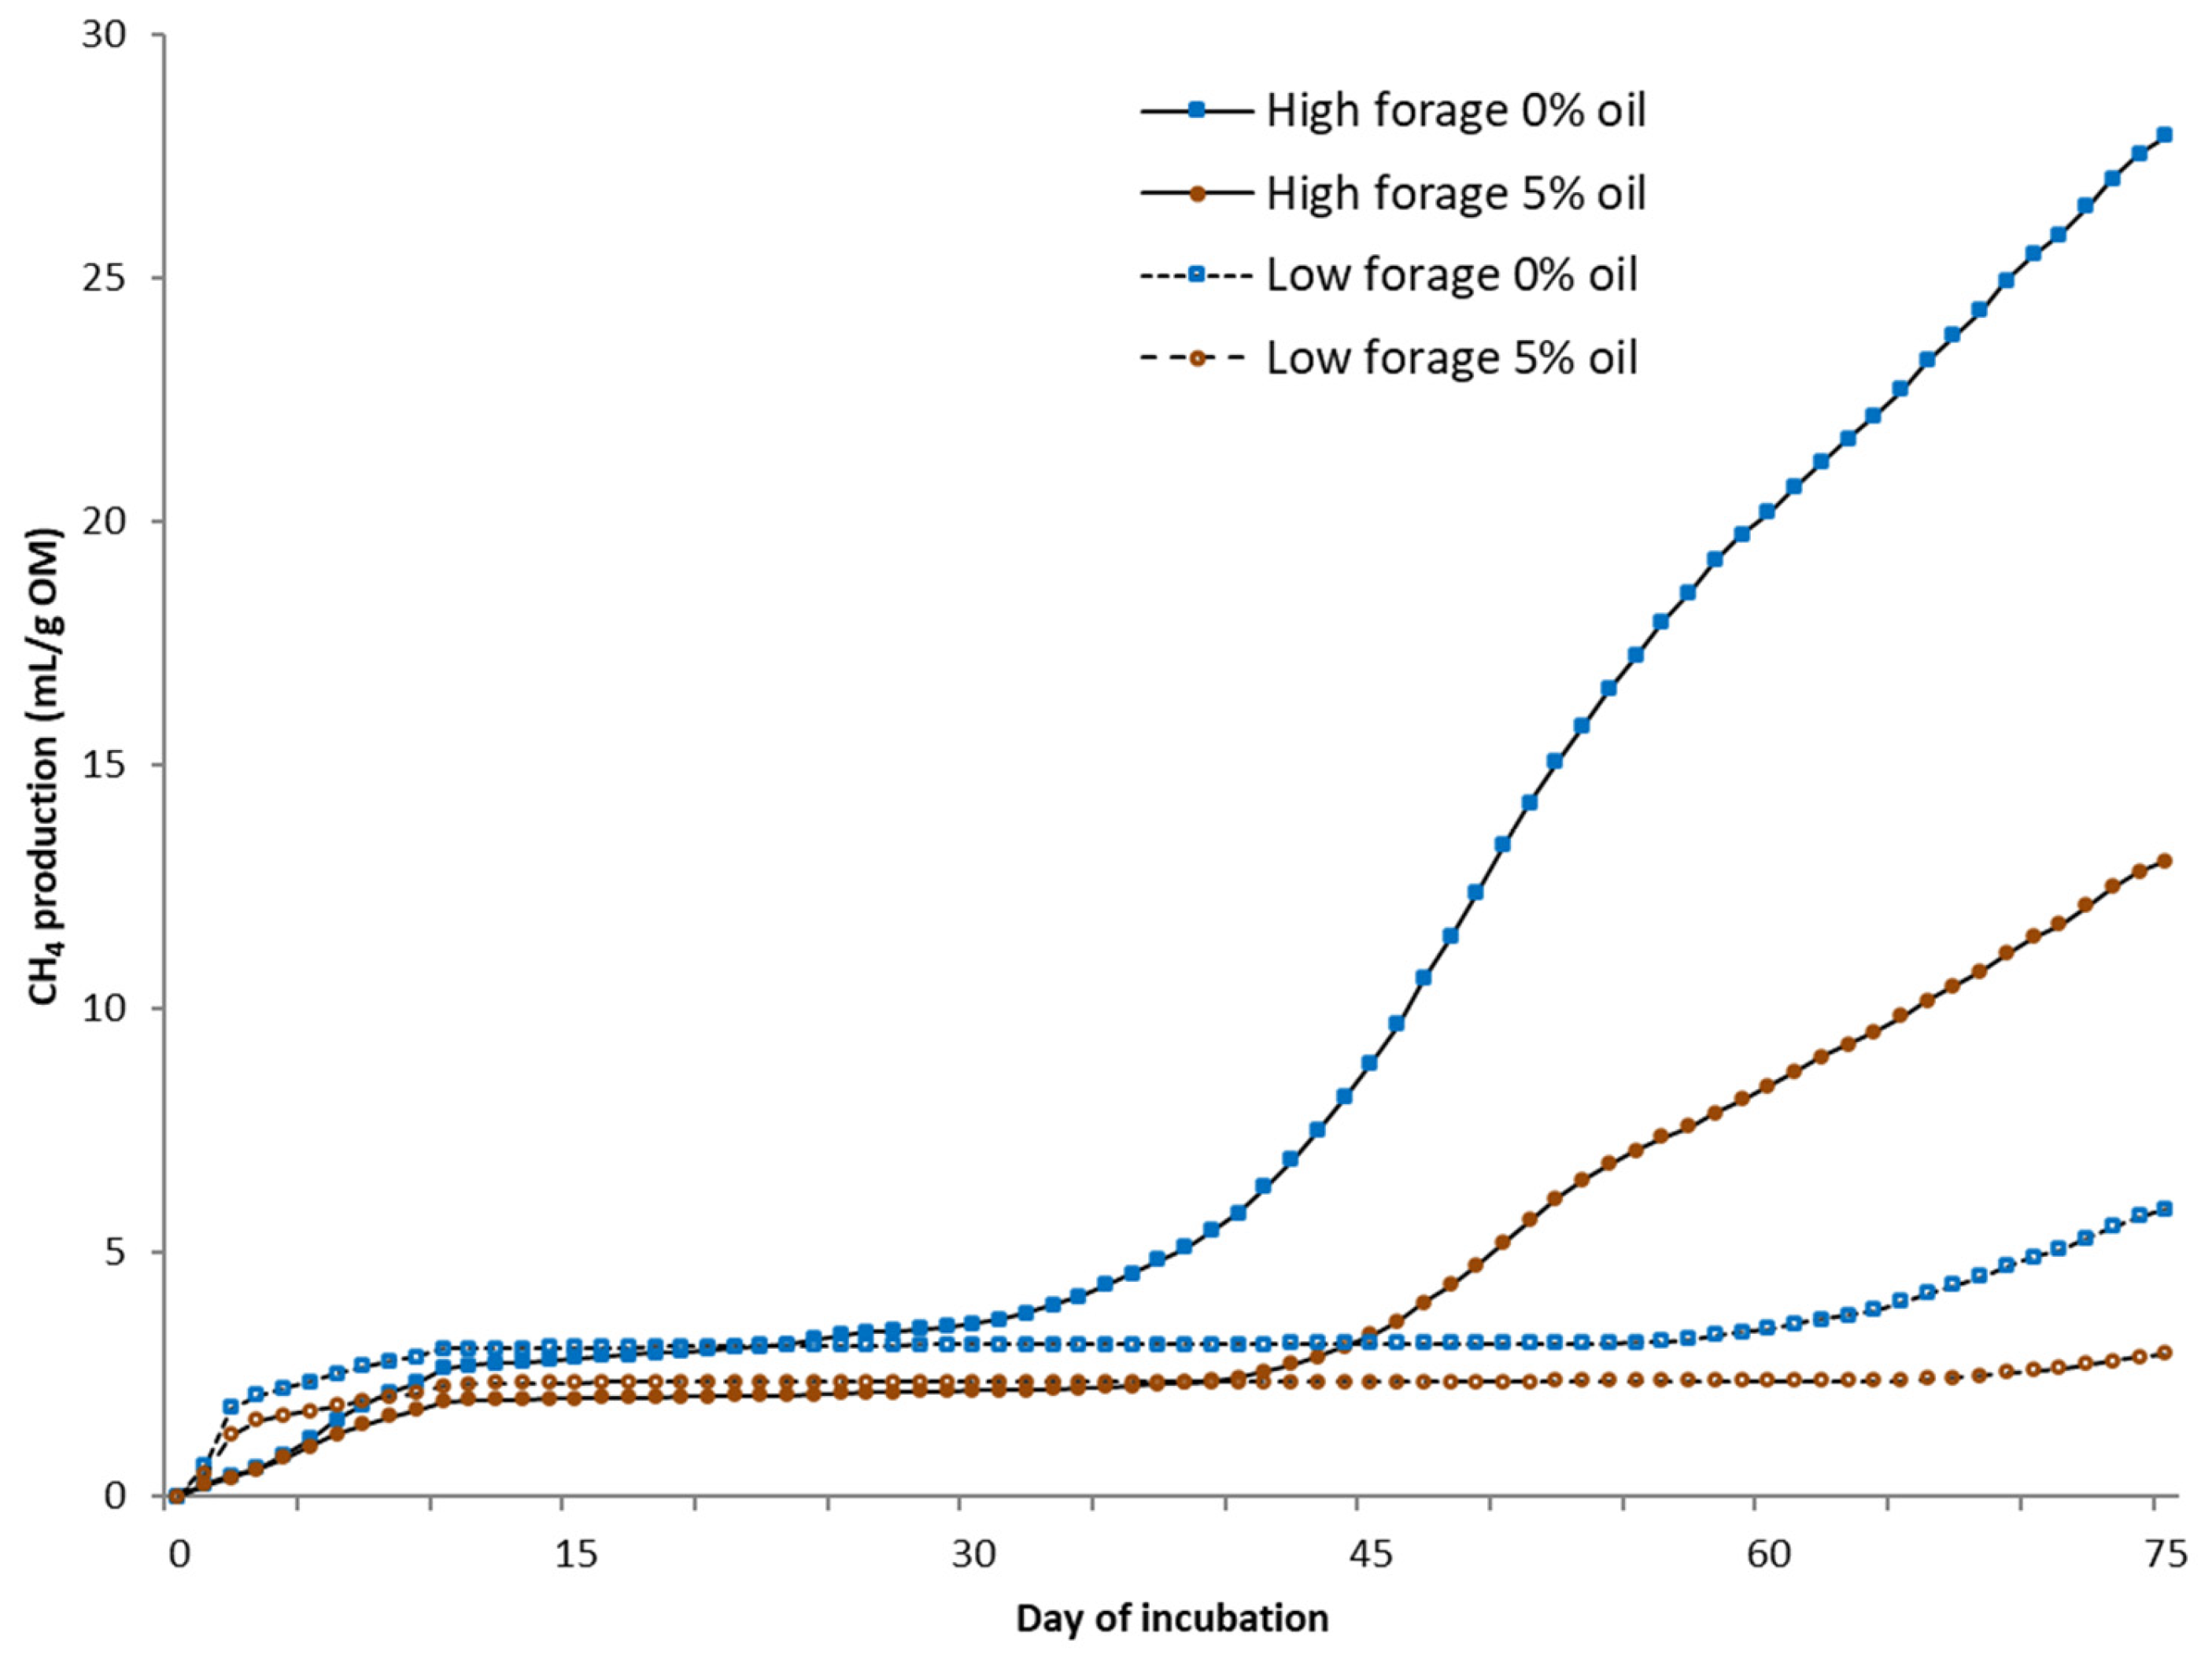
For static in vitro CH4 measurements (75 days), the same equipment was used as in the BMP assay under a temperature of 25 °C without using inoculum, mixing, or NaHCO3. Deionized water was added to each fecal sample with the ratio of excreted urine and feces from each cow. From the biogas, CO2 was fixed with a 3 M sodium hydroxide solution, and the volume of CH4 was determined via water displacement. Fecal samples for microbial community analysis were collected at the end of in vitro BMP and static CH4 measurement trials. Samples were placed into 5 mL tubes, snap-frozen in dry ice, and kept at −80 °C until RNA extraction.
2.4. Microbial Analysis
Total DNA was extracted from 0.5 mL of rumen liquid, as described by Rius et al. [
23]. RNA was extracted from ca. 65 mg of frozen feces using the NucleoSpin RNA Stool kit (Macherey-Nagel, Düren, Germany) and following the manufacturer’s recommendations. The RNA was reverse-transcribed into cDNA using random primers and by following the protocol provided with the QuantiTect Reverse Transcription Kit (Qiagen, Hilden, Germany). Universal primers 515F and 806R [
24] targeting the 16S ribosomal RNA gene V4 region were used for bacterial amplicon sequencing. Libraries were prepared as described by Huuki et al. [
25] and sequenced in the Finnish Functional Genomics Centre (Turku, Finland) on the Illumina MiSeq platform using 2 × 300 bp chemistry. Demultiplexing of sequences, adapter removal, and sorting sequences with barcode were performed by the sequencing center. Sequencing data were processed using Qiime 2 [
26]. Briefly, quality control, filtering of chimeric reads, and clustering of bacterial sequences into ASV were performed using DADA2 [
27]. Bacterial ASV taxonomy was assigned using the Silva 138 database [
28].
2.5. Calculations
Total-tract apparent digestibility coefficients were calculated based on the difference between the intake of a nutrient and its fecal output divided by the corresponding intake. Potentially digestible NDF was calculated as the difference between NDF and iNDF. Energy losses as CH
4 were calculated using the factor 55.24 kJ/g [
29]. Energy-corrected milk (ECM) was calculated using the equation suggested by Sjaunja et al. [
30] based on milk fat, protein, and lactose yields, and energy secretion (MJ/d) in milk was calculated as 3.14 × ECM yield (kg/d).
2.6. Statistical Analysis
Before statistical analysis, all data were tested for normality of distribution using Proc Mixed (version 9.4, SAS Institute Inc., Cary, NC, USA) using box plots and scatter plots of residuals and the generated fitted values. Experimental data were analyzed using ANOVA for a 4 × 4 Latin square with a 2 × 2 factorial arrangement of treatments through the mixed procedure with a model that included fixed effects of period, FC ratio, oil level, FC ratio via oil interaction, and random effects of cow. The data averages for cows within the period were calculated before statistical analysis. For the microbial data, only taxa observed at above 0.01% abundance in at least 50% of samples were included in the analysis. Before the test, the number of reads was log-base transformed [log2(x + 1)] and standardized by data centering. The values reported are least-squares means ± standard error of the mean (SEM). The significance level p ≤ 0.05 was used to determine the significant effects of FC ratio, oil, and their interaction. In addition, probabilities at 0.05 < p < 0.10 were considered as a trend.
The alpha diversity was calculated using observed ASV, Shannon, and Simpson diversity indexes, and the beta diversity was calculated as Bray–Curtis dissimilarities as described by Rinne et al. [
31]. To identify if dietary treatment, concentrate proportion, or oil supplementation can explain rumen or fecal microbial community composition, a distance-based permutational multivariate analysis of variance (adonis) was performed using a
vegan R package [
32], and significance was declared at the
p < 0.05 level after 999 permutations. To determine which fecal bacterial taxa were significantly different between BMP and static manure incubation trials, a linear discriminant analysis was performed as implemented in the
MicrobiotaProcess R package [
33]. To explore associations between CH
4 production and fecal microbial taxa in both manure incubation experiments separately, Spearman correlations were applied, and comparisons were declared significant at
p < 0.05.
