Review

Measuring Livestock CH4 Emissions with the Laser Methane Detector: A Review

German Environment Agency (Umweltbundesamt), Wörlitzer Platz 1, 06844 Dessau Rosslau, Germany
Methane 2022, 1(1), 38-57; https://doi.org/10.3390/methane1010004
Submission received: 26 November 2021 / Revised: 19 December 2021 / Accepted: 21 December 2021 / Published: 24 December 2021

Abstract

:
The handheld, portable laser methane detector (LMD) was developed to detect gas leaks in industry from a safe distance. Since 2009, it has also been used to measure the methane (CH4) concentration in the breath of cattle, sheep, and goats to quantify their CH4 emissions. As there is no consensus on a uniform measurement and data-analysis protocol with the LMD, this article discusses important aspects of the measurement, the data analysis, and the applications of the LMD based on the literature. These aspects, such as the distance to the animal or the activity of the animals, should be fixed for all measurements of an experiment, and if this is not possible, they should at least be documented and considered as fixed effects in the statistical analysis. Important steps in data processing are thorough quality control and reduction in records to a single point measurement or “phenotype” for later analysis. The LMD can be used to rank animals according to their CH4 breath concentration and to compare average CH4 production at the group level. This makes it suitable for genetic and nutritional studies and for characterising different breeds and husbandry systems. The limitations are the lower accuracy compared to other methods, as only CH4 concentration and not flux can be measured, and the high amount of work required for the measurement. However, due to its flexibility and non-invasiveness, the LMD can be an alternative in environments where other methods are not suitable or a complement to other methods. It would improve the applicability of the LMD method if there were a common protocol for measurement and data analysis developed jointly by a group of researchers.

1. Introduction

Ruminants produce methane (CH4) in their rumen and hindgut through enteric fermentation. This leads to losses of up to 12% of the gross energy intake and is a major source of greenhouse gas emissions [1]. Options to reduce CH4 emissions from livestock include feeding strategies, feed supplements, and selective breeding [2,3,4]. Several methods have been developed to quantify CH4 emissions from ruminants, such as the open-circuit respiration chamber (RC), which is very accurate and considered the “gold standard” for CH4 measurements in ruminants [5]. However, when CH4 emissions are to be measured on-farm, other methods such as the GreenFeed (GF) breath-analyser station (C-Lock Inc., Rapid City, SD, USA; [6]), non-dispersive infrared (NDIR)/Fourier-transformed infrared (FTIR) breath analysers (“sniffers”) installed in feed bins [7,8], or the sulphur hexafluoride (SF6) tracer gas technique [9] are used. All these methods have their own advantages and disadvantages in terms of purchase and running costs, labour, repeatability, behaviour change, and throughput [10] (Table 1), and they meet different requirements [11] (pp. 34–35). Another on-farm technique is the portable laser methane detector (LMD), which has comparatively low purchase and running costs and results in only low-to-moderate behavioural changes of the animals but requires relatively high labour resources and has a moderate throughput in terms of the number of records per time [10].
The LMD was originally used to detect gas leaks from a safe distance in gas transmission networks, landfills, and other areas with CH4 leakage risk [12]. In recent years, it has also been used to detect CH4 concentrations in exhaled air from animals. Since the first known application for this purpose in 2009 by Chagunda et al. [12], researchers have further developed and evaluated the measurement, refined the analysis of data obtained with the LMD, and applied the LMD in studies on genetic analyses [13,14,15], on nutrition and feed efficiency [16,17,18], on the physiological status of animals [15], and to characterize different husbandry systems [19]. So far, measurements with the LMD have been carried out mostly on dairy cows, but also on sheep, beef cattle, and goats. A list of studies with the LMD used in this article can be found in Appendix A (Table A1).
There is no consensus on a uniform measurement and evaluation protocol with the LMD, so the results are poorly comparable. Therefore, this article aimed to provide an overview of relevant studies using the LMD and to discuss which aspects of the protocol for measuring and analysing LMD data have already been well studied, which could and should be standardised, and where further studies are still needed. An outlook will also be given as to which applications the method is suitable for and where, in the author’s view, there are significant limitations.

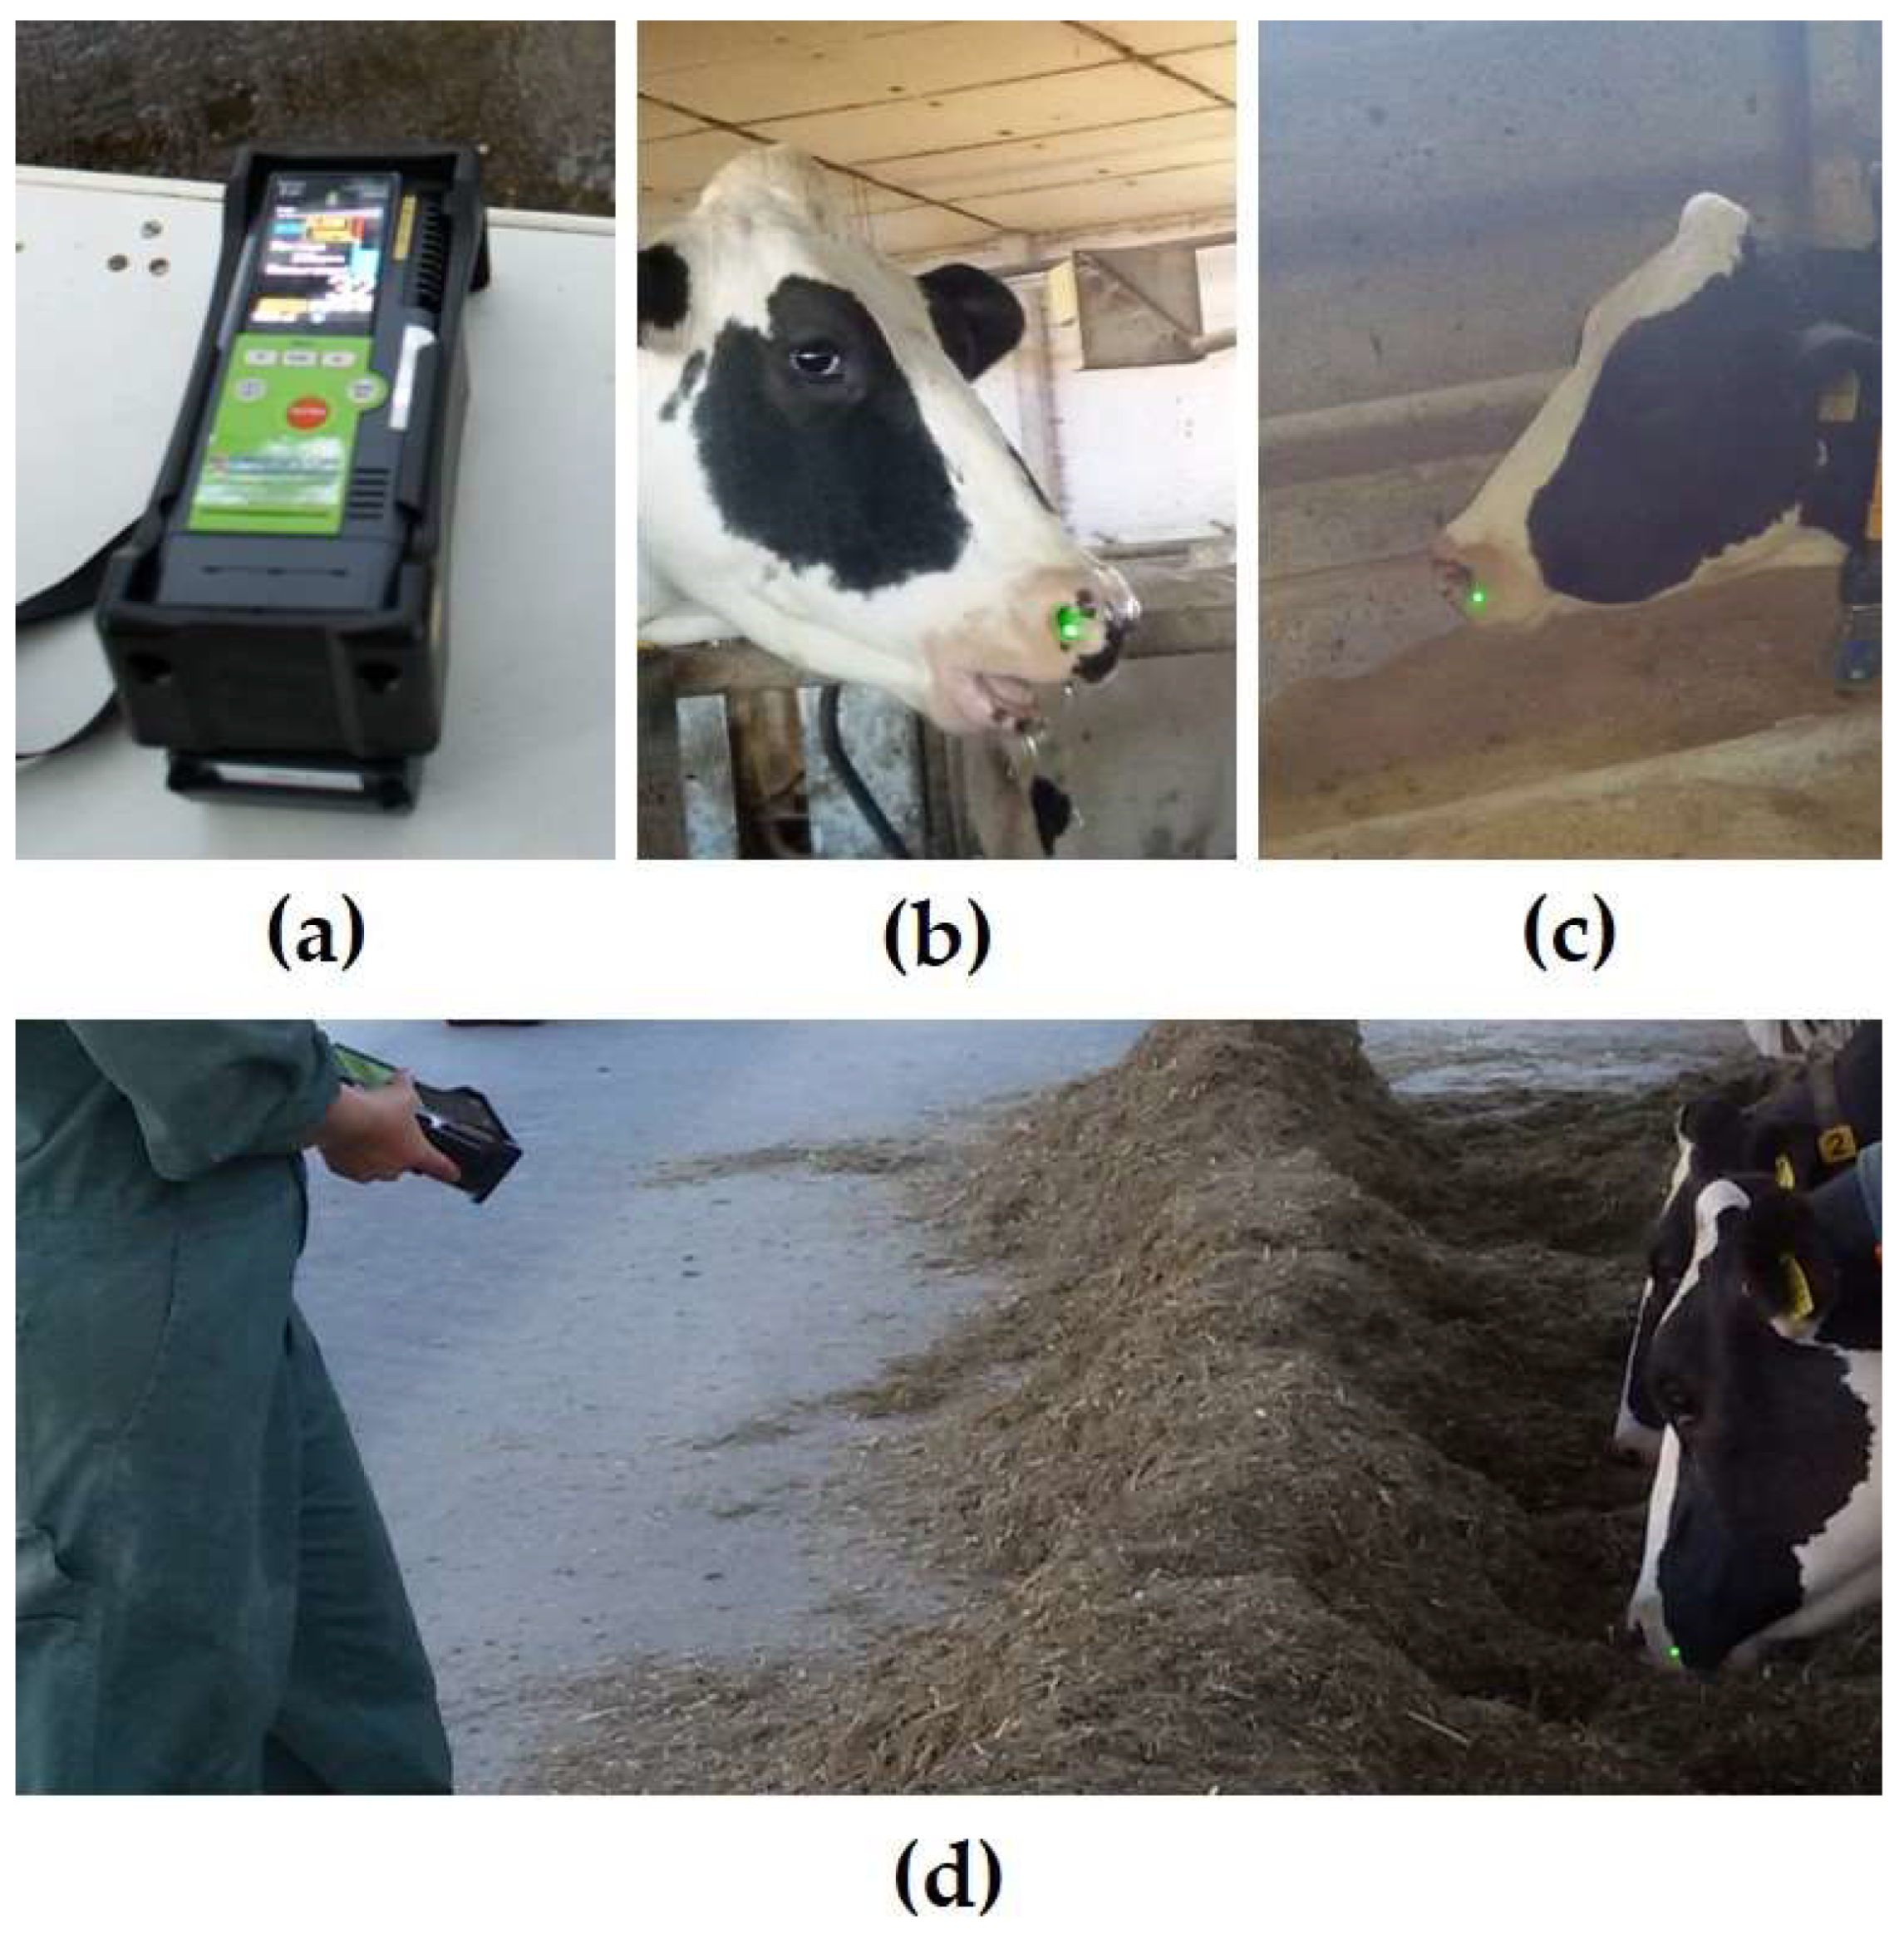
2. The Laser Methane Detector

The measurement with the LMD (Figure 1a) is based on infrared absorption spectroscopy: it uses a semiconductor laser as a collimated excitation source and employs the second harmonic detection of wavelength-modulation spectroscopy for the measurement [12]. A visible guiding laser (Class 3 R laser, 532 nm) helps to direct the invisible measuring laser (Class 1 laser, 1653 nm) to the desired target. The integrated CH4 concentration between the LMD and the target is measured by detecting a fraction of the diffusely reflected laser beam [20]. The measured value is expressed as CH4 column density (ppm × m), i.e., a cumulative CH4 concentration along the laser path or the average CH4 concentration (ppm) multiplied by the length of the path (m) [21]. The LMD measures CH4 in the range of 1 to 50,000 ppm × m (up to 5 vol-%) with an accuracy of ±10%, and can be used from a distance between 0.5 and 30 m and in a temperature range from −17 to +50 °C. It autocalibrates via an internal reference cell [22]. The LMD shows the data in real time on its display and optionally issues an acoustic and visual alarm if a certain threshold is exceeded. Data can be stored in a csv file on a wirelessly connected Android device running the GasViewer app [23]. This can be, for example, a mobile phone (smartphone) worn in an armband sleeve so that one person can operate the LMD and the app at the same time. It has been originally designed to detect CH4 from gas leaks in mining, the petrochemical industry, and landfills. The studies cited here used a “LaserMethane mini-g,” a similar model or a previous model of the same series of LMD from the same manufacturer (Tokyo Gas Engineering Solutions, Tokyo, Japan).

3. Aspects of the Measurement Protocol

CH4 is transported from the rumen and lower intestine via the blood into the lungs and exhaled with the breath. The gas excreted directly from the rumen (eructation) is first inhaled into the lungs and then exhaled again with each respiratory cycle [24]. Only 2% to 3% of the CH4 produced by the animal is released via the flatus [24,25]. Therefore, the LMD is aimed at the area around the animal’s nostrils (Figure 1b,c), which is the main point source of emitted CH4. Normally, an operator holds the LMD by hand (Figure 1d) and follows the animal’s head movements, but it is also possible to mount the LMD firmly, e.g., on a tripod. In such a setup, it is necessary to fix the animal’s head in one position to ensure a steady and uninterrupted measurement [26].
Chagunda et al. [12] were the first to use the LMD to record the CH4 concentration in the breath of dairy cows [27]. They used the LMD from a distance of 3 m from the cow and took recordings at the nostrils for 15–25 s at a time. Since then, the LMD has been used in several studies to measure CH4 breath concentrations in animals (Table A1). The measurement protocols differed mainly in terms of distance to the animal, duration of a single recording, the measurement interval during a single recording (i.e., the number of CH4 values per time), and the number of repeats per animal (Table 2) but also in terms of time of day, animal activity, pointing angle, location, LMD operator, and the number of LMD devices used.

3.1. Distance to the Animal

The evident advantages of a distance of 1 m are the direct conversion of the unit of measurement “ppm × m” to ppm (i.e., dividing the values by 1 m); the lower accumulation of background CH4, which is added with every metre of distance along the laser path; and a lower influence of environmental factors such as air movements. It is also easier to track the target from a short distance, especially for goats, which are more mobile than cattle or sheep [26]. However, if such a short distance is not possible, e.g., if the natural behaviour of the animal is too much affected [31], a distance of up to 3 m seems acceptable. This distance should then be fixed for all measurements in an experiment, and a well-ventilated but windless environment is more important than for smaller distances.

3.2. Duration of Recording

In most studies, single LMD recordings were 3–5 min long. Shorter times are not recommended because an eructation event can be expected every one to three minutes [33,34]. Shorter recordings may, by chance, lead to lower mean CH4 values if no eructation event is recorded or to significantly higher mean values if this is the case. Longer recordings have not been well studied. Sorg et al. [34] found no significant (p > 0.05) change in mean CH4 values for recordings up to 9 min long compared to shorter recordings, and Doran [29] found no difference between mean CH4 concentrations in the first and second half of a 10-min recording.

3.3. Measurement Interval

Most studies used a measurement interval of 0.5 s (i.e., two CH4 values per second, the default setting of the LMD) [18,35,36]. Roessler et al. [26] recommended the use of 0.1 s—the shortest possible measurement interval—after showing that reducing data points to simulate a 1 or 4 s measurement interval resulted in increasing deviation of mean CH4 values from the mean of the full data set. Since it is only a question of storage space and not affecting the amount of work involved in analysing the data, the shortest possible recording interval should be chosen.

3.4. Total Number of Repeats per Animal

Reported numbers of measurements per animal range from 1 [14] to 72 per cow [32] and 63 per goat [26]. When deciding on the appropriate number of replicates per animal, there is a trade-off between workload and invasiveness on the one hand and the quality of the data on the other. Studies with a small number of animals often use many replicates per animal, e.g., [17,26,30]. On the other hand, a study with a large number of animals (622 dairy cows) used one to three repeats per animal to calculate estimates of heritability (h2) for CH4 phenotypes [14]. So, it depends on the aim of the study and the available number of animals how many replicates per animal are feasible and appropriate. As with all measurement methods, increasing the number of measurement replicates is highly advisable, as this effectively reduces noise in the data [37] (p. 140), cited in [35].

3.5. Number of Consecutive Days per Measurement

Most LMD studies have used 3 consecutive days, e.g., [12,14,38], but up to 10 days have also been reported [30]. The former is similar to the number of days commonly used for RC measurements, but less than the protocol recommended for GF. For RC, a one-day measurement provides a reliable estimate of total CH4 production within that day. However, in many studies, two to three days are used to reduce the variation in emissions caused by variations in dry matter intake (DMI). For GF, 20–50 spot samples are recommended, which would require 7–17 days of measurement if the animals visit the facility three times a day [39]. LMD measurements are more influenced by meteorological conditions and animal activity than GF measurements, and sampling over a few minutes is far less accurate than measuring over 24 h in a RC. Therefore, the number of consecutive days of LMD measurement is another important source of variation, and, so far, it is not clear what number of days gives the most reliable average value, but more than three is strongly recommended. However, the effect of measuring on several consecutive days should not be confused with repeating a round of measurement days some time later under different conditions. In the study of Mapfumo et al. [32], for example, the effect of different seasons on CH4 emission was investigated in two measurement periods of six days each, three months apart. It should also be considered that the physiological state of the animals (lactation, growth, and performance) changes over such a long period of time, which leads to additional variation.

3.6. Time of Day

The time of day can have a significant influence on the measured concentrations [29,34,38], as CH4 production in ruminants follows a diurnal pattern that is influenced by the timing of feeding and the times of rumination [36,40,41]. Therefore, it is recommended to perform all measurements in an experiment at approximately the same time of day and at the same distance from feeding to increase comparability or to include the time interval from feeding to the CH4 recording as a fixed effect in the statistical model as described by Pinto et al. [19].

3.7. Animal Activity

The LMD has been applied on animals during different activities (eating, drinking, ruminating, lying, standing idle, and sleeping), being restrained or free to move in a barn or on pasture [27]. Considerable variation in CH4 concentrations has been found during different activities; however, the ranking of the animals was not consistent between studies [12,26,40]. Drinking was among the activities with the highest CH4 concentrations, presumably because the influx of water into the rumen triggered the flux of accumulated gas [36]. In a study with goats, neither activity nor restraint as opposed to free roaming had any effect on recorded CH4 concentrations [31]. If possible, animal activity should be standardized within one experiment. If this is not possible, e.g., with free-roaming or grazing animals, it should be attempted to repeatedly record CH4 during different activities for each animal and analyse the data for each activity separately.

3.8. Pointing Angle

This aspect has not yet been studied intensively, but, for purely practical considerations, it is of some importance for the measurement protocol. When measuring free-ranging animals, it is not always possible to aim exactly at the nostrils from the front, e.g., when the animal is facing a wall. If the laser beam of the LMD passes through a larger part of the exhaled CH4 plume, the measured CH4 values are higher. This could be the case if the laser beam is directed at the nostril at an angle corresponding to the direction of the exhaled air, as opposed to an angle perpendicular to the exhaled air. Sorg et al. [34] analysed the difference between pointing at cows in a tie-stall barn from the front or from the side in two different data sets and found that, on average, significantly (p < 0.05) higher CH4 levels were recorded from the side (82 and 101 ppm × m) than from the front (73 and 93 ppm × m; p < 0.05). If the pointing angle varies during one experiment, this should be documented for each recording and considered in the statistical analysis.

3.9. Location

LMD measurements were performed at different locations inside buildings: in RC, e.g., [18,36]; in free-stalls, e.g., [12,14]; in a tie-stall [17]; in the milking parlour (according to the author’s experience); a weighing facility for sheep [15]; and in individual pens, e.g., [38,42]. A few studies have been conducted on pasture [31,32,43] or in other half or full outdoor locations [19]. Apart from animal-related factors such as feed intake, the construction of the enclosure, the ventilation rate, and the presence of other animals seem to affect measured CH4 levels, considering that the results from different experimental setups vary considerably, and significantly lower (p < 0.05) CH4 concentrations were recorded outdoors than indoors [19]. Meteorological factors such as relative humidity and barometric pressure have been shown to have a weak but positive relationship with outdoor CH4 concentrations, presumably by slowing the upward movement of CH4 in the air [36]. Wind speed had a negative relationship with CH4 concentration [36], probably due to a greater dilution of CH4 in the ambient air. It can be assumed that the same mechanisms apply to CH4 concentrations measured indoors. For this reason, Mühlbach et al. [14] recorded the wind speed in the barn during their LMD measurements and included it in their statistical model for genetic parameters for CH4. Similarly, Reintke et al. [15] and Pinto et al. [19] accounted for temperature and humidity. Van Wyngaard et al. [43] even concluded that the LMD was not a practical tool for use with grazing animals in their region (Southern Cape, South Africa) and that weather conditions did not allow for successful use. After all these experiences with the LMD in different locations, it seems favourable to use a windless, but well-ventilated, environment with low and stable background CH4 concentrations for measurements with the LMD. Furthermore, Chagunda [44] emphasises the need to include statistics on environmental conditions in the analysis of the data.

3.10. Operator

Most reports do not mention whether different LMD devices or different operators were used in a study. Chagunda et al. [12] found no significant operator effect in their statistical analyses. One study compared three operators who randomly alternated between using one of three LMD devices and jointly collected a dataset of a total of 520 LMD profiles from dairy cows in a free-stall barn [34]. As a result, one individual recorded significantly (p < 0.01) higher average CH4 levels (97 ppm × m) than the other two individuals (86 and 87 ppm × m). Different handling of the LMD (e.g., precision in pointing at the animal’s nostrils) and body size of the operators (i.e., a different vertical pointing angle) may have been the determining factors here. Mühlbach et al. [14] therefore included the operator of the LMD in the statistical model in their analyses of LMD data that had been collected jointly by five different operators. If more than one operator records LMD data during one experiment, the individual should be documented for each recording and considered in the statistical analysis.

3.11. Device

Previously, it was shown that two LMD devices agreed well when recording CH4 concentrations in the air of an RC or barn in parallel [40]. However, in the same study as mentioned above [34], one LMD device recorded higher CH4 values at the cow’s nostrils (101 ppm × m) than the other two devices (85 and 86 ppm × m; p < 0.001), regardless of the operator. Interestingly, the unit with the deviating values had been purchased later than the other two, which had been delivered at the same time, although all three units were from the same supplier and of the same model. It can only be speculated whether this deviation is due to the date of manufacture, a different calibration, or a drift in the hardware conditions of the auto-calibration cell in the unit. As with the operator and the wind speed, Mühlbach et al. [14] included this as a fixed effect in the statistical model for the estimation of genetic parameters for CH4. If more than one LMD is to be used for a trial, the LMD unit number should be documented for each recording and considered in the statistical analysis.

3.12. Animal Welfare

To the author’s knowledge, the effects of the LMD on animal welfare have not been studied so far. As it is a minimally invasive procedure and the handling of the animals does not differ from routine procedures (e.g., fixing in headgates or crates), it can be assumed that there are no animal-welfare issues related to the method itself. According to the instruction manual [21] (p. V), care must be taken to ensure that the visible guiding laser (and with it the invisible measuring laser) is cast away from the animal’s eyes at all times to avoid harmful exposure and injury.
In summary, a simple measurement protocol for researchers who want to get started with the LMD method and who do not have much experience with its handling could be as follows: Measure for 3 min or longer from a distance of 1 m, facing a restrained animal from the front. The measurement should be taken in a windless but well-ventilated building for three or more consecutive days at the same time of day, during the same activity of the animal and at the same distance from the last feeding.

4. Steps in LMD Data Processing

The data generated by the LMD make a list of CH4 values accompanied by a unique date and time stamp, a value for the quality of the reflection of the laser beam, and optionally an input of the GPS location (if this function is activated on the connected Android device). A single measurement consisting of a time series of CH4 values belonging to a single animal can also be called a “profile” [14,26,35] and is stored in the GasViewer app as a single file. Such a profile consists of regular peaks and troughs representing the inhalation and exhalation of the respiratory cycle [35] (Figure 2). When an eructation event occurs, the individual peaks are much higher and can reach maxima that are multiples of the respiratory peaks. Usually, one or more of these eructation events are recorded in one profile.
In order to process the data from several profiles together, these files must be transferred to a computer and combined into one file. In doing so, the CH4 values from each file should be given an individual number belonging to that file/profile so that they can be distinguished from each other during later analysis. This can be done manually, or, to facilitate the processing of a large number of files and minimise errors, with an automated, self-written computer script. Once a single file with all values is available, extensive processing of the data is required, which includes—but is not limited to—the following optional steps:

4.1. Exclusion of Profiles

A deletion of entire recordings was described in one study, where profiles were not categorisable into one of two fitted normal distributions (one for eructation and one for respiration; see step: “Separation of eructation from respiration”) [18]. A more intuitive approach would be to plot all profiles and visually inspect the plots for any distinct deviation from the natural pattern of peaks and troughs. This seems only practical with a small data set and should be done very carefully in order to not introduce any unnecessary bias into the data.

4.2. Exclusion of Single Data Points

Some studies mention the deletion of single data points. One reason for this is unusually high CH4 values, which are likely caused by errors in the reflectance of the laser beam [19,38]. These implausibly high values, e.g., above 2500 ppm × m (according to the author’s experience ) or more, depending on the experimental conditions, may occur when the recorded value for “reflection” is below 100 or when the visible pointing laser is reflected from a polished metal surface (according to the author’s experience). For this reason, Niero et al. [42] deleted all values above three standard deviations from the overall mean. As with the exclusion of entire recordings, profiles can be visually inspected for isolated, very high peaks that are not part of the regularly occurring pattern of peaks but with the above limitations. Regardless of which variant is chosen, it should be ensured that unphysiologically high single values are detected and deleted. Another source of faulty data is the movement of the animal, which can lead to a time- and labour-consuming removal of data from times when the laser beam was off-target [18,31].

4.3. Accouting for Background CH4 Concentration/Offset

The LMD has an internal “offset” function to subtract the background CH4 from all subsequently recorded values. This was used in several studies, e.g., [12,31,45]. Other researchers used the minimum CH4 concentration of each profile [15,19,38] or from all records [29] and subtracted it from all values in a profile. Rey et al. [46] assumed a fixed background concentration of 2 ppm and subtracted it from their measurements. However, the background CH4 concentration can be highly variable and is unrelated to the day, time of day, or time within the measurement ([26], and according to the author’s experience). Doran [29] concluded that the offset function of the LMD was not suitable in their experiment because there were many other animals and a dung heap nearby. So, the question remains whether this step is really necessary or whether it introduces bias by deliberately choosing a random value in a random location as a background.

4.4. Accounting for Distance

The recorded CH4 can be directly converted from ppm × m to ppm by dividing it by the length of the laser path. This is useful when the distance is 1 m or less, or when the CH4 concentration is relatively homogeneous over the entire distance between the LMD and the target, such as in an RC [36]. Rey et al. [46] assumed that the plume with the high CH4 concentration in front of the animal was only 0.1 m long and therefore multiplied their measurements by 10. In many other studies, no such conversion or consideration of distance was included [12,30,31]. If the animals are to be ranked or different treatments are to be compared, absolute CH4 values and accounting for distance are not necessary. Here it is only important to use the same experimental conditions for all animals and measurements to ensure comparability. It has also been shown that high CH4 concentrations are only up to 0.4 m from the animal and decrease very quickly with increasing distance [34]. Dividing by a distance of 2 or 3 m would therefore artificially dilute the recorded CH4 values. Sorg et al. [35] assumed that the additional low CH4 background added by different distances (1 m, 2 m, and 2.5 m) at different measurement sites was negligible for the specific purpose of their study. Kobayashi, et al. [18] reported a variation in distance of 0.6 to 1.2 m in their experiment but did not describe any consideration of distance in the analysis of the data. However, if possible, the distance should be standardised within a study.
After a thorough quality control, the data can be transformed and the CH4 concentrations of the individual animals should be combined into some kind of point measurement, also called a “trait” or “phenotype.” Typical steps for creating these point measurements are described in the following Section 4.5, Section 4.6, Section 4.7, Section 4.8 and Section 4.9.

4.5. Transformation of the CH4 Values

Within a profile there are many low (respiration, Figure 2) and few high CH4 values (eructation, Figure 2), so the data do not follow a normal distribution. In some studies, therefore, all CH4 values were loge-transformed (natural logarithm) to achieve a normal distribution and homogeneity of variances [42], or only the peak respiratory values (“mini-peaks,” see “Separation of Eructation and Respiration”) were loge-transformed [15]. Bruder et al. [33] found that when all values above the 95th (238 ppm) or 99th percentile (562 ppm) were deleted from their data set, a normal distribution could be achieved without log-transforming the data. Most other studies proceeded without any transformation of the individual values. It is not certain whether such a transformation is necessary when all values of a profile are later condensed into a single point measurement.

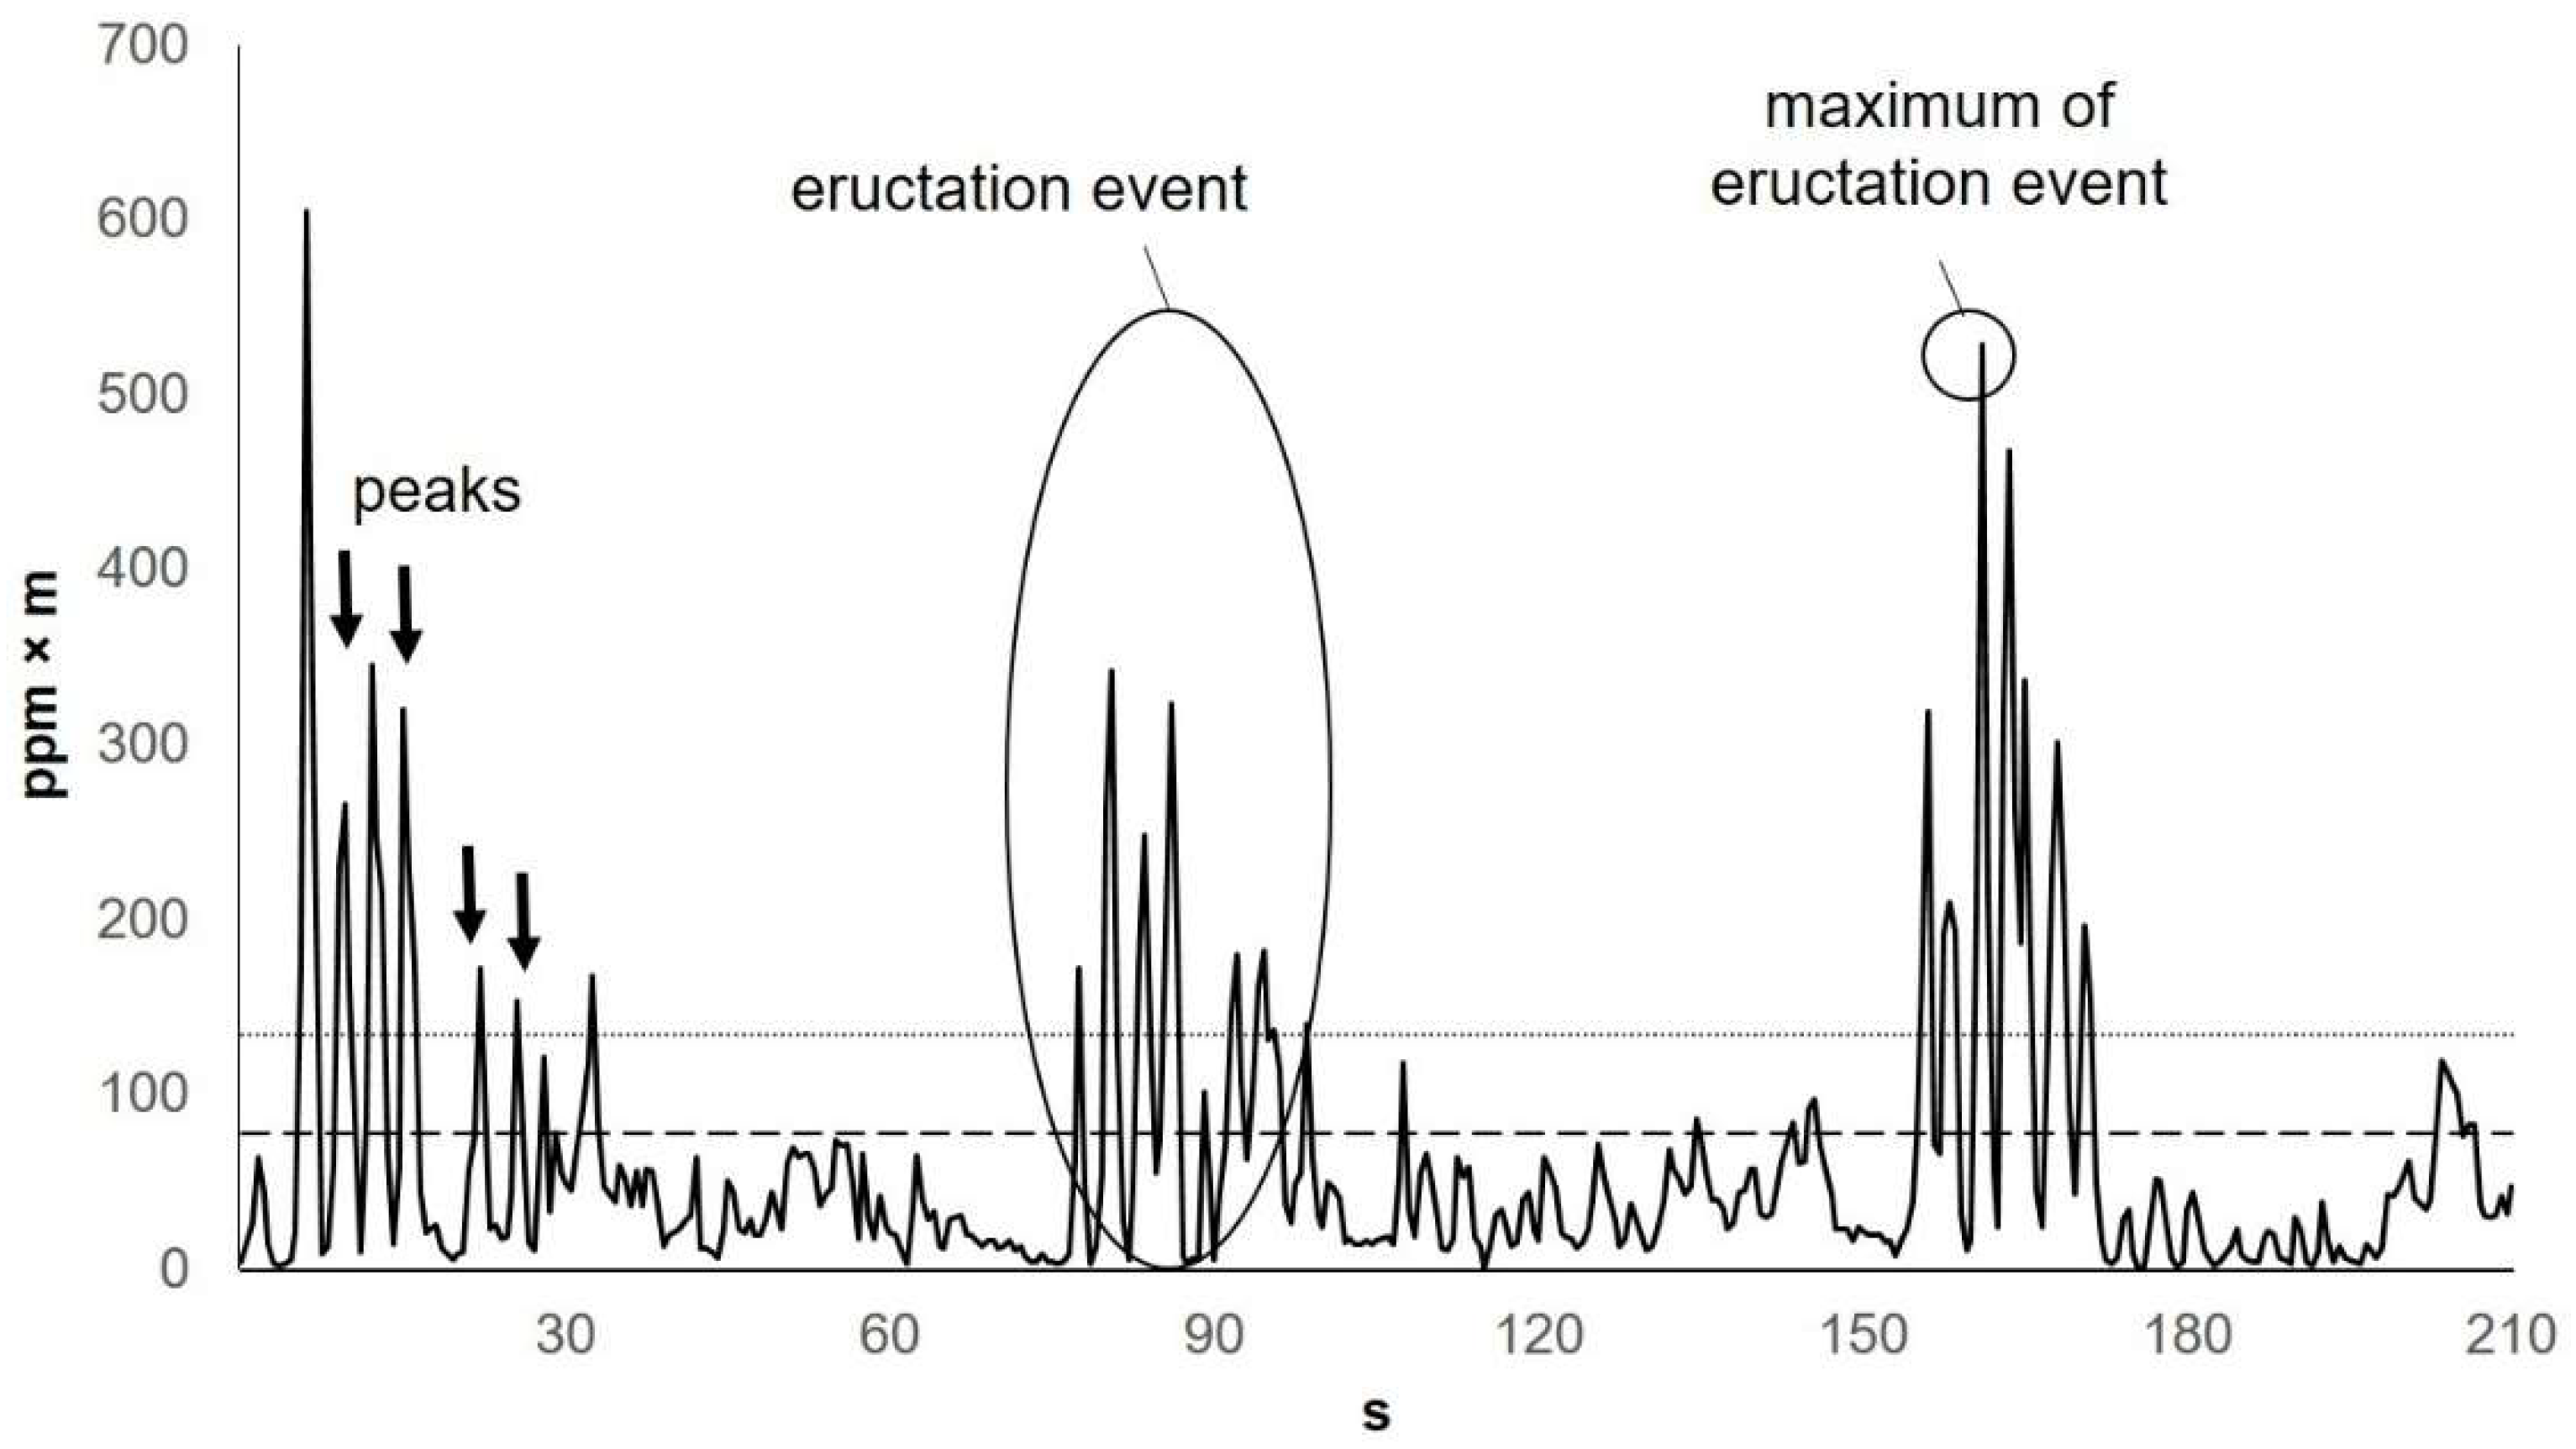
4.6. Separation of Peaks and Troughs

The regularly occurring CH4 peaks in an LMD profile (Figure 2) represent the respiratory cycle [28,35]. These peaks in the time series of CH4 values can be identified using an automated, self-written computer script or Excel macro (Microsoft Corporation, Redmond, WA, USA; [38]). Another simple identification method was used by Niero et al. [42]: They defined the last decile of the distribution of all CH4 values as peak values. However, it is unclear whether this phenotype is comparable, in a physiological sense, to the one described above [35,38]. Niero et al. [42] concluded that repeatability and reproducibility were better for the average of the peaks than for all CH4 values. However, the same authors acknowledged that the average of the peaks may not be suitable to distinguish between high and low CH4 emitters due to its lower variability [42]. Sorg et al. [35] also found higher repeatability (between-cow variance/total variance) for the mean of peak values (0.24) than for the mean of all values (0.12) and subsequently used the former phenotype for their analyses. Rooke et al. [28] obtained similar results with the mean of all and the mean of the peak CH4 values and subsequently used the mean of all values. The majority of the studies used the peak values. This fact and the physiological explanation that the peaks are the CH4 concentration in the breath make it seem reasonable to at least calculate and analyse both phenotypes in parallel.

4.7. Separation of Eructation and Respiration

Series of very high CH4 peaks in each LMD profile can be clearly attributed to eructation Rooke [28]. Several of these eructation events can be distinguished in a typical CH4 profile (Figure 2). This is an advantage of the LMD over other CH4 measurement methods: because the LMD has a very short measurement interval (up to 0.1 s), it can accurately resolve the fluctuations in CH4 levels due to respiration and eructation and provide valuable information about physiological processes. Several methods have been developed to automatically separate the eructation values from the respiration values. An easily calculated threshold is one standard deviation (SD) above the mean of all values in a CH4 profile [28,33,36]. Such a value appears physiologically reasonable (Figure 2) and takes into account the individual values of exhaled and background CH4. Sorg et al. [35] used the definition from the boxplot method [47,48] (Figure 2), which has similar advantages: Possible outliers (i.e., eructation) in a distribution of values (i.e., all values of a profile) are above the threshold (T) with
T = Q 3 + ( 1.5 × ( Q 3 Q 1 ) ) ,
Q3 being the third quartile and Q1 the first quartile of all values. A more sophisticated approach was introduced by Ricci et al. [38], who fitted two normal distributions (one for eructation and one for respiration) to the pool of all values from all records and calculated the probability that each value belonged to one of these distributions. The threshold for respiration was a cumulative probability of 99%, and eructation events were defined as at least two consecutive eructation peaks [38]. Other studies that applied this threshold used a probability of 95% for respiration [15], of 10% for eructation [19], or set the threshold such that all values were placed in the category for which the values had a higher probability [18]. It is still not clear whether it is necessary to analyse respiration and eructation of CH4 separately. According to Ricci et al. [38], this separation improved the ability of LMD outputs to discriminate between feeding treatments and the correlation with CH4 outputs of a RC. Furthermore, Kobayashi et al. [18] found a higher correlation with the CH4 of the RC when only the respiration CH4 from the LMD measurements was used. This contrasts with the higher repeatability (between-cow variance/total variance) of the mean of all peaks (0.24) compared to the mean of only the eructation peaks (0.11) or the mean of the maxima of eructation events (0.17) [35] and the higher estimates of h2 for the mean of all peaks (0.07–0.23) than for the mean of the maxima of eructation events (0.05–0.08) [14].

4.8. Reduction of Data to Point Measurements

For the statistical analysis of CH4 data obtained with the LMD, it is necessary in most cases to reduce the time series of CH4 values to a single point measurement (or trait or phenotype). So far, there is no consensus on the best phenotype. The mean of the peak values seems to be the most studied phenotype [12,13,17,26,38], but other measures that summarise all values [28,30,42,46], peak values [19,38,42], respiration or eructation values [18], respiration or eructation peak values and eructation events [14,15,19,35,38,46] have also been analysed (Table 3). So far, different phenotypes based on total, respiration, and eructation values have performed inconsistently and differently across studies in terms of CH4 prediction accuracy [18] and usability for genetic [14,15] and nutritional analyses [38]. It is therefore recommended to analyse and present relevant phenotypes from respiration, eructation, and total CH4 (Table 3) in parallel as long as there is no consensus on the best phenotype.
The selection of phenotypes should also be based on the previous studies with which one’s own results are to be compared.

4.9. Estimation of Daily CH4 Production

LMD measures a concentration, whereas most other widely used methods allow quantification (mainly the RC) or at least estimation of an animal’s total CH4 production in g/day [10]. Direct comparison or pooling of CH4 data from LMD with data obtained using other techniques is therefore only useful if the aim is to rank animals rather than quantify their absolute CH4 production. For this reason, there have been many attempts to establish equations to convert CH4 concentrations measured with the LMD into total CH4 production in g/day [27]. Chagunda et al. [12] estimated daily CH4 production based on the CH4 concentrations in the breath during different activities, the assumed duration of these activities in a day, and the average tidal volume during different activities. Similarly, Sorg et al. [34] estimated CH4 production during a 5 min LMD measurement from average CH4 breath concentration, individual number of CH4 peaks (i.e., number of breathing cycles), and the individual tidal volume estimated from live weight [49] (p. 200). Both equations [12,34] produced values that were biologically meaningful, on average, but had very high standard deviations and some implausible low and high individual CH4 production values [34]. In two studies with sheep [29] and goats [50], where similar equations were used, this deviation was much lower and allowed reasonable use of this phenotype for further analyses. Nevertheless, these equations are suitable to provide rough estimates of the average CH4 production of a group of animals or a treatment group, but they are not suitable for the accurate quantification of an animal’s individual CH4 production.
Another approach to obtain data on total CH4 production from LMD measurements is to use another technique as a reference and measure CH4 with the LMD in parallel. In this way, a regression equation can be derived from the known CH4 production (measured with the other technique) for LMD measurements. In a number of studies, the “gold standard,” the RC, was used for this purpose. These results should be interpreted with caution, as the conditions in the RC are very different from those in a barn. In some of these studies, the LMD was applied while the animals were inside the RC [18,36]. CH4 concentrations are higher in enclosed spaces than in well-ventilated barns or outdoors [19,40]. Therefore, LMD measurements in RC cannot be directly compared with those on-farm. Another approach is to measure on-farm CH4 concentrations in the same environment as used for subsequent LMD studies and then move the animals to a RC for an estimate of daily CH4 production, as described by Rooke et al. [28], Ricci et al. [38] and Kecman et al. [51]. It must be considered that the CH4 output in the chamber may not be the same as the one on-farm. Animal behaviour, feed intake, and milk yield may be affected by the stress caused by handling, confinement, and the unfamiliar environment [10,52,53]. Therefore, equations derived from comparing LMD and RC are unlikely to reliably estimate on-farm CH4 production. For this reason, total CH4 production in g/day estimated with a GF system was used as a reference in the study by Sorg et al. [35]. The GF system was installed in the barn, and the cows had free access to it. Between these visits, recordings were made with the LMD in the same barn, so that both measurements were made in a similar environment and physiological status of the cows. The resulting regression equation (R2 = 0.65) for daily CH4 production from LMD measurements allowed a successful comparison of LMD and FTIR/NDIR sniffer measurements from different trials [35].
All the above-mentioned studies produced equations for an estimate of daily CH4 production derived under the specific conditions in these experiments and adapted for a specific purpose. It is not recommended to apply these equations to LMD measurements from other experiments with different conditions without further validation or reference. Even with more research, it may not be possible to develop a universal equation suitable for all types of LMD measurements, as the conditions are very different between experiments. It remains a serious limitation to the method that only the concentration and not the flux of CH4 can be measured.
Knowing the limitations of a simplified analysis, here is nevertheless a suggestion for a very basic protocol for the analysis of LMD data for researchers who want to start with the LMD method and do not yet have much experience with this type of data: Delete all CH4 values above 2500 ppm × m and those with an intensity value < 100. Calculate the mean of all values for each profile. If you have access to mathematical computer software or programmes with customizable computing algorithms, determine peak values and calculate the mean of all peak values. Choose a simple threshold for respiration and eructation, e.g., the boxplot method or one standard deviation above the mean of each profile and calculate the mean of all respiration and eructation values for each profile.

5. Comparison with Other Techniques

Since the beginning of the use of the LMD in livestock, researchers have compared the LMD with other techniques for measuring CH4 emissions from ruminants. It is important to distinguish between
  • Technical evaluations of the accuracy of the sensor and
  • Evaluations of the overall measurement and analysis protocol for the LMD.
For (1), Chagunda and Yan [45] and Sorg et al. [40] installed LMD units in RC and recorded ambient air CH4 concentrations in the chamber by aiming the LMD at the gas outlets from inside the chamber. This was a comparison of the sensors of the RC and the LMD, not of the measurement principle of these techniques [11] (pp. 29–30). Both studies reported good agreement with CH4 levels measured by the RC sensors, proving that the LMD is capable of accurately quantifying fluctuating and physiologically low CH4 concentrations in the air inside buildings. This is an important prerequisite for further applications of the LMD on livestock, considering that it was originally developed for detecting very high CH4 concentrations at gas leaks in mining, the petrochemical industry, and landfills.
For (2), the LMD was compared with RC, GF, and FTIR/NDIR sniffers, as well as with indirect methods using prediction equations for CH4 production from proxies. One such prediction equation from feed intake and feed properties yielded lower average CH4 values than the one estimated from LMD measurements [12]. Reported quantitative agreement ranges from none with CH4 predicted from milk mid-infrared spectroscopy (MIR) and RC [17] to a Pearson correlation of 0.82 with RC expressed as total CH4 production in g/day and kg milk [51]. A significant positive regression of LMD on RC CH4 was also reported by Rooke et al. [28] (R2 = 0.27, p < 0.001), or in the form of a positive and significant (p < 0.05) Pearson correlation by Chagunda et al. [36] (0.18 and 0.47 for sheep and dairy cows, respectively), Doran [29] (0.57), Rooke et al. [28] (0.53), Bruder et al. [33] (0.47), Brocklehurst et al. [54] (0.6), and Kobayashi et al. [18] (0.55). Ricci et al. [38] improved the relationship of LMD and RC with a model containing the LMD phenotypes “mean eructation time” or “maximum CH4 concentration during respiration” and DMI. Kobayashi et al. [18] found the best correlation with RC CH4 output using respiration only, in contrast to all values or eructation only.
In addition, Chagunda et al. [36] evaluated the ability of the LMD to detect high CH4 levels (above the third quartile of all values) similarly to the RC sensor and reported a sensitivity of 95% and 94% and a specificity of 97% and 79% for cows and sheep, respectively.
When comparing methods, systematic differences between methods (means), any random differences (precision), and correlation between methods can only be assessed without residual error when two or more measurement replicates are performed per animal [10]. This was not always the case in these studies (e.g., when an overall average for LMD phenotypes was compared to an average CH4 production from the RC). Therefore, simple correlations should be interpreted with caution and may not reflect true agreement or prove disagreement between methods.
Under on-farm conditions, a high repeated measures correlation (rp = 0.66) was found using replicates of the LMD phenotype “mean of all peaks” and the total daily CH4 production determined by GF [35]. In addition, a regression equation for total CH4 production in g/d from the LMD was derived from this comparison and used to compare the LMD with an FTIR (rp = 0.57) and an NDIR sniffer (rp = 0.60) [35]. Although means and variances differed greatly between instruments, Sorg et al. [35] concluded that these values of the rp implied minimal re-ranking of the animals in their experiment. Rey et al. [46] obtained an even higher rp for the mean of all CH4 values (0.98) and the number of eructation events (1.00) when they compared the LMD with an NDIR sniffer. This could be due to the fact that the sampling tube of the NDIR sensor was manually held to the cow’s nostrils while measuring simultaneously with the LMD. In the study by Sorg et al. [35], it was placed in the feed container of an automatic milking system (AMS) and the measurement with the LMD was taken after the cow had left the AMS. A comparison with the SF6 tracer gas technique in grazing cows was attempted by Van Wyngaard et al. [43], but the measurement was not successful due to weather conditions.
A systematic comparison of different on-farm techniques to measure CH4 using bivariate models was conducted by researchers of the European Cooperation in Science and Technology (COST) Action METHAGENE (www.methagene.eu, accessed 23 December 2021, [10]). Data from only one study comparing the LMD with other techniques [35] were available to the group at that time. It would be helpful to systematically compare the LMD to the RC, the GF, sniffer sensors, the SF6 tracer gas technique, CH4 prediction equations, and possibly other new methods in one joint data set along the lines of this work. In this way, the agreement and important factors influencing it, the limitations, and the possibilities of the LMD could be better characterized, working towards a more standardized protocol for the measurement and the analysis of LMD data. From the above-mentioned studies, it becomes clear that the LMD has the potential to rank animals similarly to other techniques, even if the absolute CH4 levels are different.

6. Applications

In several areas of ruminant research, there is a need to assess CH4 emissions in order to develop mitigation measures or to obtain valuable information on the physiological and metabolic status of animals. Hence, the LMD has been successfully used for studies in various fields of animal science:

6.1. Genetics

In addition to the established and well-studied traits for animal performance, conformation, health and fertility, traits for feed efficiency and environmental impact have been studied for some time. Selective breeding for lower CH4 emissions could make a valuable contribution to the set of mitigation strategies to achieve climate targets but requires data from a sufficient number of animals that are phenotyped and genotyped [55]. Such data must be obtained under on-farm conditions from a large sample of animals. Therefore, complex or invasive techniques with high accuracy such as the RC or SF6 tracer gas methods are not suitable. The LMD is able to classify animals according to their CH4 production and has therefore been used to calculate estimates of h2 for several CH4 phenotypes [13,14,15]. The results (0.01–0.23) are in the range of those obtained with other on-farm methods [56], although the standard errors are higher. The measurements with the LMD are more influenced by environmental conditions, resulting in higher variability of the recorded values. Furthermore, the number of animals that have been included in genetic evaluations based on LMD data so far is limited. With larger samples and a more standardised protocol for measurement and data analysis, estimates of h2 are likely to improve.

6.2. Nutrition

Novel feeds and natural and synthetic feed additives are emerging CH4-mitigation technologies with high commercialisation potential and a potentially large impact on CH4 emissions in the future [4]. The effect of these feeds and feed additives needs to be validated in a large sample of animals under on-farm conditions. Among other methods, the LMD could be a valuable technique for their investigation. A few studies have successfully used the LMD to discriminate between different rations and feeding strategies at the group level [28,38,50]. Cameron et al. [57] measured the CH4 production of dairy cows with the LMD and concluded that adding fresh grass or pasture to a total mixed ration reduced it by 17% and 39%, respectively, and could be a valuable tool to reduce CH4 emissions. However, some researchers were unable to detect differences in CH4 concentration or production measured with the LMD due to dietary components [19,26] despite their well-studied effect on methanogenesis [2].
Vrancken et al. [16] demonstrated the effectiveness of a novel feed additive to decrease CH4 emissions from cows using LMD measurements. If such feed additives are to be used as mitigation measures in the future, their effect must be extensively demonstrated at the farm level. For this, the LMD could be a useful application.

6.3. Farming Systems and Breeds

Due to its relatively low cost, flexibility, and portability, the LMD can be used to systematically compare farms and farming systems in regions with limited access to research infrastructure or with animals on pasture. This was demonstrated by Pinto et al. [19], who were able to characterise access to pasture and different husbandry systems along an urban–rural gradient in India using CH4 phenotypes obtained with the LMD. Grobler et al. [30] found breed differences (p < 0.05) in the CH4 production of South African Jersey, Bonsmara, and Nguni cattle, while in the study by Mapfumo et al. [32] extensively reared African Boran and Nguni heifers showed no difference in CH4 output per DMI. If the breed differences in CH4 production are too small, the LMD may not be able to detect them.

6.4. Health and Metabolism

To the author’s knowledge, the correlation of physiological blood parameters with CH4 production measured with the LMD has only been investigated in one study so far. In the study by Reintke et al. [58], the blood concentrations of zinc, β-hydroxybutyrate, and unesterified fatty acids had a partly breed-specific significant (p < 0.05) influence on CH4 concentrations.
For the applications described above, the LMD can be a complement to other established methods or an alternative in environments where more sophisticated and complex methods are not suitable. The LMD meets the requirement to measure variation over time (especially whole and consecutive lactation periods) in large numbers of animals without disrupting normal animal behaviour or farm management on commercial farms and limiting investment and maintenance costs [11] (pp. 34–35). It can be used for experiments where animals are to be categorized or ranked according to their CH4 concentration—especially in genetic analyses—or where average values of CH4 concentration or estimated CH4 production at a group level are sufficient. For these purposes, large samples are recommended: many replicates per animal and/or many animals. A common protocol specific to each purpose would further improve the comparability of such studies and is also suggested by other researchers [27]. If possible, external validation with another on-farm method (e.g., GF, sniffer, or SF6) or the newly developed “artificial cow” [59] should be attempted. It is not recommended to use the LMD if accurate values for absolute CH4 production of individual animals are needed.

7. Conclusions

The LMD has several advantages: it is flexible, portable, easy to handle, and it does not require an external power source. It is therefore relatively inexpensive to use in many different experimental and commercial environments. Nevertheless, there are also substantial limitations: measurement with the LMD is labour- and time-intensive, and of all the established on-farm methods for CH4 measurement, it is probably the least accurate, as it only measures concentrations, not quantities, and is strongly affected by environmental conditions. Absolute values for CH4 production can only be calculated with some uncertainty and must be interpreted with caution. Nevertheless, it can be a complementary method to others or where alternatives are lacking or not applicable. The application of the LMD can be extended to various research questions and has already been demonstrated exemplarily for nutrition, physiology, and genetics.
From the first exploratory application of the LMD in 2009 to today, the research community has come a long way, and many questions have been answered about what the LMD method can and cannot do. Still, that knowledge is not yet systematic but rather fragmentary.
Findings on the protocol for LMD measurements and the analysis of the data cannot be transferred directly from one species to another or from one experimental set-up to another. Some research groups have developed their own working protocol, which they have applied in subsequent studies. However, several protocols exist side by side, making it difficult to compare the results of different research groups. Therefore, further research is needed, preferably in an integrated group of experts who develop a joint protocol for measurement and data analysis and to make it available to all others. This would also be very useful for researchers who want to use the LMD for the first time and who do not want to or cannot develop their own protocol. In this way, more CH4 emissions from ruminants worldwide could be measured under on-farm conditions in the future, which would facilitate the development of mitigation measures for CH4 and would enhance the efficiency of ruminant production.

Funding

This research received no external funding.

Institutional Review Board Statement

Not applicable.

Acknowledgments

I would like to thank Jelena Kecman and Alexander Finger for their valuable support in the preparation of the manuscript.

Conflicts of Interest

The author declares no conflict of interest.

Appendix A

Table A1. Overview of relevant studies with the laser methane detector.
AimNo 1Dis 2Dur 3Rep 4Selected Result(s)Ref 5
Comparison of LMD 6 and RC 720 dairy cows1 m5 min3Correlation between daily CH4 g/kg energy corrected milk with LMD and RC: 0.82[51]
Development of protocol for measurement and data analysis; nutritional study2 + 12 dairy cows0.6–1.2 m2–3 min26Correlation of daily CH4 production with RC and LMD: 0.55; natural grassland hay not recommended for indoor-fed cows[18]
Relationship of blood serum parameters with CH4 emission46 ewes1 m3 min-Zinc, β-hydroxybutyrate, and non-esterified fatty acid blood concentrations had a partially breed-specific significant impact on CH4 emission[58]
Comparison of LMD, RC and MIR 8;30 dairy cows1 m6 min12No agreement of LMD with RC or MIR[17]
Book chapter reviewing previous work with the LMDNA 9NANANADiscussion of advantages and challenges of the LMD[27]
Development of protocol for data analysis2 dairy cows3 m5 min15Number of peaks best phenotype to discriminate high and low emitters[42]
Comparison of CH4 emissions from different husbandry systems448 dairy cows1 m2 min3CH4 concentrations were affected by location, breed, and husbandry system along a rural-urban gradient[19]
Genetic analyses330 ewes1 m3 min-h2 10 for CH4 concentration 0.00–0.03[15]
Development of protocol for measurement and data analysis4 goats2 m4–5 min60No influence of restraint on CH4 concentration; restraint of grazing goats can facilitate LMD measurements[31]
Development of data analysis46 dairy cows1 m5–6 min6–8Correlation of daily CH4 production with RC, and several LMD phenotypes: up to 0.6; simple phenotypes not outperformed by those considering the time series nature of data[54]
Comparison of LMD and other techniques for CH4 measurementNANANANAReview and meta-analysis; sufficient correlation between methods for methods to be combined for international genetic studies[10]
Comparison of LMD and NDIR 11 sniffer48 dairy cows1 m5 min6Moderate agreement between LMD and NDIR sniffer[46]
Effect of a novel feed additive on CH430 dairy cows1 m4 min-Feed supplement significantly reduced CH4 concentration (p < 0.05)[16]
Nutritional study45 dairy cows1 m--Daily CH4 production and CH4 per kg milk decreased by grass-feeding compared to a total mixed ration[57]
Breed comparison24 beef cows3 m1 min72No between-breed difference in CH4 output[32]
Genetic analyses622 dairy cows2 m5 min1–3h2 for CH4 phenotypes 0.05–0.28[14]
Development of protocol for measurement and data analysis4 + 12 goats1 m 2 min24 + 63Recording interval should be 0.1 s; high variability of CH4 concentration across individual goats and days; LMD able to detect diurnal pattern of CH4 production in goats[26]
Development of data analysis, comparison of LMD, GF 12 and NDIR/FTIR 13 sniffer156 dairy cows1, 2, 2.5 m5 min1–6Number of CH4 peaks = respiratory rate; similar ranking by LMD, GF and NDIR/FTIR sniffer sensors, regression equation for CH4 g/d from LMD data[35]
Nutritional study18 goats1.5 m5 min-CH4 production affected by energy and tannin levels of feed, and sex[50]
Development of protocol for measurement and data analysis71 + 18 dairy cows1 m~5 minNAOptimal recording duration > 3 min, correlation of LMD and RC CH4 average 0.47, regression equation for CH4 g/d from LMD data[33]
Development of protocol for measurement and data analysis8 dairy cows3 m1 min40The proposed LMD measurement protocol could not be successfully implemented due to local weather conditions (grazing)[43]
Development of protocol for measurement and data analysis-0.4–2.5 m5–10 minNADuration of recording should be >2 min; no significant change in CH4 concentration above 0.4 m distance; pointing angle, operator, LMD unit, time of day have significant effect on CH4 concentration; number of peaks is the respiratory rate; prediction equation for total daily CH4 from LMD record[34]
Comparison of LMD and RC, comparison of 2 LMD devices4 dairy cowsNAcontinuousNAGood agreement in concentration in spent air from RC measured with RC and LMD, good agreement between 2 LMD devices[40]
Genetic analyses57 dairy cows1 m1–5 minUp to 9h2 for CH4 concentration 0.05[13]
Development of protocol for measurement and data analysis32 sheep1 m5–10 min9–12Correlation of daily CH4 production with RC and LMD: 0.57[29]
Comparison of Bonsmara, Nguni and Jersey cattle12 heifers3 m1 min40Differences in CH4 concentration between breeds and feed sources[30]
Development of protocol for measurement and data analysis24 ewes; 72 steers?2 min; 4 min5; 3Low correlation of CH4 from RC and LMD-model improved by DMI 14; best LMD phenotypes: length of eructation and maximum of respiration CH4[38]
Review summarizing previous work with the LMDNANANANAThe LMD is a very recent tool and has potential to measure enteric CH4 production in ruminants, further validation needed[44]
Development of protocol for measurement and data analysis2 + 24 dairy cows; 4 sheep2.75 m5 min-LMD has good sensitivity and specificity in detecting high and low CH4 concentrations as compared to RC; cow activity and meteorological factors affect CH4 concentrations[36]
Development of protocol for measurement and data analysis72 cross-bred steers1 m4 min-Significant regression of LMD on RC with R2 = 0.27; similar results for mean of all values, all peaks, respiration peaks or eructation peaks[28]
Comparison of LMD and RC10 dairy cows2.3 mcontinuous (12–16 h)NAGood agreement in concentration in spent air from RC measured with RC and LMD[45]
Development of protocol and data analysis71 dairy cows3 m15–25 s3LMD is applicable for cows, data make biological sense[12]
1 Number and type of animals included in the study, 2 distance of measurement, 3 duration of recording, 4 repeats per animal, 5 references, 6 laser methane detector, 7 respiration chamber, 8 mid-infrared spectroscopy, 9 not applicable, 10 heritability, 11 non-dispersive infrared, 12 GreenFeed, 13 Fourier-transformed infrared, 14 dry matter intake.

References

  1. Gerber, P.J.; Steinfeld, H.; Henderson, B.; Mottet, A.; Opio, C.; Dijkman, J.; Falcucci, A.; Tempio, G. Tackling Climate Change through Livestock: A Global Assessment of Emissions and Mitigation Opportunities; Food and Agriculture Organization of the United Nations (FAO): Rome, Italy, 2013; p. xxi + 115. [Google Scholar]
  2. Knapp, J.R.; Laur, G.L.; Vadas, P.A.; Weiss, W.P.; Tricarico, J.M. Invited review: Enteric methane in dairy cattle production: Quantifying the opportunities and impact of reducing emissions. J. Dairy Sci. 2014, 97, 3231–3261. [Google Scholar] [CrossRef] [Green Version]
  3. Kumari, S.; Fagodiya, R.; Hiloidhari, M.; Dahiya, R.; Kumar, A. Methane production and estimation from livestock husbandry: A mechanistic understanding and emerging mitigation options. Sci. Total Environ. 2020, 709, 136135. [Google Scholar] [CrossRef] [PubMed]
  4. Reisinger, A.; Clark, H.; Cowie, A.L.; Emmet-Booth, J.; Gonzalez Fischer, C.; Herrero, M.; Howden, M.; Leahy, S. How necessary and feasible are reductions of methane emissions from livestock to support stringent temperature goals? Philos. Trans. R. Soc. A 2021, 379, 20200452. [Google Scholar] [CrossRef]
  5. Zhao, Y.; Nan, X.; Yang, L.; Zheng, S.; Jiang, L.; Xiong, B. A review of enteric methane emission measurement techniques in ruminants. Animals 2020, 10, 1004. [Google Scholar] [CrossRef] [PubMed]
  6. Zimmerman, P.R. Method and System for Monitoring and Reducing Ruminant Methane Production. U.S. Patent 7,966,971, 28 June 2011. [Google Scholar]
  7. Lassen, J.; Løvendahl, P.; Madsen, J. Accuracy of noninvasive breath methane measurements using Fourier transform infrared methods on individual cows. J. Dairy Sci. 2012, 95, 890–898. [Google Scholar] [CrossRef] [PubMed] [Green Version]
  8. Negussie, E.; Lehtinen, J.; Mäntysaari, P.; Bayat, A.R.; Liinamo, A.-E.; Mäntysaari, E.; Lidauer, M. Non-invasive individual methane measurement in dairy cows. Animal 2017, 11, 890–899. [Google Scholar] [CrossRef]
  9. Johnson, K.; Huyler, M.; Westberg, H.; Lamb, B.; Zimmerman, P. Measurement of methane emissions from ruminant livestock using a sulfur hexafluoride tracer technique. Environ. Sci. Technol. 1994, 28, 359–362. [Google Scholar] [CrossRef] [PubMed]
  10. Garnsworthy, P.C.; Difford, G.F.; Bell, M.J.; Bayat, A.R.; Huhtanen, P.; Kuhla, B.; Lassen, J.; Peiren, N.; Pszczola, M.; Sorg, D. Comparison of methods to measure methane for use in genetic evaluation of dairy cattle. Animals 2019, 9, 837. [Google Scholar] [CrossRef] [PubMed] [Green Version]
  11. Wu, L. Measurement Methods to Assess Methane Production of Individual Dairy Cows in a Barn. Ph.D. Thesis, Wageningen University and Research, Wageningen, The Netherlands, 2016. [Google Scholar]
  12. Chagunda, M.G.G.; Ross, D.; Roberts, D.J. On the use of a laser methane detector in dairy cows. Comput. Electron. Agric. 2009, 68, 157–160. [Google Scholar] [CrossRef]
  13. Pickering, N.K.; Chagunda, M.G.G.; Banos, G.; Mrode, R.; McEwan, J.C.; Wall, E. Genetic parameters for predicted methane production and laser methane detector measurements. J. Anim. Sci. 2015, 93, 11–20. [Google Scholar] [CrossRef] [Green Version]
  14. Mühlbach, S.; Sorg, D.; Rosner, F.; Kecman, J.; Swalve, H. Genetic analyses for CH4 concentrations in the breath of dairy cows measured on-farm with the Laser Methane Detector. In Proceedings of the World Congress on Genetics Applied to Livestock Production, Auckland, New Zealand, 11–16 February 2018. [Google Scholar]
  15. Reintke, J.; Brügemann, K.; Yin, T.; Engel, P.; Wagner, H.; Wehrend, A.; König, S. Assessment of methane emission traits in ewes using a laser methane detector: Genetic parameters and impact on lamb weaning performance. Arch. Anim. Breed. 2020, 63, 113–123. [Google Scholar] [CrossRef] [Green Version]
  16. Vrancken, H.; Suenkel, M.; Hargreaves, P.R.; Chew, L.; Towers, E. Reduction of Enteric Methane Emission in a Commercial Dairy Farm by a Novel Feed Supplement. Open J. Anim. Sci. 2019, 9, 286–296. [Google Scholar] [CrossRef] [Green Version]
  17. Denninger, T.M.; Schwarm, A.; Dohme-Meier, F.; Münger, A.; Bapst, B.; Wegmann, S.; Grandl, F.; Vanlierde, A.; Sorg, D.; Ortmann, S.; et al. Accuracy of methane emissions predicted from milk mid-infrared spectra and measured by laser methane detectors in Brown Swiss dairy cows. J. Dairy Sci. 2020, 103, 2024–2039. [Google Scholar] [CrossRef]
  18. Kobayashi, N.; Hou, F.; Tsunekawa, A.; Yan, T.; Tegegne, F.; Tassew, A.; Mekuriaw, Y.; Mekuriaw, S.; Hunegnaw, B.; Mekonnen, W. Laser methane detector-based quantification of methane emissions from indoor-fed Fogera dairy cows. Anim. Biosci. 2021, 34, 1415–1424. [Google Scholar] [CrossRef] [PubMed]
  19. Pinto, A.; Yin, T.; Reichenbach, M.; Bhatta, R.; Malik, P.K.; Schlecht, E.; König, S. Enteric Methane Emissions of Dairy Cattle Considering Breed Composition, Pasture Management, Housing Conditions and Feeding Characteristics along a Rural-Urban Gradient in a Rising Megacity. Agriculture 2020, 10, 628. [Google Scholar] [CrossRef]
  20. Iseki, T. A portable remote methane detector using an InGaAsP DFB laser. Environ. Geol. 2004, 46, 1064–1069. [Google Scholar] [CrossRef]
  21. Tokyo Gas Engineering Solutions. SA3C50A, LaserMethane Mini-g Operating Manual. Available online: https://www.crowcon.com/wp-content/uploads/2018/12/SA3C50A-Manual.pdf (accessed on 29 November 2021).
  22. Crowcon Detection Instruments. LaserMethane Mini Specifications. Available online: https://www.crowcon.com/products/portables/lmm-gen-2/#specs (accessed on 26 November 2021).
  23. Tokyo Gas Engineering Solutions. GasViewer, Laser Methane Linked Software for Android Devices, Instruction Manual. Available online: https://www.crowcon.com/wp-content/uploads/2018/12/GasViwer-Eng-manual.pdf (accessed on 26 November 2021).
  24. Murray, R.; Bryant, A.; Leng, R. Rates of production of methane in the rumen and large intestine of sheep. Br. J. Nutr. 1976, 36, 1–14. [Google Scholar] [CrossRef] [PubMed] [Green Version]
  25. Muñoz, C.; Yan, T.; Wills, D.A.; Murray, S.; Gordon, A.W. Comparison of the sulfur hexafluoride tracer and respiration chamber techniques for estimating methane emissions and correction for rectum methane output from dairy cows. J. Dairy Sci. 2012, 95, 3139–3148. [Google Scholar] [CrossRef]
  26. Roessler, R.; Chefor, F.; Schlecht, E. Using a portable laser methane detector in goats to assess diurnal, diet- and position-dependent variations in enteric methane emissions. Comput. Electron. Agric. 2018, 150, 110–117. [Google Scholar] [CrossRef]
  27. Jonker, A.; Chagunda, M.G.G.; Grobler, M.; Waghorn, G.C.; Van Wyngaard, J.D. Hand-held laser methane detector to determine methane plume concentrations from ruminants. In Guideline for Estimating Methane Emissions from Individual Ruminants Using: GreenFeed, Sniffers, Hand-Held Laser Detector and Portable Accumulation Chambers; Jonker, A., Waghorn, G.C., Eds.; MPI Technical Paper; Ministry for Primary Industries: Wellington, New Zealand, 2020; pp. 41–47. [Google Scholar]
  28. Rooke, J.; Ricci, P.; Duthi, C.; Roehe, R.; Waterhouse, A. Measurements of methane using the laser methane detector are related to total daily methane output in beef cattle. In Emissions of Gas and Dust from Livestock; Hassouna, M., Guingand, N., Eds.; IFIP—Institut Technique du Porc: Paris, France, 2013; pp. 367–370. ISBN 978-2-85969-221-6. [Google Scholar]
  29. Doran, S. Development of Proxy Indicators of Methane Output by Sheep Using Rapid-Throughput Field and Laboratory Technologies. Ph.D. Thesis, Aberystwyth University, Aberystwyth, UK, 2014. [Google Scholar]
  30. Grobler, S.; Scholtz, M.; Van Rooyen, H.; Mpayipheli, M.; Neser, F. Methane production in different breeds, grazing different pastures or fed a total mixed ration, as measured by a Laser Methane Detector. S. Afr. J. Anim. Sci. 2014, 44, 12–16. [Google Scholar] [CrossRef]
  31. Roessler, R.; Schlecht, E. Application of the laser methane detector for measurements in freely grazing goats: Impact on animals’ behaviour and methane emissions. Animal 2021, 15, 100070. [Google Scholar] [CrossRef] [PubMed]
  32. Mapfumo, L.; Grobler, S.; Mupangwa, J.; Scholtz, M.; Muchenje, V. Enteric methane output from selected herds of beef cattle raised under extensive arid rangelands. Pastoralism 2018, 8, 1–8. [Google Scholar] [CrossRef] [Green Version]
  33. Bruder, T.; Rouillé, B.; Yan, T.; Chagunda, M.G.G. Towards a robust protocol for enteric methane measurements using a hand held Laser Methane Detector® in Ruminants. ICAR Tech. Ser. 2017, 22, 27–33. [Google Scholar]
  34. Sorg, D.; Mühlbach, S.; Kecman, J.; Swalve, H. Protocol for measuring CH4 concentrations with the laser methane detector in the breath of cows. In Proceedings of the 68th Annual Meeting of the European Federation of Animal Science, Tallinn, Estonia, 28 August–1 September 2017; p. 200. [Google Scholar]
  35. Sorg, D.; Difford, G.F.; Mühlbach, S.; Kuhla, B.; Swalve, H.H.; Lassen, J.; Strabel, T.; Pszczola, M. Comparison of a laser methane detector with the GreenFeed and two breath analysers for on-farm measurements of methane emissions from dairy cows. Comput. Electron. Agric. 2018, 153, 285–294. [Google Scholar] [CrossRef]
  36. Chagunda, M.G.G.; Ross, D.; Rooke, J.; Yan, T.; Douglas, J.-L.; Poret, L.; McEwan, N.R.; Teeranavattanakul, P.; Roberts, D.J. Measurement of enteric methane from ruminants using a hand-held laser methane detector. Acta Agr. Scand. A-An. 2013, 63, 68–75. [Google Scholar] [CrossRef]
  37. Falconer, D.; Mackay, T.F. Introduction to Quantitative Genetics, 4th ed.; Longman Group Ltd.: Harlow, UK, 1996. [Google Scholar]
  38. Ricci, P.; Chagunda, M.G.G.; Rooke, J.; Houdijk, J.G.M.; Duthie, C.-A.; Hyslop, J.; Roehe, R.; Waterhouse, A. Evaluation of the laser methane detector to estimate methane emissions from ewes and steers. J. Anim. Sci. 2014, 92, 5239–5250. [Google Scholar] [CrossRef]
  39. Della, M.R.; Jonker, A.; Waghorn, G. A review of technical variations and protocols used to measure methane emissions from ruminants using respiration chambers, SF6 tracer technique and GreenFeed, to facilitate global integration of published data. Anim. Feed Sci. Technol. 2021, 279, 115018. [Google Scholar] [CrossRef]
  40. Sorg, D.; Mühlbach, S.; Rosner, F.; Kuhla, B.; Derno, M.; Meese, S.; Schwarm, A.; Kreuzer, M.; Swalve, H. The agreement between two next-generation laser methane detectors and respiration chamber facilities in recording methane concentrations in the spent air produced by dairy cows. Comput. Electron. Agric. 2017, 143, 262–272. [Google Scholar] [CrossRef]
  41. Bell, M.J.; Craigon, J.; Saunders, N.; Goodman, J.R.; Garnsworthy, P.C. Does the diurnal pattern of enteric methane emissions from dairy cows change over time? Animal 2018, 12, 2065–2070. [Google Scholar] [CrossRef]
  42. Niero, G.; Cendron, F.; Penasa, M.; De Marchi, M.; Cozzi, G.; Cassandro, M. Repeatability and Reproducibility of Measures of Bovine Methane Emissions Recorded using a Laser Detector. Animals 2020, 10, 606. [Google Scholar] [CrossRef] [Green Version]
  43. Van Wyngaard, J.; Du Toit, C.; Meeske, R.; Erasmus, L.; Goemans, Z. Laser methane detector: Not a practical measurement tool for grazing dairy systems. In Proceedings of the South African Society for Animal Science, Port Elizabeth, South Africa, 18–21 September 2017; pp. 244–245. [Google Scholar]
  44. Chagunda, M.G.G. Opportunities and challenges in the use of the Laser Methane Detector to monitor enteric methane emissions from ruminants. Animal 2013, 7 (Suppl. S2), 394–400. [Google Scholar] [CrossRef] [Green Version]
  45. Chagunda, M.G.G.; Yan, T. Do methane measurements from a laser detector and an indirect open-circuit respiration calorimetric chamber agree sufficiently closely? Anim. Feed Sci. Technol. 2011, 165, 8–14. [Google Scholar] [CrossRef]
  46. Rey, J.; Atxaerandio, R.; Ruiz, R.; Ugarte, E.; González-Recio, O.; Garcia-Rodriguez, A.; Goiri, I. Comparison between non-invasive methane measurement techniques in cattle. Animals 2019, 9, 563. [Google Scholar] [CrossRef] [PubMed] [Green Version]
  47. Tukey, J.W. Exploratory Data Analysis; Addison-Wesley Publishing Company: Boston, MA, USA, 1977. [Google Scholar]
  48. Meinert, T.R.; Norman, H.D. Merit of Outliers for Milk Yield as Indicators of Accuracy of Genetic Evaluations of Sires. J. Dairy Sci. 1998, 81, 2951–2955. [Google Scholar] [CrossRef]
  49. Schmidt-Nielsen, K. Animal Physiology: Adaptation and Environment, 5th ed.; Cambridge University Press: Cambridge, UK, 1997. [Google Scholar]
  50. Washaya, S.; Mupangwa, J.; Muchenje, V. Chemical composition of Lablab purpureus and Vigna unguiculata and their subsequent effects on methane production in Xhosa lop-eared goats. S. Afr. J. Anim. Sci. 2018, 48, 445–458. [Google Scholar] [CrossRef]
  51. Kecman, J.; Heinicke, J.; Grütter, L.; Kuhla, B.; Swalve, H.H. Methane emissions from dairy cows measured using laser methane detector and respiration chambers. In Proceedings of the 72nd Annual Meeting of the European Federation of Animal Science, Davos, Switzerland, 30 August–3 September 2021; p. 123. [Google Scholar]
  52. Derno, M.; Elsner, H.G.; Paetow, E.A.; Scholze, H.; Schweigel, M. Technical note: A new facility for continuous respiration measurements in lactating cows. J. Dairy Sci. 2009, 92, 2804–2808. [Google Scholar] [CrossRef] [PubMed]
  53. Llonch, P.; Troy, S.M.; Duthie, C.-A.; Somarriba, M.; Rooke, J.; Haskell, M.J.; Roehe, R.; Turner, S.P. Changes in feed intake during isolation stress in respiration chambers may impact methane emissions assessment. Anim. Prod. Sci. 2016, 58, 1011–1016. [Google Scholar] [CrossRef] [Green Version]
  54. Brocklehurst, S.; Hargreaves, P.; March, M. Novel statistical methods to improve analysis of laser methane detector data. Proc. Br. Soc. Anim. Sci. Adv. Anim. Biosci. 2019, 10, 1–284. [Google Scholar] [CrossRef] [Green Version]
  55. de Haas, Y.; Veerkamp, R.F.; de Jong, G.; Aldridge, M.N. Selective breeding as a mitigation tool for methane emissions from dairy cattle. Animal 2021, 15, 100294. [Google Scholar] [CrossRef]
  56. Lassen, J.; Difford, G.F. Genetic and genomic selection as a methane mitigation strategy in dairy cattle. Animal 2020, 14, s473–s483. [Google Scholar] [CrossRef] [PubMed]
  57. Cameron, L.; Chagunda, M.; Roberts, D.; Lee, M. A comparison of milk yields and methane production from three contrasting high-yielding dairy cattle feeding regimes: Cut-and-carry, partial grazing and total mixed ration. Grass Forage Sci. 2018, 73, 789–797. [Google Scholar] [CrossRef]
  58. Reintke, J.; Brügemann, K.; Yin, T.; Wagner, H.; Wehrend, A.; Müller, A.; König, S. Associations between minerals and metabolic indicators in maternal blood pre-and postpartum with ewe body condition, methane emissions, and lamb body weight development. Animal 2021, 15, 100034. [Google Scholar] [CrossRef] [PubMed]
  59. Wu, L.; Koerkamp, P.W.G.; Ogink, N. Uncertainty assessment of the breath methane concentration method to determine methane production of dairy cows. J. Dairy Sci. 2018, 101, 1554–1564. [Google Scholar] [CrossRef] [PubMed] [Green Version]
Figure 1. (a) A laser methane detector (LMD, Tokyo Gas Engineering Solutions, Tokyo, Japan). (b,c) cows in different positions with the visible guiding laser pointed at their nostrils. (d) measurement with the LMD (source: D. Sorg).
Methane 01 00004 g001
Figure 2. A typical profile of CH4 in the breath of a cow, recorded with the laser methane detector. Peaks (arrows) with high CH4 concentration indicate exhalation. Two examples of an optional, easily calculated threshold to distinguish respiration and eructation values are shown by the dotted line (boxplot method [35]) and the dashed line (one standard deviation from the mean of all values in the profile [28]).
Methane 01 00004 g002
Table 1. Comparison of methods for measuring methane output by individual ruminants (adapted from [10] (p. 4)).
MethodPurchase CostRunning CostLabourRepeatabilityBehaviour AlterationThroughput
Respiration chamberHighHighHighHighHighLow
SF6 tracer gas techniqueMediumHighHighMediumMediumMedium
Breath analysers (“sniffers”)LowLowLowMedium NoneHigh
GreenFeedMediumMediumLowMediumLowMedium
Laser methane detectorLowLowHighLowLow–mediumMedium
Table 2. Selected, quantitative aspects of the measurement protocol for the laser methane detector.
VariableMinimum
Observed
Reference
(Example)
Maximum
Observed
Reference
(Example)
Distance to animal1 m[28]3 m[12]
Duration of recording15 s[12]10 min[29]
Measurement interval0.1 s[26]5 s[30]
Repeats per day1[14]6[31]
Repeats per animal1[14]72 (cow); 63 (goat)[26,32]
Consecutive days1[14]10[30]
Table 3. Possible point measurements (traits and phenotypes) that can be derived from data obtained with the laser methane detector.
CategoryPoint MeasurementExplanation 1
All valuesMeanBreath CH4 concentration including re-inhaled and exhaled eructation and background CH4 concentration during inhalation
NumberNot meaningful – number is pre-defined by measuring interval (e.g., 2 per s)
MaximumHighest single CH4 concentration
SumCumulative CH4 concentration including background
PeaksMeanBreath CH4 concentration including re-inhaled and exhaled eructation CH4 without background
NumberProxy for breath frequency (not for CH4 emission)
SumCumulative breath CH4 concentration without background
Respiration peaks 2MeanBreath CH4 concentration without eructation
NumberBreath frequency but without times of eructation—physiologically not meaningful
MaximumHighest non-eructation CH4 peak
SumCumulative breath CH4 concentration without eructation and background
TimeDuration of respiration
PercentageOf respiration peaks from all peaks in a recording—can be used to validate physiological plausibility of the data
Eructation peaksMeanBreath CH4 concentration from eructation only
Number Breath frequency during eructation—physiologically not meaningful
MaximumHighest single CH4 concentration (same as for “all values”)
SumCumulative breath CH4 concentration from eructation only
TimeDuration of eructation
PercentageOf eructation peaks from all peaks in a recording—can be used to validate physiological plausibility of the data
Eructation eventsMean of the maximaSeries of the highest CH4 concentrations
NumberEructation frequency—not a real CH4 phenotype but can be used to validate physiological plausibility of the data
MaximumHighest single CH4 concentration (same as for “all values”)
Sum of the maximaCumulative breath CH4 concentration from the series of the highest CH4 concentrations
1 according to the author’s assessment and other studies [12,13,14,15,17,18,19,26,28,30,35,38,42,46]. 2 Separation into respiration and eructation can also be done with all values but would include background CH4 during inhalation.
Publisher’s Note: MDPI stays neutral with regard to jurisdictional claims in published maps and institutional affiliations.

