Article

The Status of the Astrophysical Parameters of Upper Main Sequence Stars

1
Department of Astrophysics, Vienna University, Türkenschanzstraße 17, A-1180 Vienna, Austria
2
Department of Theoretical Physics and Astrophysics, Faculty of Science, Masaryk University, Kotlářská 2, Brno 611 37, Czech Republic
*
Author to whom correspondence should be addressed.
Astronomy 2025, 4(3), 15; https://doi.org/10.3390/astronomy4030015
Submission received: 13 June 2025 / Revised: 6 August 2025 / Accepted: 13 August 2025 / Published: 22 August 2025

Abstract

Calibrating the ages, masses, and radii of stars on the upper main sequence depends heavily on accurate measurements of the effective temperature ( T eff ) and surface gravity ( log g ). These parameters are difficult to obtain meticulously due to the nature of hot stars, which exhibit features such as rapid rotation, atomic diffusion, pulsation, and stellar winds. We compare the T eff and log g values of apparent normal B-F stars in four recent catalogues that employ different methods and pipelines to obtain these parameters. We derived various statistical parameters to compare the differences between the catalogues and discussed the astrophysical implications of these differences. Our results show that the huge differences in T eff (up to 10 4 K) and log g (up to 2 dex) between the catalogues have serious implications on the determination of ages, masses, and radii of the stars in question. We conclude that there appears to be no homogeneous set of stellar parameters on the upper main sequence, and one must be cautious when interpreting results obtained from using only one of the catalogues. The homogenisation of said parameters is an essential task for the future and will have a significant impact on astrophysical research dealing with stars on the upper main sequence.

1. Introduction

The upper main sequence of stars is populated by core hydrogen-burning objects with masses larger than approximately 1.4M. Their stellar atmospheres are typically characterised by no, or only thin, convection layers, with the flux transported bradiation [1]. These thin convection layers of helium and iron are essential for driving pulsations in these stars [2]. The disappearance of general convection in stellar atmospheres is believed to happen around 6800 K, or a spectral type of about F2 V [3].
With this abrupt offset of strong convection in the atmospheres and envelopes, the overall rotational velocities change, and processes like diffusion, meridional circulation, and mass loss become important [4]. Furthermore, strong (up to tens of kG) stable magnetic fields complicate the proper description of the stellar atmospheres [5]. With objects of the upper main sequence, several important astrophysical processes can be studied in more detail. The δ Scuti variables show pulsation driven mainly through the opacity κ mechanism operating in the helium-ionising zone. For the cooler pulsating stars, coupling between convection and pulsation is critical. It affords an explanation for the γ Doradus variables located at the red border of the classical pulsation strip [6]. The hotter β Cephei variables (spectral types between O9 and B4) are driven by the opacity mechanism operating in the partial ionisation zone of iron-like metals. The exact mechanism is responsible for the Slowly Pulsating B-type (SPB) stars. In these less massive stars, the iron opacity bump is located in a deeper layer [7]. Another essential aspect of upper main sequence stars is chemical peculiarity.
They were identified by Maury and Pickering [8]. Most initial scientific inquiry was concerned with identifying distinctive attributes within their spectra and thoroughly assessing their photometric patterns. The ingredients for this phenomenon are chemical separation, diffusion effects, atmospheric mixing, stellar winds, and accretion in the (non-) presence of an organised stellar magnetic field [9,10].
For many applications in astronomical research, it is important to have accurate estimations of astrophysical parameters. Among these parameters are two crucial values that determine the properties of a star and its location in the Hertzsprung–Russell diagram (HRD): (i) the effective temperature, T eff in [K], and (ii) the surface gravity, log g in dex, derived from g in [cm s−2].
Let us recall that surface gravity is not independent of the effective temperature but can be expressed as
log g = log M + 4 log T eff log L
including the stellar mass (M) and luminosity (L). Notice that there exists a dependence of rotation on the mass and luminosity [11,12].
In the literature, many calibrations for lower main sequence stars exist [13,14]. In contrast, upper main sequence stars have mainly been calibrated using the Strömgren–Crawford and Geneva photometric systems [15,16]. The reasons are manifold, mainly because consistent models considering all the astrophysical processes described above are unavailable. Furthermore, as the peak of the blackbody radiation curve shifts more to the blue and ultraviolet region (the Balmer jump is at its maximum at 10,000 K), the effect of interstellar reddening, i.e., the UV bump [17] becomes significant. This is important for calculating absolute fluxes and fitting the spectral energy distribution [18].
Another important aspect is the metallicity and its influence on the stellar formation and evolution [19]. The composition of a star changes its effective temperature and luminosity for the same mass and age. The spread of metallicity in the solar neighbourhood [20] and among members of open clusters [21] is within a factor of ten on the main sequence. Other aspects are different stellar populations [22] and the metallicity gradient within the Milky Way due to radial elemental migration [23].
In this paper, we assess the current status of the basic astrophysical parameters T eff and log g taken from four available and widely used corresponding catalogues. For this, we defined a sample of “normal” upper main-sequence stars based on spectra from the Large Sky Area Multi-Object Fiber Spectroscopic Telescope (LAMOST, [24]). Then, we investigated the differences between the objects in common, searched for offsets, and derived statistical parameters of the distributions. To our knowledge, this is the first such attempt, and we could not find any mention in the literature that discusses the discrepancies of stellar parameters in different catalogues.
We have not investigated the metallicities included in the four references. This is caused by the very different definitions of metallicity, such as [Fe/H], [Z], and [M/H]. It is simply impossible to transform these different values into one standard system. In fact, this is an essential task for the future.
We discuss the possible effects of measured projected rotational velocity ( υ sin i ) and compare some astrophysical relations dependent on these parameters.

2. Target Selection and Catalogues

We started our target selection with stars from the so-called Golden OBA sample by Gaia Collaboration et al. [25], which were observed within the LAMOST survey. Furthermore, we included stars with temperatures higher than 6000 K from the LAMOST LRS DR9 Stellar Parameter Catalog of A, F, G, and K Stars.
The LAMOST DR9 low-resolution spectra have a spectral resolution of R ∼1800 and cover the wavelength range from 3700–9000 Å. We used only spectra with a signal-to-noise ratio (S/N) larger than 50 in g. This lower boundary was chosen based on the fact that spectra with lower S/N can result in misclassification in the following step. Spectral classifications were derived with the modified MKCLASS code (MKCLASS is a computer program in C used to classify stellar spectra on the Morgan–Keenan–Kellman (MKK) spectral classification scheme [26]. The installation guide and further information can be accessed at https://www.appstate.edu/~grayro/mkclass/ (URL accessed on 27 October 2024) of Hümmerich et al. [27], specifically adapted to detect chemically peculiar stars. Discarding all stars with a peculiar classification and luminosity classes between III and I (non-main-sequence objects), we obtained a sample of 63,660 objects.
The following four sources of astrophysical parameters were used for our analysis. They include widely different data sets and algorithms for their calculations.
Anders et al. [28,29] [StarHorse2021]: They combined parallaxes and photometry from the G a i a DR3 with the photometric catalogues of Pan-STARRS 1 [30], 2MASS [31], AllWISE [32], and SkyMapper DR2 (Onken et al. [33]) [without the u filter] to derive Bayesian stellar parameters, distances, and extinctions. For this purpose, the StarHorse code [34] was applied. This is a Bayesian parameter estimation code that compares many observed quantities to stellar evolutionary models. Given the set of observations plus several priors, it finds the posterior probability over a grid of stellar models, distances, and extinctions. It was concluded that the systematic errors of the astrophysical parameters are smaller than the nominal uncertainties for most objects. We refer to this catalogue as “StarHorse” or “SH21” in the text and figures.
Fouesneau et al. [35] [Gaia DR3 Apsis]: This is the pipeline software (Astrophysical Parameter Inference System, Apsis) developed by the G a i a consortium. They analysed astrometry, photometry, BP/RP, and RVS spectra for objects across the Hertzsprung–Russell diagram. Their method was compared and validated with star cluster data, asteroseismological results, and several other references. It is claimed that despite some limitations, this is the most extensive catalogue of uniformly inferred stellar parameters to date.
Li et al. [36] [LASSO-MLPNet]: They used a neural network-based scheme to deliver atmospheric parameters from low-resolution stellar spectra of LAMOST. They used a polynomial fitting method to estimate and remove the pseudo-continuum for every spectrum. Secondly, they detected parameter-sensitive features using the Least Absolute Shrinkage and Selection Operator (LASSO). This evaluates the effectiveness of spectral features based on the combined effects of spectral fluxes and the noise overlapped on them. Finally, they proposed a multilayer perceptron neural network-based method (MLPNet) to estimate the stellar atmospheric parameters. There is a restriction on the T eff range to 13,000 K, or a spectral type of B8 V.
Stassun et al. [37] [The Revised TESS Input Catalog]: This procedure is based on the apparent magnitude in the T E S S bandpass (T), taking into account the stellar evolutionary phases (dwarfs, subgiants, and giants divided by their log g values). In their analysis, they used PHOENIX model atmospheres [38], combining photometric and spectroscopic data with Gaia DR2 and 2MASS calibrations. All calibrations are listed in Stassun et al. [39]. For our analysis, we used v8.2 of the catalogue. This catalogue is called “TIC” in our work.
The rotational velocities were taken from two catalogues. The first is from [40], who took spectra from the LAMOST DR9 medium-resolution survey (MRS) and inferred the parameters T eff , log g , υ sin i , and [ M / H ] via the Stellar LAbel Machine (SLAM, [41]), which was trained on ATLAS12 [42] atmospheres beforehand.
The second catalogue that includes rotational velocities is from [43]. Here, the authors used spectra from the low-resolution survey (LRS) and MRS and from LAMOST DR9. The rotational velocities were derived by fitting synthetic PHOENIX spectra [38] to the observed ones. The method was validated on the Apache Point Observatory Galactic Evolution Experiment [44].
In Figure 1, we plot the Kiel diagram for 31,503 stars that are listed in each of the four catalogues in our analysis. It is easy to see that there are significant inhomogeneities between the samples.

3. Methods

3.1. Kinematic Selection

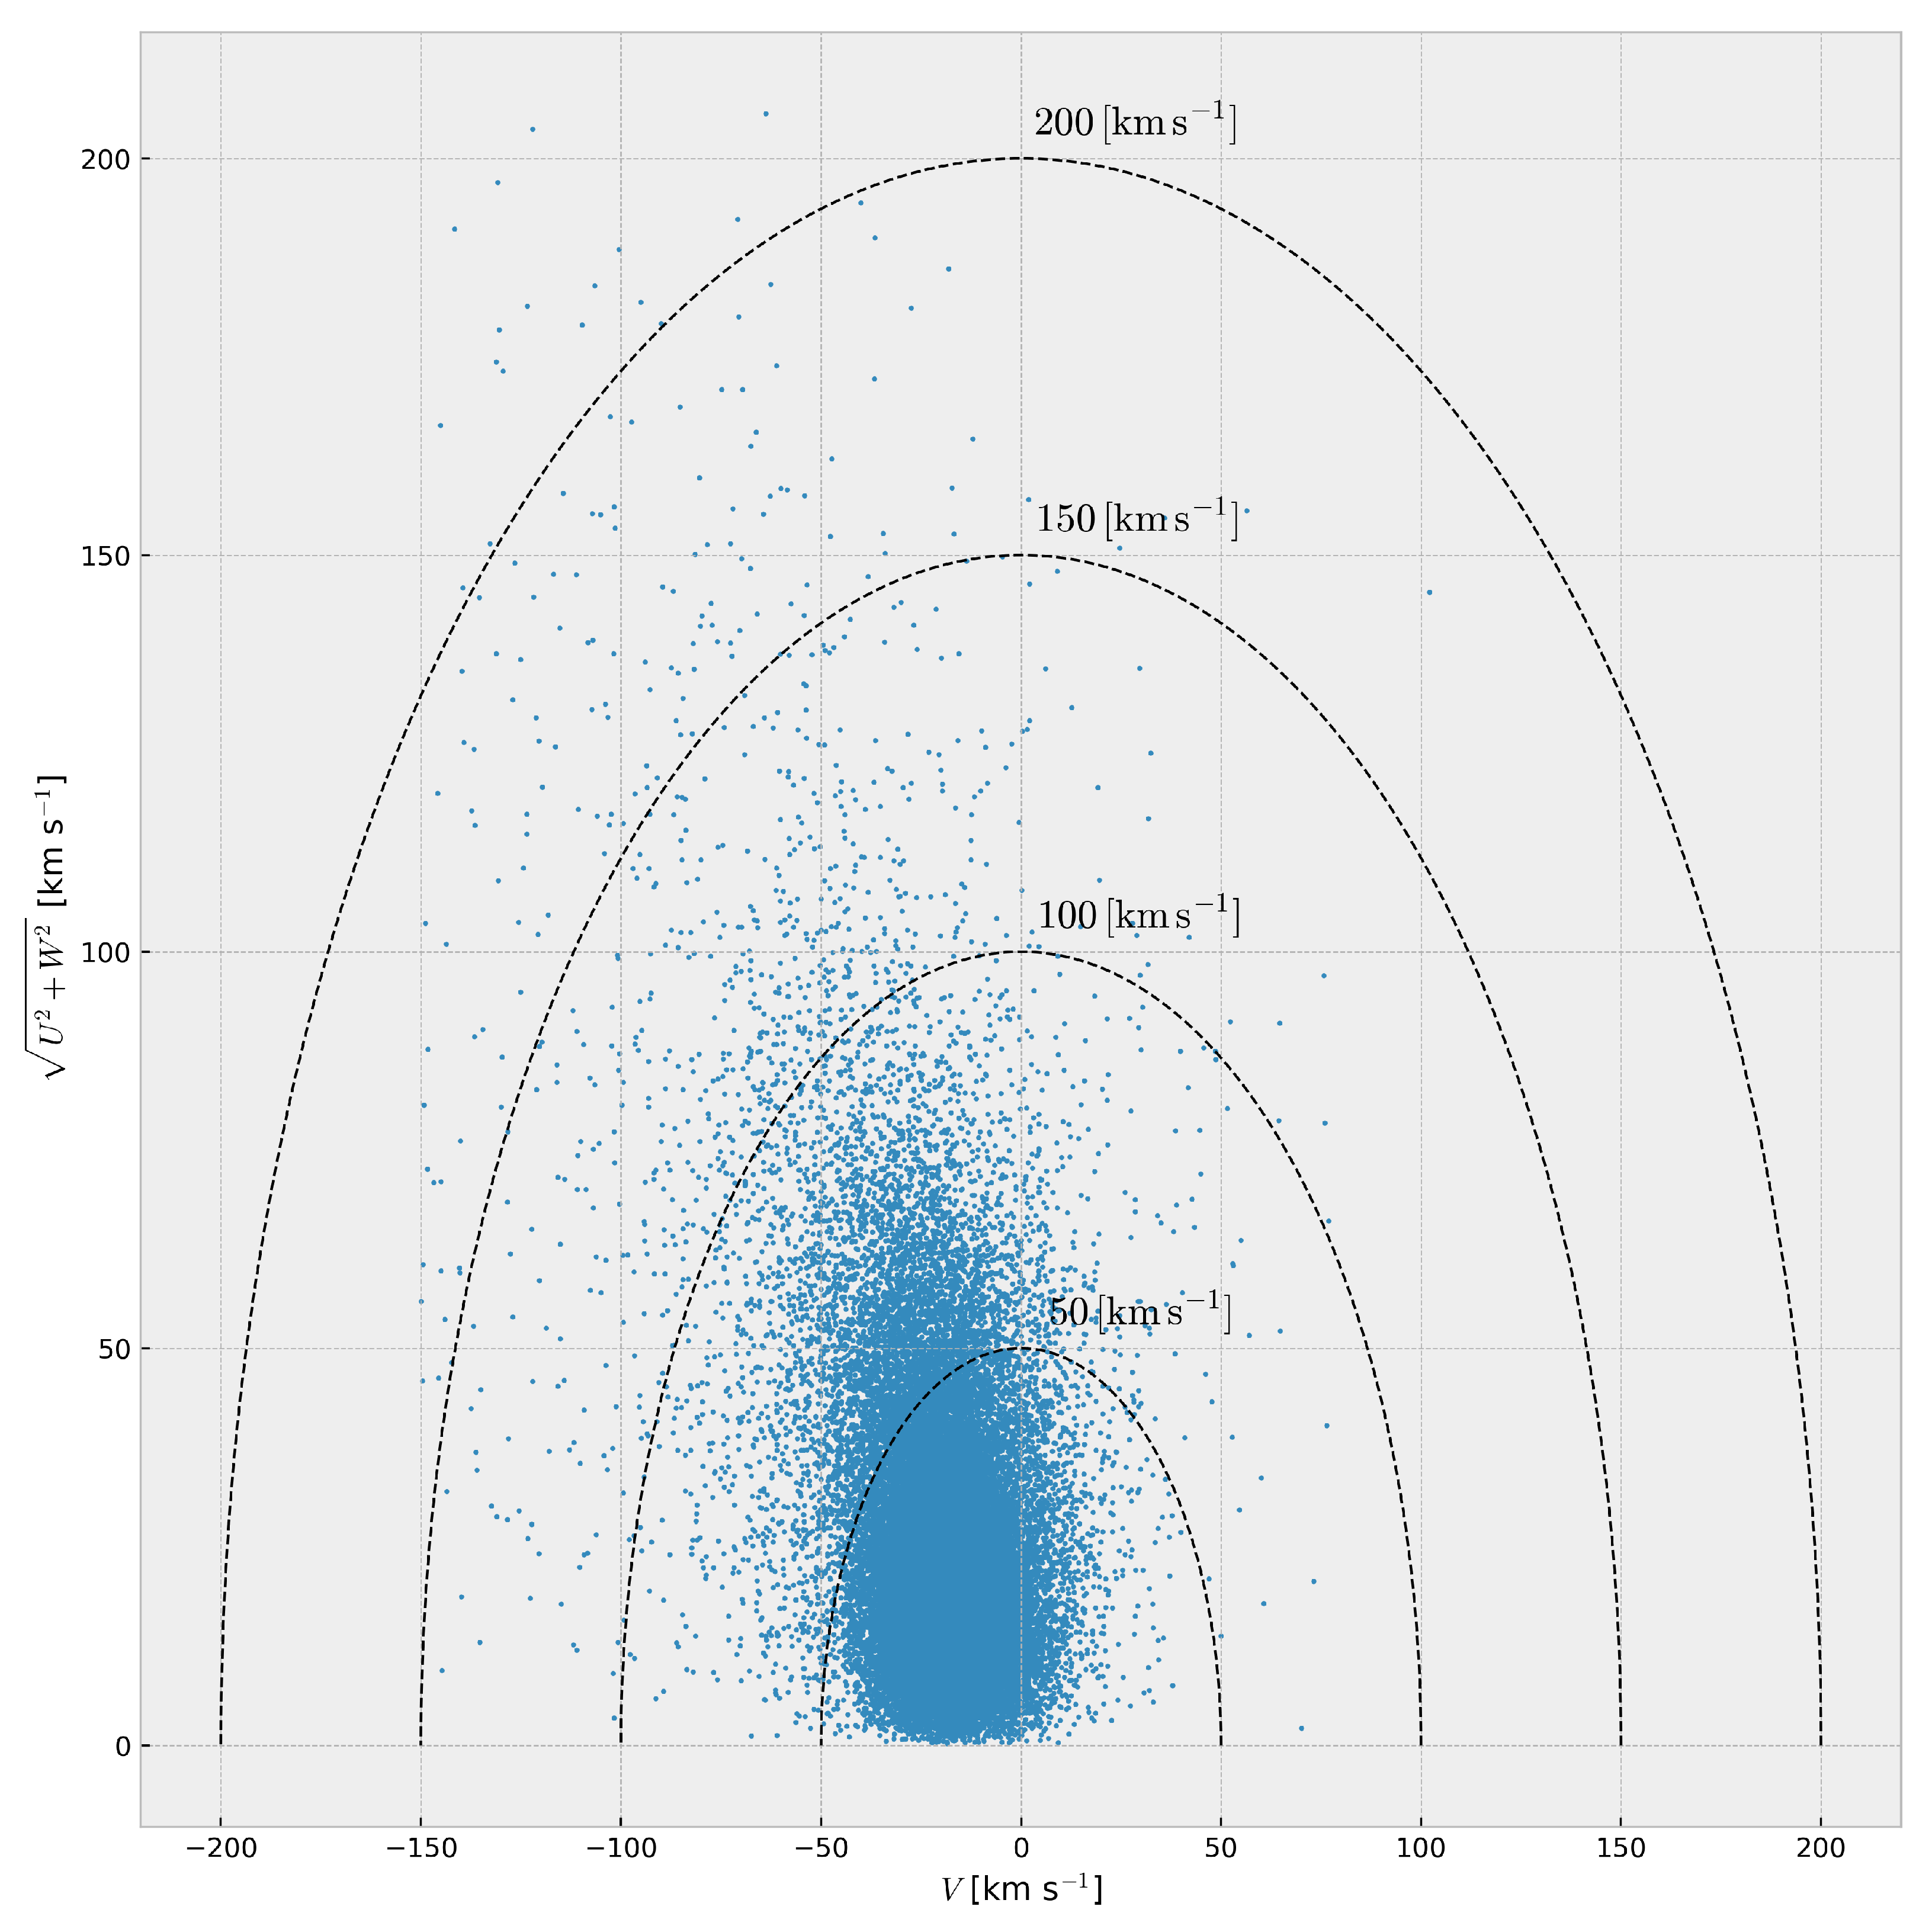
To discriminate between the stars of Population I (galactic disk) and II (galactic halo) in the list of stars that are mentioned in all catalogues, we made some cuts in the spatial velocities U, V, and W. For this, we utilised a Toomre diagram. We used the criterion of Bensby et al. [45] to identify the populations, which included a cut at V t o t = U L S R 2 + V L S R 2 + W L S R 2 = 200 km s 1 . Stars with V t o t < 200 km s 1 are considered to be in the galactic (thin and thick) disk, while stars with V t o t > 200 km s 1 are likely halo stars and thus belong to Pop II. Figure 2 shows the Toomre diagram with lines of equal total velocity V t o t . Note that there are very few stars outside the boundary of V t o t = 200 km s 1 . Keeping them in the sample would not lead to differences in our results in a significant way.

3.2. Extinction Measurements

A common practice is using photometric calibrations to derive astrophysical parameters [46,47]. For this, an estimation of the reddening (extinction, or absorption) mainly caused by interstellar dust is needed. An error in determining the reddening will have severe consequences, for example, for drawing colour magnitude diagrams and determining astrophysical parameters, such as the effective temperature, luminosity, mass, and age [48,49]. Most of the references discussed in this paper also present reddening estimates in different wavelength bands. However, these estimates must also be treated with caution. We analysed the listed values as a supplement to the published astrophysical parameters.
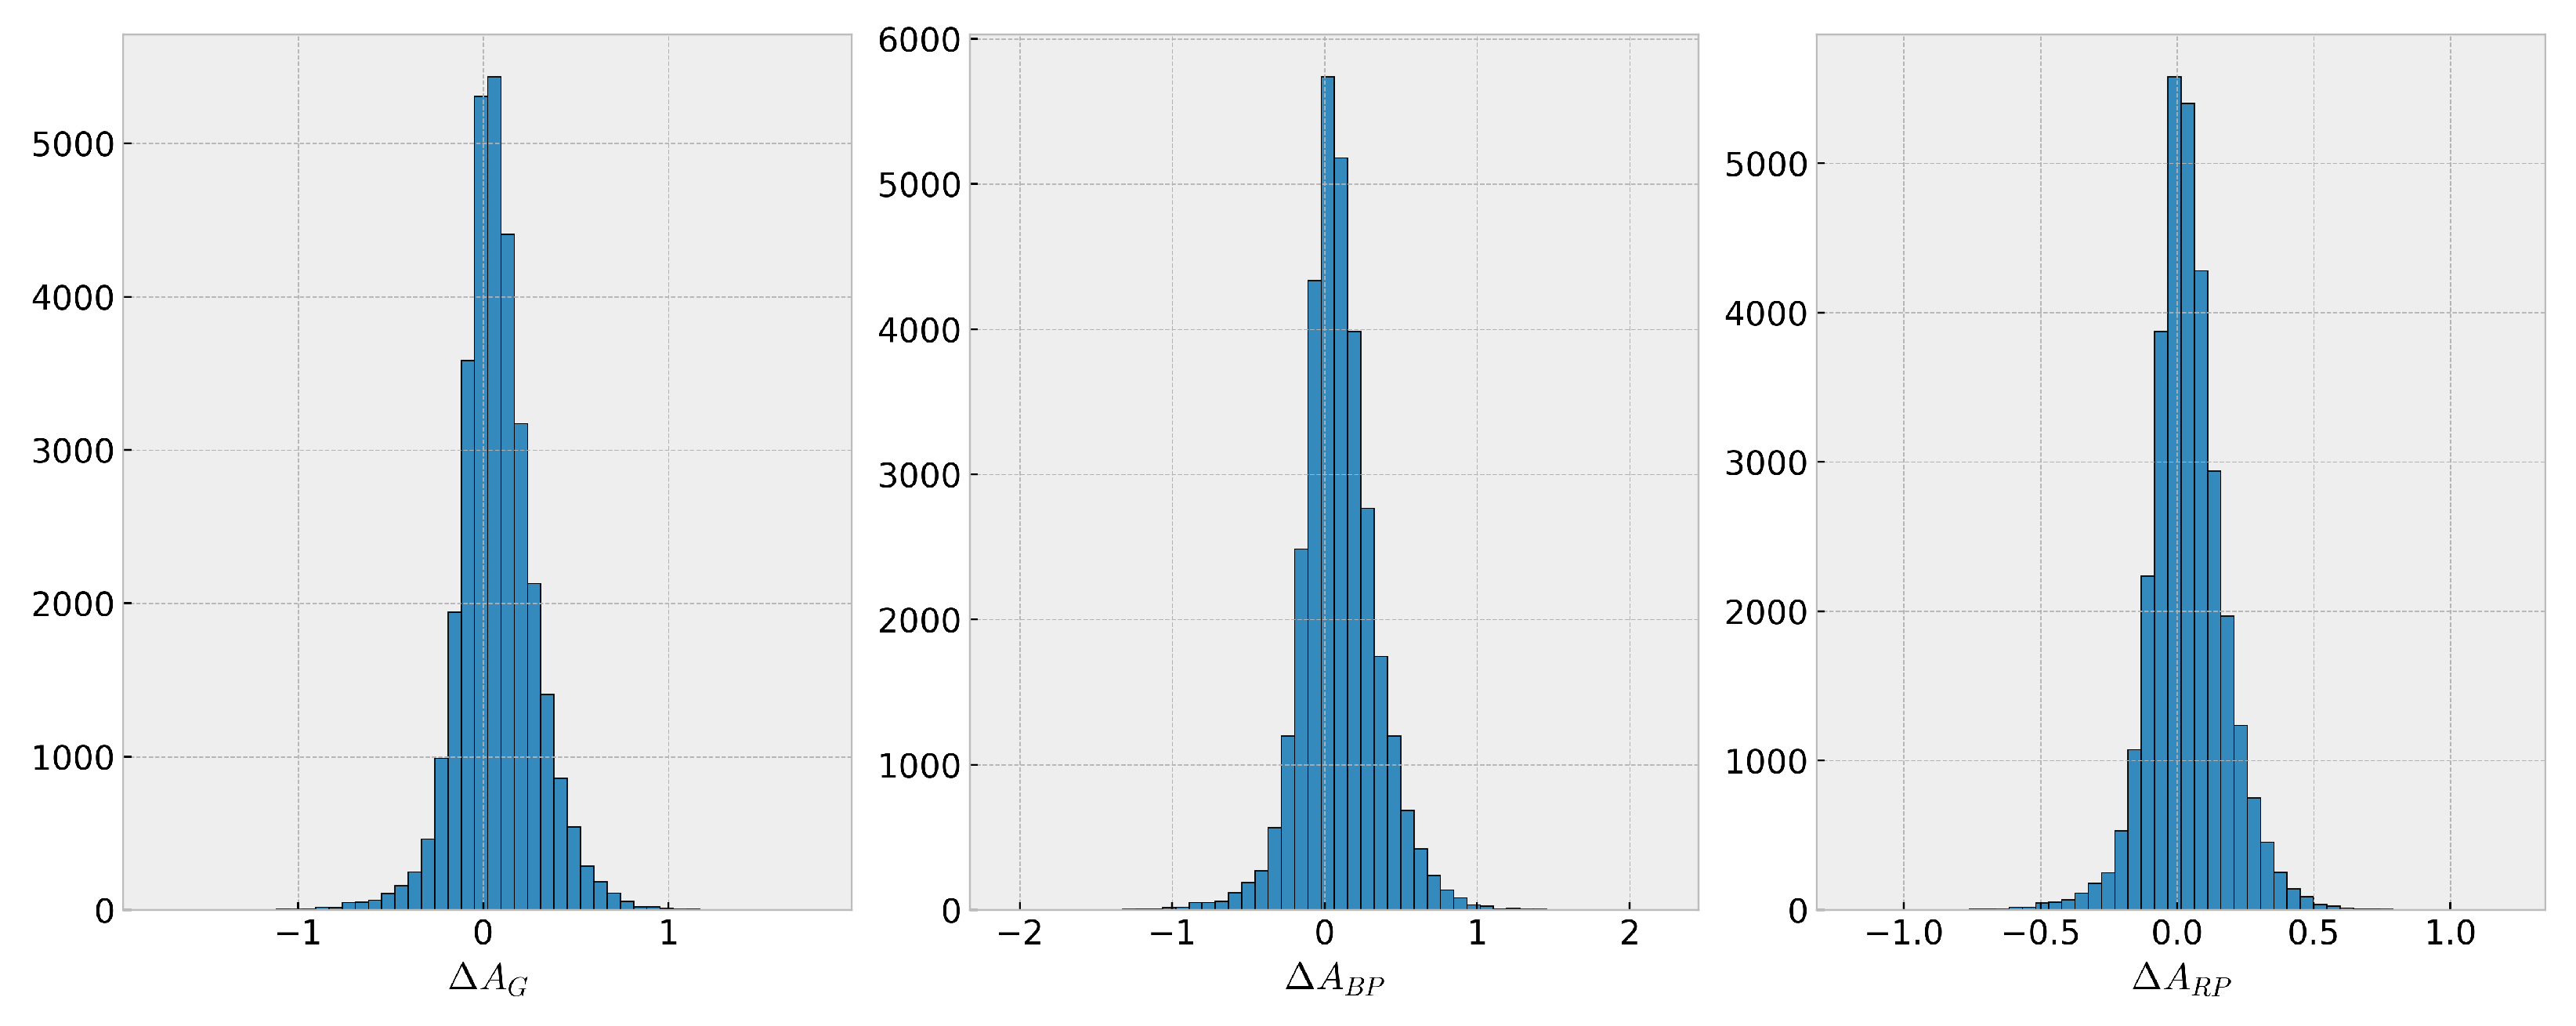
As an example, we compare the G a i a DR3 extinction measurements ( A G , A B P , A R P ) to the ones derived by S t a r H o r s e 2021 . A histogram of the differences can be seen in Figure 3.
In the end, we also calculated a few key statistical properties of the distribution:
  • Mean ( μ );
  • Standard deviation ( σ );
  • Skewness ( γ 1 );
  • Kurtosis ( γ 2 ).
Skewness measures, if a dataset is symmetric with respect to its mean. A commonly used criterion is that a distribution is considered symmetric if that parameter lies in the interval γ 1 [ 0.5 , 0.5 ] . Kurtosis measures the shape of the tails of the distribution or how much a specific dataset is spread around the mean.
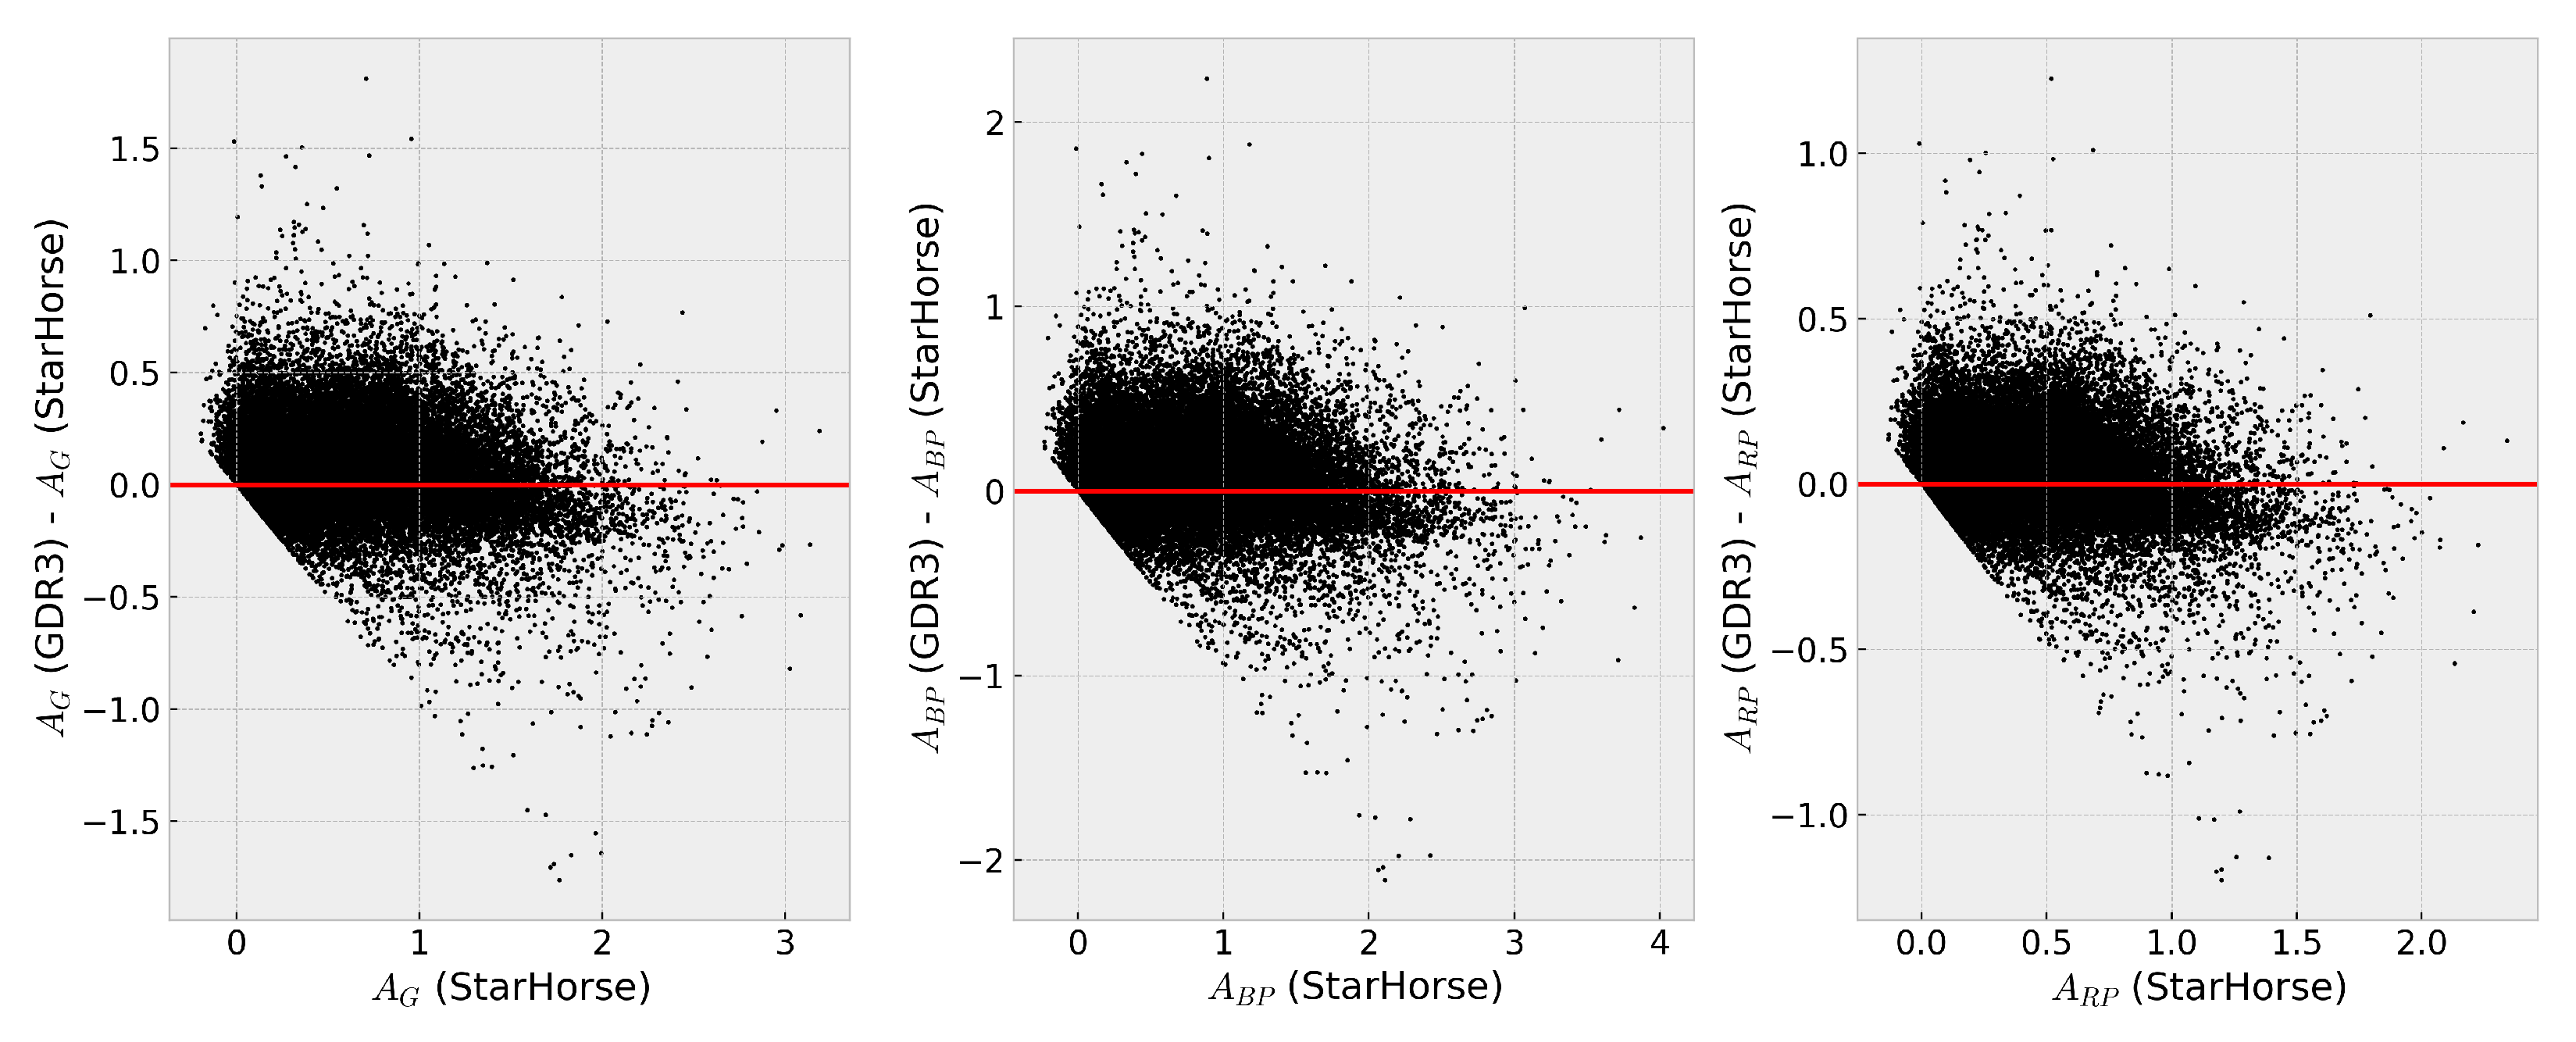
Figure 4 shows the differences as a function of the extinction measurements from S t a r H o r s e 2021 and Table 1 shows some statistical properties of these distributions. There is a clear-cut trend in the scatter plot. From the references, we were not able to deduce the reason for it. However, it shows that one must be very cautious using the published reddening values of individual objects.

4. Results

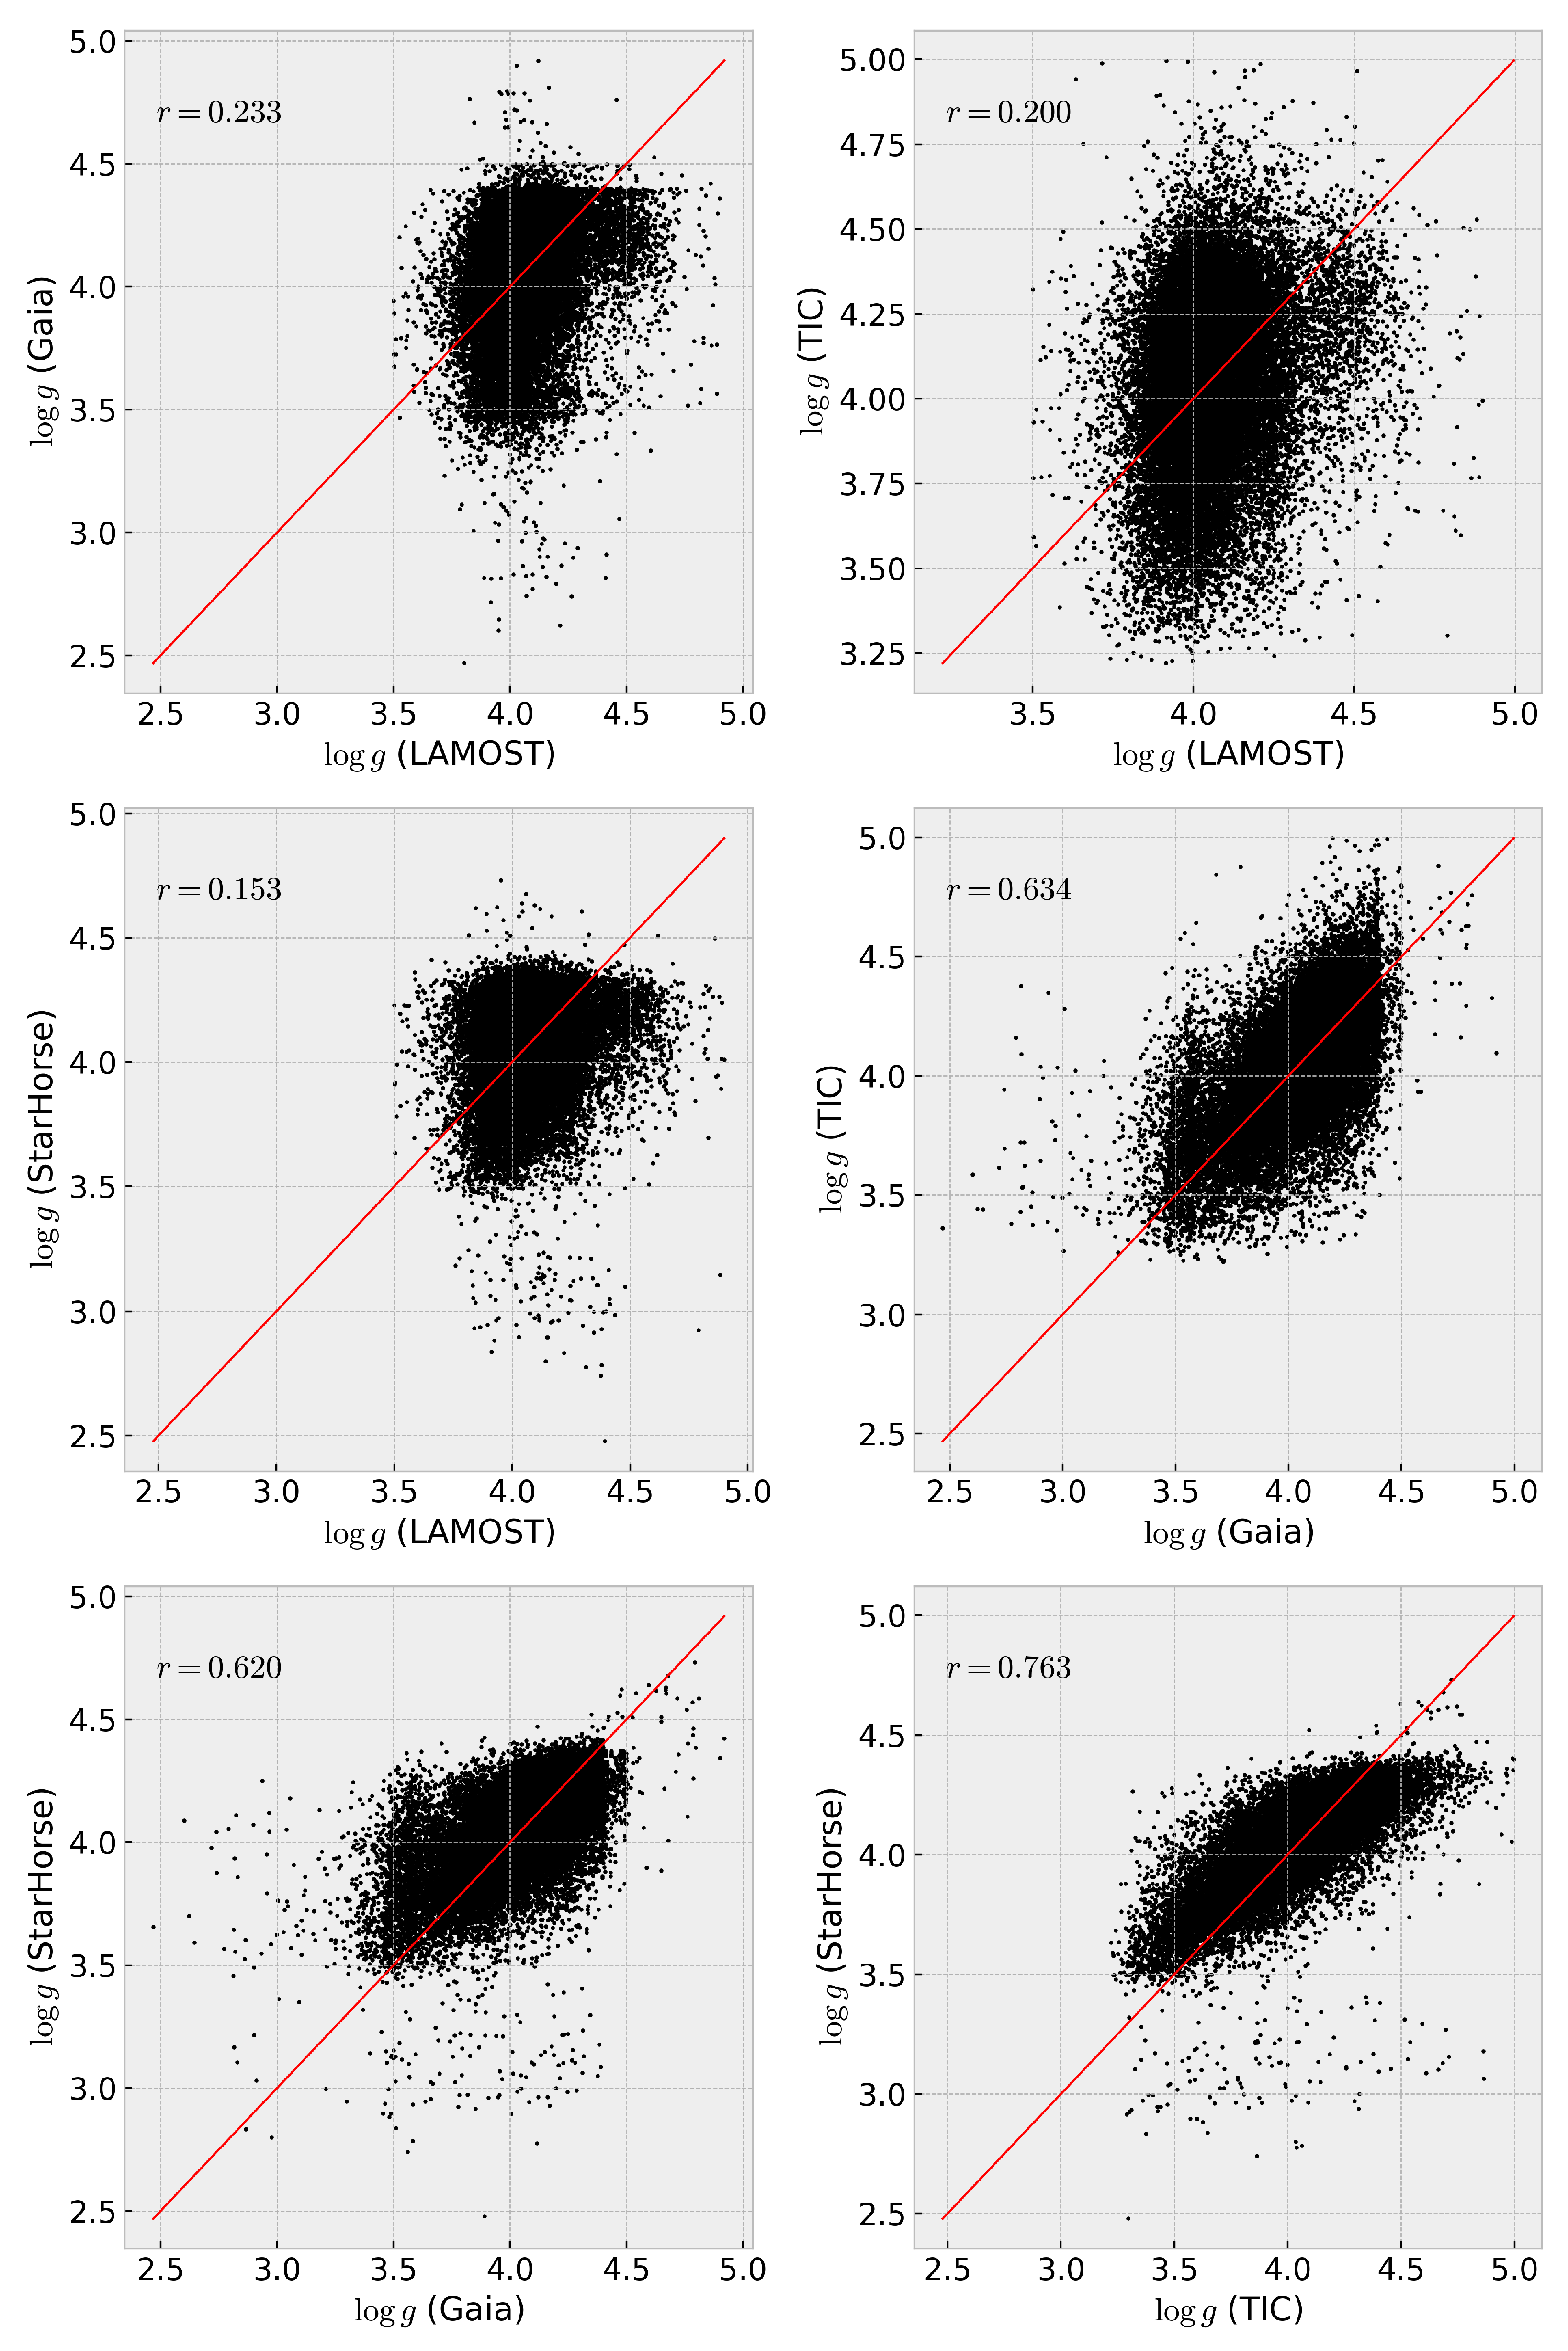
In total, 31,503 stars have data for T eff and log g in all four catalogues. This is about half of our initial sample. This number results in cross-matching losses and using only the stars that have both, T eff and log g values listed. We compared the parameters by simply plotting them as a function of each other. The resulting diagrams can be seen in Figure 5 for the effective temperature and in Figure 6 for the surface gravity. The red line in each subplot shows a 1:1 relationship, and the r-value in the plot denotes the Pearson coefficient of the relation, given by
r = c o v ( X , Y ) σ X σ Y
Additionally, we plotted the Kiel diagrams (HRDs) for these 31,503 stars in each of the catalogues (Figure 1).

4.1. Effective Temperature

As one can readily see (Figure A1), there is a considerable discrepancy between the T eff values derived in each catalogue, up to multiple thousands, in a few cases up to Δ T eff = 10 4 K.
One can see in Table 2 that the mean values of the distributions, which ideally would be close to zero, are shifted by up to ∼460 K, and the standard deviations are large (570–720 K). This cannot be explained by errors in the data and the estimation of T eff but may be due to systematic deviations in the different catalogues and their respective methods. It can also be seen that all but two comparisons (LAMOST–Gaia and SH21–TIC) are skewed to one side. This and the relatively large also suggest the possibility of outliers that influence the shape of the distributions. Some of these outliers can be seen in Figure 5.

4.2. Surface Gravity

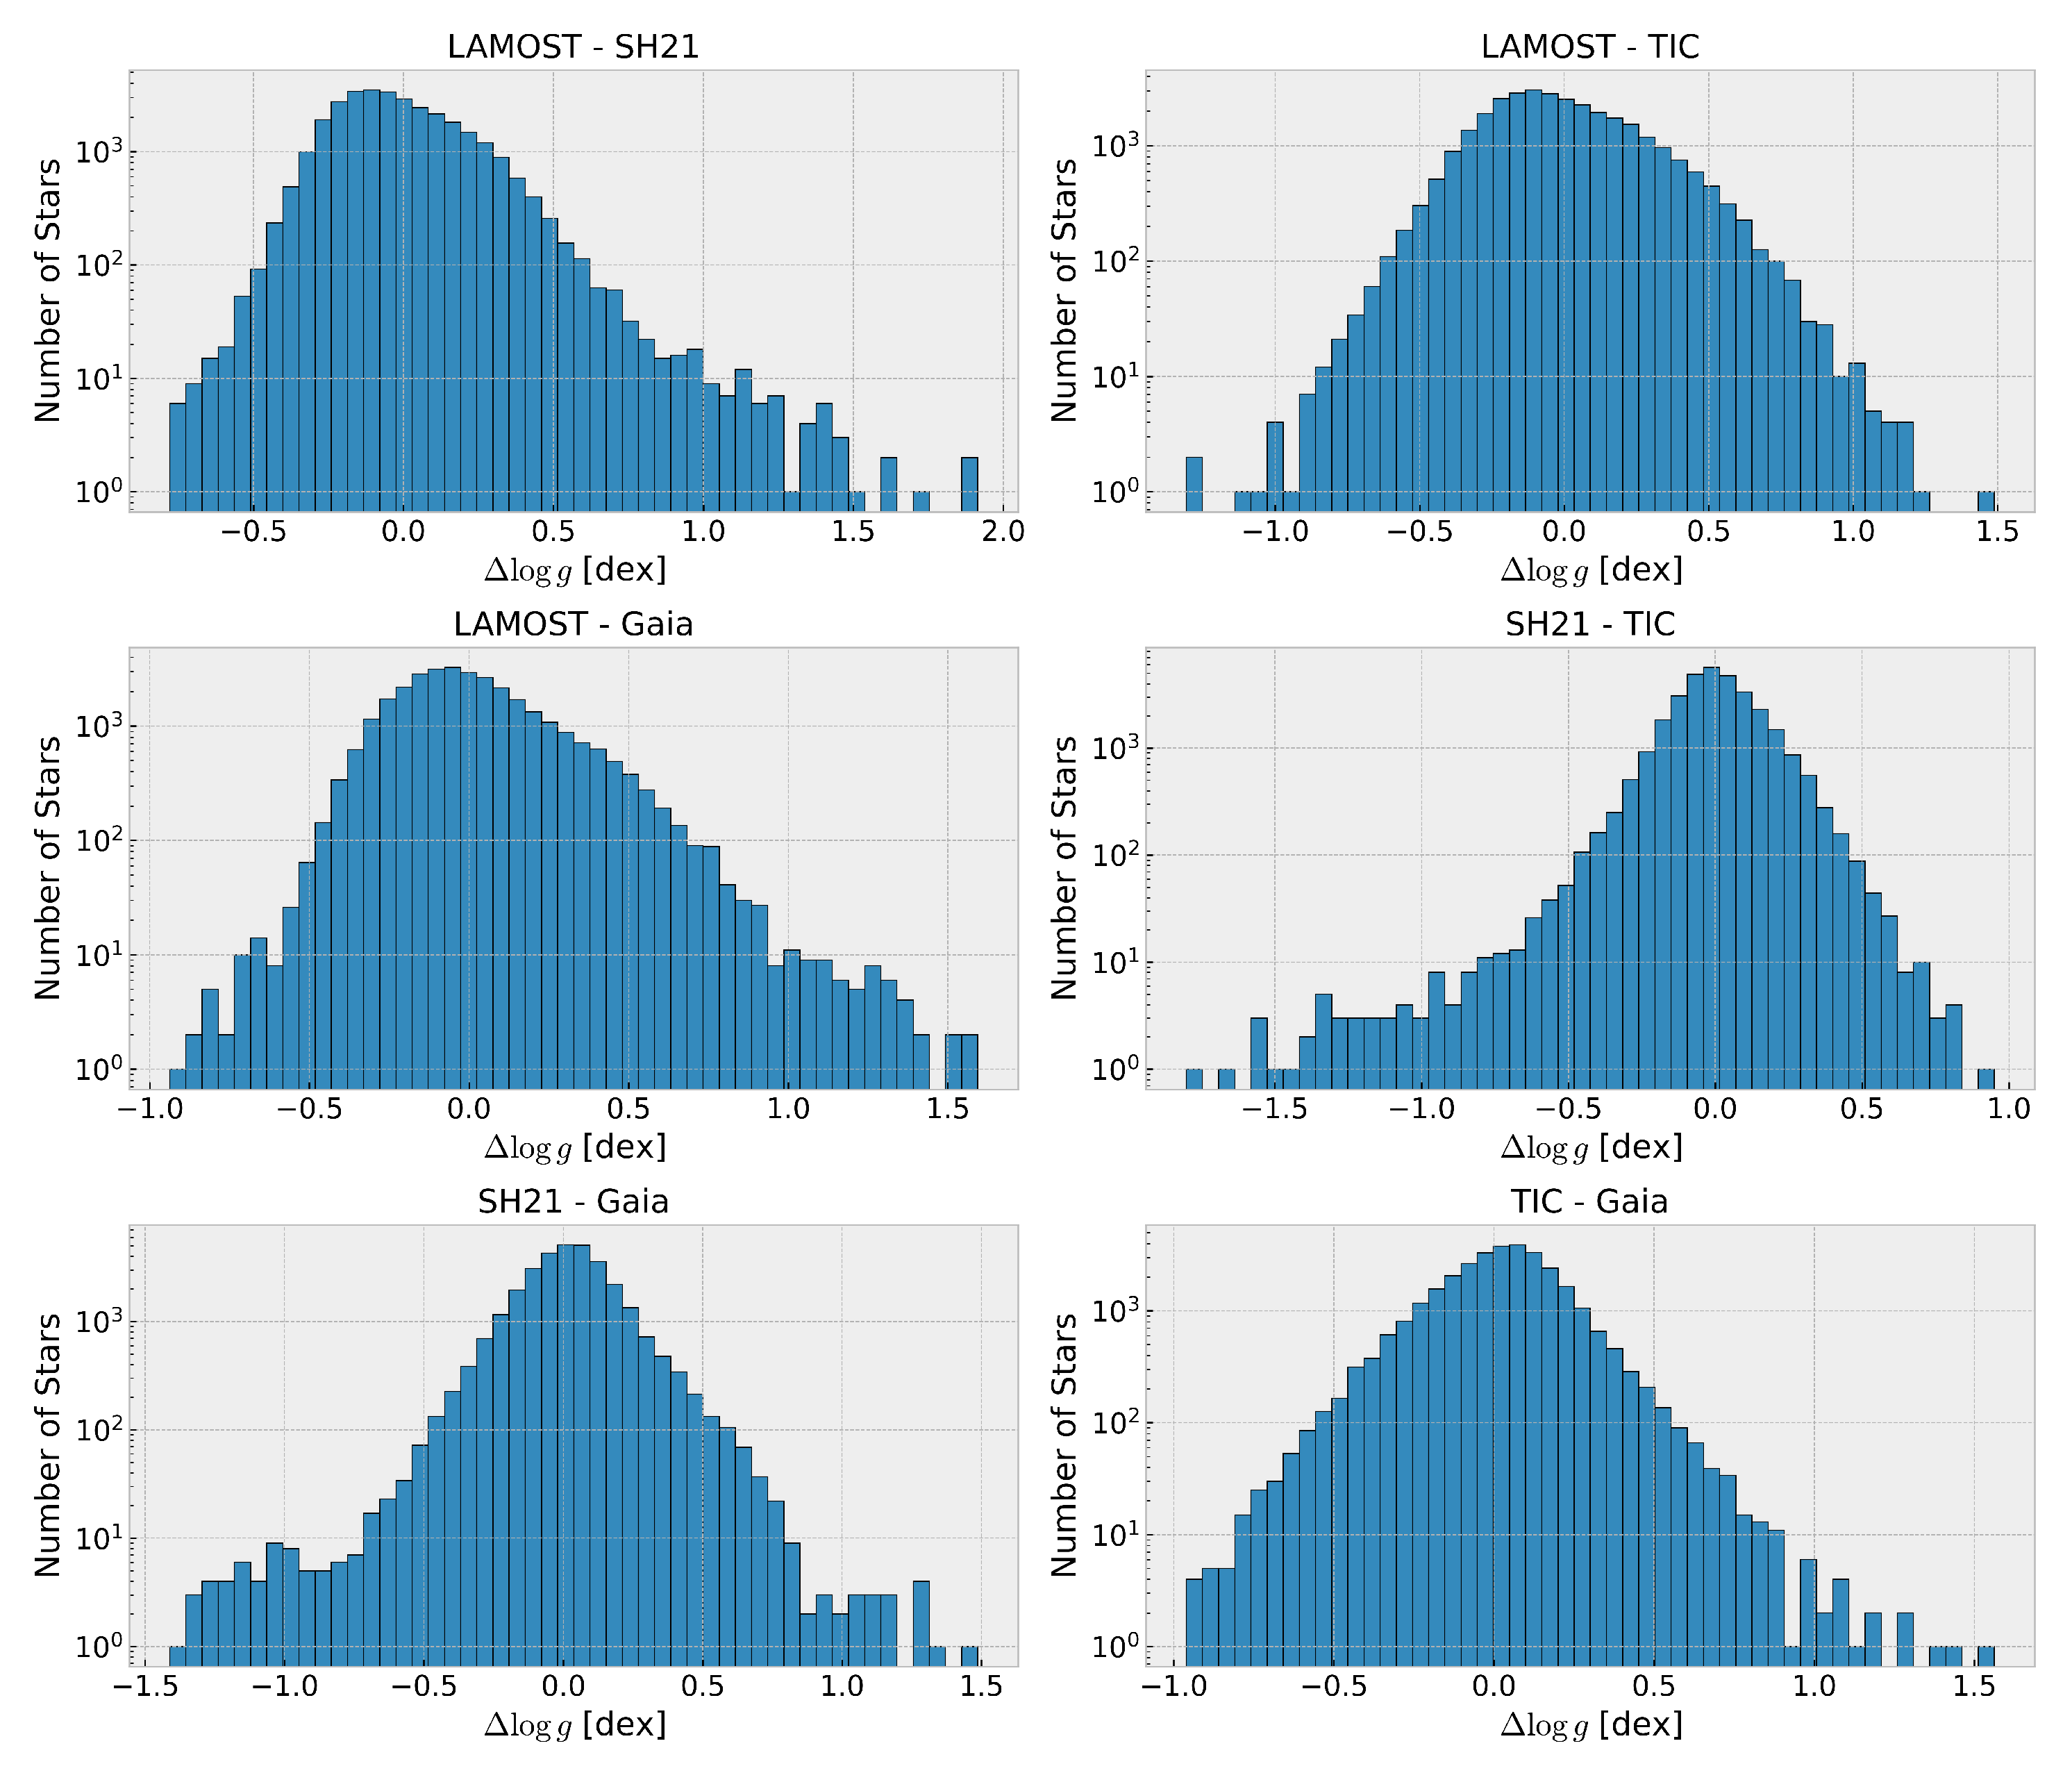
A similar picture is given in the distributions of Δ log g . The differences are as large, as Δ log g = 2.0 dex, meaning a factor of 100 in the difference of the surface gravity (Figure 6). The statistical analysis reveals that three distributions (SH21–TIC, SH21–Gaia, and TIC–Gaia) are symmetric in Table 3.
Here, the mean values agree more, but the standard deviation is also relatively large at values up to 0.251 dex. This is almost a factor two in the difference of dex in log g . Again, this cannot simply be explained by errors in data and numerical errors in processing them.

4.3. Correlation with υ sin i

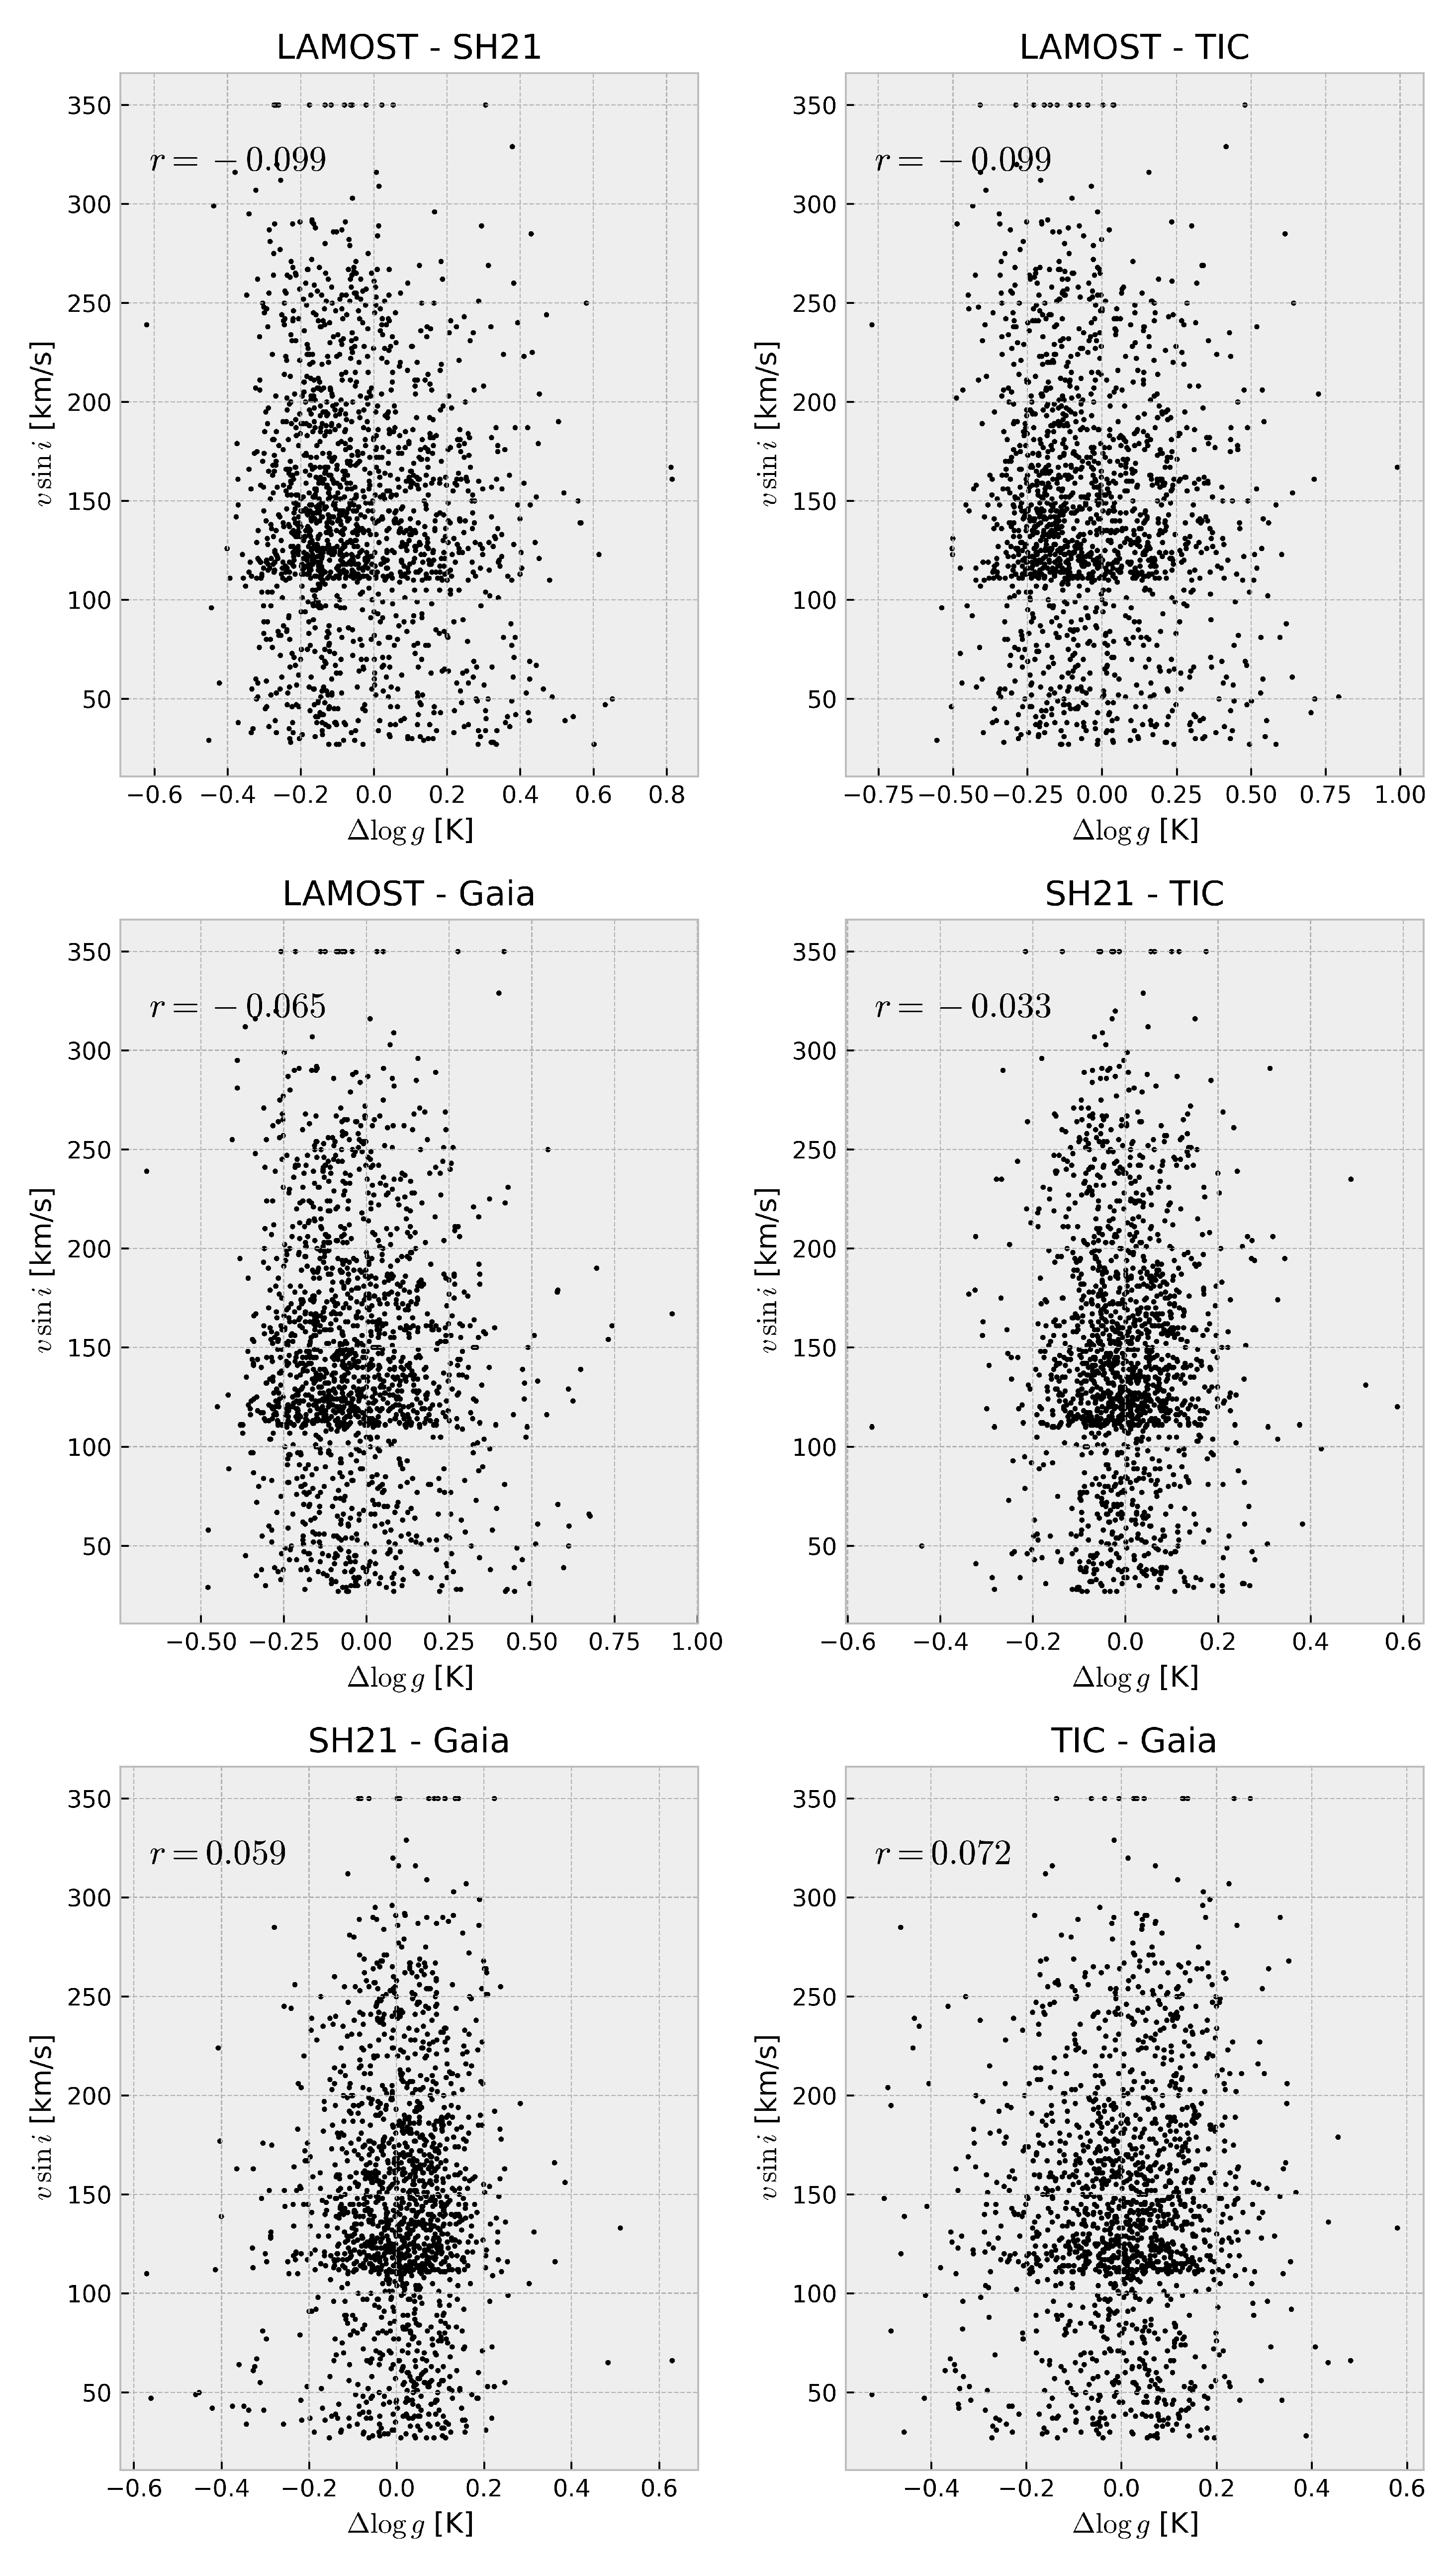
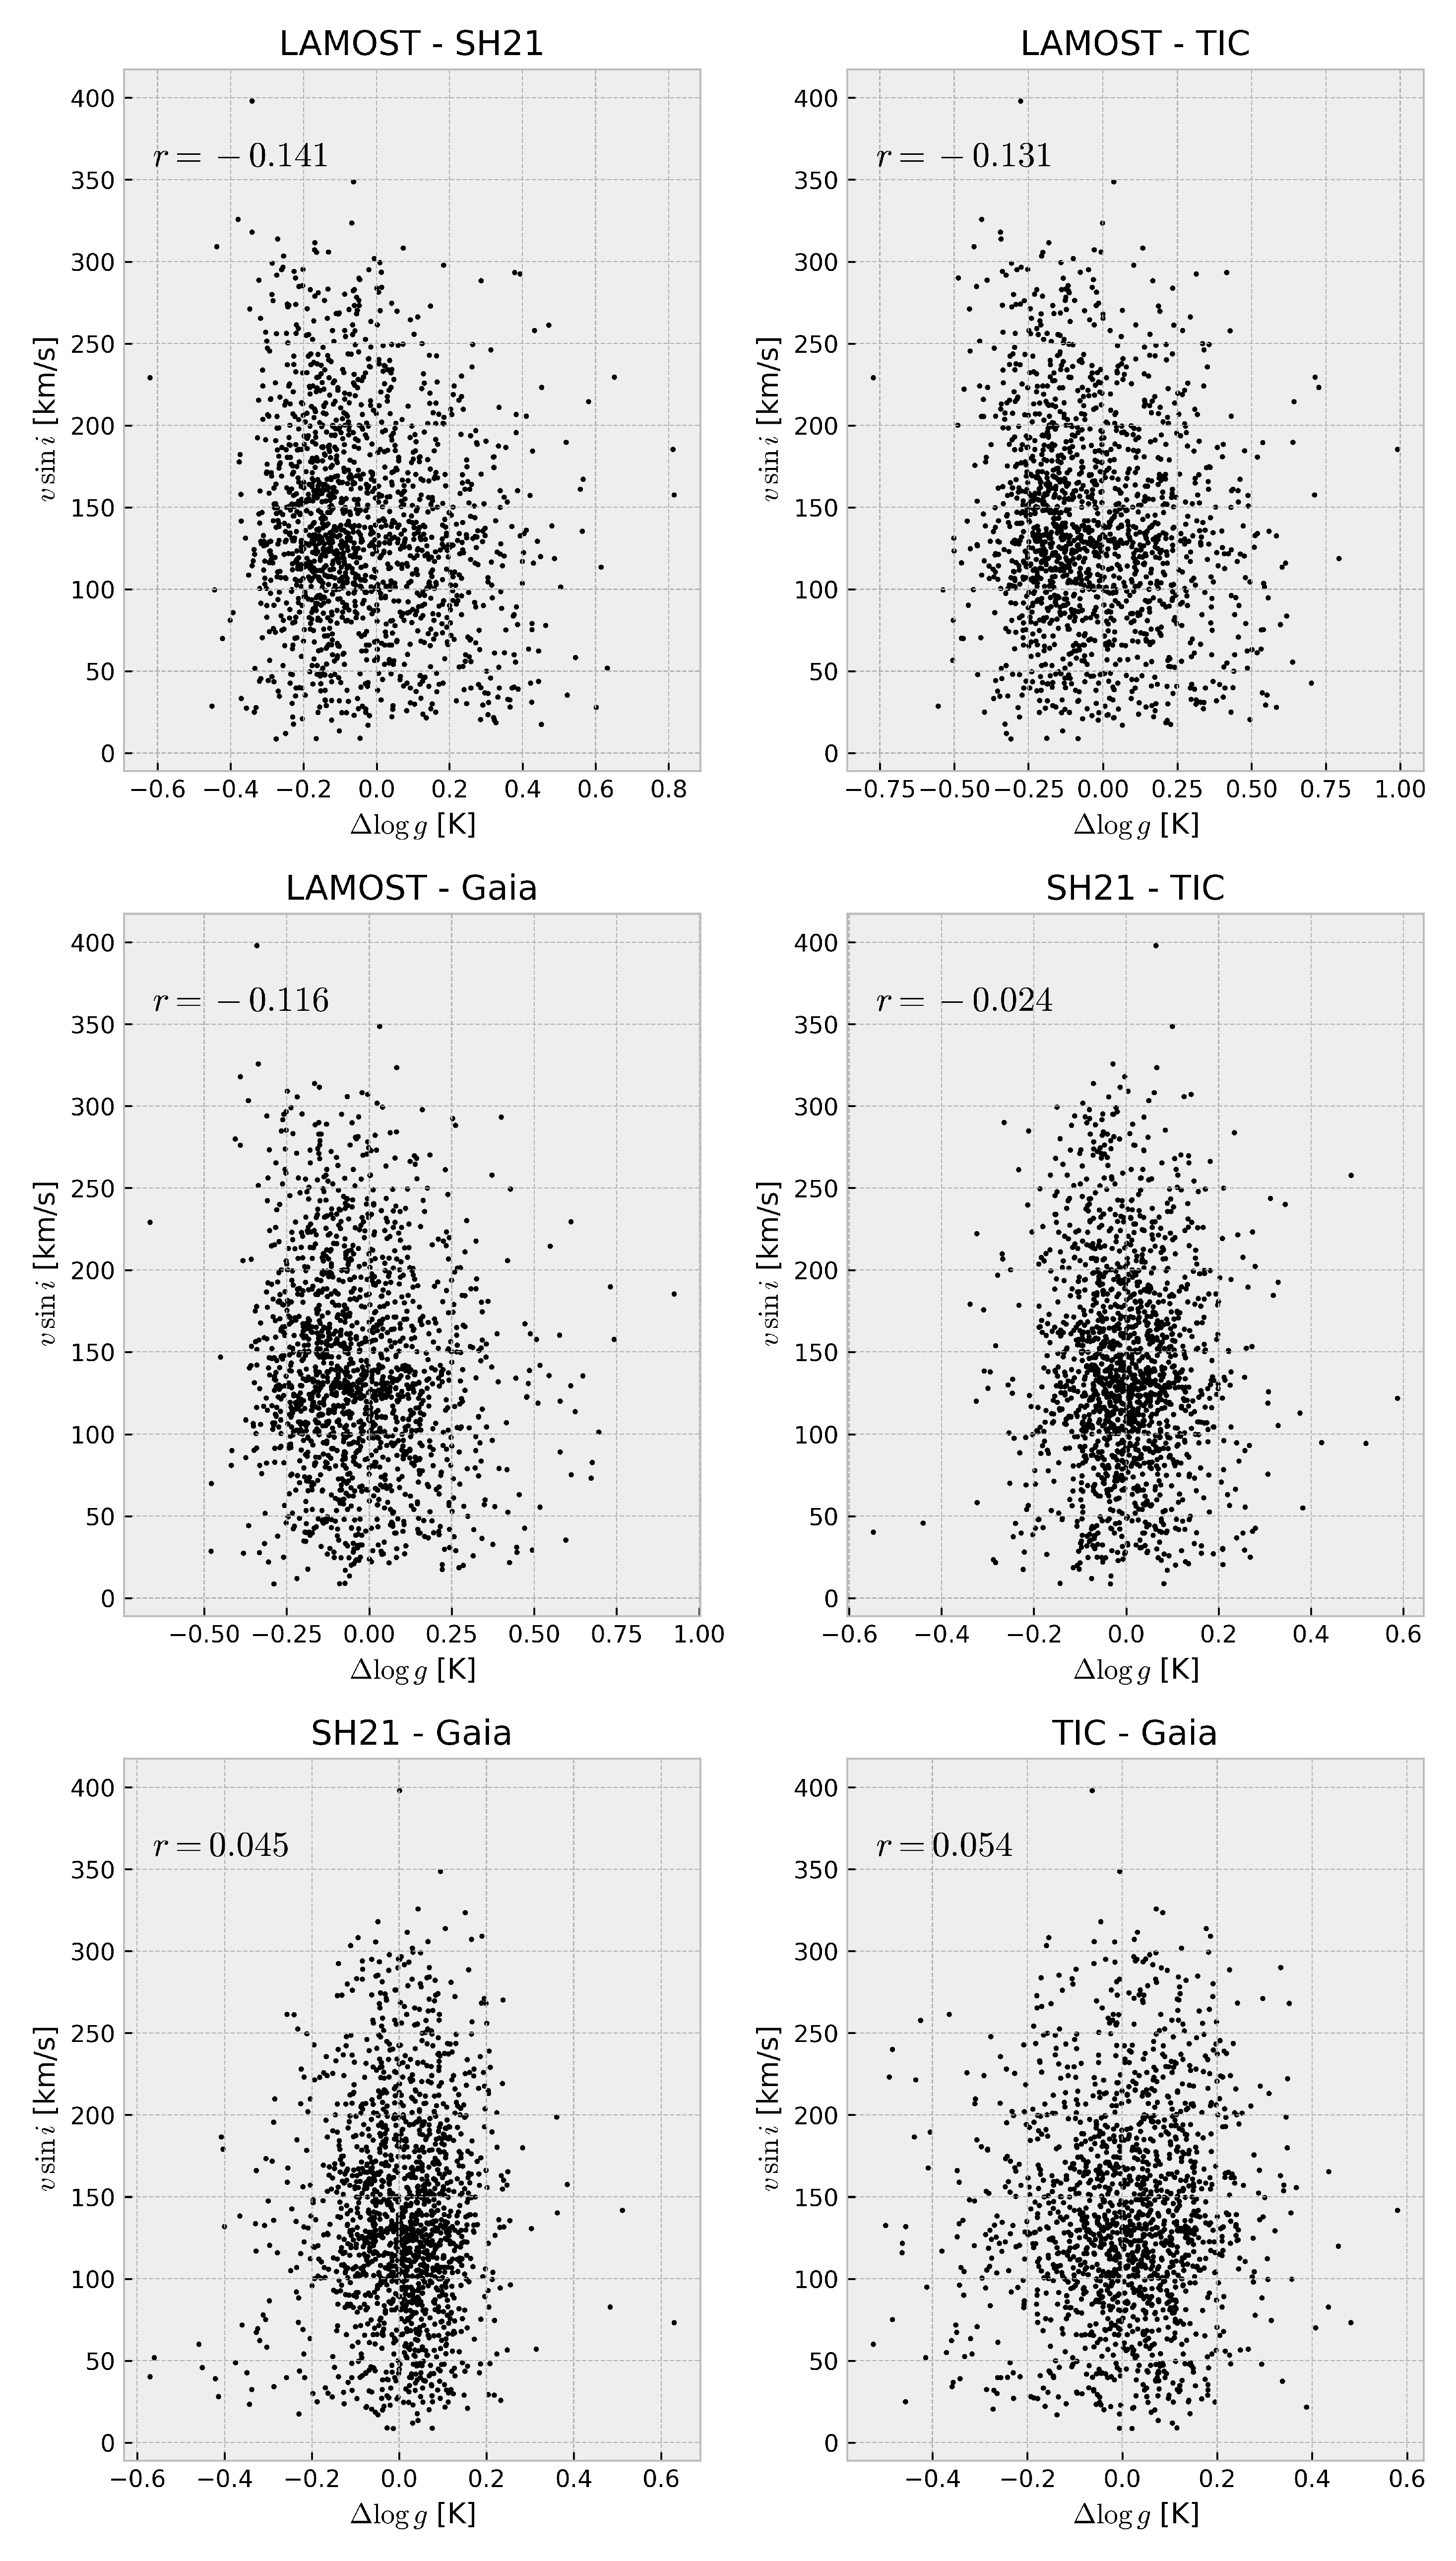
Additionally, we wanted to see whether there is a dependence on υ sin i in the differences of T eff and log g . We plotted υ sin i as a function of differences in the different catalogues. In Figure A3 and Figure A4, one can see the plots for the catalogue of [43], and in Figure A5 and Figure A6, one can see the ones for [40]. No trend is visible in any of those plots, which is not too surprising, as we assume that υ sin i would have more of an effect on the star’s metallicity than on the other parameters since the rotation of a star can have a non-negligible effect on the convection zones in the upper layers and thus also changes the observed chemical composition. This is also made clear by the Pearson coefficient printed in each of the plots.

4.4. Bolometric Correction

To derive accurate bolometric magnitudes and thus luminosities, one needs to correct the absolute V-magnitude of a star via a bolometric correction, B C :
M B o l = M V + B C V
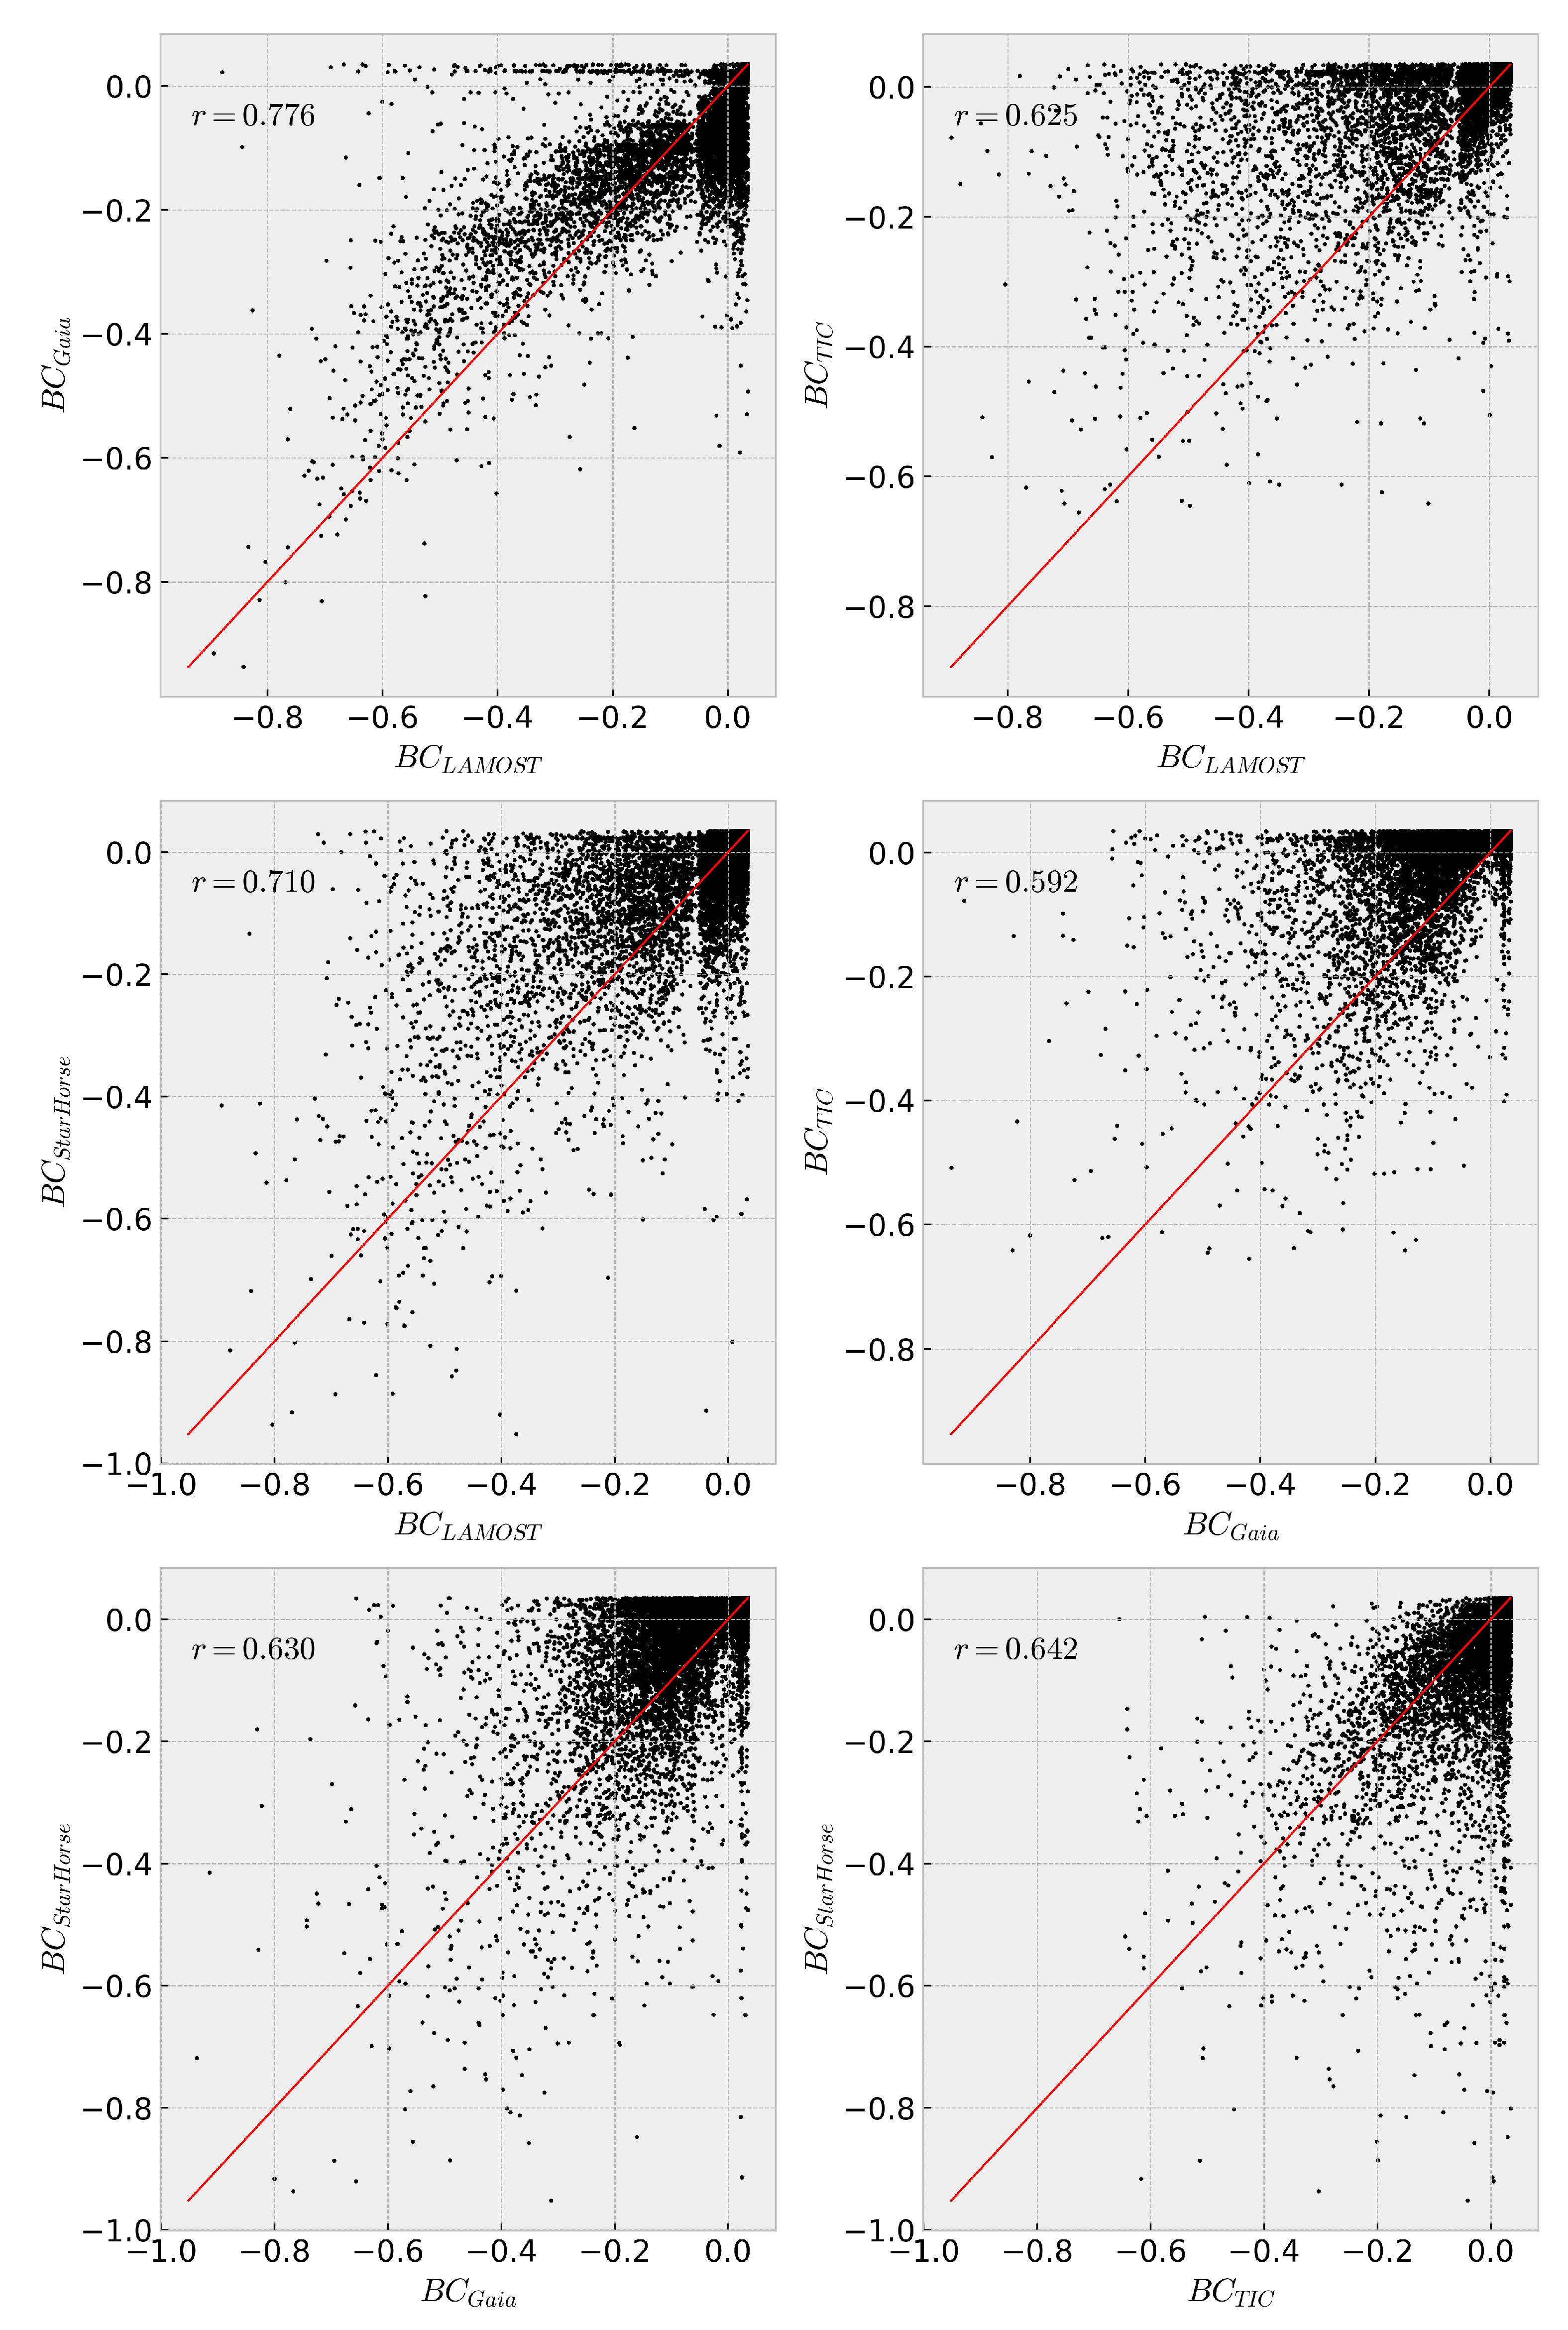
This B C V is a polynomial function of T eff . In this work, we use the polynomials from [50] with their correction from [51]. Equation (3) shows this polynomial function, and the coefficients can be seen in Table 1 of Torres [51]. A comparison of B C V values derived from each catalogue is seen in Figure 7.
B C V = a + b ( log T eff ) + c ( log T eff ) 2 + d ( log T eff ) 3 +
Since B C V is related to the luminosity of a star via
L L = 10 0.4 ( M b o l , M b o l , )
one can derive a luminosity ratio between two sources in terms of their difference in B C V :
L 1 L 2 = 10 0.4 Δ B C V
This difference, as seen in Equation (5), has implications on the calculated bolometric luminosities. As seen in Figure 8, stars of the same temperature in one catalogue can have a luminosity that differs by a factor greater than two when comparing the bolometric luminosities derived from two different catalogues of T eff , assuming that the mass of the star stays the same.
Since the luminosity also gives an estimation of the main-sequence lifetime,
τ M S M L
This discrepancy also has implications for estimating the evolutionary status of a star.

4.5. Mass-Luminosity Relation

The mass and luminosity of a star are classically connected by a mathematical relation of the form of
L M α
i.e., a star’s luminosity is a function of its mass. The exponent α in this relation is dependent on the mass range one investigates. Different divisions in mass have been used in the literature, and thus different values for α have been derived. Reference [52], for example, lists three publications with distinct subdivisions in mass (see Table 4).
In addition to a relation simply between mass and luminosity, [56] also derive empirical relations that incorporate other parameters, such as T eff , log g , [Fe/H] and stellar density ρ . In favour of simplicity, we stick with a relation like Equation (7). We calculated the masses (and radii) of our stars via the fitting of isochrones using the Stellar Isochrone Fitting Tool, Release 2.0.6 (StIFT (https://github.com/Johaney-s/StIFT)), which is based on Malkov et al. [57], and used the PARSEC isochrones [58] to infer stellar parameters. From these radii and the T eff values, the luminosities of the stars were calculated using the well-known Stefan–Boltzmann law:
L R 2 T eff , 4
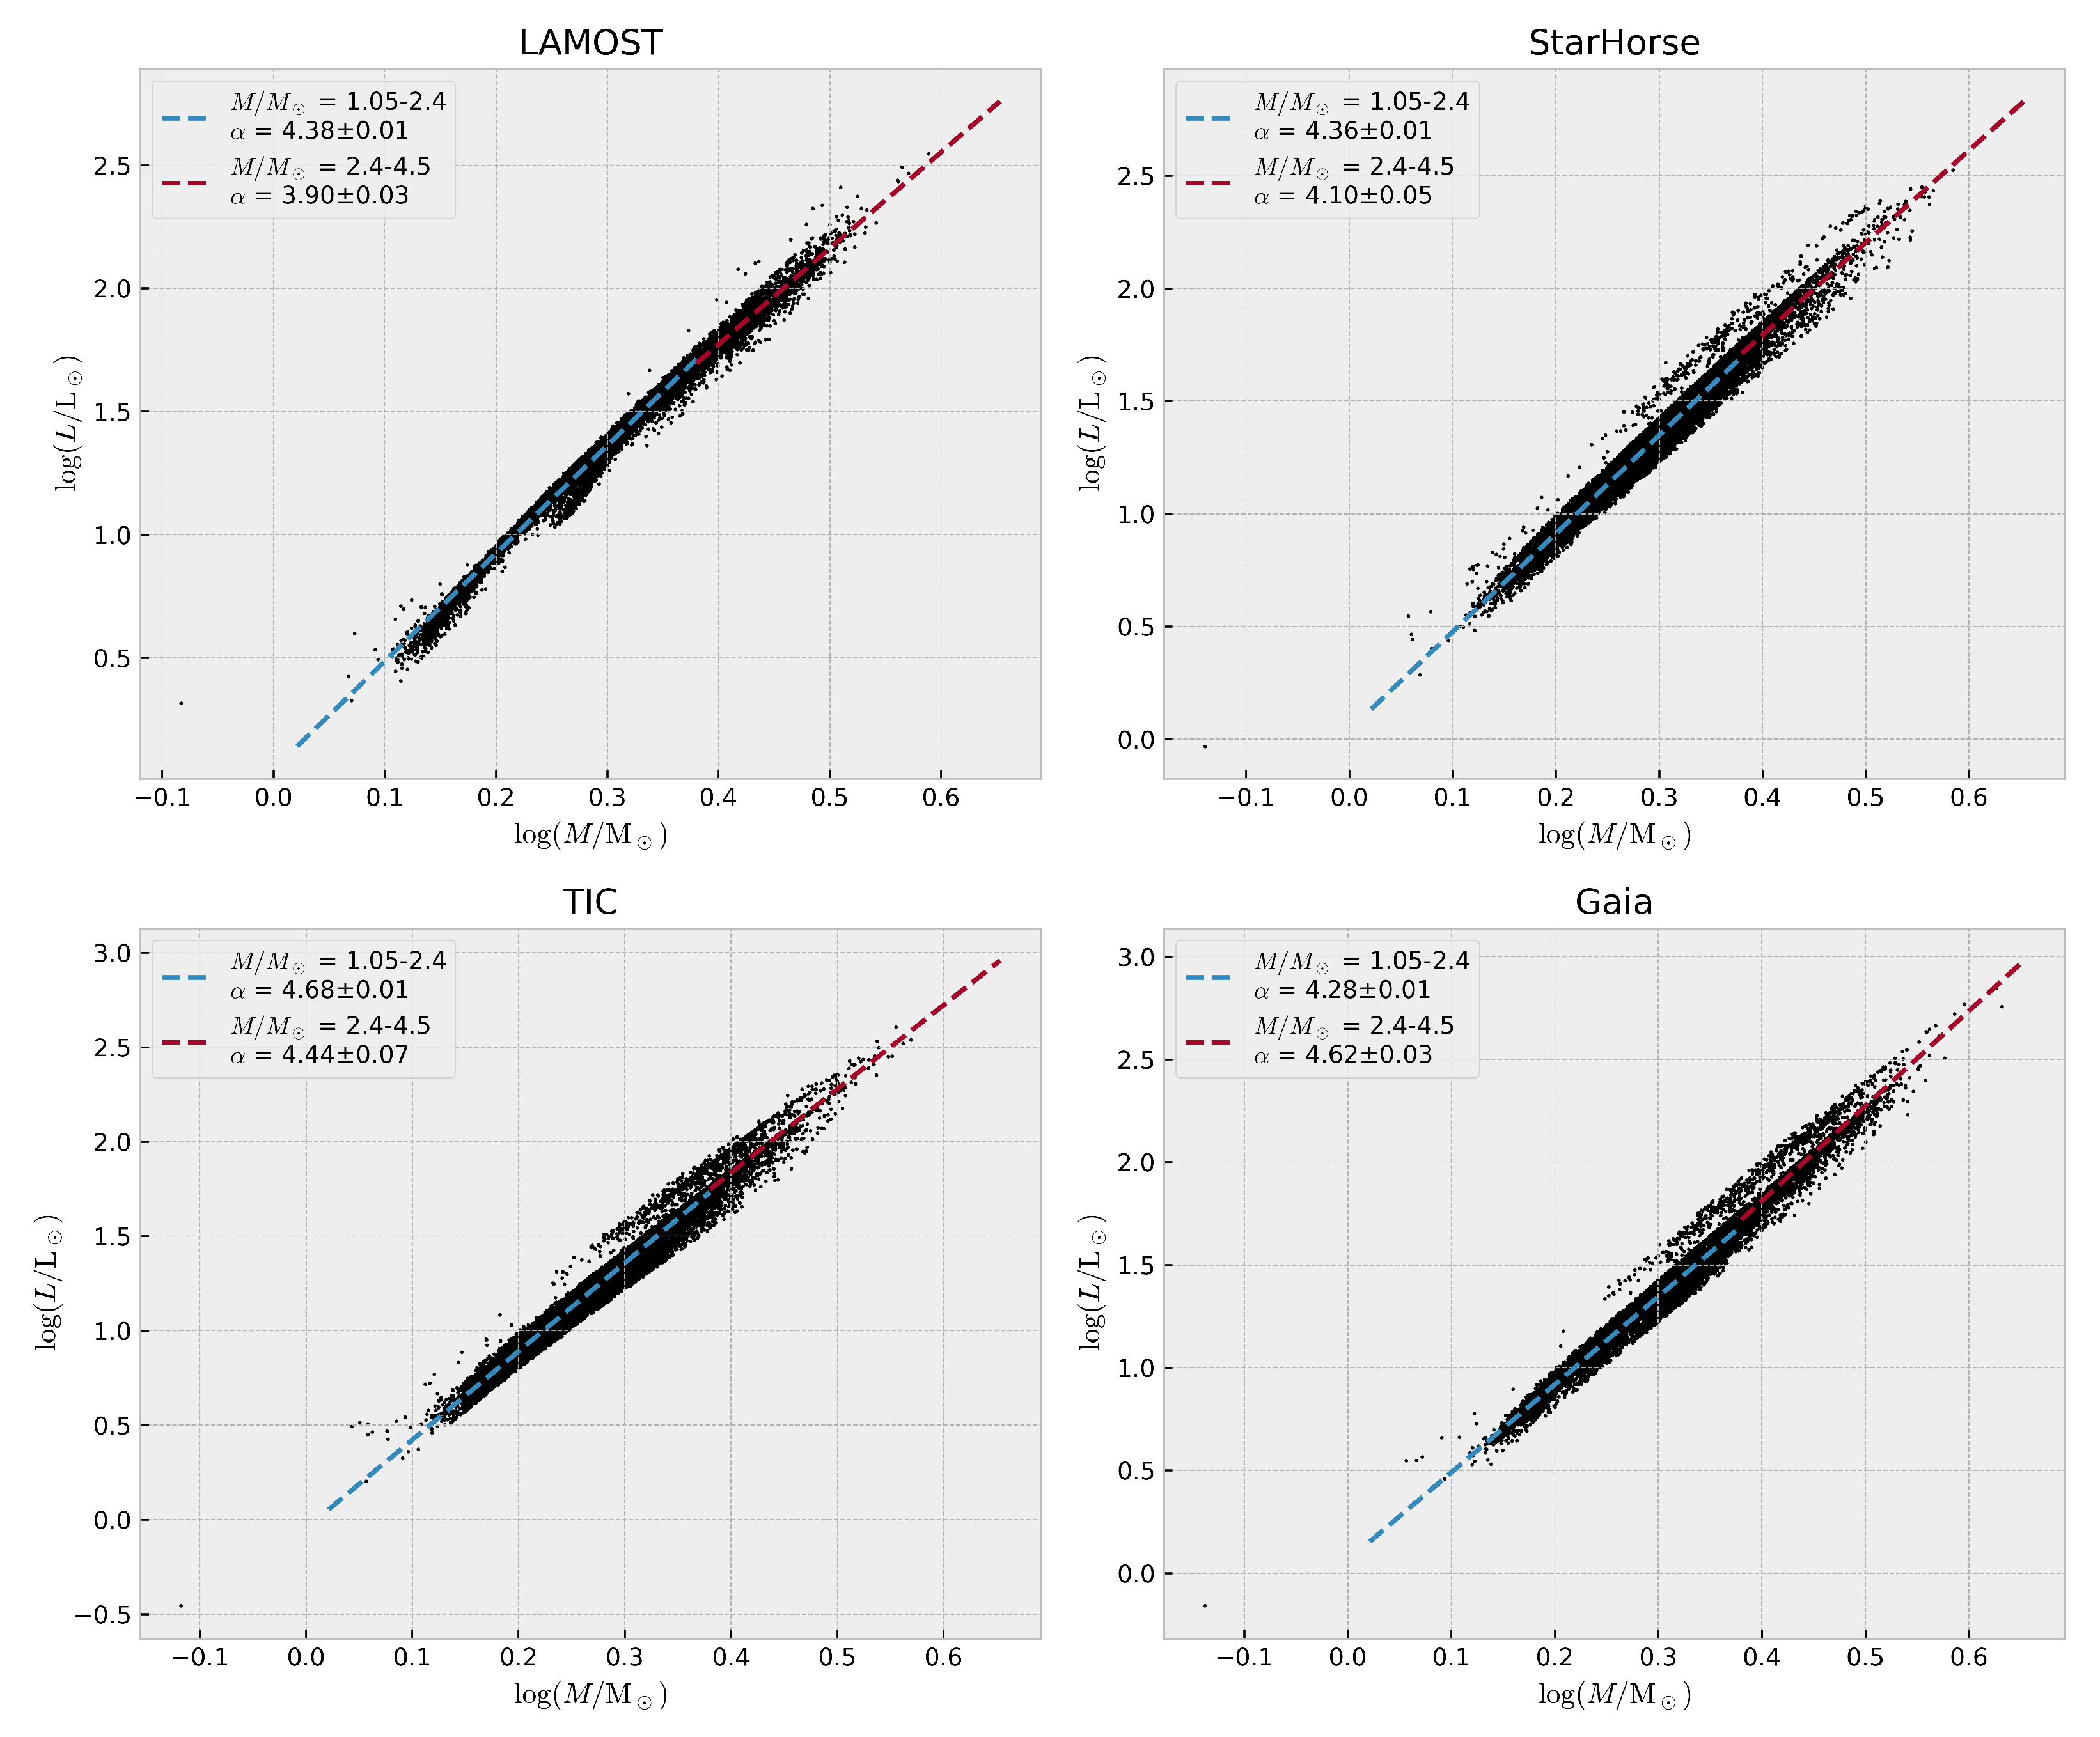
Also, we split our mass range in two, as almost all of our stars lie in the interval [1.05, 4.5] M , which are the two “middle” sections in the relation by [55]. We then fit a classical MLR in these two regions. The result can be seen in Figure 9 and in Table 5. One can see that the slopes are steeper than the reported values in the literature (Table 4). Another intriguing characteristic is the different “branches” clearly deviating from the line of equality. Those can be found except for the LAMOST data set. We checked all possible correlations with υ sin i , the age, and other astrophysical parameters. We did not find any satisfying explanation for this behaviour.

4.6. Mass-Radius Relation

Similarly, we examined the relationship between stellar mass and radius. A mass–radius relation (MRR) can be derived from an MLR and a mass–temperature relation (MTR) using Equation (8) [59]. The result is an equation like
log ( R ) = α ( log M ) 2 + β log M + γ ,
which we derived in the way mentioned above.
We again used a piecewise fit for the same mass ranges as for the MLR. The results are seen in Figure 10 and in Table 6.

4.7. Ages of Star Clusters

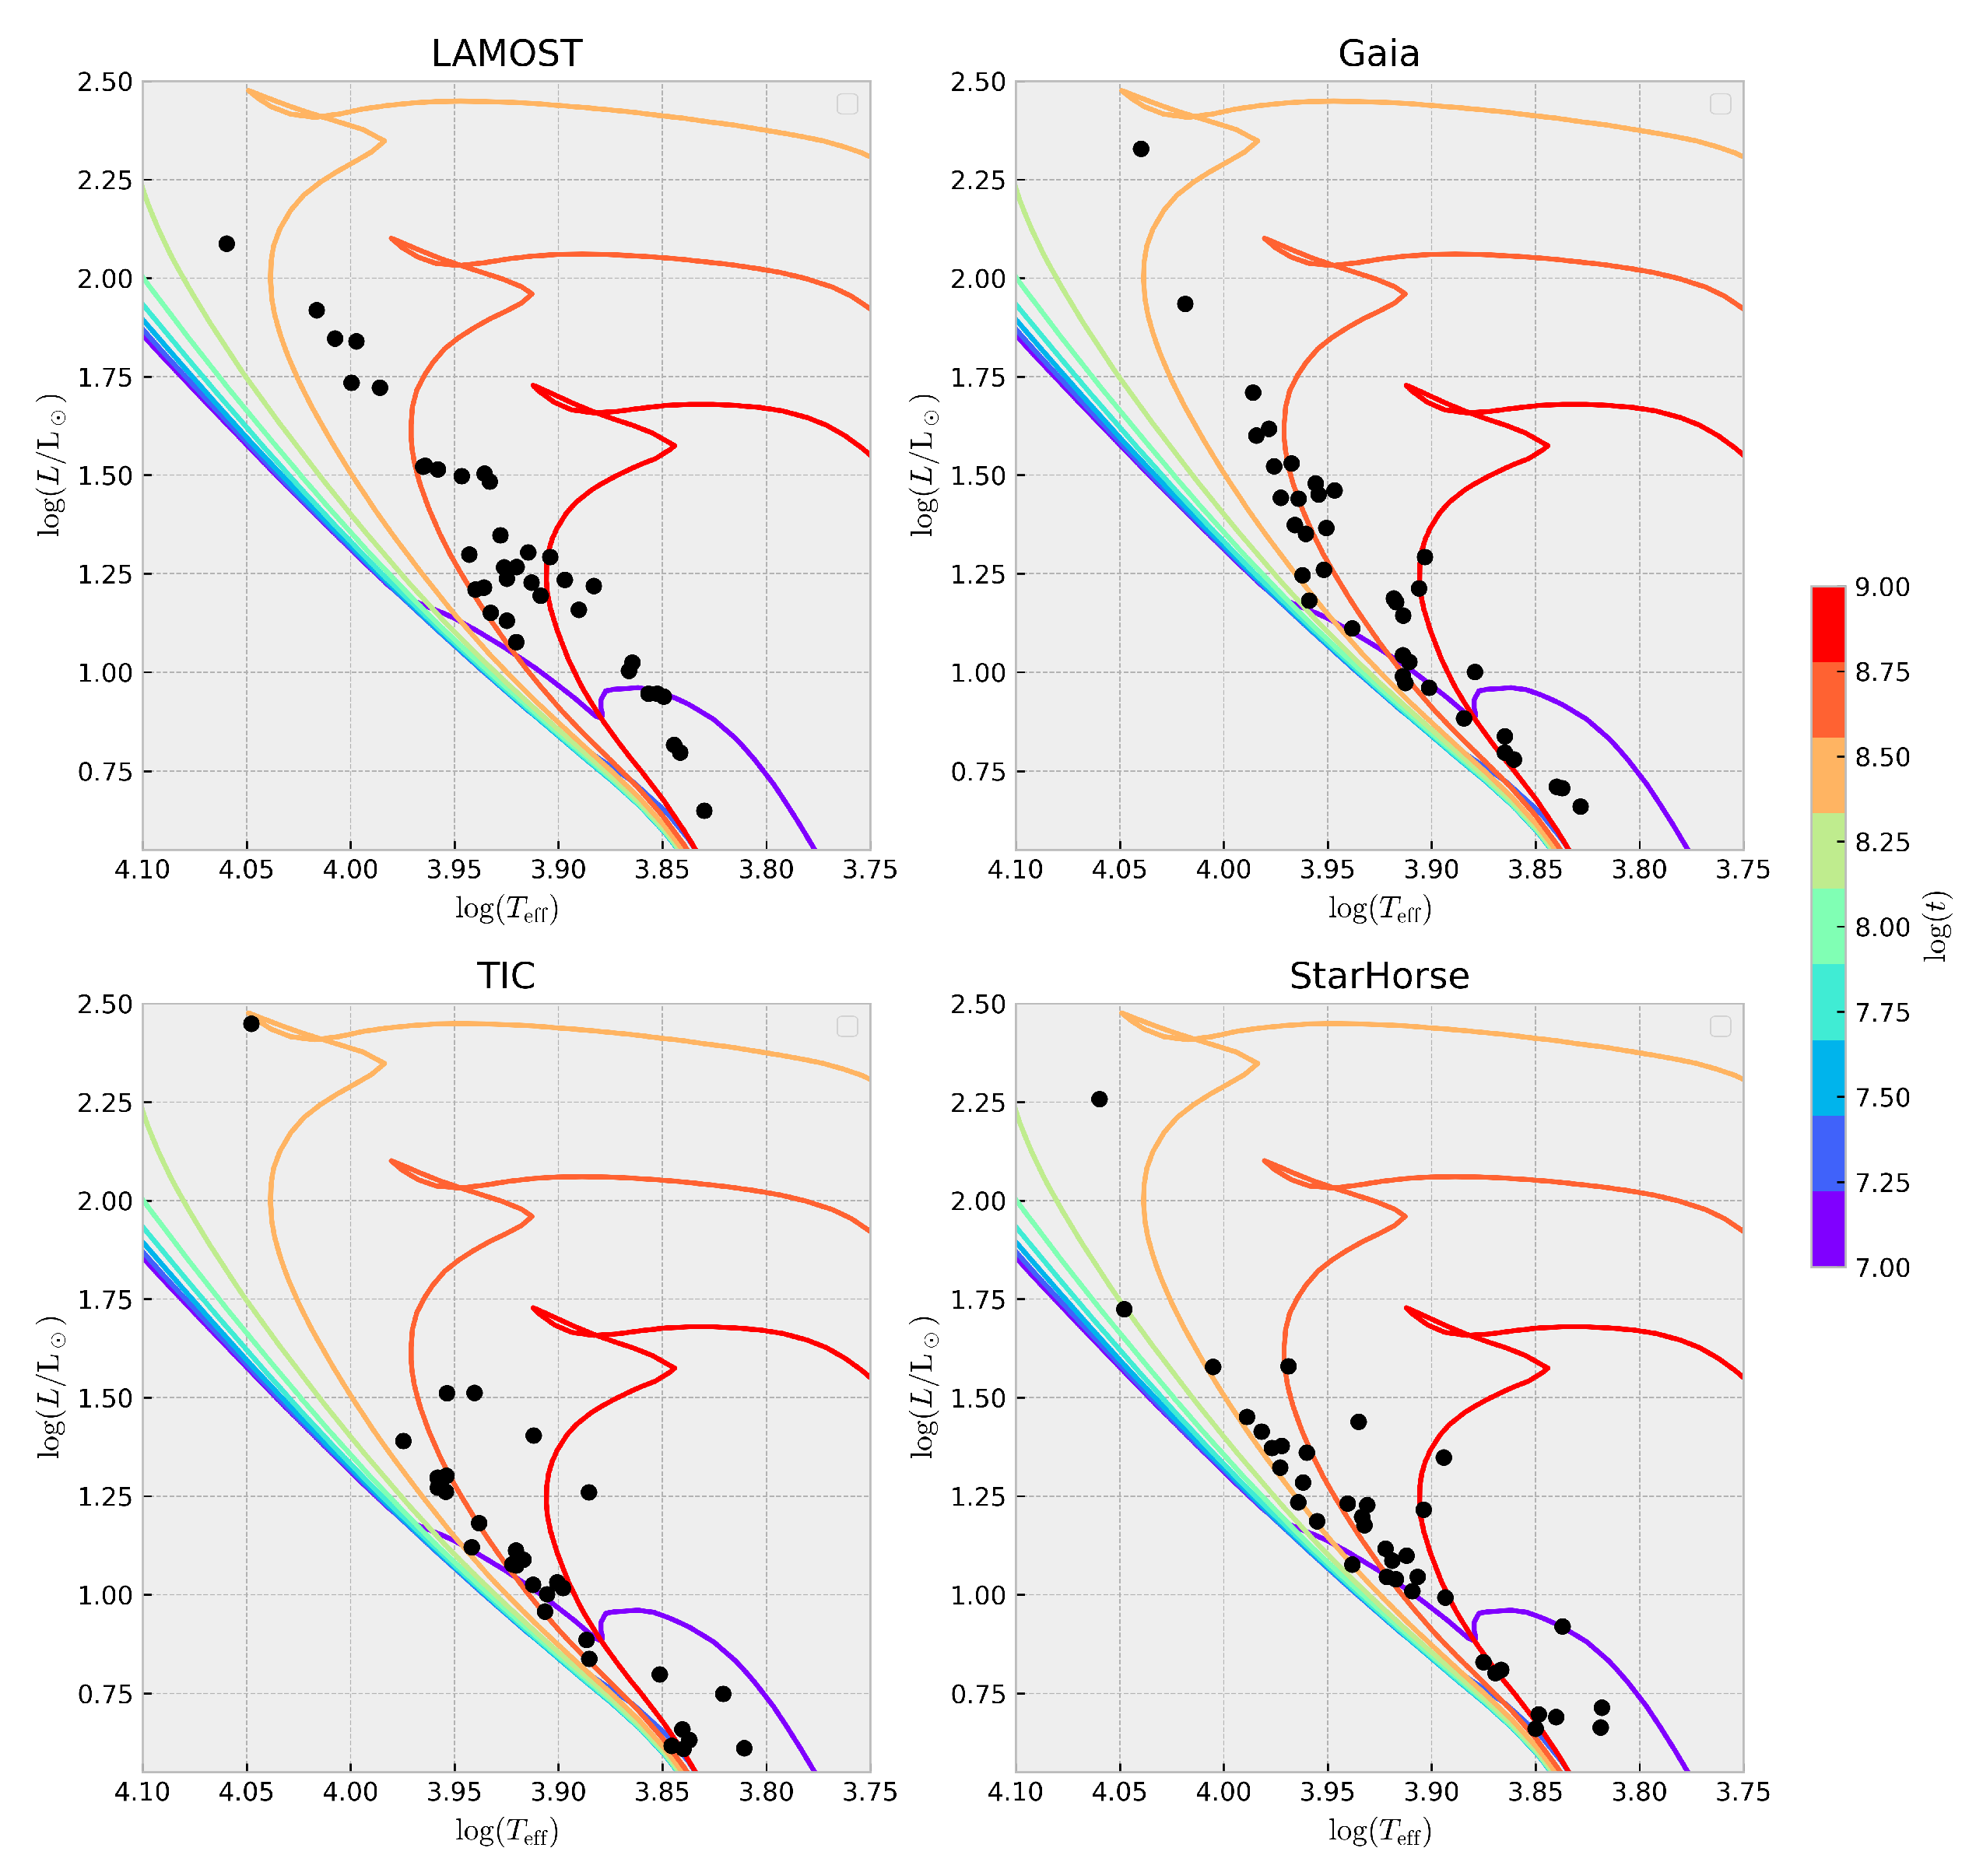
Of course, different values of T eff give different luminosities. To highlight this, we matched our sample of stars to the catalogue of open clusters from [60] to see which ones are members of clusters. We found 807 stars in 370 clusters. The cluster with the most members in our sample was NGC 2168, which contained 38 stars. To see the age differences across different catalogues, we plotted the luminosities derived from Equation (8) against the temperatures in each catalogue.
As seen in Figure 11, there is a significant difference when determining the age of star clusters based on luminosities derived from different T eff -values. We also plotted a range of isochrones from [58] between log [ 7.0 , 9.0 ] and using Z = 0.012 (Netopil et al. [23]). The age of the cluster was estimated to be log t = 8.21 [60] or log t = 7.95 (Netopil et al. [23]). Figure 11 suggests that the best-fitting isochrones are either younger (TIC, StarHorse) or older ( G a i a , LAMOST) than that value. Of course, the sample is just a small portion of the cluster, and everything comes with uncertainties. Still, one can see that the age differences vary between different sets of astrophysical parameters.

5. Conclusions

We compared astrophysical parameters of “normal” stars on the upper main sequence with spectral types derived from LAMOST spectra using MKCLASS. The investigated parameters are the effective temperature ( T eff ) and surface gravity ( log g ) of four large surveys, each with its own unique dataset and methodology, to see if they are comparable in their estimations. Our results show that the estimations of the parameters in the different catalogues are off by up to almost Δ T eff = 10 4 K in temperature and two dex in surface gravity. This has severe implications for interpreting astrophysical results with values taken from either of these catalogues, i.e., one cannot assume that one obtains similar results when working with another set of astrophysical parameters. Another danger is the determination of a rough spectral type based solely on the effective temperature, which may lead to incorrect assessments of stellar properties, such as convection and diffusion. From our analysis, we can see that the T eff values from LAMOST and SH21 have the best correlation ( r = 0.737 ), whereas the correlation between the values of LAMOST and TIC is the weakest ( r = 0.665 ). For log g , the correlations are generally weaker, resulting in the best correlation between TIC and SH21 ( r = 0.763 ) and the weakest between LAMOST and SH21 ( r = 0.153 ). The reasons for these weak correlations may lie in outliers that we did not remove for our analysis. Additionally, the values can differ based on the nature of the stars. A fraction of our sample stars may have been misclassified in one or more of the four catalogues, in the Golden OBA sample, or in our spectral classification, which ultimately would, at least in part, explain the discrepancies we found.
We also analysed various astrophysical relations for each catalogue and compared them to one another. These included a relation between mass and luminosity (MLR), mass and radius (MRR), and the effects of bolometric corrections for different temperatures. We conclude that there are significant implications for main-sequence lifetime (up to a factor of two) and age estimations when compared with each other.
In conclusion, there is a need to achieve a homogeneous calibration of the mentioned stellar parameters to overcome these issues.
As mentioned in the introduction, we did not compare the metallicity values given in the catalogues because they all use different definitions to measure this value, making them almost impossible to compare directly. This, too, is an essential task for future efforts.
To strengthen the conclusion we arrived at, we also plotted the HRD for each catalogue (Figure 1); one can also see that the values derived by the different methods in the catalogues are all over the place, and one cannot simply compare them.

Author Contributions

Conceptualization, E.P., methodology: L.K and E.P., formal analysis, L.K., writing–original draft preparation: L.K. and E.P., writing–review and editing, L.K. and E.P.; visualization, L.K. All authors have read and agreed to the published version of the manuscript.

Funding

This work was supported by the grant GAČR 23-07605S.

Conflicts of Interest

The authors declare no conflict of interest.

Appendix A. Histograms of the Differences in Teff and log g

Figure A1. Histogram of the differences in T eff .
Astronomy 04 00015 g0a1
Figure A2. Same as Figure A1, but for log g .
Astronomy 04 00015 g0a2

Appendix B. Plots of the Correlation with υ sin i

Additionally, we wanted to see whether there is a dependence on υ sin i in the differences of T eff and log g . We plotted υ sin i as a function of differences in the different catalogues. In Figure A3 and Figure A4, one can see the plots for the catalogue of [43], and in Figure A5 and Figure A6, one can see the ones for [40]. No trend is visible in any of those plots, which is not too surprising, as we assume that υ sin i would have more of an effect on the star’s metallicity than on the other parameters.
Figure A3. Comparison of the differences in T eff with υ sin i from the catalogue of [43]. We also give the Pearson coefficient (see Section 4.4).
Astronomy 04 00015 g0a3
Figure A4. Same as Figure A3 but for log g .
Astronomy 04 00015 g0a4
Figure A5. Same as Figure A3 but for υ sin i from [40].
Astronomy 04 00015 g0a5
Figure A6. Same as Figure A5 but for log g .
Astronomy 04 00015 g0a6

References

  1. Jermyn, A.S.; Anders, E.H.; Lecoanet, D.; Cantiello, M. An Atlas of Convection in Main-sequence Stars. Astrophys. J. Suppl. Ser. 2022, 262, 19. [Google Scholar] [CrossRef]
  2. Pamyatnykh, A.A. Pulsational Instability Domains in the Upper Main Sequence. ActaA 1999, 49, 119–148. [Google Scholar]
  3. D’Antona, F.; Montalbán, J.; Kupka, F.; Heiter, U. The Böhm-Vitense Gap: The Role of Turbulent Convection. Astrophys. J. Suppl. Ser. 2002, 564, L93–L96. [Google Scholar] [CrossRef]
  4. Charbonneau, P.; Michaud, G. Meridional Circulation and Diffusion in A and Early F Stars. Astrophys. J. 1991, 370, 693. [Google Scholar] [CrossRef]
  5. Moss, D. Magnetic Fields in the Ap and Bp Stars: A Theoretical Overview. In Proceedings of the Magnetic Fields Across the Hertzsprung-Russell Diagram; Astronomical Society of the Pacific Conference Series; Mathys, G., Solanki, S.K., Wickramasinghe, D.T., Eds.; Astronomical Society of the Pacific: San Francisco, CA, USA, 2001; Volume 248, p. 305. [Google Scholar]
  6. Antoci, V.; Cunha, M.S.; Bowman, D.M.; Murphy, S.J.; Kurtz, D.W.; Bedding, T.R.; Borre, C.C.; Christophe, S.; Daszyńska-Daszkiewicz, J.; Fox-Machado, L.; et al. The first view of δ Scuti and γ Doradus stars with the TESS mission. Mon. Not. R. Astron. Soc. 2019, 490, 4040–4059. [Google Scholar] [CrossRef]
  7. Walczak, P.; Fontes, C.J.; Colgan, J.; Kilcrease, D.P.; Guzik, J.A. Wider pulsation instability regions for β Cephei and SPB stars calculated using new Los Alamos opacities. Astron. Astrophys. 2015, 580, L9. [Google Scholar] [CrossRef]
  8. Maury, A.C.; Pickering, E.C. Spectra of bright stars photographed with the 11-inch Draper Telescope as part of the Henry Draper Memorial. Ann. Harv. Coll. Obs. 1897, 28, 1–128. [Google Scholar]
  9. Alecian, G. Diffusion velocity of metals in Ap star atmospheres: The effect of ambipolar diffusion of H. Mon. Not. R. Astron. Soc. 2023, 519, 5913–5921. [Google Scholar] [CrossRef]
  10. ud-Doula, A.; Krtička, J.; Kubátová, B. Horizontal flows in the atmospheres of chemically peculiar stars. Astron. Astrophys. 2025, 694, A270. [Google Scholar] [CrossRef]
  11. Pinsonneault, M.H.; Kawaler, S.D.; Demarque, P. Rotation of Low-Mass Stars: A New Probe of Stellar Evolution. Astrophys. J. Suppl. Ser. 1990, 74, 501. [Google Scholar] [CrossRef]
  12. Abt, H.A.; Levato, H.; Grosso, M. Rotational Velocities of B Stars. Astrophys. J. 2002, 573, 359–365. [Google Scholar] [CrossRef]
  13. Holmberg, J.; Nordström, B.; Andersen, J. The Geneva-Copenhagen survey of the Solar neighbourhood II. New uvby calibrations and rediscussion of stellar ages, the G dwarf problem, age-metallicity diagram, and heating mechanisms of the disk. Astron. Astrophys. 2007, 475, 519–537. [Google Scholar] [CrossRef]
  14. Teixeira, G.D.C.; Sousa, S.G.; Tsantaki, M.; Monteiro, M.J.P.F.G.; Santos, N.C.; Israelian, G. New Teff and [Fe/H] spectroscopic calibration for FGK dwarfs and GK giants. Astron. Astrophys. 2016, 595, A15. [Google Scholar] [CrossRef]
  15. Paunzen, E.; Schnell, A.; Maitzen, H.M. An empirical temperature calibration for the Δ a photometric system . I. The B-type stars. Astron. Astrophys. 2005, 444, 941–946. [Google Scholar] [CrossRef]
  16. Paunzen, E.; Schnell, A.; Maitzen, H.M. An empirical temperature calibration for the Δ a photometric system. II. The A-type and mid F-type stars. Astron. Astrophys. 2006, 458, 293–296. [Google Scholar] [CrossRef]
  17. Cardelli, J.A.; Clayton, G.C.; Mathis, J.S. The Relationship between Infrared, Optical, and Ultraviolet Extinction. Astrophys. J. 1989, 345, 245. [Google Scholar] [CrossRef]
  18. McDonald, I.; Zijlstra, A.A.; Cox, N.L.J.; Alexander, E.L.; Csukai, A.; Ramkumar, R.; Hollings, A. PYSSED: An automated method of collating and fitting stellar spectral energy distributions. RAS Tech. Instruments 2024, 3, 89–107. [Google Scholar] [CrossRef]
  19. Marigo, P.; Girardi, L.; Chiosi, C.; Wood, P.R. Zero-metallicity stars. I. Evolution at constant mass. Astron. Astrophys. 2001, 371, 152–173. [Google Scholar] [CrossRef]
  20. Allende Prieto, C.; Barklem, P.S.; Lambert, D.L.; Cunha, K. S4N: A spectroscopic survey of stars in the solar neighborhood. The Nearest 15 pc. Astron. Astrophys. 2004, 420, 183–205. [Google Scholar] [CrossRef]
  21. Gebran, M.; Vick, M.; Monier, R.; Fossati, L. Chemical composition of A and F dwarfs members of the Hyades open cluster. Astron. Astrophys. 2010, 523, A71. [Google Scholar] [CrossRef]
  22. Shejeelammal, J.; Meléndez, J.; Rathsam, A.; Martos, G. The [Y/Mg] chemical clock in the Galactic disk: The influence of metallicity and the Galactic population in the solar neighbourhood. Astron. Astrophys. 2024, 690, A107. [Google Scholar] [CrossRef]
  23. Netopil, M.; Oralhan, İ.A.; Çakmak, H.; Michel, R.; Karataş, Y. The Galactic metallicity gradient shown by open clusters in the light of radial migration. Mon. Not. R. Astron. Soc. 2022, 509, 421–439. [Google Scholar] [CrossRef]
  24. Zhao, G.; Zhao, Y.H.; Chu, Y.Q.; Jing, Y.P.; Deng, L.C. LAMOST spectral survey—An overview. Res. Astron. Astrophys. 2012, 12, 723–734. [Google Scholar] [CrossRef]
  25. Gaia Collaboration; Creevey, O.L.; Sarro, L.M.; Lobel, A.; Pancino, E.; Andrae, R.; Smart, R.L.; Clementini, G.; Heiter, U.; Korn, A.J.; et al. Gaia Data Release 3. A golden sample of astrophysical parameters. Astron. Astrophys. 2023, 674, A39. [Google Scholar] [CrossRef]
  26. Gray, R.O.; Corbally, C.J. An Expert Computer Program for Classifying Stars on the MK Spectral Classification System. Astron. J. 2014, 147, 80. [Google Scholar] [CrossRef]
  27. Hümmerich, S.; Paunzen, E.; Bernhard, K. A plethora of new, magnetic chemically peculiar stars from LAMOST DR4. Astron. Astrophys. 2020, 640, A40. [Google Scholar] [CrossRef]
  28. Anders, F.; Khalatyan, A.; Chiappini, C.; Queiroz, A.B.; Santiago, B.X.; Jordi, C.; Girardi, L.; Brown, A.G.A.; Matijevič, G.; Monari, G.; et al. Photo-astrometric distances, extinctions, and astrophysical parameters for Gaia DR2 stars brighter than G = 18. Astron. Astrophys. 2019, 628, A94. [Google Scholar] [CrossRef]
  29. Anders, F.; Khalatyan, A.; Queiroz, A.B.A.; Chiappini, C.; Ardèvol, J.; Casamiquela, L.; Figueras, F.; Jiménez-Arranz, Ó.; Jordi, C.; Monguió, M.; et al. Photo-astrometric distances, extinctions, and astrophysical parameters for Gaia EDR3 stars brighter than G = 18.5. Astron. Astrophys. 2022, 658, A91. [Google Scholar] [CrossRef]
  30. Magnier, E.A.; Schlafly, E.; Finkbeiner, D.; Juric, M.; Tonry, J.L.; Burgett, W.S.; Chambers, K.C.; Flewelling, H.A.; Kaiser, N.; Kudritzki, R.P.; et al. The Pan-STARRS 1 Photometric Reference Ladder, Release 12.01. Astrophys. J. Suppl. Ser. 2013, 205, 20. [Google Scholar] [CrossRef]
  31. Skrutskie, M.F.; Cutri, R.M.; Stiening, R.; Weinberg, M.D.; Schneider, S.; Carpenter, J.M.; Beichman, C.; Capps, R.; Chester, T.; Elias, J.; et al. The Two Micron All Sky Survey (2MASS). Astron. J. 2006, 131, 1163–1183. [Google Scholar] [CrossRef]
  32. Cutri, R.M.; Wright, E.L.; Conrow, T.; Fowler, J.W.; Eisenhardt, P.R.M.; Grillmair, C.; Kirkpatrick, J.D.; Masci, F.; McCallon, H.L.; Wheelock, S.L.; et al. VizieR Online Data Catalog: AllWISE Data Release (Cutri+ 2013); VizieR Online Data Catalog: Strasbourg, France, 2013; p. II/328. [Google Scholar]
  33. Onken, C.A.; Wolf, C.; Bessell, M.S.; Chang, S.W.; Da Costa, G.S.; Luvaul, L.C.; Mackey, D.; Schmidt, B.P.; Shao, L. SkyMapper Southern Survey: Second data release (DR2). Publ. Astron. Soc. Aust. 2019, 36, e033. [Google Scholar] [CrossRef]
  34. Queiroz, A.B.A.; Anders, F.; Santiago, B.X.; Chiappini, C.; Steinmetz, M.; Dal Ponte, M.; Stassun, K.G.; da Costa, L.N.; Maia, M.A.G.; Crestani, J.; et al. StarHorse: A Bayesian tool for determining stellar masses, ages, distances, and extinctions for field stars. Mon. Not. R. Astron. Soc. 2018, 476, 2556–2583. [Google Scholar] [CrossRef]
  35. Fouesneau, M.; Frémat, Y.; Andrae, R.; Korn, A.J.; Soubiran, C.; Kordopatis, G.; Vallenari, A.; Heiter, U.; Creevey, O.L.; Sarro, L.M.; et al. Gaia Data Release 3. Apsis. II. Stellar parameters. Astron. Astrophys. 2023, 674, A28. [Google Scholar] [CrossRef]
  36. Li, X.; Zeng, S.; Wang, Z.; Du, B.; Kong, X.; Liao, C. Estimating atmospheric parameters from LAMOST low-resolution spectra with low SNR. Mon. Not. R. Astron. Soc. 2022, 514, 4588–4600. [Google Scholar] [CrossRef]
  37. Stassun, K.G.; Oelkers, R.J.; Paegert, M.; Torres, G.; Pepper, J.; De Lee, N.; Collins, K.; Latham, D.W.; Muirhead, P.S.; Chittidi, J.; et al. The Revised TESS Input Catalog and Candidate Target List. Astron. J. 2019, 158, 138. [Google Scholar] [CrossRef]
  38. Husser, T.O.; Wende-von Berg, S.; Dreizler, S.; Homeier, D.; Reiners, A.; Barman, T.; Hauschildt, P.H. A new extensive library of PHOENIX stellar atmospheres and synthetic spectra. Astron. Astrophys. 2013, 553, A6. [Google Scholar] [CrossRef]
  39. Stassun, K.G.; Oelkers, R.J.; Pepper, J.; Paegert, M.; De Lee, N.; Torres, G.; Latham, D.W.; Charpinet, S.; Dressing, C.D.; Huber, D.; et al. The TESS Input Catalog and Candidate Target List. Astron. J. 2018, 156, 102. [Google Scholar] [CrossRef]
  40. Sun, W.; Chiappini, C. Exploring the stellar rotation of early-type stars in the LAMOST medium-resolution survey: III. Evolution. Astron. Astrophys. 2024, 689, A141. [Google Scholar] [CrossRef]
  41. Zhang, B.; Liu, C.; Deng, L.C. Deriving the Stellar Labels of LAMOST Spectra with the Stellar LAbel Machine (SLAM). Astrophys. J. Suppl. Ser. 2020, 246, 9. [Google Scholar] [CrossRef]
  42. Castelli, F. ATLAS12: How to use it. Mem. Della Soc. Astron. Ital. Suppl. 2005, 8, 25. [Google Scholar]
  43. Zuo, F.; Luo, A.L.; Du, B.; Li, Y.; Jones, H.R.A.; Song, Y.h.; Kong, X.; Guo, Y.x. Projected Rotational Velocities for LAMOST Stars with Effective Temperatures Lower than 9000 K. Astrophys. J. Suppl. Ser. 2024, 271, 4. [Google Scholar] [CrossRef]
  44. Majewski, S. The APO Galactic Evolution Experiment (APOGEE). In Proceedings of the The Milky Way and its Stars: Stellar Astrophysics, Galactic Archaeology, and Stellar Populations, Santa Barbara, CA, USA, 2–6 February 2015; p. 47. [Google Scholar]
  45. Bensby, T.; Feltzing, S.; Oey, M.S. Exploring the Milky Way stellar disk. A detailed elemental abundance study of 714 F and G dwarf stars in the solar neighbourhood. Astron. Astrophys. 2014, 562, A71. [Google Scholar] [CrossRef]
  46. Straizys, V.; Jodinskiene, E.; Kurliene, G. The calibration of the Vilnius photometric system in temperatures and gravities. Vilnius Astron. Obs. Biul. 1982, 60, 16. [Google Scholar]
  47. Karataş, Y.; Schuster, W.J. Metallicity and absolute magnitude calibrations for UBV photometry. Mon. Not. R. Astron. Soc. 2006, 371, 1793–1812. [Google Scholar] [CrossRef]
  48. Paunzen, E.; Netopil, M. On the current status of open-cluster parameters. Mon. Not. R. Astron. Soc. 2006, 371, 1641–1647. [Google Scholar] [CrossRef]
  49. Holmberg, J.; Nordström, B.; Andersen, J. The Geneva-Copenhagen survey of the solar neighbourhood. III. Improved distances, ages, and kinematics. Astron. Astrophys. 2009, 501, 941–947. [Google Scholar] [CrossRef]
  50. Flower, P.J. Transformations from Theoretical Hertzsprung-Russell Diagrams to Color-Magnitude Diagrams: Effective Temperatures, B-V Colors, and Bolometric Corrections. Astrophys. J. 1996, 469, 355. [Google Scholar] [CrossRef]
  51. Torres, G. On the Use of Empirical Bolometric Corrections for Stars. Astron. J. 2010, 140, 1158–1162. [Google Scholar] [CrossRef]
  52. Wang, J.; Zhong, Z. Revisiting the mass-luminosity relation with an effective temperature modifier. Astron. Astrophys. 2018, 619, L1. [Google Scholar] [CrossRef]
  53. Griffiths, S.C.; Hicks, R.B.; Milone, E.F. A re-examination of mass-luminosity relations from binary-star data. J. R. Astron. Soc. Can. 1988, 82, 1–12. [Google Scholar]
  54. Demircan, O.; Kahraman, G. Stellar Mass / Luminosity and Mass / Radius Relations. Astrophys. Space Sci. 1991, 181, 313–322. [Google Scholar] [CrossRef]
  55. Eker, Z.; Soydugan, F.; Soydugan, E.; Bilir, S.; Yaz Gökçe, E.; Steer, I.; Tüysüz, M.; Şenyüz, T.; Demircan, O. Main-Sequence Effective Temperatures from a Revised Mass-Luminosity Relation Based on Accurate Properties. Astron. J. 2015, 149, 131. [Google Scholar] [CrossRef]
  56. Moya, A.; Zuccarino, F.; Chaplin, W.J.; Davies, G.R. Empirical Relations for the Accurate Estimation of Stellar Masses and Radii. Astrophys. J. Suppl. Ser. 2018, 237, 21. [Google Scholar] [CrossRef]
  57. Malkov, O.Y.; Sichevskij, S.G.; Kovaleva, D.A. Parametrization of single and binary stars. Mon. Not. R. Astron. Soc. 2010, 401, 695–704. [Google Scholar] [CrossRef]
  58. Bressan, A.; Marigo, P.; Girardi, L.; Salasnich, B.; Dal Cero, C.; Rubele, S.; Nanni, A. PARSEC: Stellar tracks and isochrones with the PAdova and TRieste Stellar Evolution Code. Mon. Not. R. Astron. Soc. 2012, 427, 127–145. [Google Scholar] [CrossRef]
  59. Eker, Z.; Bakış, V.; Bilir, S.; Soydugan, F.; Steer, I.; Soydugan, E.; Bakış, H.; Aliçavuş, F.; Aslan, G.; Alpsoy, M. Interrelated main-sequence mass-luminosity, mass-radius, and mass-effective temperature relations. Mon. Not. R. Astron. Soc. 2018, 479, 5491–5511. [Google Scholar] [CrossRef]
  60. Hunt, E.L.; Reffert, S. Improving the open cluster census. II. An all-sky cluster catalogue with Gaia DR3. Astron. Astrophys. 2023, 673, A114. [Google Scholar] [CrossRef]
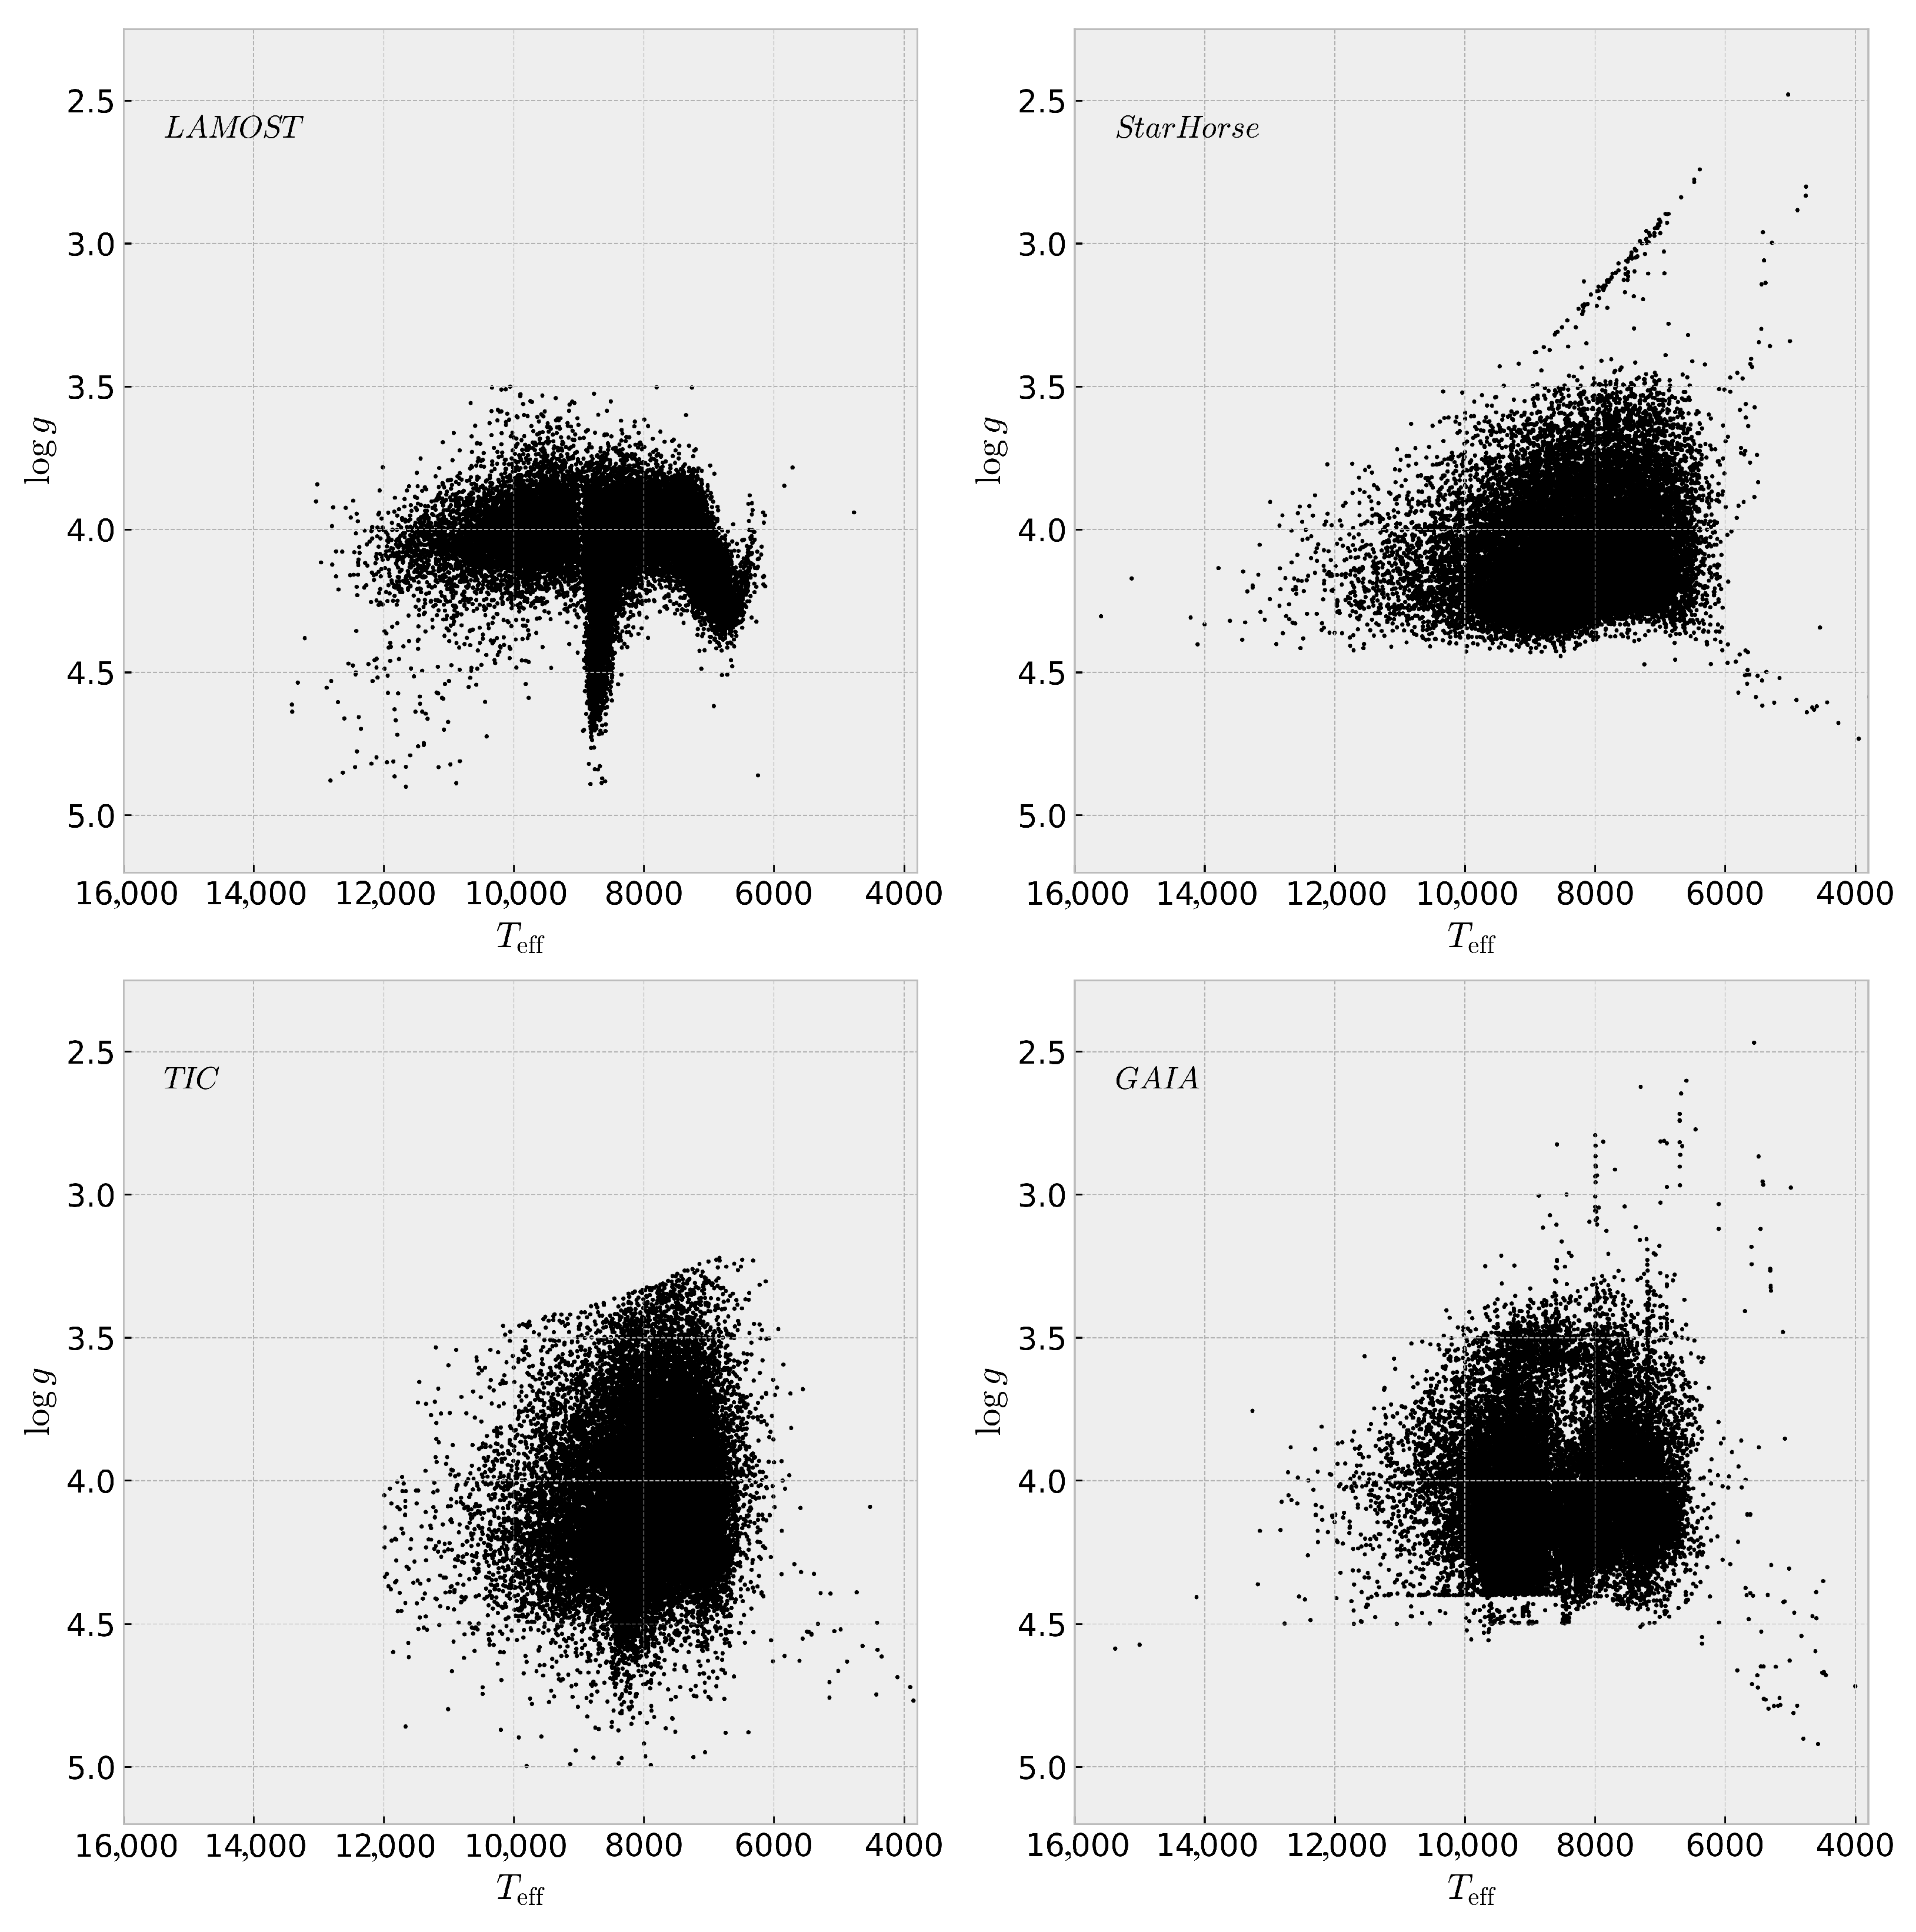
Figure 1. Kiel diagrams for the different catalogues we used.
Astronomy 04 00015 g001
Figure 2. Toomre diagram of the stars in our sample. The dotted lines describe total velocities V t o t in increments of 50 [ km s 1 ].
Astronomy 04 00015 g002
Figure 3. Comparison between the extinction values from G a i a and StarHorse. The x-axes are defined via Δ X = X G a i a X S H .
Astronomy 04 00015 g003
Figure 4. Scatter plot version of Figure 3. A clear cut of unknown reason can be seen. The red line depicts an ideal case where the extinction values would be identical in both catalogues.
Astronomy 04 00015 g004
Figure 5. The correlation plots and r-values for T eff (Section 2). The red line shows an ideal 1:1 relation of the Teff values.
Astronomy 04 00015 g005
Figure 6. Same as Figure 5 but for log g .
Astronomy 04 00015 g006
Figure 7. Comparison of B C V values from the different catalogues. The red lines correspond to a 1:1 relationship.
Astronomy 04 00015 g007
Figure 8. Same as Figure 7, but for the derived luminosity ratios. L 1 denotes the bolometric luminosity derived from T eff in the respective catalogue; L 2 is the bolometric luminosity derived from the subtracted B C V . The dashed red horizontal line corresponds to an ideal luminosity ratio of one.
Astronomy 04 00015 g008
Figure 9. MLR of our sample stars. The slopes for the piecewise functions are given in the plot and also in Table 5.
Astronomy 04 00015 g009
Figure 10. Mass–radius relation for our catalogues. The dashed lines correspond to the quadratics in the lower and higher-mass regimes, respectively. Again, the coefficients of the piecewise functions are given in the plots and in Table 6.
Astronomy 04 00015 g010
Figure 11. Different ages for the different catalogues of 38 stars in the cluster NGC 2168. The isochrones were taken from [58] using Z = 0.012 .
Astronomy 04 00015 g011
Table 1. Statistical properties of the differences in extinction.
Difference μ [Mag] σ [Mag] γ 1 γ 2
Δ A G +0.072+0.211−0.013+4.111
Δ A B P +0.091+0.251+0.034+4.248
Δ A R P +0.037+0.140−0.026+4.297
Table 2. Statistical properties of the differences in T eff .
Difference μ [K] σ [K] γ 1 γ 2
LAMOST—SH21+55.404703.794+0.505+4.959
LAMOST—TIC+249.421721.973+1.204+4.724
LAMOST—Gaia−205.857708.814+0.014+8.502
SH21—TIC+194.017574.952+1.432+7.976
SH21—Gaia−261.262700.037−0.101+5.162
TIC—Gaia−455.278662.693−0.695+3.810
Table 3. Statistical properties of the differences in log g .
Difference μ [dex] σ [dex] γ 1 γ 2
LAMOST—SH21−0.009+0.211+0.829+1.724
LAMOST—TIC−0.012+0.251+0.616+0.435
LAMOST—Gaia+0.022+0.217+0.885+1.652
SH21—TIC−0.002+0.125+0.233+2.923
SH21—Gaia+0.032+0.138+0.013+4.137
TIC—Gaia+0.034+0.165−0.146+2.056
Table 4. Different slopes for the MLR found in the literature.
Mass Range [ M / M ] α Reference
M > 0.40 2.440[53]
0.40 < M < 5.01 4.160
M > 5.01 3.510
0.7 < M 2.62[54]
M > 0.7 3.92
0.38 < M 1.05 4.841[55]
1.05 < M 2.40 4.328
2.40 < M 7.00 3.962
M > 7 2.726
Table 5. The exponent in the MLR for each catalogue and mass range derived from them.
Survey α
for
1.05 < M / M 2.4
α
for
2.4 < M / M 4.5
LAMOST 4.38 ± 0.01 3.90 ± 0.03
StarHorse 4.36 ± 0.01 4.10 ± 0.05
TIC 4.68 ± 0.01 4.44 ± 0.07
Gaia 4.28 ± 0.01 4.62 ± 0.03
Table 6. Coefficients for the piecewise quadratic fits in Equation (9).
SurveyMass–Radius Relation (MRR)
LAMOSTLower mass
α = 2.17 ± 0.15
β = + 2.02 ± 0.09
γ = 0.04 ± 0.01
Higher mass
α = + 2.37 ± 0.86
β = 1.65 ± 0.75
γ = + 0.71 ± 0.17
StarHorseLower mass
α = + 2.16 ± 0.26
β = 0.22 ± 0.15
γ = + 0.23 ± 0.02
Higher mass
α = 1.96 ± 1.541
β = + 2.52 ± 1.37
γ = 0.22 ± 0.30
TICLower mass
α = 3.52 ± 0.28
β = 0.49 ± 0.15
γ = 0.20 ± 0.02
Higher mass
α = 2.21 ± 2.10
β = + 2.98 ± 1.84
γ = 0.30 ± 0.40
GaiaLower mass
α = + 0.82 ± 0.27
β = + 0.36 ± 0.16
γ = + 0.17 ± 0.02
Higher mass
α = 1.07 ± 0.90
β = + 2.51 ± 0.80
γ = 0.35 ± 0.18
Disclaimer/Publisher’s Note: The statements, opinions and data contained in all publications are solely those of the individual author(s) and contributor(s) and not of MDPI and/or the editor(s). MDPI and/or the editor(s) disclaim responsibility for any injury to people or property resulting from any ideas, methods, instructions or products referred to in the content.