Abstract
There is a class of binary post-AGB stars (binary system including a post-AGB star) that are surrounded by Keplerian disks and outflows resulting from gas escaping from the disk. To date, there are seven sources that have been studied in detail through interferometric millimeter-wave maps of CO lines (ALMA/NOEMA). For the cases of the Red Rectangle, IW Carinae, IRAS 08544-4431, and AC Herculis, it is found that around ≥85% of the total nebular mass is located in the disk with Keplerian dynamics. The remainder of the nebular mass is located in an expanding component. This outflow is probably a disk wind consisting of material escaping from the rotating disk. These sources are the disk-dominated nebulae. On the contrary, our maps and modeling of 89 Herculis, IRAS 19125+0343, and R Scuti, which allowed us to study their morphology, kinematics, and mass distribution, suggest that, in these sources, the outflow clearly is the dominant component of the nebula (∼75% of the total nebular mass), resulting in a new subclass of nebulae around binary post-AGB stars: the outflow-dominated sources.Besides CO, the chemistry of this type of source has been practically unknown thus far. We also present a very deep single-dish radio molecular survey in the 1.3, 2, 3, 7, and 13 mm bands (∼600 h of telescope time). Our results and detections allow us to classify our sources as O- or /C-rich. We also conclude that the calculated abundances of the detected molecular species other than CO are particularly low, compared with AGB stars. This fact is very significant in those sources where the rotating disk is the dominant component of the nebula.
Keywords:
AGB; post-AGB; binaries; circumstellar matter; radio lines; planetary nebulae; interferometry 1. Introduction
There is a type of post-AGB star characterized by their spectral energy distributions (SEDs), which shows a near-infrared (NIR) excess indicating the presence of hot dust close to the the stellar system [1,2]. Their IR spectra reveal the presence of highly processed dust grains, so the dust might be located in stable structures [3,4,5]. All the above suggests the presence of circumbinary disks. Their disk-like shape has been confirmed by interferometric IR data see, e.g., [6,7]). Their radial velocity curves reveal that the post-AGB stars are part of a binary system (see, e.g., [2]). The systematic detection of binary systems in these objects strongly suggests that the angular momentum of the disks comes from the stellar system.
Observations of 12CO and 13CO in the and lines (230.538 and 220.398 GHz, respectively) have been well analyzed in sources with such NIR excess [8]. There are two types of CO line profiles: (a) narrow CO line profiles characteristic of rotating disks and weak wings, which implies that most of the nebular mass is contained in the disk (with Keplerian dynamics), and (b) composite CO line profiles including a narrow component, which very probably represents emission from the rotating disk, and strong wings, which represents emission from the outflow, which could dominate the nebula [8]. These types of line profiles are also found in young stars surrounded by a rotating disk made of remnants of interstellar medium (ISM) and those expected from disk-emission modeling (see, e.g., [8,9]). These results indicate that the CO emission lines of our sources come from disks with Keplerian or quasi-Keplerian rotation.
The study of the chemistry of this class of binary post-AGB stars, together with the very detailed kinematic analysis of Keplerian disks and outflows around these sources, is based on published articles (see [10,11]).
This paper is organized as follows. Technical information of our observations is given in Section 2. In Section 3, we present mm-wave interferometric maps and models of the most representative cases of a disk-dominated nebula (AC Herculis), an outflow-dominated nebula (R Scuti), and an intermediate case in between the disk- and the outflow-dominated nebula (89 Herculis). We present the first molecular survey in this kind of object in Section 4, together with discussions about molecular intensities and chemistry. Finally, we summarize our conclusions in Section 5.
2. Observations
We show interferometric maps of our sources using the NOEMA interferometer. Observations of the 12CO rotational transition were carried out towards AC Herculis, R Scuti, and 89 Herculis. Observations of the 13CO rotational transition were also obtained for 89 Herculis.
Our single-dish observations were performed using the 30 m IRAM telescope (Granada, Spain) and the 40 m Yebes telescope (Guadalajara, Spain). We observed at the 1.3, 2, 3, 7, and 13 mm bands. Our observations required a total telescope time of ∼600 h distributed over the two telescopes and for several projects to observe the nebulae around the next binary post-AGB stars: AC Her, the Red Rectangle, HD 52961, IRAS 19157−0257, IRAS 18123+0511, IRAS 19125+0343, AI CMi, IRAS 20056+1834, and R Sct.
3. NOEMA Observations
In this section, we present the results directly obtained from the observations for AC Her, R Sct, and 89 Her [10]. We show our NOEMA maps per velocity channel and position–velocity (PV) diagrams along the equatorial rotating disk and along the axis of the nebula (see Figure 1, Figure 2, Figure 3, Figure 4, Figure 5 and Figure 6).

Figure 1.
NOEMA maps per velocity channel of AC Her in 12CO emission. The contours are ±9, 18, 36, 76, and 144 mJy beam−1 with a maximum emission of 230 mJy beam−1. The LSR velocities are indicated in each panel (upper-left corner) and the beam size, 0.″35 × 0.″35, is shown in the last panel at the bottom right corner (yellow ellipse). We also show the synthetic maps from our best-fit model in white contours, to be compared with observational data; the scales and contours are the same.
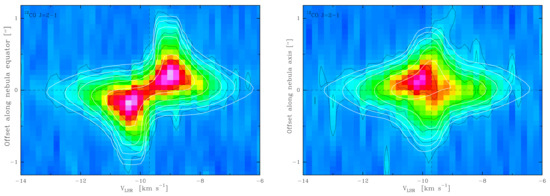
Figure 2.
Left: PV diagram from our NOEMA maps of 12CO in AC Her along the equatorial direction of the disk (). The contours are the same as in Figure 1. The dashed lines reveal the systemic velocity and the central position of the source. Additionally, we show the synthetic PV diagram from our best-fit model in white contours, to be compared with observational data; the scales and contours are the same. Right: Same as in left but along the axis direction of the nebula ().
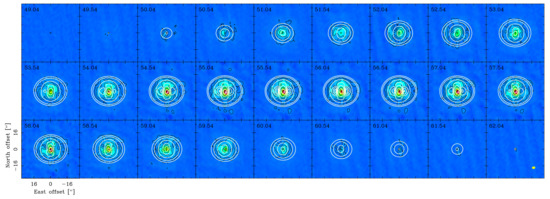
Figure 3.
Maps per velocity channel of R Sct in 12CO emission. The contours are ±50, 100, 200, 400, 800, and 1600 mJy beam−1 with a maximum emission of 2.4 Jy beam−1. The LSR velocities are indicated in each panel (upper-left corner) and the beam size, 3.”12 × 2.”19, is shown in the last panel at the bottom right corner (yellow ellipse). We also show the synthetic maps from our best-fit model in white contours, to be compared with observational data; the scales and contours are the same.
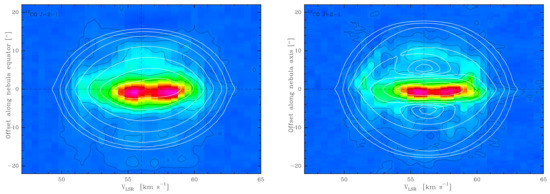
Figure 4.
Left: PV diagram from our maps of 12CO in R Sct along the equatorial direction (). The contours are the same as in Figure 3. The dashed lines reveal the systemic velocity and the central position of the source. Additionally, we show the synthetic PV diagram from our best-fit model in white contours, to be compared with observational data; the scales and contours are the same. Right: Same as in left but along the axis direction ().
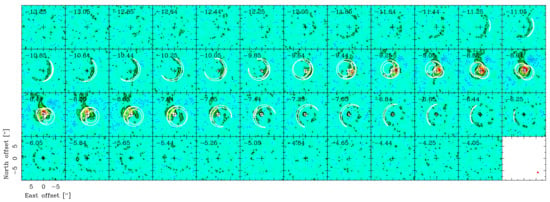
Figure 5.
NOEMA maps per velocity channel of 89 Her in 13CO emission. The contours are ± 11, 22, 44, 88, and 144 mJy beam−1 with a maximum emission of 225 mJy beam−1. The LSR velocities are indicated in each panel (upper-left corner) and the beam size, 0.”74 × 0.”56, is shown in the last panel at the bottom right corner (red ellipse). We also show the synthetic maps from our best-fit model in white contours, to be compared with observational data; the scales and contours are the same.
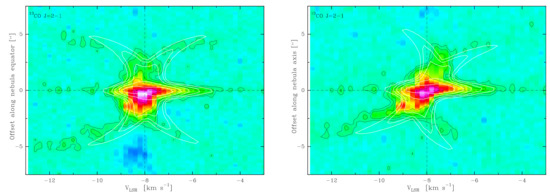
Figure 6.
Left: PV diagram from our NOEMA maps of 13CO in 89 Her along the equatorial direction of the disk (). The contours are the same as in Figure 5. The dashed lines reveal the systemic velocity and the central position of the source. Additionally, we show the synthetic PV diagram from our best-fit model in white contours, to be compared with observational data; the scales and contours are the same. Right: Same as in left but along the axis direction of the nebula ().
3.1. AC Herculis
The 12CO mm-wave interferometric maps are presented in Figure 1. We can see in the left panel of Figure 2 the PV diagram along the equatorial direction, and it very clearly shows the characteristic signature of rotation with Keplerian dynamics. On the contrary, the analysis of the PV diagram along the nebula axis direction helps us to detect the presence of an axially outflowing component (see Figure 2 right). A theoretical PV diagram along the axis direction in the presence of a disk with Keplerian dynamics might show emission with a form close to a rhombus, with equal or very similar emission in all four quadrants of the PV diagram. Nevertheless, we do not see equal emission in the four quadrants: we see slightly inclined emission at central velocities at around ±1″. This fact can be explained by the existence of an expanding component that surrounds the rotating disk.
3.2. R Scuti
We present combined NOEMA maps and 30 m maps of R Sct in 12CO emission in Figure 3 and PV diagrams in Figure 4. In both figures, we clearly see two components: an intense inner region and an extended component of around ∼40″ surrounding the inner region. This extended and expanding component contains most of the total nebular mass (see Section 3.4.2). The PV diagram along the equatorial direction shows an intense central clump in the innermost region of the nebula that may represent the unresolved rotating disk (see Figure 4 left). The velocity dispersion from the inner (and unresolved) central condensation is similar to other post-AGB nebulae with disks, including a significant lack of blueshifted emission (see, e.g., [12]). The PV diagram along the nebula axis reveals the structure of the nebula (see Figure 4 right): we clearly see two large cavities at approximately ±10″. We see this type of structure in other pPNe, such as M 2−56 [13] or M 1−92 [14].
3.3. 89 Her
We present NOEMA maps and PV diagrams of 89 Her of 13CO emission (and 12CO ; see [10] for further details) in Figure 5 and Figure 6. We see an intense central clump and an extended hourglass-shaped structure surrounding this central clump. For a distance of 1 kpc, the size of the hourglass-like structure is, at least, 10,000 AU.
3.4. Models
Our models consist of a disk with present Keplerian dynamics and an extended and expanding component escaping from the rotating disk and surrounding it. The outflowing component can present different shapes, such as an hourglass, an ellipsoid, etc. We assume LTE populations, which is a reasonable assumption for low-J rotational levels of CO transitions. We consider potential laws for the density (n) and rotational temperature (T). Additionally, we also consider Keplerian dynamics in the rotating disk () and radial expansion in the extended component (). We must highlight that our code produces results that can be quantitatively compared to observations.
3.4.1. AC Her
Our proposed model for the structure of AC Her (Figure 7; see also Figure 1 and Figure 2) is very similar to the one found for the Red Rectangle, IRAS 08544−4431, and IW Car (see [12,15,16]). The total mass of the nebula is 8.3 × 10⁻⁴ M⊙. Our model predicts that the mass of the outflow must be ≤5% of the total mass. Thus, AC Her is clearly a binary post-AGB star surrounded by a disk-dominated nebula, due to the fact that the mass of the Keplerian disk is, at least, 19 times larger than that of the outflow. The Keplerian rotation velocity field of the disk is compatible with a central total stellar mass of ∼1 M⊙.
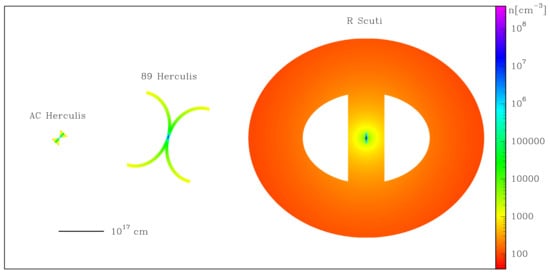
Figure 7.
Density distribution and structure of our best-fit model for the disk and outflow of AC Her, 89 her, and R Sct as seen from the observer. All models are shown with the same scale so that we can see their relative sizes.
3.4.2. R Sct
Our proposed model for the structure of R Sct is presented (Figure 7; see also Figure 3 and Figure 4). There are slight differences between the PV diagrams, but all of them are accounted for in our uncertainties. We note that our best-fit model cannot be very different from other models. The nature of R Sct is not yet clear, but our interferometric maps firmly suggest that this source is also a binary post-AGB star surrounded by a disk with Keplerian dynamics and by a high-mass extended and expanding component. The mass of the nebula is found to be ∼ 3.2 × 10⁻² M⊙ and approximately ∼25% of the nebular material would be placed in the rotating disk. This fact, together with the large size of the outflow, allows us to classify this source as an outflow-dominated post-AGB nebula. The disk with Keplerian dynamics is compatible with a central stellar mass of 1.7 M⊙.
3.4.3. 89 Her
The total mass of the nebula around 89 Her is 1.4 × 10⁻² M⊙ and our proposed model predicts that the mass of the hourglass must be ∼50% of the total mass (Figure 7; see also Figure 5 and Figure 6). Thus, this source is in between the disk- and outflow-dominated sources. We find that the disk with Keplerian dynamics is compatible with a central stellar mass of 1.7 M⊙.
4. First Molecular Survey in Binary Post-AGB Stars
The chemistry of this kind of binary post-AGB source with rotating disks is practically unknown. We present a very deep and wide survey of radio lines in ten of our sources: AC Her, the Red Rectangle, 89 Her, HD 52961, IRAS 19157−0257 IRAS 18123+0511, IRAS 19125+0343, AI CMi, IRAS 20056+1834, and R Sct. All of them have been observed at 7 and 13 mm, and most of them have been also observed in the 1.3, 2, and 3 mm bands; see Table 1 (see [11]).

Table 1.
Molecular transitions detected in this work.
4.1. Molecular Richness
We show in Figure 8 integrated intensity ratios between the main rare molecules (SO, SiO, SiS, CS, and HCN) and CO (13CO and 12CO ). Additionally, we also compare these molecular integrated intensities with the 12, 25, and 60 m IR emission. The averaged of our results are represented with black horizontal lines. We compare our results with the molecular emission of AGB stars (blue and red horizontal lines represent averaged values of the molecular emission for O- and C-rich AGB stars, respectively). We note that the average of our results always presents low molecular emission in molecules other than CO. Note the large range (logarithmic scale) of intensity ratios. These low intensities are more remarkable in the disk-dominated sources, such as AC Her and the Red Rectangle (see [10,11]).
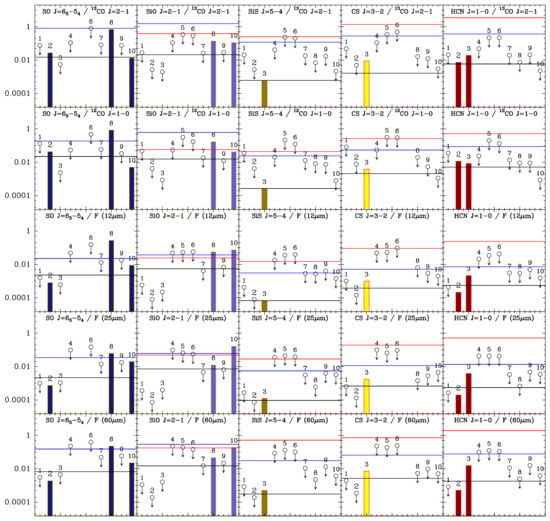
Figure 8.
Ratios of integrated intensities of molecules (SO, SiO, SiS, CS, and HCN) and IR emission (12, 25, and 60 m) in our sources. The binary post-AGB stars are ordered by increasing outflow dominance: 1—AC Her, 2—Red Rectangle, 3—89 Herculis, 4—HD 52961, 5—IRAS 19157−0257, 6—IRAS 18123+0511, 7—IRAS 19125+0343, 8—AI CMi, 9—IRAS 20056+1834, and 10—R Sct. Empty circles with arrows represent upper limits. Our results are averaged (black lines) and are compared with averaged values for O- and C-rich AGB CSEs (blue and red lines, values taken from [17,18]). Our sample of nebulae around binary post-AGB stars clearly presents low molecular emission in molecules other than CO.
4.2. The Discrimination between O- and C-Rich Envelopes
Evolved stars present a O/C > 1 and O/C < 1 chemistry, so they can be classified as O- and C-rich environments, respectively. The O/C abundance ratio has important effects on the molecular abundances. The lines of O-bearing molecules are much more intense in O-rich environments than in the C-rich ones (such as SiO and SO). On the contrary, the lines of C-bearing molecules are much more intense in C-rich environments (see, e.g., [17,18]). Additionally, SiO and H2O maser emission is exclusive to O-rich environments (see, e.g., [19]).
We analyze the integrated intensities of pairs of molecular transitions, and this analysis is crucial to distinguish between O- and C-rich environments (see Figure 9). When an O-bearing molecule is compared with a C-bearing one, we find that the integrated intensities are larger in O-rich than in C-rich sources. Our results are compared with CSEs around AGB stars, because they are prototypical environments rich in molecules.
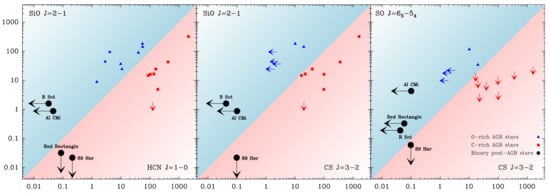
Figure 9.
Integrated intensities of pairs of molecular transitions in binary post-AGB stars (black circles, upper limits are represented with arrows), as well in O- and C-rich AGB CSEs (blue and red squares). O- and C-rich environment areas are represented in blue and red, respectively. The integrated intensities of the transitions are expressed in Jy km s−1 and in logarithmic scale.
Based on the maser detection of O-bearing molecules (SiO maser emission in R Sct, AI CMi, and IRAS 20056+1834; H2O maser emission in R Sct and AI CMi), we classify some of our sources as O-rich. On the contrary, and based on the integrated intensity ratios, we classify the nebula around 89 Her as C-rich (see Figure 9). Therefore, the nebula around AC Her, the Red Rectangle, AI CMi, IRAS 20056+1834, and R Sct presents a O/C > 1 chemistry, while 89 Her presents a O/C < 1 environment [11].
5. Conclusions
There is a class of post-AGB star that is part of a binary system with a significant NIR excess that is surrounded by a disk with Keplerian dynamics and an extended and expanding component composed of gas escaping from the disk and surrounding it.
Based on our observational data and model results, we find disk-dominated sources that present ≥85% of the total nebular mass located in the Keplerian disk. This is the case of AC Herculis. We also find a subclass of these binary post-AGB stars, in which the disk contains ∼25% of the total mass of the nebula, such as R Scuti. The extended components of these outflow-dominated sources are mainly composed of cold gas. Moreover, our NOEMA maps and modeling suggest that the nebula around 89 Her is in an intermediate case between both the disk- and the outflow-dominated sources, since around 50% of the nebular mass is located in the rotating disk. See Section 3 for further details. HD 52961 and IRAS 1957−0247 would also belong to this intermediate case. However, the existence of this intermediate type is not clear, because these objects were classified as intermediate sources under high uncertainties and they could belong to either subclass: the disk- or the outflow-dominated sources. In the case of 89 Her, our new 30 m IRAM on-the-fly observations recover all the filtered flux. These maps show a larger hourglass-like structure compared to that in the NOEMA maps. According to these new maps and preliminary results, the hourglass-like structure around 89 Her could contain most of the material (Gallardo Cava et al., in prep).
We present the first survey in the search for molecules other than CO in binary post-AGB stars surrounded by Keplerian disks (see Section 4). The emission of molecules other than CO in our sources is low and this fact is especially remarkable in the disk-dominated nebulae. Additionally, and according to our analysis, we catalog the chemistry of 89 Her as C-rich. On the contrary, we find O-rich environments in AC Her, the Red Rectangle, AI CMi, IRAS 20056+1834, and R Sct.
Author Contributions
Conceptualization, I.G.C., V.B. and J.A.; methodology, I.G.C., V.B. and J.A.; software, I.G.C. and V.B.; validation, I.G.C., V.B., J.A., M.G.-G., A.C.-C., H.V.W. and M.S.-G.; formal analysis, I.G.C., V.B., J.A. and H.V.W.; investigation, I.G.C., V.B. and J.A.; resources, I.G.C., V.B., J.A., M.G.-G., A.C.-C., H.V.W. and M.S.-G.; data curation, I.G.C., V.B., J.A., M.G.-G. and A.C.-C.; writing—original draft preparation, I.G.C.; writing—review and editing, I.G.C., V.B. and J.A.; visualization, I.G.C., V.B. and J.A.; supervision, I.G.C., V.B. and J.A.; project administration, J.A.; funding acquisition, J.A. and V.B. All authors have read and agreed to the published version of the manuscript.
Funding
This work is part of the AxiN and EVENTs/NEBULAE WEB research programs supported by Spanish AEI grants AYA 2016-78994-P and PID2019-105203GB-C21. I.G.C. acknowledges Spanish MICIN for the funding support of BES2017-080616.
Data Availability Statement
Not applicable.
Conflicts of Interest
The authors declare no conflict of interest.
References
- Van Winckel, H. Post-AGB Stars. Annu. Rev. Astron. Astrophys. 2003, 41, 391–427. [Google Scholar] [CrossRef]
- Oomen, G.M.; Van Winckel, H.; Pols, O.; Nelemans, G.; Escorza, A.; Manick, R.; Kamath, D.; Waelkens, C. Orbital properties of binary post-AGB stars. Astron. Astrophys. 2018, 620, A85. [Google Scholar] [CrossRef]
- Gielen, C.; Bouwman, J.; van Winckel, H.; Lloyd Evans, T.; Woods, P.M.; Kemper, F.; Marengo, M.; Meixner, M.; Sloan, G.C.; Tielens, A.G.G.M. Silicate features in Galactic and extragalactic post-AGB discs. Astron. Astrophys. 2011, 533, A99. [Google Scholar] [CrossRef]
- Jura, M. A Flared, Orbiting, Dusty Disk around HD 233517. Astrophys. J. 2003, 582, 1032–1035. [Google Scholar] [CrossRef][Green Version]
- Sahai, R.; Claussen, M.J.; Schnee, S.; Morris, M.R.; Sánchez Contreras, C. An Expanded Very Large Array and CARMA Study of Dusty Disks and Torii with Large Grains in Dying Stars. Astrophys. J. 2011, 739, L3. [Google Scholar] [CrossRef][Green Version]
- Hillen, M.; Van Winckel, H.; Menu, J.; Manick, R.; Debosscher, J.; Min, M.; de Wit, W.J.; Verhoelst, T.; Kamath, D.; Waters, L.B.F.M. A mid-IR interferometric survey with MIDI/VLTI: Resolving the second-generation protoplanetary disks around post-AGB binaries. Astron. Astrophys. 2017, 599, A41. [Google Scholar] [CrossRef]
- Kluska, J.; Van Winckel, H.; Hillen, M.; Berger, J.P.; Kamath, D.; Le Bouquin, J.B.; Min, M. VLTI/PIONIER survey of disks around post-AGB binaries. Dust sublimation physics rules. Astron. Astrophys. 2019, 631, A108. [Google Scholar] [CrossRef]
- Bujarrabal, V.; Alcolea, J.; Van Winckel, H.; Santander-García, M.; Castro-Carrizo, A. Extended rotating disks around post-AGB stars. Astron. Astrophys. 2013, 557, A104. [Google Scholar] [CrossRef]
- Guilloteau, S.; Di Folco, E.; Dutrey, A.; Simon, M.; Grosso, N.; Piétu, V. A sensitive survey for 13CO, CN, H2CO, and SO in the disks of T Tauri and Herbig Ae stars. Astron. Astrophys. 2013, 549, A92. [Google Scholar] [CrossRef]
- Gallardo Cava, I.; Gómez-Garrido, M.; Bujarrabal, V.; Castro-Carrizo, A.; Alcolea, J.; Van Winckel, H. Keplerian disks and outflows in post-AGB stars: AC Herculis, 89 Herculis, IRAS 19125+0343, and R Scuti. Astron. Astrophys. 2021, 648, A93. [Google Scholar] [CrossRef]
- Gallardo Cava, I.; Bujarrabal, V.; Alcolea, J.; Gómez-Garrido, M.; Santander-García, M. Chemistry of nebulae around binary post-AGB stars: A molecular survey of mm-wave lines. Astron. Astrophys. 2022, 659, A134. [Google Scholar] [CrossRef]
- Bujarrabal, V.; Castro-Carrizo, A.; Alcolea, J.; Santand er-García, M.; van Winckel, H.; Sánchez Contreras, C. Further ALMA observations and detailed modeling of the Red Rectangle. Astron. Astrophys. 2016, 593, A92. [Google Scholar] [CrossRef]
- Castro-Carrizo, A.; Bujarrabal, V.; Sánchez Contreras, C.; Alcolea, J.; Neri, R. The structure and dynamics of the molecular envelope of M 2-56. Astron. Astrophys. 2002, 386, 633–645. [Google Scholar] [CrossRef]
- Alcolea, J.; Neri, R.; Bujarrabal, V. Minkowski’s footprint revisited. Planetary nebula formation from a single sudden event? Astron. Astrophys. 2007, 468, L41–L44. [Google Scholar] [CrossRef]
- Bujarrabal, V.; Castro-Carrizo, A.; Alcolea, J.; Van Winckel, H.; Sánchez Contreras, C.; Santand er-García, M. A second post-AGB nebula that contains gas in rotation and in expansion: ALMA maps of IW Carinae. Astron. Astrophys. 2017, 597, L5. [Google Scholar] [CrossRef]
- Bujarrabal, V.; Castro-Carrizo, A.; Van Winckel, H.; Alcolea, J.; Sánchez Contreras, C.; Santander-García, M.; Hillen, M. High-resolution observations of IRAS 08544-4431. Detection of a disk orbiting a post-AGB star and of a slow disk wind. Astron. Astrophys. 2018, 614, A58. [Google Scholar] [CrossRef] [PubMed]
- Bujarrabal, V.; Fuente, A.; Omont, A. The Discrimination between O- and C-rich Circumstellar Envelopes from Molecular Observations. Astrophys. J. 1994, 421, L47. [Google Scholar] [CrossRef]
- Bujarrabal, V.; Fuente, A.; Omont, A. Molecular observations of O- and C-rich circumstellar envelopes. Astron. Astrophys. 1994, 285, 247–271. [Google Scholar]
- Kim, J.; Cho, S.H.; Bujarrabal, V.; Imai, H.; Dodson, R.; Yoon, D.H.; Zhang, B. Time variations of H2O and SiO masers in the proto-Planetary Nebula OH 231.8+4.2. Mon. Not. R. Astron. Soc. 2019, 488, 1427–1445. [Google Scholar] [CrossRef]
Publisher’s Note: MDPI stays neutral with regard to jurisdictional claims in published maps and institutional affiliations. |
© 2022 by the authors. Licensee MDPI, Basel, Switzerland. This article is an open access article distributed under the terms and conditions of the Creative Commons Attribution (CC BY) license (https://creativecommons.org/licenses/by/4.0/).