Abstract
Extremely slow recession of the Moon from the Earth has been recently proposed and attributed to conversion of Earth’s axial spin to lunar orbital momentum. This hypothesis is inconsistent with long-standing recognition that the Moon’s orbit involves three-body interactions. This and other short-comings, such as Earth’s spin loss being internal, are summarized here. Considering point-masses is justified by theory and observational data on other moons. We deduce that torque in the Earth-Moon-Sun system increases eccentricity of the lunar orbit but decreases its inclination over time. Consequently, the average lunar orbital radius is decreasing. We also show that lunar drift is too small to be constrained through lunar laser ranging measurements, mainly because atmospheric refraction corrections are comparatively large and variations in lunar cycles are under-sampled. Our findings support co-accretion and explain how orbits evolve in many-body point-mass systems.
1. Introduction
Kepler’s elliptical orbits (the reduced two-body problem) reasonably approximates much of the solar system, but neither describes its evolutionary behavior, nor accurately portrays the orbital dynamics of the Moon, which only appears to orbit the Earth. Rather, both bodies co-operatively orbit the Sun (e.g., []). Gravitational interactions of three unequal masses, considered by Euler and Lagrange, should pertain. However, the Moon does not occupy any of the Lagrangian points, which are stable positions when two minor bodies move in a plane fixed in space about a very large body (Figure 1). Hence, instability of the lunar orbit is of long standing and current interest (e.g., []).
Recent studies consider the lunar orbital radius to be very slowly growing. The tiny change, alleged to be +38 mm y−1 from modelling recent lunar laser ranging (LLR) measurements (e.g., [,,,]), is attributed to conversion of Earth’s spin, which is decreasing, into lunar orbital angular momentum, which is perceived as increasing (e.g., []). This transfer hypothesis approximates the Earth and Moon as being an isolated two-body system [], a case where no torque can exist [], so angular momentum of the system should be conserved.
The hypothesis is poorly reasoned, as follows:
- Neither body is isolated from the Sun [], as illustrated in Figure 2.
- Torque is required to modify angular momentum [], yet torque () on the Moon originating from the Earth is zero, because their vectors for separation distance (r) and their attractive gravitational force (F) are collinear.
- No mechanism has been proposed for transforming axial spin of a body to the orbital angular momentum of a distant body.
- Equations for the gravitational origin of orbits do not depend on the spin of the central body: indeed, a body need not even exist at the system barycenter, as exemplified by Pluto and Charon.
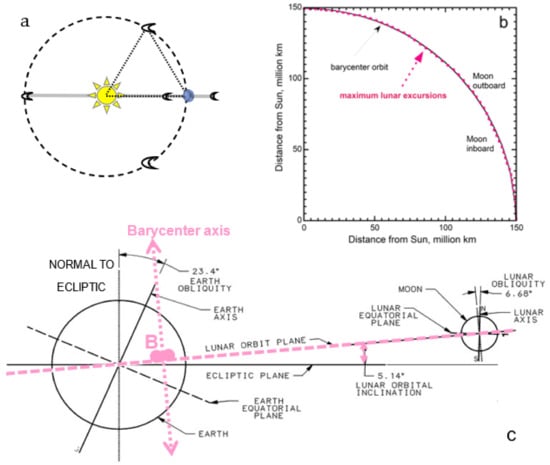
Figure 1.
Key features of the 3-body Earth-Moon-Sun system: (a) Schematic of stable 3-body orbits around the stationary Sun in a plane fixed in space. Blue orb represents Earth. Large crescents depict stable orbital positions at the 60° and antipodal Lagrangian points. Tiny crescents depict quasi-stable points utilized for satellites; (b) Quadrant of the lunar orbit showing a to scale comparison of the nearly circular barycenter orbit (solid line) to the Moon’s sinuous orbit (pink dots), which reaches a maximum of ~405,000 km from Earth (e.g., []). The actual excursion is slightly less than the maximum shown, due to the orbit being elliptical. The lunar monthly period is idealized as 1/12th of a year; (c) Orientation of Earth’s spin and various orbital elements. The barycenter and ecliptic planes are distinct. Pink indicates components affected by the time-varying lunar orbit. The directions of the barycenter axis and the spin axis vary from ~0 to 28.5° over the lunar cycling, and precess independently. The radial position of the barycenter (B, pink double dots) varies by ~500 km over a month inside the lower mantle. Its longitude varies by 360° every day. Earth–Moon distance is not to scale, but body sizes and angles are. Part c was modified after [], which has a Creative Commons 4 license.
Hence, revisiting stability and evolution of the lunar orbit is warranted. The purpose of this report is to provide a physically plausible cause of the current changes, which could provide constraints on the origin of the moon.
The paper is based on Newtonian physics. Section 2 describes the complex lunar orbit, its multiple cycles, and how orbital parameters, namely the semi-major axis (a), eccentricity (e), and inclination (i), are ascertained. Section 3 explains why the lunar orbit can be treated as gravitational interactions between point-masses. Section 4 discusses reduction of body spin through internal dissipation. Section 5 sets limits on changes in lunar a, e, and i using conservation laws, and accesses the possible changes based on force imbalances and torques experienced by the Moon during the three-body point-mass interactions. Section 6 covers the problems in LLR models which prevent quantifying lunar orbital evolution. Section 7 discusses lunar evolution and origin, and compares our findings to behavior of the planets, which are also perturbed by three-body interactions []. Section 8 concludes.
2. Observations and Parameterization of the Unique Lunar Orbit and its Cycles
In this work, “lunar orbit” refers to the Moon encircling the Earth, whereas “sinuous lunar path” is applied to the actual motions of the Moon about the Sun in the heliocentric frame of reference. The lunar orbit is around the barycenter of the Earth–Moon system. The enormous Solar mass allows us to treat the Sun as stationary in our theoretical assessment, and so “barycenter” as used in this report refers to the barycenter of the Earth–Moon system, which orbits the Sun in a nearly circular path.
2.1. Long-Standing Techniques for Measuring Motions in the Solar System
Motions of the Moon, Sun, and planets have been reliably recorded from the Earth against the stars for ~200 years. Only motions perpendicular to the line-of-sight are well-resolved. Consequently, mathematical modeling and multicomponent fitting are used to describe the apparent motions of astronomical bodies against the background of stars and to parameterize the orbital motions [,,]. Although the Earth–Moon barycenter moves in an elliptical orbit around the Sun, the position of Earth’s center in space is controlled by the varying Earth–Moon distance: Thus, the geoenter does not move around the Sun in a simple elliptical orbit (Figure 1). Neither are geocenter cycles annual because the Julian year is not an integer multiple of any lunar monthly cycle (see below). Due to this complexity, observations are based on Earth crossing the ecliptic in the spring (the vernal equinox) which defines the ecliptic plane for that particular year, and also an imaginary grid of longitude and latitude against the stars.
Projecting motions forward in time requires revising model parameters. Newcomb’s [] meticulous calculations were used for many decades. Such models describe observations of the Moon from the Earth as polynomial expansions with five to nine terms [,], and similarly depict motions of the planets. From these models, which are affected by the Earth’s complex motions in a time-varying plane, orbital parameters are extracted. Trade-offs exist between providing accuracy for the present century and a large time span of applicability [].
2.2. Lunar Orbital Parameters and Velocities
Available data show that the Moon’s orbit around the barycenter, on average, resembles a Keplerian ellipse. Table 1 provides orbital and body parameters.

Table 1.
Physical parameters and notation 1.
Table 1.
Physical parameters and notation 1.
| Description | Symbol | Value | Description | Symbol | Value |
|---|---|---|---|---|---|
| Solar mass | MS | 1.99 × 1030 kg | Gravitational constant | G | 6.674 × 10⁻¹¹ m3 kg−1s−2 |
| Earth’s mass | ME | 5.97 × 1024 kg | Barycenter orbit radius | rB | 149.6 × 10⁶ km |
| Lunar mass | Mm | 7.35 × 10²² kg | Lunar semi-major axis 2 | a | 384,748 km |
| Earth’s average radius | RE | 6371 km | Lunar eccentricity 2 | e | 0.05490 |
| Moon’s average radius | Rm | 1738 km | Inclination to Earth’s equator 3 | i | 18–28° |
| Earth’s ellipticity | ε | 0.003353 | Barycenter-geocenter distance | B | average ~4670 km |
1 Subscripts S refers to the Sun; E to the Earth, m to the Moon; and B for barycenter is used as both a symbol and subscript. Sources: [,,]. Some apparent inconsistency among sources exists, as lunar orbital radii may refer to the geocenter, which is more convenient. 2 Refers to the Moon’s average ellipse around the barycenter, which varies monthly and yearly. 3 See Figure 1c for the many angles of components in the Earth-Moon-Sun system.
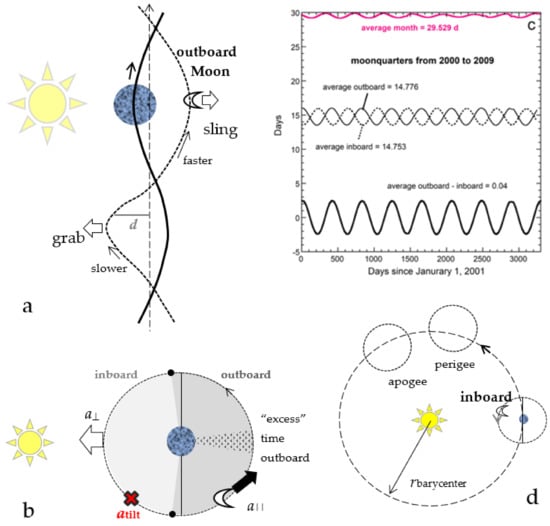
Figure 2.
Geometry of the sinuous lunar orbit and its cycles: (a) Plan view of the whirligig orbits of the Moon and Earth, and of the circular barycenter orbit, all about the Sun. The barycenter orbit is straight for simplicity. The crossings as sketched for the Moon and Earth are required for non-colliding paths and fixed orbital radius, but are distorted in this view; (b) Plan view of an ideal 2-body orbit of the Moon around the Earth, for which representation, the Sun can be considered as a perturbing force. Hence, the Sun accelerates the Moon along (a||) and perpendicular (a⊥) to its orbit around the Earth except during the crossings of the barycenter orbit (black dots). The Moon is additionally accelerated towards the barycenter plane (atilt at ×). Due to curvature of the barycenter orbit, the Moon spends more time outboard than inboard (stippled pie slice); (c) Graph of days since 1 January 2001 between sequential first and last quarters of the Moon from January 2001 to the end of the 8.85 year apsidal precession cycle in 2009, obtained from tabulated data for the century [], and confirmed by comparison to ephemeris tables []. This cycle describes a complete revolution of the orbital ellipse. The number of days outboard vs. inboard varies from −2.49 to +2.52, so the Moon spends a small excess fraction of the month outboard; (d) Plan view of the orbits around the Sun, from a geocentric perspective, showing additional effects of the non-circular lunar orbit.
Tangential velocities are ~1 km s−1 for the Moon’s apparent path around the Earth, or ~30 km s−1 for the barycenter around the Sun (e.g., []). To “keep pace with the Earth” the Moon moves faster when it is outboard of the barycenter, than inboard, but because the barycenter orbit is curved, the moon spends more time outboard (Figure 2).
2.3. Lunar Cycles: “Year” vs. “Month”
To observers on Earth, phases of the Moon and eclipses define key lunar cycles. Phases of the Moon repeat on average every 29.53 days, providing the well-known synodic month. Full moons occur at the extreme outboard position with respect to the Sun and the barycenter orbit, whereas new moons occur at the extreme inboard position (Figure 2). Quarter moons roughly occur at medial times along the barycenter path, due to its curvature. Tilt of the lunar orbital plane with respect to the barycenter plane (Figure 1) and its varying orientation make eclipses infrequent, rather than monthly [,,,].
Other definitions exist for a lunar month []. The important cycle as regards orbital evolution is the anomalistic period of 27.55 days, which represents the interval from perigee to perigee (or apogee to apogee).
Due to inclination, eccentricity, the variable orientation of the lunar orbital plane with respect to the fixed reference frame of the barycenter plane, and the anomalistic cycle not being some simple fraction of a year (i.e., the barycenter orbital period of 365.25 days), the orbit of the Moon around the Sun involves several long cycles. Many are on human time-scales [,,,]. Apsidal precession takes 8.85 years (Figure 2). The ~19 year Metonic cycle links the synodic month to the tropical year, but the Callippic cycle of 76 years is more exact. The Saros cycle of 18.029 years concerns eclipses, and thus a special repeated orientation of the lunar and barycenter planes.
2.4. Motivation to Directly Measure the Moon’s Orbital Radius
Various scenarios for formation suggest slow growth of the average radius of the lunar orbit. For example, if the Moon was ejected from the Earth or fission occurred [], its current average orbital radius suggests growth at ~90 mm y−1 assuming zero radius at solar system beginnings. This upper limit for recession is 12 or 13 orders-of-magnitude smaller than orbital velocities (Section 2.2), and is far too small to quantify based on observations against the stars. Alternatively, as proposed by Laplace, the Moon could have formed from a ring of dust around the Earth (see, e.g., [,] and references therein). Co-accretion points to an originally circular orbit at some finite radius, permitting negative values for lunar drift. Section 5 provides details.
Crucially, annual resetting of the geocentric reference frame at the vernal equinox greatly complicates, if not prohibits, quantification of multi-year changes. Thus, to measure possible tiny perturbations of the Moon’s orbit, laser light is reflected from retro-reflectors (denoted “mirrors” for brevity) placed on the Moon by astronauts (e.g., []). See Section 6 for details.
3. Gravitational Attraction to Oblate Planets and to the Pluto-Charon Binary
Two facts pertain to the motion of a small mass in the gravitational potential well of large body. First, at some distance from any mass distribution, the gravitational potential must reduce to the inverse radial dependence associated with a point mass. Second, the radial force of gravity, combined with forces during axial spin, renders large self-gravitating bodies oblate: this reduction in symmetry makes the force field non-central []. This section discusses how gravitational attraction to the oblate and lower symmetry distribution affect natural satellites in our solar system.
3.1. Gravitational Attraction to Non-Spherical Mass Distributions
The gravitational potential exterior to an oblate body, first derived by Gauss and Dirichlet, is complex even for a body of homogenous density. Hofmeister et al. [] provide simpler, but exact, equations along the special axes of an axisymmetric body for the potential (φ) and force (F) as functions of the radial (r) and axial (z) directions:
where m is the mass of an exterior test body, and M is the mass of the central body with equatorial radius α and ellipticity ε. MacMillan [] provides a formula equivalent to Equation (1). Figure 3a shows that the axial, equatorial and spherical potentials converge rapidly with increasing distance even if the oblate body is very flat. Thus, beyond a few body radii, the attraction is close to that of a spherical distribution. Convergence becomes more rapid as ellipticity decreases.
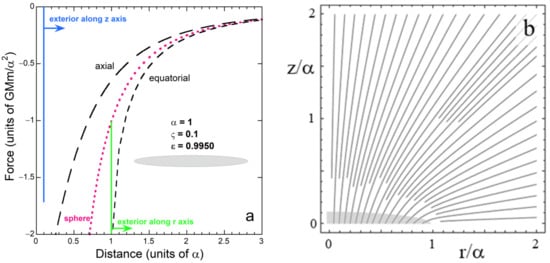
Figure 3.
Gravitational forces around the upper right quadrant of a highly flattened oblate spheroid: (a) Values of force along the two special directions for a body with ε/α = 0.1, shown as a grey oval (where ς is the polar radius), compared to the force around a sphere of equivalent mass (pink dotted curve). At 10 body radii (Distance = 10 α; offscale), the forces along special directions of this flattened spheroid only differ from than that of the sphere by ±0.3%; (b) Directions of force, which are continuous from outside to inside the body (faint gray oval). Both parts modified after Hofmeister et al. [] (Figures 4a and 7f therein), with permissions.
For the general point exterior to the body:
where:
The term in square brackets in Equation (5) is dimensionless and reveals the non-central nature of gravitational attraction to an oblate body []. Specifically, at each and every external point, the potential is not inversely proportional to the spherical radial distance s = (r2 + z2)½. Moreover, at a general point the force is not even directed towards the object’s center (Figure 3b: see [] for additional examples).
Regarding the special directions, symmetry requires that force vectors along the polar axis and above the equatorial plane do point towards the center, but again force magnitudes neither vary as 1/r2 nor as 1/s2 per Equations (1)–(6).
3.1.1. Comparison with the Generalized Potential Used in Fitting
The “generalized” potential describes attraction of a test mass to a large body as a perturbation on results for a sphere []:
where αave is mean equatorial body radius; s, θ, and λ are the spherical orbital radius, latitude, and longitude of the test mass; Pnk are associated Legendre functions of the first kind; and Cnk and Snk are numerical coefficients obtained from fitting. As a potential for a planet must necessarily include their predominantly oblate shape, limitations of the generalized potential are understood by comparing Equation (7) to the exact results for an oblate body, Equations (1)–(6).
For an axially symmetric body, Cnk and Snk terms involve longitude and k = 0, where the zonal harmonic coefficients (Jn, defined as −Cn0) are used in fitting, e.g., of motions of satellites around a gas giant. Equation (7) can only be reconciled with results for the special axes, Equations (1) and (2), if and only if the relationship for each term:
is used []. Furthermore, this equivalence also presumes that many terms in each series are used to achieve convergence, which is atypical of fitting procedures using Equation (7), see, e.g., [].
Furthermore, the series describing points off the special axes of the oblate body is incompatible with the generalized potential. The meaning of the coefficients is lost in fitting, because attraction to an oblate body is not central as in Equation (7), as illustrated in Figure 4. In short, the properties of Equation (7) are incompatible with those of oblate bodies. The theoretical and observed shape of spinning, self-gravitating, astronomical entities is the oblate spheroid: However, the generalized potential cannot accurately describe attraction to bodies such as gas giants and stars.
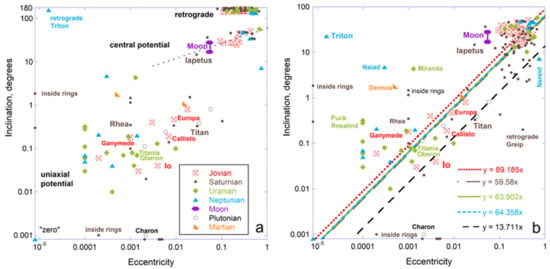
Figure 4.
Orbital properties of moons of the solar system, showing correspondence of orbital inclination with respect to the planets’ equator with orbital eccentricity. Data from NASA []. Box links symbols to planetary systems. Least-squares fits include the origin: (a) Plot differentiating retrograde moons. Large, round moons (α > 1400 km) are labelled. Only Triton is retrograde. Regarding tiny Hippocamp of Neptune, 5 moons of Saturn inside the main rings, and 3 moons inside Saturn’s ring E, zero was listed for either e or i or both. To depict these satellites on logarithmic plots, we set e = 8 × 10⁻⁶ and/or i = 0.0008°, which values are below all reports for other moons: consequently these 9 moons plot on the axes or at “zero.” The main groupings, as labeled, suggest correlations with potential of the central body; (b) Same data, except that retrograde moons are plotted with inclination reduced by 180o. Fits excluding retrograde moons are similar. Moons that deviate greatly from the depicted trends are labelled, as are all large moons.
Here, we note that the generalized potential with many terms can be used to fit orbital data for satellites proximal to Earth. As discussed by Transtrum et al. [], multiplied parameters permit fitting data with incorrect physics. The fitting approach necessitates that the empirical fits are adjusted as orbits evolve, and is useful for satellites that typically orbit at heights of only 1.02 to 1.3 Earth radii, and experience additional short-term accelerations from regional asymmetries such as continents with their massive mountain ranges. However, the physical meaning of the most important terms, J2 in particular, is lost in applying Equation (7) to the giant planets [] which are distinctly oblate, rather than approximately spherical with bumps.
3.1.2. Orbits involving A Non-Central Potential
Far from a spinning astronomical body, where the point mass approximation is valid, orbits can be inclined, eccentric, and follow Keplerian dynamics. Close in, where forces are not central, stable orbits are either equatorial and circular or polar and elliptical. Bodies close-in with inclined, but non-polar, orbits are unstable, and will be pulled toward the equatorial plane.
Orbital parameters are controlled by distance, plus central body size and ellipticity []. For bodies with close-in, low inclination orbits, equating the centripetal and gravitational forces yields:
where a is the radius and v the tangential speed of a circular orbit. Additionally, μ = 0 for a constant density body, increasing to ⅗ for the limiting case of a point or spherical mass where ε = 0 [].
For the above reasons, Section 3.2 analyzes data on natural satellites in terms of the equatorial radius (α) of the central planet, and discusses satellite systems individually, to account for ε varying among the gas giants, and to address unique Pluto’s system.
3.2. Satellite Systems Confirm That Earth Acts as A Point Mass on the Moon
3.2.1. Examples of Orbits around Uniaxial Central Mass Distributions
The giant planets are significantly flattened, with ellipticities of 0.432 for Saturn, 0.354 for Jupiter, 0.213 for Uranus, and 0.184 for Neptune []. The smallest axial ratio (for Saturn) is 0.902, which is far more spherical than the example in Figure 3. In contrast, rocky Earth and Mars have ε = 0.00335 and 0.00589, respectively, whereas tiny Pluto, which is spin-orbit coupled with nearly as large Charon, has ε = 0.0000.
Orbital characteristics of the moons of the outer planets and Pluto occupy three distinct trends with a few outliers (Figure 4a). Our Moon falls on a trend with 20 others. The self-gravitating close moons almost all have nearly circular orbits (e.g., eccentricity e < 0.018 for the 8 close Jovian moons) that lie in the equatorial planes of these planets (e.g., inclination i < 0.47° for the Jovian moons). More distant satellites have large i and e, with both covering a wide range, and include many (e.g., ~60 around Jupiter) in retrograde orbits (Figure 4a). Overall, inclination correlates with eccentricity for the moons of all planets, and those with many moons show fits with similar slopes (Figure 4b).
Figure 5 shows how e and i depend on the semi-major axis, normalized to central body radius. Orbits of distant moons have high eccentricities and widely ranging inclinations (Figure 5a). Inclinations are larger for the close moons of Saturn, reaching 1.86°, but the same bimodal pattern exists for e and i. Moons of Uranus follow similar trends to the gas giant systems, whereas the few moons of Neptune are distributed bimodally. Mars is quite round, like Earth, and its tiny moons have orbital characteristics similar to the close moons of the giants (Figure 4 and Figure 5). The Plutonian system is discussed below.
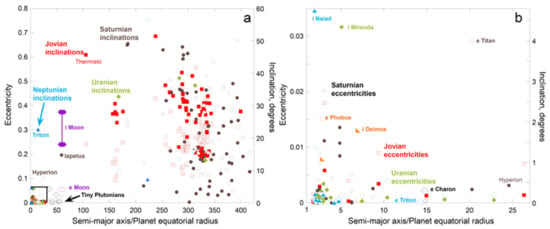
Figure 5.
Orbital eccentricity and inclination of moons as a function of their semi-major orbital axis normalized to the equatorial radius of the central planet, using scales appropriate to both distal and proximal moons. Data from NASA factsheets []. For the retrograde moons, the inclination shown = 180o minus that reported. Solid symbols = inclination (right axis) and open symbols = eccentricity (left axis), where the color scheme is the same as in Figure 4: (a) Plot of all moons with a/α < 425. This cutoff excludes one of Saturn’s 79 moons which is near 450 body radii; plus 5 of Uranus’s 24 moons and 5 of Neptune’s 14 moons, all of which are much further out, reaching a/α = 10,000. These 11 moons orbit with a wide range of i and e, like the cluster near a/α of 300. Large Triton is retrograde in a tilted, circular orbit, whereas Hyperion has a chaotic orbit, attributed to interactions with Titan; (b) Expanded view of the box near the origin in the left panel. Pluto’s tiny moons [], which actually orbit the Pluto-Charon barycenter are not shown: see text for discussion of this unique satellite system.
Iapetus of Saturn resembles our Moon in all three orbital characteristics (Figure 4 and Figure 5a). Its average radius (~1420 km) is also similar, and Iapetus is fairly round, but its composition provides a lower density, in accord with most (icy) moons in the outer solar system. The inclination of Iapetus is also variable like our Moon (not shown).
3.2.2. A Triaxially Shaped and Time-Varying Central Mass Distribution
Pluto and Charon essentially compose a binary system, where the remaining 4 tiny satellites are spin-locked, resonating, and co-planar [], even at large a/α of 60 (Figure 5a). These 4 tiny distant moons are forced into equatorial orbits because Pluto and Charon together compose the central mass: Their combined gravitational potential is highly flattened in their barycenter plane and time-dependent with a repeat near 6 days. As occurs for a single oblate body, the direction of pull is towards their barycenter only in their orbital plane and along the special, perpendicular, axis above their barycenter. Nowhere in this fascinating system is the gravitational attraction proportional to the distance to the Pluto-Charon barycenter. On average and roughly, Pluto and Charon together act as a highly flattened oblate body over their ~6-day orbital period.
Hence, the relevant parameter is not Pluto’s α, used in Figure 5, but Charon’s orbital radius. For this extreme case, the uniaxial force operates out to a factor of 3.3 × larger than the apparent limit of a/α = 27 seen for the oblate giants. This observation, in view of Earth’s low ellipticity, supports modelling the Moon-Earth binary as point mass interactions. The remainder of Section 3 concerns the slightly oblate planets.
3.3. Ellipticity and Spin Rate
Todhunter [] devised the formula for the dependence of angular velocity (ω) of a spinning, homogeneous body of homogeneous density (ρ) on ellipticity:
based on the geometrical constructions of MacLaurin. This classical result for homogeneous uniaxial bodies simplifies to a linear relationship between ω and ε for ε < 0.5:
[], which therefore holds to significantly larger ε than the planets of our solar system. The small deviation between the exact relationship and the approximation (Figure 6a) is insignificant, given that real bodies have radially varying density.
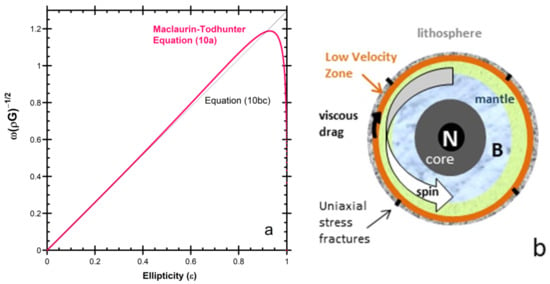
Figure 6.
Behavior of spinning self-gravitating bodyies: (a) Spin of a homogeneous density, fully solidified oblate. Modified after Criss [] (Figure 1 therein), with permissions; (b) Primary mechanism of differential rotation for the Earth. Equatorial slice, showing internal structure, down the North pole (N), showing uniaxial stress cracks (black bars), layers (various patterns), and drag (black arrow). The Earth’s lower mantle (blue marble) spins through the barycenter (B) on a daily basis. This variation is not entirely longitudinal because the spin axis is inclined to the lunar orbit and to the barycenter orbit. Dark grey = liquid outer core. Samples are limited to origins in the upper mantle (light blue stipple). Modified after Hofmeister et al. [] (Figure 2e therein), with permissions.
As body spin declines, the object rounds up (Figure 6a). Distant and close in orbits are affected differently from theoretical considerations, which are consistent with the observations of moons in the solar system, as follows:
3.3.1. Effect of Slowing Planet Spin on nearby Satellites
For moons with close-in orbits, which occur near a planet’s equatorial plane (Figure 4 and Figure 5), spin down of the planet will effectively weaken the exterior attractive force per Equations (2), (4), and (9). As the attractive force changes not only in magnitude, but also in direction, in response to spin down, orbital evolution is complicated and should depends both on parameters of the planet and the satellite’s initial orbital parameters.
3.3.2. Effect of Slowing Planet Spin on Distant Satellites
Moons in distant orbits (a > 27α) about individual planets will not be affected by spin decline because the central potential acts as that of a point mass at such distances (Figure 4 and Figure 5). Considering Figure 3a and results for round oblates [], convergence occurs at a small, roughly ~0.05%, difference in the actual potential from that of a sphere. Our Moon is described by this situation because its orbital radius is ~60 Earth radii. As Earth’s tidal bulge is miniscule compared to the difference between its polar and equatorial radii, this bulge negligibly affects the Moon’s motions. Thus, the lunar orbit is a point mass problem.
4. Internal Dissipation of Body Spin and Implications for Conservation Laws
Loss of spin makes planetary bodies less oblate, per Equation (10ab). The rocky Earth is a differentially spinning, mostly solid, layered body [,]. Implications of friction existing between the layers are as follows:
4.1. Oversimplified Case: Conservation of Spin Angular Momentum Holds
Earth’s ~60 km thick outermost layer (the solid lithosphere), moves westward at about 60 mm y−1 relative to the mantle and below (~6300 km radius, sketched in Figure 6b). From a classical physics standpoint, friction exists between these layers and degrades the spin while heating their interface, but (angular) momentum is alleged to be conserved nevertheless. Given that the lithosphere is only 0.6 wt% of the Earth [], recent slowdown of the surface at 2 × 10⁻⁶ s y−1 [,] means that if spin angular momentum were indeed conserved, then the interior would accelerate by a mere ~10−9 s y−1.
The lithosphere lies on a low velocity zone, detected in seismology, and inferred to be weak (e.g., []). The base of the lithosphere is partially melted, which reduces resistance to the shearing motion of differential rotation. However, Earth’s subducting tectonic plates extend to depths of 300 to 660 km [,] and thereby provide resistance: Some plates break while others bend, depending on whether the subduction direction shares the same sense as spin. This geometry shows that differential rotation exists between the outermost layer and the interior [,].
Another prominent weak zone exists: Earth’s outer core does not propagate shear waves and is therefore at least partially liquid, whereas the inner core is solid due to compression []. Therefore, differential rotation could exist between the strong mantle and the inner core. Super-rotation of the core has been considered, but its small size (<1 °y−1) makes quantification difficult (see [] and the review of []). A tangential velocity similar to continental drift is well below the limit of detection. Notably, super-rotation of the whole core differs from super-rotation of the inner core. In particular, the molten outer core flows (shears) without resistance, so a faster rotating, more oblate solid inner core could be accommodated while the mantle rotates more slowly and is rounder. Criss [] provides analytical formulae for spinning stratified bodies along with calculations for several endmember cases.
The roughly horizontal frictional force of viscous drag provides the torque needed to change relative angular momentum of the layers (Figure 6). Conservation of momentum would cause spin to decrease towards the surface, while increasing towards the interior, thereby preserving the original angular momentum of the whole Earth.
Thus, transfer of spin angular momentum to the Moon is unnecessary because internal processes redistribute spin during conservative behavior.
4.2. Frictional Forces Decrease Spin
Previous discussions of friction and momentum conservation implicitly assume that the force applied is external. Regarding the textbook example of a block sliding down a hill, the two objects are considered to be distinct and the force is a constant, because it is visualized as stemming from the nearly constant gravitational acceleration on Earth’s surface. Earth acts as the external object (surroundings) in the sliding block problem. In contrast, the internal layers of a spinning planet compose the object itself.
Spin energy declines due to friction between internal planetary layers, which produces heat. Loss of energy depends on material properties such as the coefficient of friction and thermal conductivity. The amount may be large, as the model of Na and Lee [] suggests that 97% of energy loss during spin down becomes heat. Thus, Earth’s average spin rate is declining.
Earth’s spin angular momentum decreases during heat production because friction provides torque (Figure 6). This decline is at a slower rate than spin energy decreases (Iω vs. ½ Iω2, where I is the moment of inertia). For additional discussion of large-scale processes occur inside the Earth, see []. Microscopic processes that dissipate momentum must be intimately tied with those converting mechanical energy to heat, but a detailed discussion is beyond the scope of this report.
Thus, dissipation of spin is also an internal process, and does not affect the Moon.
5. Permissible Changes in Orbits around a Central Point Mass
The above discussion of Earth’s declining spin shows that changes in the interior rotational motions depend on whether or not heat is produced, i.e., whether mechanical energy is identical to the total energy, which is the quantity actually conserved. Similarities and differences of spin with orbital changes are covered here. This analysis extends our earlier analysis of the weak perturbations of planetary orbits by other planets [].
5.1. Conservation Laws for Orbits Are Stringent
The Virial theorem of Clausius, predicated on conservative forces, results from linear momentum cancelling in all directions over the restricted space that defines some bound state []. This balance is readily demonstrated for elliptical orbits. Balance involves the canonical conjugate pairs of position and linear momentum, and is independent of conservation of energy and angular momentum. The extra stipulation is attributable to energy being consumed to form the bound state, which by definition is restricted in space. Orbits are cyclical bound states. The Virial theorem involving Newtonian gravitational potential energy (P.E.) tightly restricts kinetic energy (K.E.) of the orbit:
where the angle brackets indicate averaging over the orbit. Conservation of energy provides an additional constraint:
which holds at any given time. Multiple constraints make bound states resistant to change.
Equations (11) and (12) hold for repeating paths, such as aperiodic orbits []. Thus, the Virial constrains hold for the Moon’s path which is elliptical over a long term average.
5.1.1. Energy Conservation Is Key
Constant total energy provides a stringent restriction. Regarding orbits, friction does not exist for an object moving in the rarefied medium of space. Although collisions could alter the energy of an orbiting object, these have been few and small in the solar system over the past several billion years [], so are not considered here.
5.1.2. Changes in the Lunar Orbit Permitted under Energy Conservation
Constant Etot of an orbiting object does not permit changes in its semi-major axis, but allows eccentricity to vary []. Importantly, for a 2-body system, any inclination is permissible, as this factor does not enter into the description of the orbit around a point mass or sphere. Thus, orbital inclination may also change.
Figure 7a compares the current, quite circular, average lunar orbit to hypothetical orbits in the same plane that have the same energy, with the Earth at one focus. The radial distance as a function of orbital position is [] (p. 131):
where the angle θ is defined by a point on the orbit and the focus, with respect to a the line connecting the perigee and apogee.
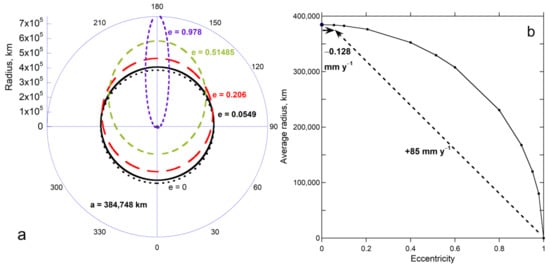
Figure 7.
Geometry of the lunar orbit: (a) Polar plot. Heavy black shows the current semi-major axis and eccentricity. The central dot shows the actual size of Earth. Black dotted curve is a circular orbit with the same energy. Additional permissible orbits obtained using Equation (13) are shown. Red long dashes show e = 0.206 which also describes Mercury’s orbit, the most eccentric among the planets. Green medium dashes = high e seen in orbits of some distant prograde moons (Figure 5). Purple short dashes = very high e, above which collision with Earth could occur; (b) Calculation of the average lunar radius from its current semi-major axis and different values of e. Arrows show the changes associated with the limiting geometries of a circular orbit compared to a nearly linear orbit at 4.52 by ago.
Equation (14) provides the geometrical average of an ellipse, and rests on infinitesimally small angles. An angular average is appropriate because a is constant under energy conservation and so evolution involves changes in shape (i.e., in e or b) over long periods of time.
Elongation drives the Moon towards Earth at perigee, but away at apogee, while shrinking the semi-minor axis (b). Consequently, the average radius decreases during elongation. If the endmember condition of a perfectly circular orbit describes formation 4.52 billion years ago, then the rate of lunar drift is −0.13 mm y−1. A circular orbit must describe the starting point because torque is elongating the orbit, as follows:
5.2. Solar Torques Change Eccentriciy and Inclination of the Lunar Orbit
If the Earth and Moon were truly an isolated 2-body system, the lunar orbit could not change. Changes result from interactions with the Sun (the actual 3-body system), which provides a force on the Moon that is 2.2× greater than does Earth:
Table 1 defines the physical parameters in Equation (15), lists their numerical values, and describes our notation for subscripts.
The Sun holds the Earth–Moon pair in a heliocentric orbit. The barycenter orbit is nearly circular, indicating long-term stability (e.g., []). With postulated lunar drift being ~12 orders-of-magnitude smaller than barycenter or lunar orbital velocities, force imbalances must also be small relative to those largely controlling the orbit, i.e., those in Equation (15). Thus, the Sun’s influence on the Moon is deduced by considering solar forces as perturbing the lunar orbit around the Earth. The planets slightly perturb the lunar orbit, but since the same conservation principles hold and the largest force on the Moon (from Jupiter at its closest pass) is only 0.00017 times solar [], this minor effect can be neglected.
Essential behaviors, such as the shape of spinning planets and orbital characteristics, have been inferred by comparing an attractive gravitational pull to opposing centrifugal forces []. Following this approach does not idealize the orbits of these 3-bodies as coplanar, but for simplicity we consider both the barycenter and lunar orbits to be circular. Hence, gravitational pull (Equation (15)) and radial centripetal acceleration of the barycenter are balanced: FG,SB = FR,SB, and similarly for a nearly stable lunar orbit: FG,Em ≅ FR,Em (Figure 8). In contrast, FG,Sm and FR,Sm are imbalanced even in this idealization.
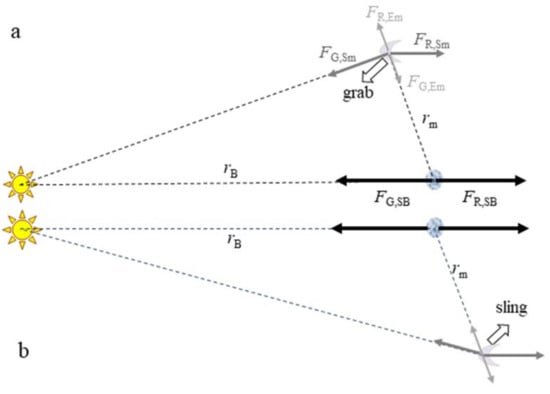
Figure 8.
Schematics of forces perpendicular to the barycenter plane associated with the reduced 2-body orbits in the Earth-Moon-Sun system. Object size and angles are exaggerated to reveal the perturbing forces and imbalances. Distances are not to scale. Forces are as labeled, with shade and length of filled-tip arrows suggesting relative magnitude. The imbalances, denoted Solar grab and sling, are shown as white open arrows. Sling involves the orbiting object not falling towards the center sufficiently fast for a stable orbit. Distances and/or orbits are indicated with various patterned lines: (a) Cross section when the Moon is inside the barycenter orbit; (b) Cross section when the Moon is outside the barycenter orbit.
Torque () exists because the Earth, Moon, and Sun define a triangle (Figure 2 and Figure 9). Rarely is the force applied by the Sun to the Moon collinear with the Sun-Moon direction. The geometry of the 3-body system thus provides torque which necessarily changes angular momentum, yet lunar orbital energy must remain constant. Thus, the imbalanced solar force and consequent torque can affect only e and i of the lunar orbit.
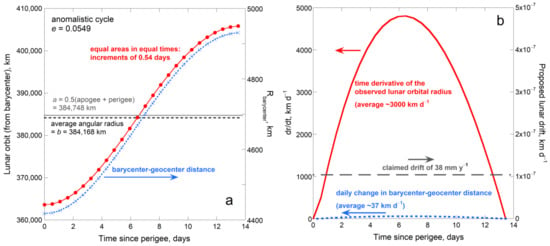
Figure 9.
Characteristics of the lunar orbit over the perigee-to-apogee half-cycle: (a) Distances associated with the lunar and terrestrial Keplerian orbits around the barycenter. Red dots = lunar radii spaced at equal times of 0.54 days, which were calculated from Equation (13) using 0.2° increments, and a and e in Table 1. These points are reproduced by a 4th order polynomial fit (not shown). The average radius (black dashes) is slightly lower than the semi-major axis (grey heavy line). Blue X and right axis = distance to the geocenter, calculated from the fit; (b) Time derivatives of the calculated distances. Red solid curve = lunar variations over the half-cycle. Blue dots near x axis = the barycenter variation on the same scale. Long dashes and right axis = lunar drift, as modelled from LLR delay times [], scaled to a daily basis.
5.2.1. Permissible Changes in Eccentricity
In the plane of the lunar orbit, the Sun can accelerate the Moon both radially (perpendicular) and along (parallel) to the orbit (Figure 2b). Centripetal acceleration of the Moon by the Sun is evident in the variation in velocity along the month. From the NASA factsheets [], the maximum orbital velocity of the moon around the Earth is 1.082 km s−1 while the minimum is 0.970 km s−1. Parallel acceleration should not change eccentricity. Orbital precession, i.e., rotation of the orbital ellipse as the barycenter moves around the Sun (Figure 2d), probably links to parallel acceleration.
As the Sun pulls the Moon towards the Sun in an inboard position (Figure 2ab), this elongates the orbit, and is denoted as grab. In an outboard position, the Sun pulls the Moon towards the Earth (and Sun) which brings the Moon closer to the lunar orbit foci, which also elongates the orbit (Figure 2). Thus, perpendicular acceleration associated with the Sun increases e of the lunar orbit, while decreasing the average radius (−0.13 mm y−1 from Equation (14) and Figure 7b).
5.2.2. Permissible Changes in Inclination
The Moon lies ~5° out of the barycenter orbital plane. Hence, the direction of pull on the Moon towards the Sun is infrequently co-linear with the centrifugal force associated with the Moon’s path around the Sun (Figure 8a,b). Stability of the lunar orbital plane is impossible because pull towards the barycenter plane provides torque at all times except during the instant of the ~bimonthly crossings (Figure 2b). Hence, inclination of the Moon’s orbital plane changes unilaterally, because it is slowly but continuously pulled into the barycenter plane.
Inclination of the lunar plane to the ecliptic is currently 5.14°, while varying from 18 to 28o with respect of Earth’s equatorial plane (Figure 1c). The latter is relevant (Section 3.2). Assuming that an equatorial configuration existed at formation suggests a progression of ~5 × 10⁻⁹ °y−1. Jupiter also applies torque, but to both Earth and its Moon, thereby moving the barycenter orbital plane (Section 7).
6. Uncertainties in Modelling Lunar Drift from LLR
Difficulties in establishing slow evolutionary changes in the lunar orbit are linked to large and rapid variations in the orbit of the Moon around the barycenter, and the many correction terms needed to convert surface-to-surface measurements to orbital parameters. This section begins by describing known lunar motions, then discusses the database [] provided by laser lunar ranging (LLR), and how drift is ascertained by combining several independent models.
6.1. Characteristics of the Moving Lunar Target
6.1.1. Daily Variations
In a perfect elliptical orbit, the orbital radius changes throughout each cycle. Given the average values in Table 1, the idealized lunar orbital radius around the barycenter increases on average by ~3000 km d−1 from perigee to apogee, and then shrinks in the second half of the month. Simultaneously, the distance from the barycenter to the geocenter changes proportionately:
From Table 1, the associated change of ±500 km inside the Earth is a factor of ~83 smaller than the lunar variation over a month (Figure 9).
Lunar drift modelled from LLR [,,,,] as 38 mm y−1 is nearly 10-orders of magnitude smaller than the average daily change in the lunar radius over a half-month (Figure 9). Accuracy in radius better than a parts-per-billion level is required to established drift. This level of precision is not achievable, as follows:
6.1.2. Variations in Tangential Velocity during the Lunar Orbit
Because tangential velocity varies continuously with position, intermittent measurements of the orbital radius are insufficient to establish lunar drift. Evenly spaced time intervals of 0.54 days were used to construct Figure 9 mainly because LLR measurements can, at best, be made over the ½ day period when a given LLR station spins across the side of Earth facing the Moon. Additionally, most years in the LLR data base have ~730 data points or fewer, so intervals between measurements are, on average, ~ ½ day or longer.
Fixed angular intervals provide additional information. Histograms of radius for the average lunar ellipse constructed over an anomalous month at narrow (0.5°) intervals provide a smooth distribution (Figure 10a). A wider increment of 5° returns the expected mean radius, but the distribution has some irregularities. With a 13° increment, which is similar to ~1 day intervals common in the LLR database, the mean is not reproduced, which shows that large increments are insufficient to provide the mean radial distance.
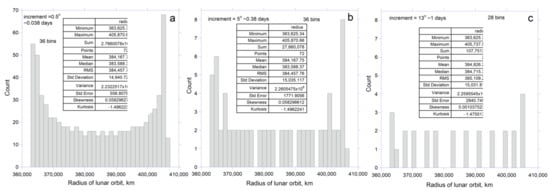
Figure 10.
Histograms of the lunar Keplerian orbit over an anomalistic cycle, constructed for distances calculated for three uniform angular (~time) intervals. Panels have the same numbers of bins for direct comparison. Except for apogee and perigee, each degree increment provides 2 counts: (a) Radius calculated at increments of 0.5°, which roughly corresponds with 0.038 day sampling intervals; (b) Radius calculated at increments of 5°, which roughly corresponds with 0.38 day sampling intervals; (c) Radius calculated at increments of 13°, which roughly corresponds with 1 day sampling intervals.
Laser ranging measurements are made at irregular intervals. Our results for wide intervals show that this approach is unlikely to constrain the average radius of an elliptical lunar orbit.
6.2. Lunar Laser Ranging Data and How Drift Is Ascertained
Muller et al. [] review Earth-based LLR measurements, upon which the 38 mm y−1 recession value is based. Satellite experiments began afterwards and so are not covered here. Models used to extract drift are discussed after we describe LLR raw data and compare these to distances ascertained from ephemeris tables [,,].
6.2.1. Available Station-to-Mirror Travel Times
For details on LLR measurements, see Samain et al. []. Battat et al. [] discuss the Apache point station in particular. Murphy [] provide additional discussion and include a map of retroreflector sites on the moon, established by astronauts. For brevity, “mirror” is used here.
Data collected from various terrestrial stations from late 1969 to early 2019 are compiled on the LLR website []. Data from the two longest running stations resemble the aggregate data, which is presented below. The Apollo 15 site was used in 70% of the measurements []. About 40% of the data were collected near quarter moons []. Since 1984, 58% of data since 1984 are from Grasse station [], which contributes to ~½ day gaps frequently existing in the database.
Round-trip travel times were converted to distances by dividing by 2 and multiplying by lightspeed. The figures below show these raw data. Travel times are reported at the level of 10−13 s, which corresponds to an uncertainty of ±0.03 mm for each uncorrected station-to-mirror distance.
6.2.2. LLR Data Collection Is Too Infrequent to Describe Monthly and Longer Lunar Cycles
Most years are under-sampled: Fewer than 2 measurements per day, on average, have been made over the program lifetime (Figure 11). Sampling may be sufficient to provide reasonable data for 1985, 1995 through 2001, and 2015 through 2018. However, this presumes reasonable coverage of the monthly cycles throughout any given year, which is not the case (Figure 12).
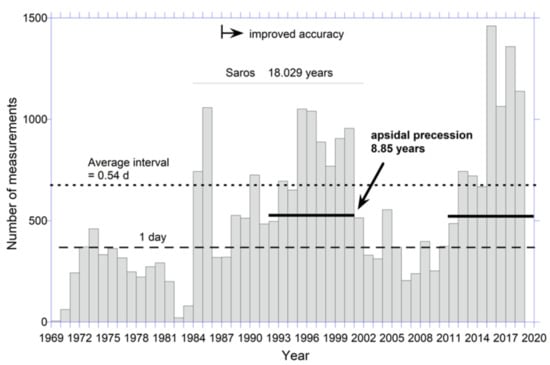
Figure 11.
Histogram of the number of LLR measurements each year. Each bin is one year wide [ref for improved accuracy] Data from []. The last 2 years data were not reported, apparently due to the changeover to satellite stations. Horizontal lines show important cycles.
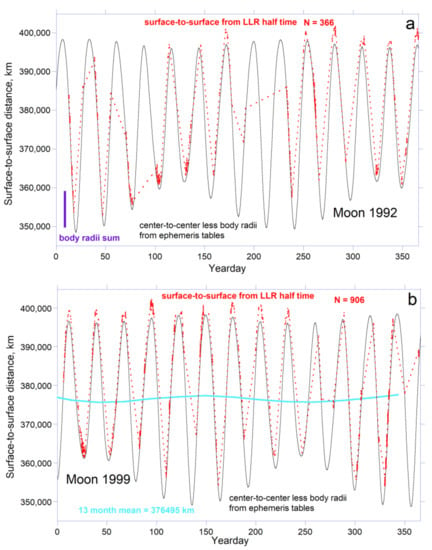
Figure 12.
LLR (red dots) data [] compared to the orbital radius from the ephemeris tables [,] less the combined body radii of the Moon and Earth (fine black line): (a) Example of data collection at an average interval of ~1 day. Purple vertical bar shows the 8109 km body radii contribution, which is substantial; (b) Example of data collected at an average interval near ½ day. Blue curve shows the monthly average distance. For both panels, ~90% of the data were collected at Grasse [,]. Note that distances longer than expected occur when the station is not collinear with the line containing the geocenter, barycenter, and Moon’s center.
An additional problem exists because the anomalous monthly cycle is not related to the Julian year by an integer, see Figure 12. Considering an apsidal precession cycle (8.85 years) might improve statistics. However, dense sampling only occurred from ~1990 to 2001 and again after 2011, but the post 2011 interval is less than 8.85 years (Figure 11). Additionally, the complete apsidal cycle under-samples the closer distances (cf. average in Figure 12b and Figure 13). This option for ascertaining changes in radius with time is not viable. This problem is compounded by the anomalous monthly cycle not being related to the Julian year by an integer, see Figure 12.
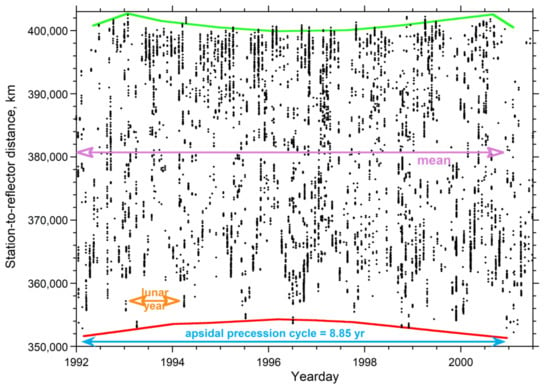
Figure 13.
Distances from travel times obtained from 1992 to 2001.5 reveal a “bowtie” pattern over the apsidal precession cycle (blue arrow). Black dots = individual measurements. Orange arrow shows evidence of yearly cycling. Red curve emphasizes the 8.85 year precession cycle connected with the minima. Green curve shows 8.85 year cycle as evident in the maxima. Pink shows the mean station-to-mirror distance (380,432 km) over a precession cycle.
Distance varying greatly over any given anomalous cycle (Section 6.1) exacerbates the sampling problem. As shown in Figure 11, the monthly average distance also cycles over circa one year. Capturing this interesting variation, which may be connected with 3-body dynamics, requires adequate sampling of both the perigee and apogee, which is not available (Figure 13), perhaps due to preferential data collection at the quarter moons. Distances are neither constrained over the anomalistic month, nor over the anomalistic year, nor over the apsidal cycle, even in the most densely sampled years of LLR data acquisition.
6.2.3. Lunar Drift Is a Model Value
Lunar drift ascertained from LLR involves combining several different models and applying many correction terms, each of which dwarfs the magnitude of the quantity being sought (Table 2). The models compute the barycenter orbit about the Sun, the lunar orbit around the geocenter, lunar orientation (mirror position), station positioning, and atmospheric refraction. The ~1 cm weighted residual for 1987 to the present, mentioned in several papers (e.g., [,]), refers to differences between the combined multi-parameter models and LLR measurements. Given the findings of Transtrum et al. [], who showed that multiplied parameters can reproduce data with incorrect physics, the small residual demonstrates neither accuracy, nor precision, nor reliability.

Table 2.
Estimated magnitudes of corrections used to model lunar drift from LLR measurements.
Impediments to converting LLR measurements to orbital parameters are as follows:
- The models focus on the lunar orbit around the geocenter, which requires utilizing parameterizations based on the lunar ephemerides [,]. Heliocentric orbital parameters of the Earth–Moon barycenter are also used []. Hence, due to under-sampling of the cycles, the radius determinations largely rest on astronomical observations, not on LLR acquisitions.
- An average value for the barycenter position is used [], which is invalid when the station lies off of the line defined by the geocenter-barycenter-moon center. This station orientation commonly occurs as evidenced by LLR data overshooting near the apogee (Figure 12). These correction terms are hundreds of kilometers. In detail, the barycenter is not located at a fixed position inside the Earth, but varies longitudinally over the day, and radially over the anomalistic month (Figure 9), where the inclination of Earth’s spin axis to the lunar orbital plane (Figure 1), provides latitudinal variations.
- The generalized potential is used [,]: yet even with 6 terms, this formula does not correctly describe Earth’s axisymmetric field [].
- Muller et al. [] mentions a global parameter adjustment where improved values of the unknowns and the corresponding formal standard errors are obtained. Adjusting the unknowns provides a false precision.
- Non-uniform distributions in the data set are one contributor to correlations between solution parameters, as stated by [] in summarizing William et al. []. Basically, LLR data are insufficient to constrain the models.
- Importantly, apparent agreement exists between LLR raw data and ephemeris tables roughly midway between perigee and apogee (Figure 12). This section of the orbit is unimportant because an elliptical orbit is defined by its apogee and perigee. The apsides are under-sampled by LLR, and are most sensitive to corrections. This serious problem is not discussed in available reports.
- Atmospheric effects, producing refraction, are highly variable. This poorly constrained correction term is circa 2 m, independent of all other modelling efforts.
- Last, but not least, elliptical orbits are described by two parameters: the semi-major axis and the eccentricity. Measurements of radius alone are insufficient, as two measurements are needed to solve for two unknowns. This serious problem has been overlooked.
7. Discussion
Motions in the Earth-Moon-Sun system are complex. Short-term behavior is not captured by modeling LLR measurements (Section 6), so long-term evolutionary behavior is unconstrained. Lunar orbital evolution was evaluated theoretically in Section 4 and Section 5. Implications of these findings are covered next.
7.1. The Lunar Orbital Radius Is Decreasing, Not Increasing
Changes in Earth’s spin with time are dissipative, arising during differential rotation of its layers which has been detected in seismologic studies [,]. There is no need to invoke transfer of angular momentum to the Moon, because all the interesting action involving spin occurs inside Earth [].
The difference between Earth’s polar and equatorial radii is too small for this body to exert non-central forces on the distant Moon, based on analytical results for attraction to the oblate. It is far less possible for the significantly smaller tidal bulges to affect the lunar orbit. That the Moon’s orbit is a point-mass problem is supported by the lunar orbital plane being substantially inclined to Earth’s equatorial plane, and by trends displayed by the moons of the giant planets (Section 3). It follows that the lunar orbit is governed by point mass interactions.
Astronomical observations [,,] show that the current, average lunar orbit, even 4.5 × 10⁹ y after formation, remains nearly circular (Figure 7a), despite Solar forces acting on the Moon being double Earth’s. This observation testifies to stability of the lunar orbit. Conservation of energy, and Solar forces providing torque in the 3-body geometry cause eccentricity to increase, which contracts the semi-minor axis while maintaining the semi-major axis (Figure 7a). Consequently, the average lunar radius has decreased over geologic time (−0.13 mm y−1; Figure 7b). Inclination of the lunar orbit from Earth’s equatorial plane is consistent with Solar torque existing, unopposed, but the inclination is not part of the orbital energetics. The change in i is rather small and is consistent with stability and tiny changes in eccentricity.
7.2. Comparative Planetology and Evolutionary Behavior throughout Our Solar System
Orbits around a single central body are controlled by its mass, size, and ellipticity, plus the distance to the small mass. For separation distances exceeding ~27 planetary body radii, forces are effectively central and orbits are governed by point mass interactions (Figure 3, Figure 4 and Figure 5). Inward densification of planetary mass makes these objects more similar to point masses than the constant density oblate bodies considered in Section 3, and therefore promotes Keplerian behavior over much of the solar system.
Our recent study of interplanetary interactions [] shows that planets act as point masses on each other in pairs, resulting in multiple periodic surges in forces and also torques. Previous models [] treated the perturbing planet as a ring that exerts a central force, which does not occur.
The variable influences on any given planet of the 7 other planets produce many cycles for each of the 8 planets: these effects sum, yielding patterns more complex than perturbations of the Moon. Yet, from energy conservation and symmetry arguments, eccentricities are increasing whereas inclinations decrease as the planets are drawn to Jupiter’s orbital plane. Solar system data provide confirmation []. Jupiter is highly influential because it is most massive and is near the rocky planets. In the outer solar system, the more distant and second most massive planet (Saturn) is also influential, as evidenced by the inclinations of Neptune and Uranus. Mercury’s orbit is the most elongated and is changing the fastest, because it is the smallest and innermost planet. Rates of all planets (de/dt) vary from 1.5 × 10⁻¹² per year to 4.5 × 10⁻¹¹ which are similar to and bracket the Moon’s rate, established here as 1.2 × 10⁻¹¹.
Elongation appears to set the Moon on a collision course with the Earth (Figure 7a). Before this occurs, elongation of the lunar orbit may be sufficient that the reduced 2-body approximation no longer reasonably approximates the dynamics. For example, at apogee for e ~ 0.98 (Figure 7a), the Solar force would be ~10 times Earth’s per Equation (14). This configuration seems unlikely to persist. Essentially, the Sun is capturing the Moon. The absence of moons for Venus and Mercury suggests that the Sun captured their moons long ago []. In contrast, planets in the distant outer solar system have retained their moons, as suggested by their large numbers.
For Uranus, di/dt is negative with a magnitude below 2 × 10⁻⁸ °y−1, assuming an initially polar orbit, which is consistent with orientation of its current spin axis and with its equatorial satellite orbits. Assuming that the Moon’s orbit was in Earth’s equatorial plane at formation suggests a similar progression of ~0.5 × 10⁻⁸ °y−1. Both Earth and its Moon are being pulled to the orbital plane of Jupiter around the Sun, as are Mercury, Venus, and Mars. However, much stronger forces from the Sun has caused wobbling of the lunar plane about the barycenter plane (Figure 1) which is still not parallel to Jupiter’s orbital plane.
After 4.5 billion years, eccentricities and inclinations actually have changed very little, based on the rates deduced from spherical orbits. Observations today testify to the stability of the Solar System, which includes our Moon.
7.3. Implications for Formation in General and the Moon in Particular
Gravitational forces are the key driver of planetary formation, as discussed by many authors. Gravitational forces also govern their subsequent evolution, via perturbations, as discussed here and earlier []. Governing physical principles are summarized as follows:
- Large perturbing forces limit the applicability of the reduced 2-body approximation.
- Due to geometry, the fixed-plane three-body approximation is likewise insufficient to describe the Earth-Moon-Sun system.
- The highly variable 3-dimensional geometry of the lunar orbit permits the Sun to apply torque, which changes angular momentum.
- Forces on the Moon imperfectly balance, mainly due to the time-varying distance of the Moon from the Sun.
- However, without dissipation of orbital energy, which requires a non-conservative force such as friction, orbital evolution is limited to changes in eccentricity and inclination, as long as the 2-body approximation is reasonably accurate.
The unique dynamics of the Earth-Moon-Sun system reveals information regarding its origin and evolution. The initial orbit was more circular, because the Sun elongates the lunar orbit in most positions (Figure 2). The Moon’s orbit was probably initially in Earth’s equatorial plane, but has been modified by the Sun consistently pulling the Moon toward the orbital plane of the barycenter while Jupiter simultaneously has pulled bodies in the inner solar system towards is orbital plane []. Jupiter’s action on the Moon is very small compared to that of the Sun, but because this torque is unopposed, Jupiter has some influence.
Circular orbits describing formation is consistent with contraction of a spinning cloud of dust and gas, see, e.g., []. Notably, conservation of angular momentum causes the radius of the outer shell of a cloud to grow as the interior shrinks: see discussion of galaxies by Criss and Hofmeister []. For this reason, the Earth has a distant moon. The many distant moons in the outer solar system satisfy conservation of angular momentum during formation of the large planets. Moreover, division of the outer and inner solar systems is a consequence of contraction of the solar nebula to the center being balanced by expulsion of the outer shell of gas and dust. Conservation of angular momentum is not part of currently popular fractal accretion models (e.g., []).
Importantly, circular orbits are the only solution for a truly isolated 2-body point mass system. Close to an oblate central body, polar elliptical orbits are stable, but none are observed in the solar system. Tilted orbits close to an oblate could also be elliptical but these are not stable, and are very rare (Figure 5). Multi-body interactions are largely, if not entirely, the cause of the currently elliptical orbits in our Solar system.
The above findings support, if not require, co-accretion of the Earth and the Moon. Formation takes finite time and so larger bodies necessarily form more slowly. Existence of miniature solar systems indicates that the nuclei of the planets were present during contraction of the overall nebula to the center, forming the Sun. Planets survive today due to the stability of their orbits, whereas the unconsolidated matter and objects in unstable orbits were sucked to the center. As the small dust-gas clouds of the planets contracted, their outer parts expanded, yielding satellite systems. Earth may have had more distant moons, which were robbed by the Sun long ago. Like the Earth, Saturn and Neptune likewise each have one moon that is much larger than the others. Unlike Earth, the outer planets are mostly composed of volatiles, and very light H and He gas, so these seem much larger than their moons, which are quite rocky. Thus, the size of the Moon compared to the Earth is not unusual, as the rock and metal cores of the giants are considerably smaller than their enshrouding atmospheres (see, e.g., []). Our Moon is simply not as unusual as currently perceived.
7.4. Relationship of Our Work to Previous Studies
Prior to LLR measurements which began in late 1969, lunar drift was unknown since radial motions from astronomical observations were insufficiently accurate to constrain small changes (Section 2). Hence, earlier estimates of lunar recession were maxima inferred from assumed formation conditions. Subsequently, the small positive drift suggested by LLR models were well received because they supported popular models for the Moon’s origin.
Inconsistencies and assumptions in models (Section 1 and Section 6) motivated us to closely examine the physical principles underlying evolution of the lunar orbit. Our theoretical approach contrasts with the LLR modeling, which stems from Newcomb’s mathematical approach to deciphering orbital parameters, to which several additional correction terms are added.
8. Conclusions
Conservative conditions govern temporal changes in orbits because friction between distal bodies is null. In contrast, axial spin of bodies is dissipated non-conservatively and internally due to friction, torque, and heat production accompanying differential rotation of the internal layers (Section 4) and has no impact on orbital evolution. Thus, orbital evolution consists of increases in eccentricity and variations in inclination as a result of three-body interactions: These tiny perturbing forces and torques arise from distant objects. Even for the Moon, where the perturbing object, the Sun, exerts twice the force of the Earth, the changes are slow (Section 5) and similar to rates at which e and i of planets have changed since formation [].
We have shown that long-term (~109 year) changes in orbits are not constrained by lunar laser ranging measurements (Section 6). Instead, we use conservation laws to deduce the following:
- The lunar orbital radius is shrinking, so drift is about −0.13 mm y−1.
- The lunar orbit was originally circular and probably about Earth’s equator.
- Co-accretion is favored, if not proven, since these findings rule out all other contenders for the lunar beginnings (a giant impact, fission, or capture).
Regarding broader implications of this study, the nearly circular paths remaining after 4.5 billion years on diverse scales in the solar system demonstrate the radial nature of gravitational pull. Large distances between small bodies make the two-body approximation valid over much of the solar system, which allowed Kepler to analyze the motions and to set the stage for development of the theory of gravity []. Our results point to a need for further exploration of Newtonian forces and torques that arise in three-body, pair-wise point-mass interactions.
Author Contributions
A.M.H., R.E.C. and E.M.C. participated in conceptualization, visualization, review and editing of the manuscript. A.M.H. prepared the original draft and provided validation. All authors have read and agreed to the published version of the manuscript.
Funding
This research received no external funding.
Institutional Review Board Statement
Not applicable.
Informed Consent Statement
Not applicable.
Data Availability Statement
Not applicable.
Acknowledgments
We thank the reviewers for constructive criticism.
Conflicts of Interest
The authors declare no conflict of interest.
References
- Gutzwiller, M.C. Moon-Earth-Sun: The oldest three-body problem. Rev. Mod. Phys. 1998, 70, 589–639. [Google Scholar] [CrossRef] [Green Version]
- Abouelmagd, E.I. Existence and stability of triangular points in the restricted three-body problem with numerical applications. Astrophys. Space Sci. 2012, 342, 45–53. [Google Scholar] [CrossRef]
- International Laser Ranging Service. Available online: https://ilrs.gsfc.nasa.gov/ (accessed on 27 February 2022).
- Chapront, M.; Chapront-Touzé, M.; Francou, G. A new determination of lunar orbital parameters, precession constant and tidal acceleration from LLR measurements. Astron. Astrophys. 2002, 387, 700–709. [Google Scholar] [CrossRef] [Green Version]
- Pavlov, D.A.; Williams, J.G.; Suvorkin, V.V. Determining parameters of Moon’s orbital and rotational motion from LLR observations using GRAIL and IERS-recommended models. Celest. Mech. Dyn. Astr. 2016, 126, 61–88. [Google Scholar] [CrossRef]
- Müller, J.; Murphy, T.W., Jr.; Schreiber, U.; Shelus, P.J.; Torre, J.M.; Williams, J.G.; Boggs, D.H.; Bouquillon, S.; Bourgoin, A.; Hofmann, F. Lunar laser ranging: A tool for general relativity, lunar geophysics and Earth science. J. Geod. 2019, 93, 2195–2210. [Google Scholar] [CrossRef]
- Williams, G.E. Geological constraints on the Precambrian history of Earth’s rotation and the moon’s orbit. Rev. Geophys. 2000, 38, 37–59. [Google Scholar] [CrossRef] [Green Version]
- Stephenson, F.R. Harold Jeffreys lecture 2002: Historical eclipses and Earth’s rotation. Astron. Geophys. 2013, 44, 222–227. [Google Scholar]
- Halliday, D.; Resnick, R. Physics; John Wiley and Sons, Inc.: New York, NY, USA, 1966. [Google Scholar]
- Orbit of the Moon. Available online: https://en.wikipedia.org/wiki/Orbit_of_the_Moon (accessed on 1 March 2022).
- Sobchak, P. Lunar Orbit and Orientation. 2014. Available online: https://commons.wikimedia.org/wiki/File:Lunar_Orbit_and_Orientation_with_respect_to_the_Ecliptic.tif (accessed on 1 February 2022).
- Hofmeister, A.M.; Criss, E.M. Constraints on Newtonian interplanetary point-mass interactions in multicomponent systems from the symmetry of their cycles. Symmetry 2021, 13, 846. [Google Scholar] [CrossRef]
- Newcomb, S. Secular variations of the orbits of the four inner planets. Astron. Pap. Am. Ephemer. 1895, 5, 98–297. [Google Scholar]
- Simon, J.L.; Bretagnon, P.; Chapront, J.; Chapront-Touze, M.; Francou, G.; Laskar, J. Numerical expressions for precession formulae and mean elements for the Moon and the planets. Astron. Astrophys. 1994, 282, 663–683. [Google Scholar]
- Park, R.S.; Folkner, W.M.; Williams, J.G.; Boggs, D.H. The JPL planetary and lunar ephemerides DE440 and DE441. Astron. J. 2021, 161, 105. [Google Scholar] [CrossRef]
- Planetary Factsheets. Available online: https://nssdc.gsfc.nasa.gov (accessed on 1 February 2022).
- Earth. Available online: https://en.wikipedia.org/wiki/Earth (accessed on 1 February 2022).
- Phases of the Moon: 2001 to 2100. Available online: http://astropixels.com/ephemeris/moon/phases2001est.html (accessed on 1 August 2018).
- Nautical Almanac Office (Compiler). The Astronomical Almanac for the Year 2008; US Government Printing Office: Washington, DC, USA, 2008; pp. D1–D22. [Google Scholar]
- Van den Bergh, G. Periodicity and Variation of Solar (and Lunar) Eclipses; H.D.Tjeenk Willink: Haarlem, The Netherlands, 1955. [Google Scholar]
- Van Ghent, P. A Catalogue of Eclipse Cycles. Available online: http://www.staff.science.uu.nl/~gent0113/eclipse/eclipsecycles.htm (accessed on 6 August 2018).
- Espenak, F. Eclipses and the Saros. Available online: https://eclipse.gsfc.nasa.gov/SEsaros/SEsaros.html (accessed on 6 August 2018).
- Moulton, F.R. Notes on the possibility of fission of a contracting rotating fluid mass. Astrophys. J. 1909, 29, 1–13. [Google Scholar] [CrossRef]
- Hofmeister, A.M.; Criss, R.E. A thermodynamic model for formation of the Solar System via 3-dimensional collapse of the dusty nebula. Planet. Space Sci. 2012, 62, 111–131. [Google Scholar] [CrossRef]
- Hofmeister, A.M.; Criss, R.E.; Criss, E.M. Verified solutions for the gravitational attraction to an oblate spheroid: Implications for planet mass and satellite orbits. Planets Space Sci. 2018, 152, 68–81. [Google Scholar] [CrossRef]
- MacMillan, W.D. The Theory of the Potential; McGraw-Hill: New York, NY, USA, 1930. [Google Scholar]
- International Astronomical Union (IAU). Committee report. In Proceedings of the Eleventh General Assembly, Berkeley, CA, USA, 15–24 August 1961; Academic Press: New York, NY, USA, 1961. [Google Scholar]
- Jacobson, R.A. The orbits of the major Saturnian satellites and the gravity field of Saturn from spacecraft and earth-based observations. Astron. J. 2004, 128, 492–501. [Google Scholar] [CrossRef] [Green Version]
- Transtrum, M.K.; Machta, B.B.; Brown, K.S.; Daniels, B.C.; Myers, C.R.; Sethna, J.P. Perspective, sloppiness and emergent theories in physics, biology, and beyond. J. Chem. Phys. 2015, 143, 010901. [Google Scholar] [CrossRef]
- Moons of Pluto. Available online: https://en.wikipedia.org/wiki/Moons_of_Pluto (accessed on 15 January 2022).
- Todhunter, I. A History of the Mathematical Theories of Attraction and the Figure of the Earth; MacMillan and Co.: London, UK, 1873; Volume 1. [Google Scholar]
- Criss, R.E. Analytics of planetary rotation: Improved physics with implications for the shape and super-rotation of Earth’s Core. Earth-Sci. Rev. 2019, 192, 471–479. [Google Scholar] [CrossRef]
- Hofmeister, A.M.; Criss, R.E.; Criss, E.M. Link of planetary energetics to moon size, orbit, and planet spin: A new mechanism for plate tectonics. In In the Footsteps of Warren B. Hamilton: New Ideas in Earth Science (Geological Society of America Special Paper 553); Foulger, G.F., Jurdy, D.M., Stein, C.A., Hamilton, L.C., Howard, K., Stein, S., Eds.; Geological Society of America: Boulder, CO, USA, 2022. [Google Scholar] [CrossRef]
- Riguzzi, F.; Panza, G.; Varga, P.; Doglioni, C. Can Earth’s rotation and tidal despinning drive plate tectonics? Tectonophysics 2010, 484, 60–73. [Google Scholar] [CrossRef]
- Doglioni, C.; Panza, G. Polarized plate tectonics. Adv. Geophys. 2015, 56, 1–167. [Google Scholar]
- Anderson, D.L. New Theory of the Earth; Cambridge University Press: New York, NY, USA, 2007. [Google Scholar]
- Panella, G. Paleontological clocks and the history of the Earth’s rotation. In Growth Rhythms and the History of the Earth’s Rotation; Rosenberg, G.D., Runcorn, S.K., Eds.; Wiley: London, UK, 1975; pp. 253–284. [Google Scholar]
- Lathe, R. Early tides: Response to Varga et al. Icarus 2006, 180, 277–280. [Google Scholar] [CrossRef]
- Mohazzabi, P.; Skalbeck, J.D. Superrotation of Earth’s inner core, extraterrestrial impacts, and the effective viscosity of outer core. Int. J. Geophys. 2015, 2015, 763716. [Google Scholar] [CrossRef]
- Na, S.H.; Lee, S. Re-estimation of Earth spin rotational energy decrease due to tidal friction. Geosci. J. 2014, 18, 1–6. [Google Scholar] [CrossRef]
- Hofmeister, A.M.; Criss, R.E. Spatial and symmetry constraints as the basis of the virial theorem and astrophysical implications. Can. J. Phys. 2016, 94, 380–388. [Google Scholar] [CrossRef]
- Simon, K.R. Mechanics; Addison-Wesley: New York, NY, USA, 1975. [Google Scholar]
- Gomes, R.; Levinson, H.F.; Tsiganis, K.; Morbidelli, A. Origin of the cataclysmic late heavy bombardment period of the terrestrial planets. Nature 2005, 435, 466–469. [Google Scholar] [CrossRef] [PubMed] [Green Version]
- Viswanathan, V.; Fienga, A.; Minazzoli, O.; Bernus, L.; Laskar, J.; Gastineau, M. The new lunar ephemeris INPOP17a and its application to fundamental physics. Mon. Not. R. Astron. Soc. 2018, 476, 1877–1888. [Google Scholar] [CrossRef] [Green Version]
- Nautical Almanac Office (Compiler). The Astronomical Almanac for the Year 1992; US Government Printing Office: Washington, DC, USA, 1992; pp. D1–D22. [Google Scholar]
- Nautical Almanac Office (Compiler). The Astronomical Almanac for the Year 1999; US Government Printing Office: Washington, DC, USA, 1999; pp. D1–D22. [Google Scholar]
- Samain, E.; Mangin, J.F.; Veillet, C.; Torre, J.M.; Fridelance, P.; Chabaudie1, J.E.; Féraudy, D.; Glentzlin, M.; Pham Van, J.; Furia, M.; et al. Millimetric lunar laser ranging at OCA (Observatoire de la Côte d’Azur). Astron. Astrophys. Suppl. Ser. 1998, 130, 235–244. [Google Scholar] [CrossRef] [Green Version]
- Battat, J.B.; Murphy, T.W.; Adelberger, E.G.; Gillespie, B.; Hoyle, C.D.; McMillan, R.J.; Michelsen, E.L.; Nordtvedt, K.; Orin, A.E.; Stubbs, C.W.; et al. The Apache point observatory lunar laser-ranging operation (APOLLO): Two years of millimeter-precision measurements of the earth-moon range. Pub. Astron. Soc. Pac. 2009, 121, 29–40. [Google Scholar] [CrossRef]
- Murphy, T.W. Lunar laser ranging: The millimeter challenge. Rep. Prog. Phys. 2013, 76, 076901. [Google Scholar] [CrossRef] [Green Version]
- Folkner, W.M.; Williams, J.G.; Boggs, D.H.; Park, R.S.; Kuchynka, P. The planetary and lunar ephemerides DE430 and DE431. Interplanet. Netw. Progr. Rep. 2014, 196, 1–81. [Google Scholar]
- Lunar Laser Ranging Experiment. Available online: https://en.wikipedia.org/wiki/Lunar_Laser_Ranging_experiment (accessed on 27 February 2022).
- Williams, J.; Turyshev, S.; Boggs, D. Lunar laser ranging tests of the equivalence principle with the Earth and Moon. Int. J. Mod. Phys. D 2009, 18, 1129–1175. [Google Scholar] [CrossRef] [Green Version]
- Hill, G.W. The secular perturbations of the planets. Am. J. Math. 1901, 23, 317–336. [Google Scholar] [CrossRef]
- Criss, R.E.; Hofmeister, A.M. Galactic density and evolution based on the virial theorem, energy minimization, and conservation of angular momentum. Galaxies 2018, 6, 115. [Google Scholar] [CrossRef] [Green Version]
- Armitage, P.J. Dynamics of protoplanetary disks. Ann. Rev. Astron. Astrophys. 2011, 49, 195–236. [Google Scholar] [CrossRef] [Green Version]
- Hecht, E. Kepler and the origins of the theory of gravity. Am. J. Phys. 2019, 87, 176–185. [Google Scholar] [CrossRef]
Publisher’s Note: MDPI stays neutral with regard to jurisdictional claims in published maps and institutional affiliations. |
© 2022 by the authors. Licensee MDPI, Basel, Switzerland. This article is an open access article distributed under the terms and conditions of the Creative Commons Attribution (CC BY) license (https://creativecommons.org/licenses/by/4.0/).