Article

Wind Tunnel Experiments on Interference Effects of a High-Rise Building on the Surrounding Low-Rise Buildings in an Urban Block

1
Department of Architecture and Building Science, Graduate School of Engineering, Tohoku University, 6-6 Aoba, Aramaki, Aoba-ku, Sendai 980-8579, Miyagi, Japan
2
Architecture Course, Faculty of Engineering, Tokyo Polytechnic University, 5-45-1 Iiyamaminami, Atsugi 243-0297, Kanagawa, Japan
*
Author to whom correspondence should be addressed.
Wind 2023, 3(1), 97-114; https://doi.org/10.3390/wind3010007
Submission received: 21 December 2022 / Revised: 3 February 2023 / Accepted: 13 February 2023 / Published: 21 February 2023
(This article belongs to the Special Issue Wind Loads on Buildings and Structures)

Abstract

:
High-rise buildings cause accelerated winds around them. However, the interference effects of high-rise buildings on the surrounding low-rise buildings in urban blocks have not been evaluated. This study investigated the wind pressure coefficients on the roofs and walls of low-rise buildings surrounding a high-rise building through wind tunnel experiments. Seventy-two wind directions were considered from 0° to 355° in 5° increments, and the influence of the wind direction on the wind pressure coefficients of surrounding buildings was evaluated. At a 30° wind direction angle, the positive and negative peak wind pressure coefficients occurred in a low-rise building at the leeward side of the high-rise building. The positive peak pressure, approximately 1.4 times that without a nearby high-rise building, occurred at the windward corner on the front wall of a low-rise building. The negative peak value, approximately three times that without a nearby high-rise building, was observed at the windward edge on the roof of a low-rise building. Thus, accelerated winds caused by high-rise buildings may result in unexpected damage to the surrounding low-rise buildings.

1. Introduction

Wind loads are among the essential factors considered in the structural design of high-rise buildings worldwide. Wind pressure acting on high-rise buildings has been evaluated through wind tunnel experiments [1,2,3,4,5] and computational fluid dynamics (CFD) simulations [6,7,8].
High-rise buildings cause strong winds in the surrounding pedestrian spaces. Many studies on their extent and statistical characteristics have been conducted. Xu et al. [9] performed wind tunnel experiments on a single high-rise building of various shapes and sizes to comprehensively investigate the intensity and extent of strong winds generated in the surrounding pedestrian area by a high-rise building. It was reported that the width of the lower part of the high-rise building and the modification of the building corner have a significant influence on the pedestrian-level winds. Murakami et al. [10] reported that a locally stronger wind velocity occurs when low-rise buildings exist around a high-rise building than when a high-rise building stands alone. van Druenen et al. [11] systematically analyzed the reduction effect of strong winds by canopies, podiums, and permeable floors using CFD analysis, and the influence of the morphology of high-rise buildings on the reduction effect was indicated quantitatively. These studies focused on predicting strong winds generated by high-rise buildings in pedestrian spaces, and the development of relevant countermeasures remains as a key focus in wind engineering.
Furthermore, considering how high-rise buildings change the flow field around them, many studies have been conducted to investigate the interference effect of a high-rise building. The aerodynamic response of the target building to be evaluated is altered by the presence of a high-rise building around the target building [12]. Bailey and Kwok [13] investigated the relationship between the location and morphology of an interfering high-rise building and the overturning moment of a target building through wind tunnel experiments. Kim et al. [14,15] and Hui et al. [16] analyzed the interference effects between two high-rise buildings, including the local peak wind pressure on the wall surface. In addition, the influence of the morphology of the interfering high-rise building on the aerodynamic response of the target building was analyzed. Xie et al. [17] analyzed the interference effects of three high-rise buildings through wind tunnel experiments. Lam et al. [18] analyzed the aerodynamic response, surface pressure, and flow field for conditions with only one and multiple interfering buildings. In high-density urban areas, it is assumed that the flow field generated by high-rise buildings affects the low-rise buildings surrounding high-rise buildings. Chen et al. [19] performed wind tunnel experiments for several cases in which the height of the interference building and distance between the interference building and target building were systematically varied. When the interference building was taller than the target building, and the distance between them was small, the positive pressure acting on the roof surface of the target building was high when the high-rise building was at the leeward side of the lower target building. This was because of the downflow generated by the high-rise building. The negative pressure value acting on the roof surface of the target building increased when the high-rise building was at the windward side of the target building. Chen et al. [20] performed wind tunnel experiments to evaluate the interference effect of a super-high-rise building on a high-rise building. They found that the overall aerodynamic forces and acceleration responses of the target building increased significantly when the super-high-rise building was at the windward side of the target high-rise building owing to the induced airflow deflection and vortex shedding. Additionally, they found that the interference effects of a super-high-rise building on the surrounding buildings cannot be ignored in high-density urban areas.
As mentioned in the two paragraphs above, these previous studies analyzed the influence of a high-rise building on the surrounding wind environment within an urban block and the interference effect of high-rise buildings on a certain building around them. However, the interference effects of a high-rise building on the surrounding low-rise buildings in an urban block have not yet been sufficiently investigated. Additionally, the influence of the distance from a high-rise building on the wind pressure acting on a low-rise building has not been analyzed systematically. This study performed wind tunnel experiments under the conditions of a single high-rise building in a low-rise urban block with cube-shaped building models with a 25% gross building coverage ratio to measure wind pressure on low-rise buildings surrounding the high-rise building.
The remainder of this paper is organized as follows: Section 2 presents the outlines of the wind tunnel experiments and evaluation indices used in the current study; Section 3 presents the results of the measurements and discussion; and Section 4 presents the conclusions of the study.

2. Outlines of Wind Tunnel Experiments

2.1. Experimental Models

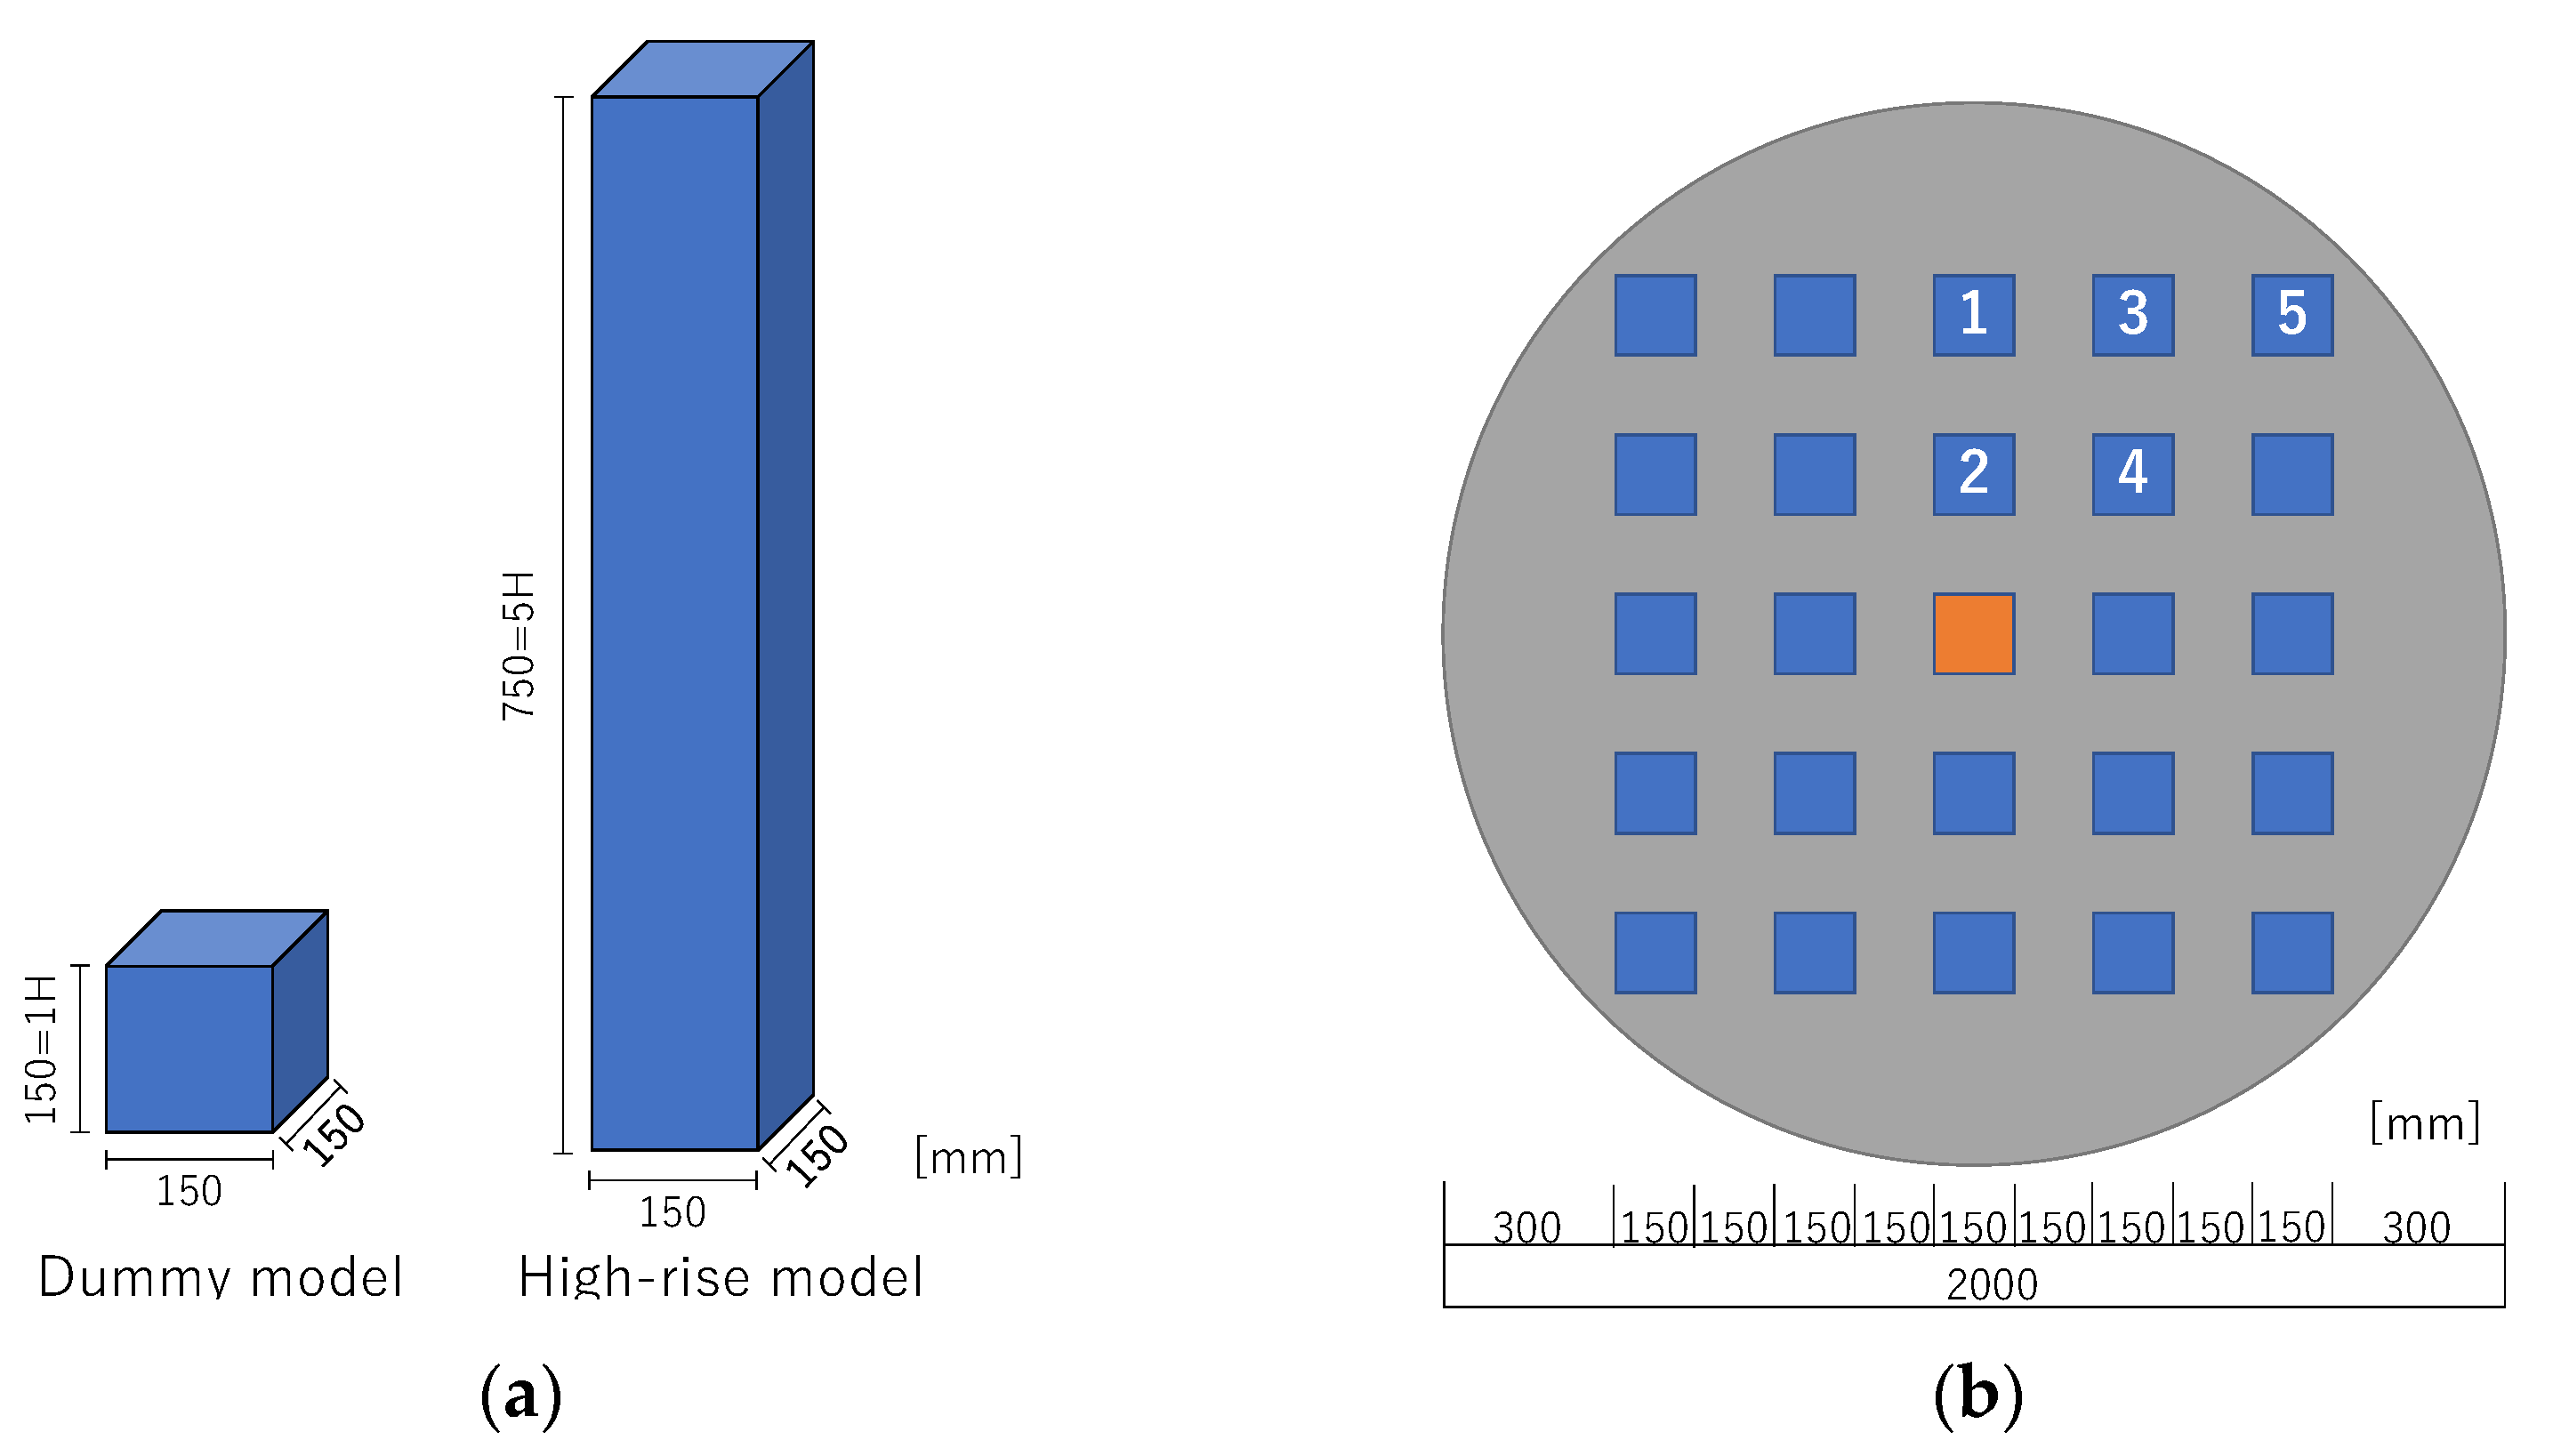
Wind tunnel experiments were performed using 1/200 geometric-scale models. As shown in Figure 1, the pressure measurement model was a 0.15 m cube, and 100 (10 × 10) and 64 (8 × 8) pressure taps were installed on the roof surface and other surfaces, respectively, totaling 356 pressure taps. An 800-mm-long vinyl tube with an inner diameter of 1.4 mm was connected to each pressure tap for pressure measurement. The effects of the tubing system on the measured pressures were eliminated by applying a transfer function and phase delays. The test model for wind pressure measurement (orange in Figure 2) was fixed at the center of the turntable, and dummy building models (blue in Figure 2) of the same size were set around it as the test models with a 25% gross coverage ratio.
In this urban block, the experiments were performed for six cases: five cases with one high-rise building (depth and width of 150 mm and height of 750 mm, five times the height of the test model for wind pressure measurement) at locations 1–5 in Figure 2, and one case without a high-rise building (Case 0). Table 1 lists the experimental cases, and Figure 3 shows a photograph of the experimental models installed in the wind tunnel in Case 1.

2.2. Experimental Conditions

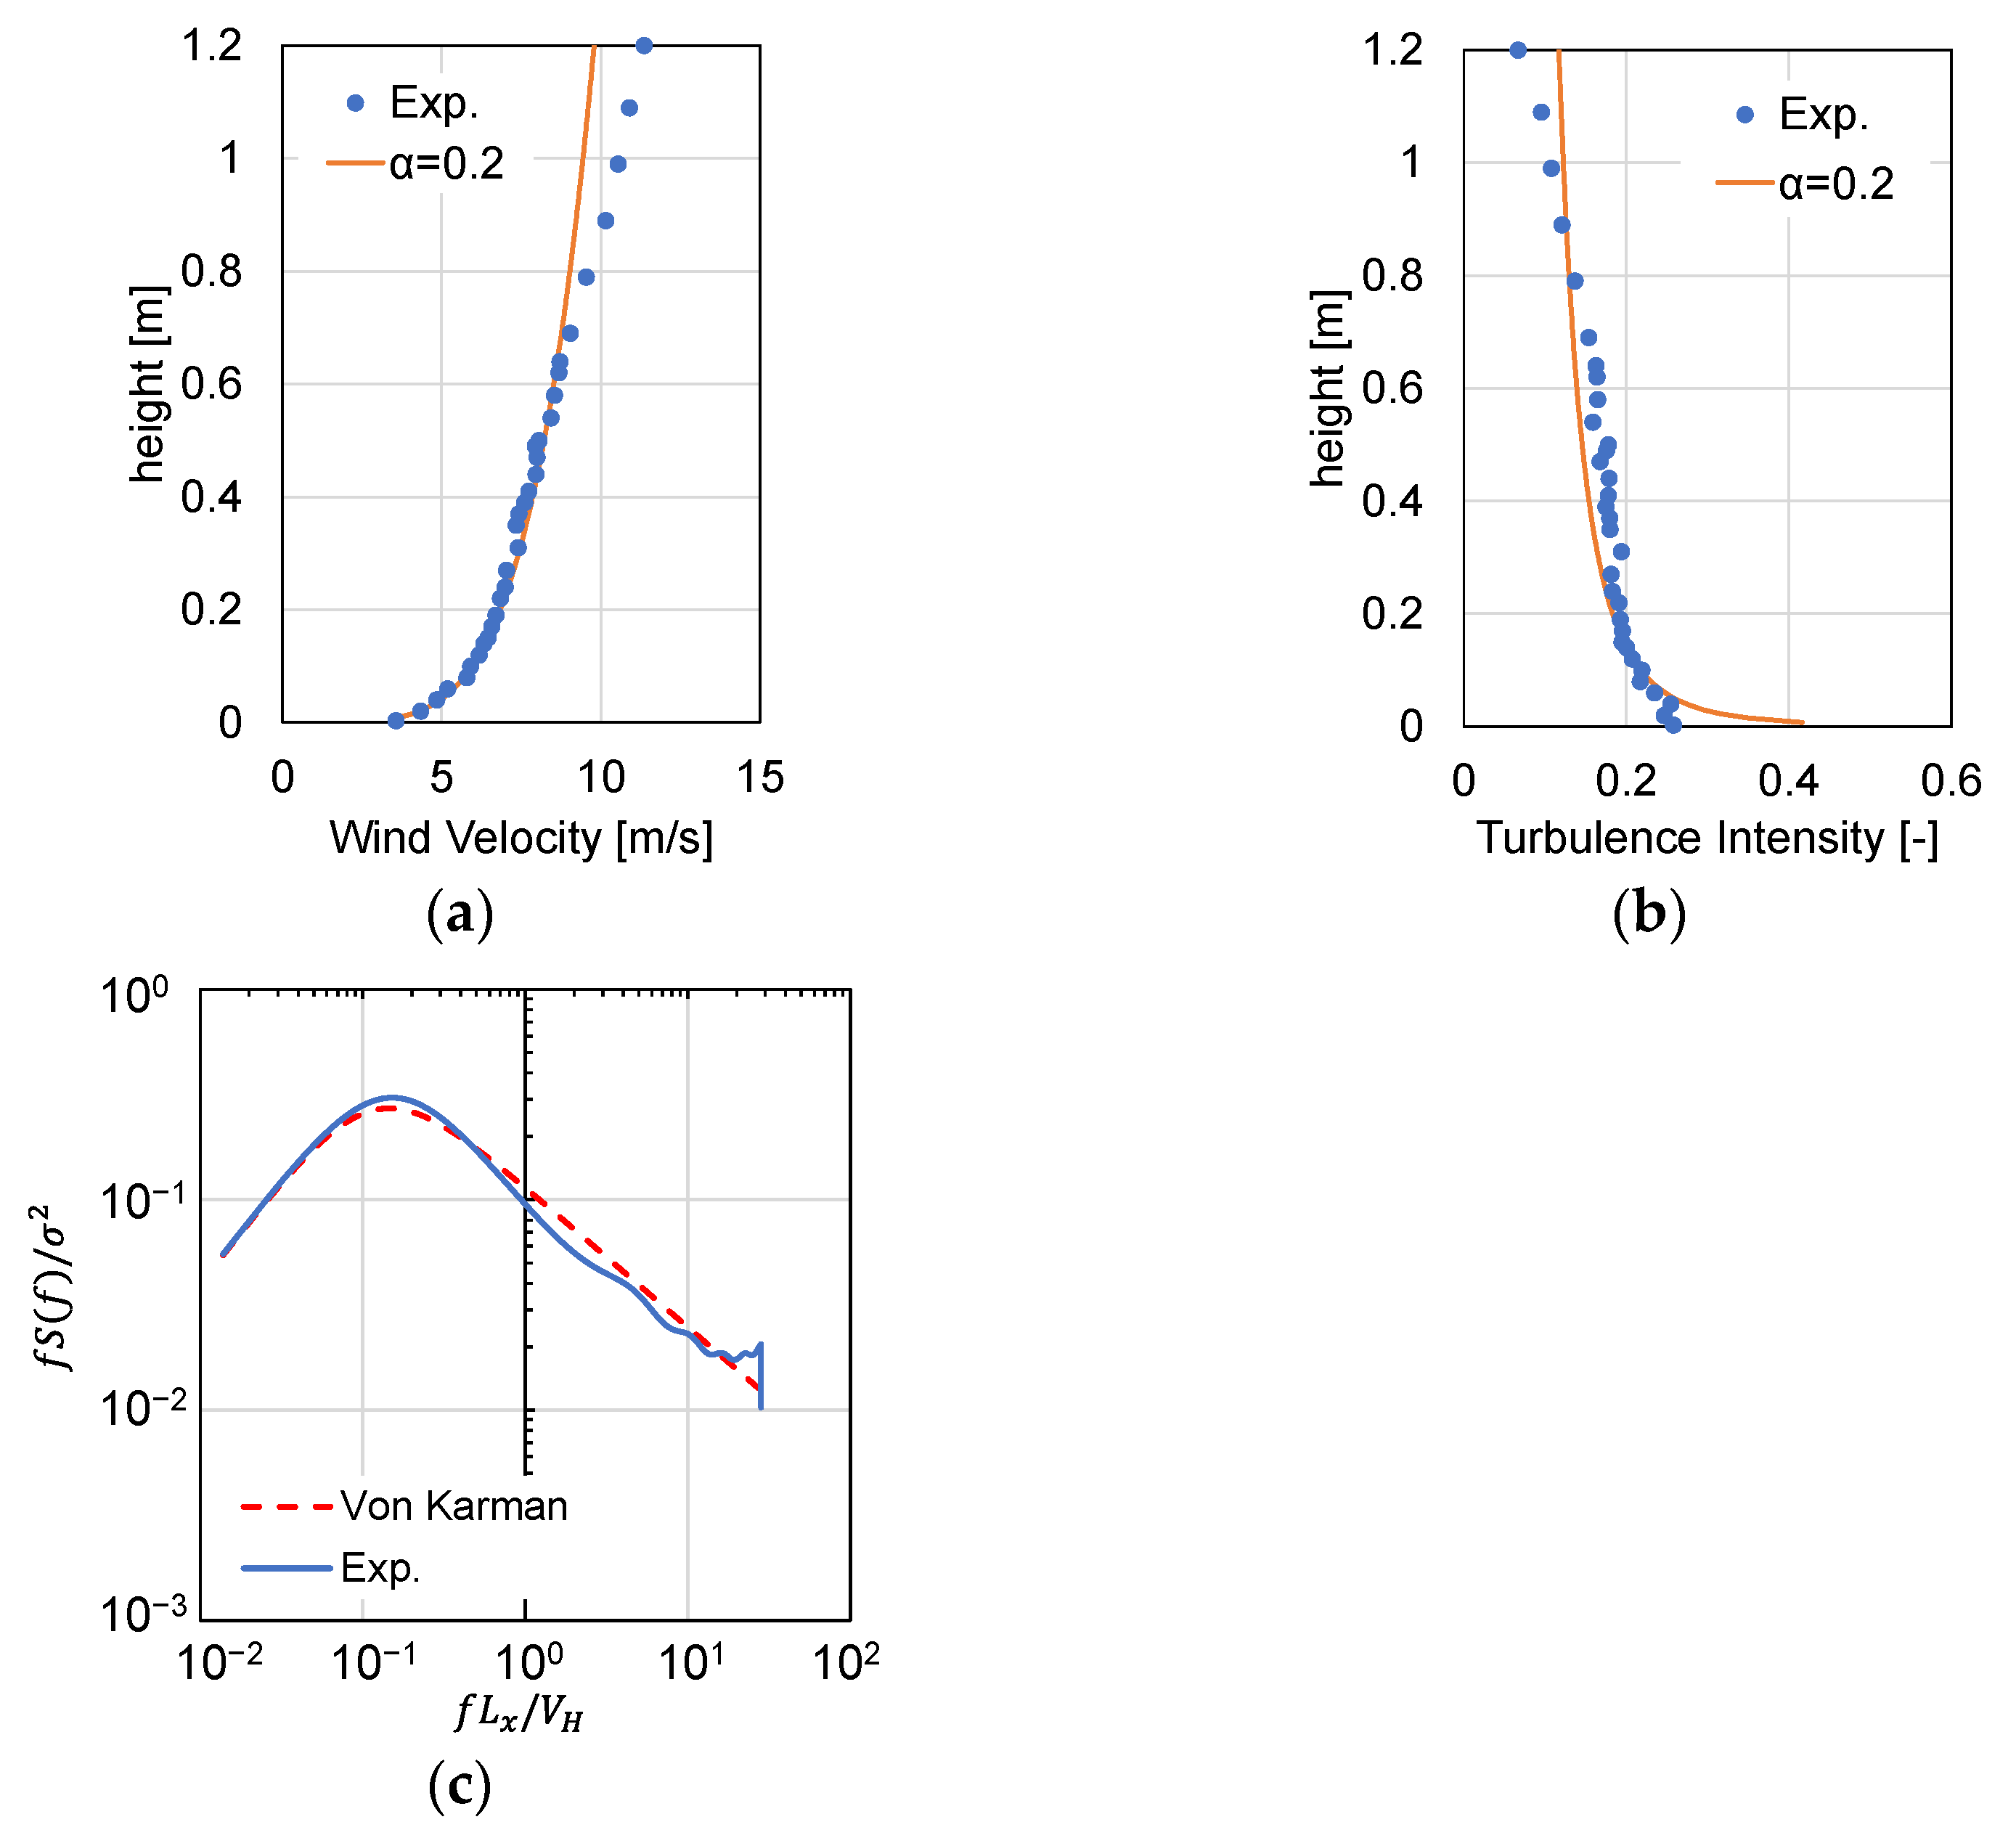
The wind tunnel experiments were performed in a boundary-layer wind tunnel at the Tokyo Polytechnic University, Japan. The test section of the wind tunnel was 2.2 m wide, 1.8 m high, and 19 m long. The range of blockage ratio in this study was 5% at a wind direction of 0°. Although the ratio at the wind direction of 45° was approximately 7%, which is not a small value, there was no correction for values in this study. In this study, the flow of the atmospheric boundary layer in the wind tunnel was interpreted at a geometrical scale of approximately 1/200. Approach flow profiles were created using the upwind roughness elements. The approach flow represented urban wind exposure with a power law exponent of 0.2, a suburban wind exposure corresponding to terrain category III [21]. A velocity scale of 1/6 and time scale of 3/100 were assumed. The wind velocity and turbulence intensity at the roof height of the pressure measurement model were approximately 6.5 m/s and 20%, respectively. Figure 4 shows the vertical distributions of the mean wind velocity and turbulent intensity and the power spectrum density of the fluctuating wind velocity of the approach flow. Seventy-two wind directions were considered from 0° to 355° in 5° steps. The pressures of all taps were measured simultaneously with a sampling frequency of 800 Hz and low-pass-filtered with a cutoff frequency of 300 Hz, cascaded in each data acquisition channel to eliminate aliasing effects. The sampling time was 20 s (10 min on a full-time scale), and 10 samples were obtained. The tubing effects were numerically compensated for by the gain and phase-shift characteristics of the pressure measurement system [22].
The mean wind velocity at the roof height of the pressure measurement model, u H ¯ , was used to obtain the reference velocity pressure, q H ¯ . The velocity ratio between the heights of 150 mm and 1200 mm obtained without the building models on the turntable was calculated using a pitot tube to determine the mean wind velocity at the roof height of 150 mm, u H ¯ . u H ¯ in each experimental case was obtained using the calculated velocity ratio and wind velocity at a height of 1200 mm measured in each case. q H ¯ was used to obtain the instantaneous pressure coefficients. Moving averages corresponding to 0.0067 s (0.2 s on the full-time scale) were applied to instantaneous pressures to obtain the sample statistics [23]—in other words, the mean, fluctuating, maximum peak, and minimum peak coefficients for 600 s on the full-time scale. Finally, an ensemble average of ten samples was applied to each coefficient.
The formulas for calculating the wind pressure coefficients are shown below:
C p = p i q H ¯ ,
q H ¯ = ρ u H ¯ 2 2 ,
C p ¯ = 1 n i = 1 n C p ( i ) ,
p e a k C p = 1 10 n = 1 10 p e a k C p ( n ) ,
C p = σ p q h ¯ ,
σ p = 1 n i = 1 n ( p i p ¯ ) 2 ,
where C p [-] is the wind pressure coefficient at each tap of the wind pressure measurement model, p i [N/m2] is the wind pressure at each tap, q H ¯ [N/m2] is the reference velocity pressure at 150 mm, ρ [kg/m3] is the air density, u H ¯ [m/s] is the mean wind velocity at 150 mm, C p ¯ [-] is the mean wind pressure coefficient, p e a k C p ( n ) [-] is the maximum or minimum wind pressure coefficient at each tap for each sample, n [-] is the number of samples, C p [-] is the fluctuating pressure coefficient at each tap, σ p [N/m2] is the standard deviation of the wind pressure value at each tap, and p ¯ [N/m2] is the mean wind pressure at each tap.

3. Results and Discussion

3.1. Comparison with a Previous Experiment on an Isolated Cube Building

In this subsection, the wind pressure coefficients for an isolated cube building in the present study are compared with those in the database established by the Wind Engineering Research Center of Tokyo Polytechnic University [24]. The experimental conditions for this database are as follows. The geometric scale was set to 1/100. A velocity scale of 1/3 and a time scale of 3/100 were assumed. The turbulence intensity at the roof height of the pressure measurement model was approximately 25%. Suburban terrain corresponding to terrain category III [21] was chosen as the wind field. The sampling frequency was 500 Hz. The sampling time was 18 s and 10 samples were obtained for each case. The database is publicly available, and one of the 10 samples of time series of wind pressure coefficients at each tap for each case of 0° to 90° in 15° steps can be downloaded.
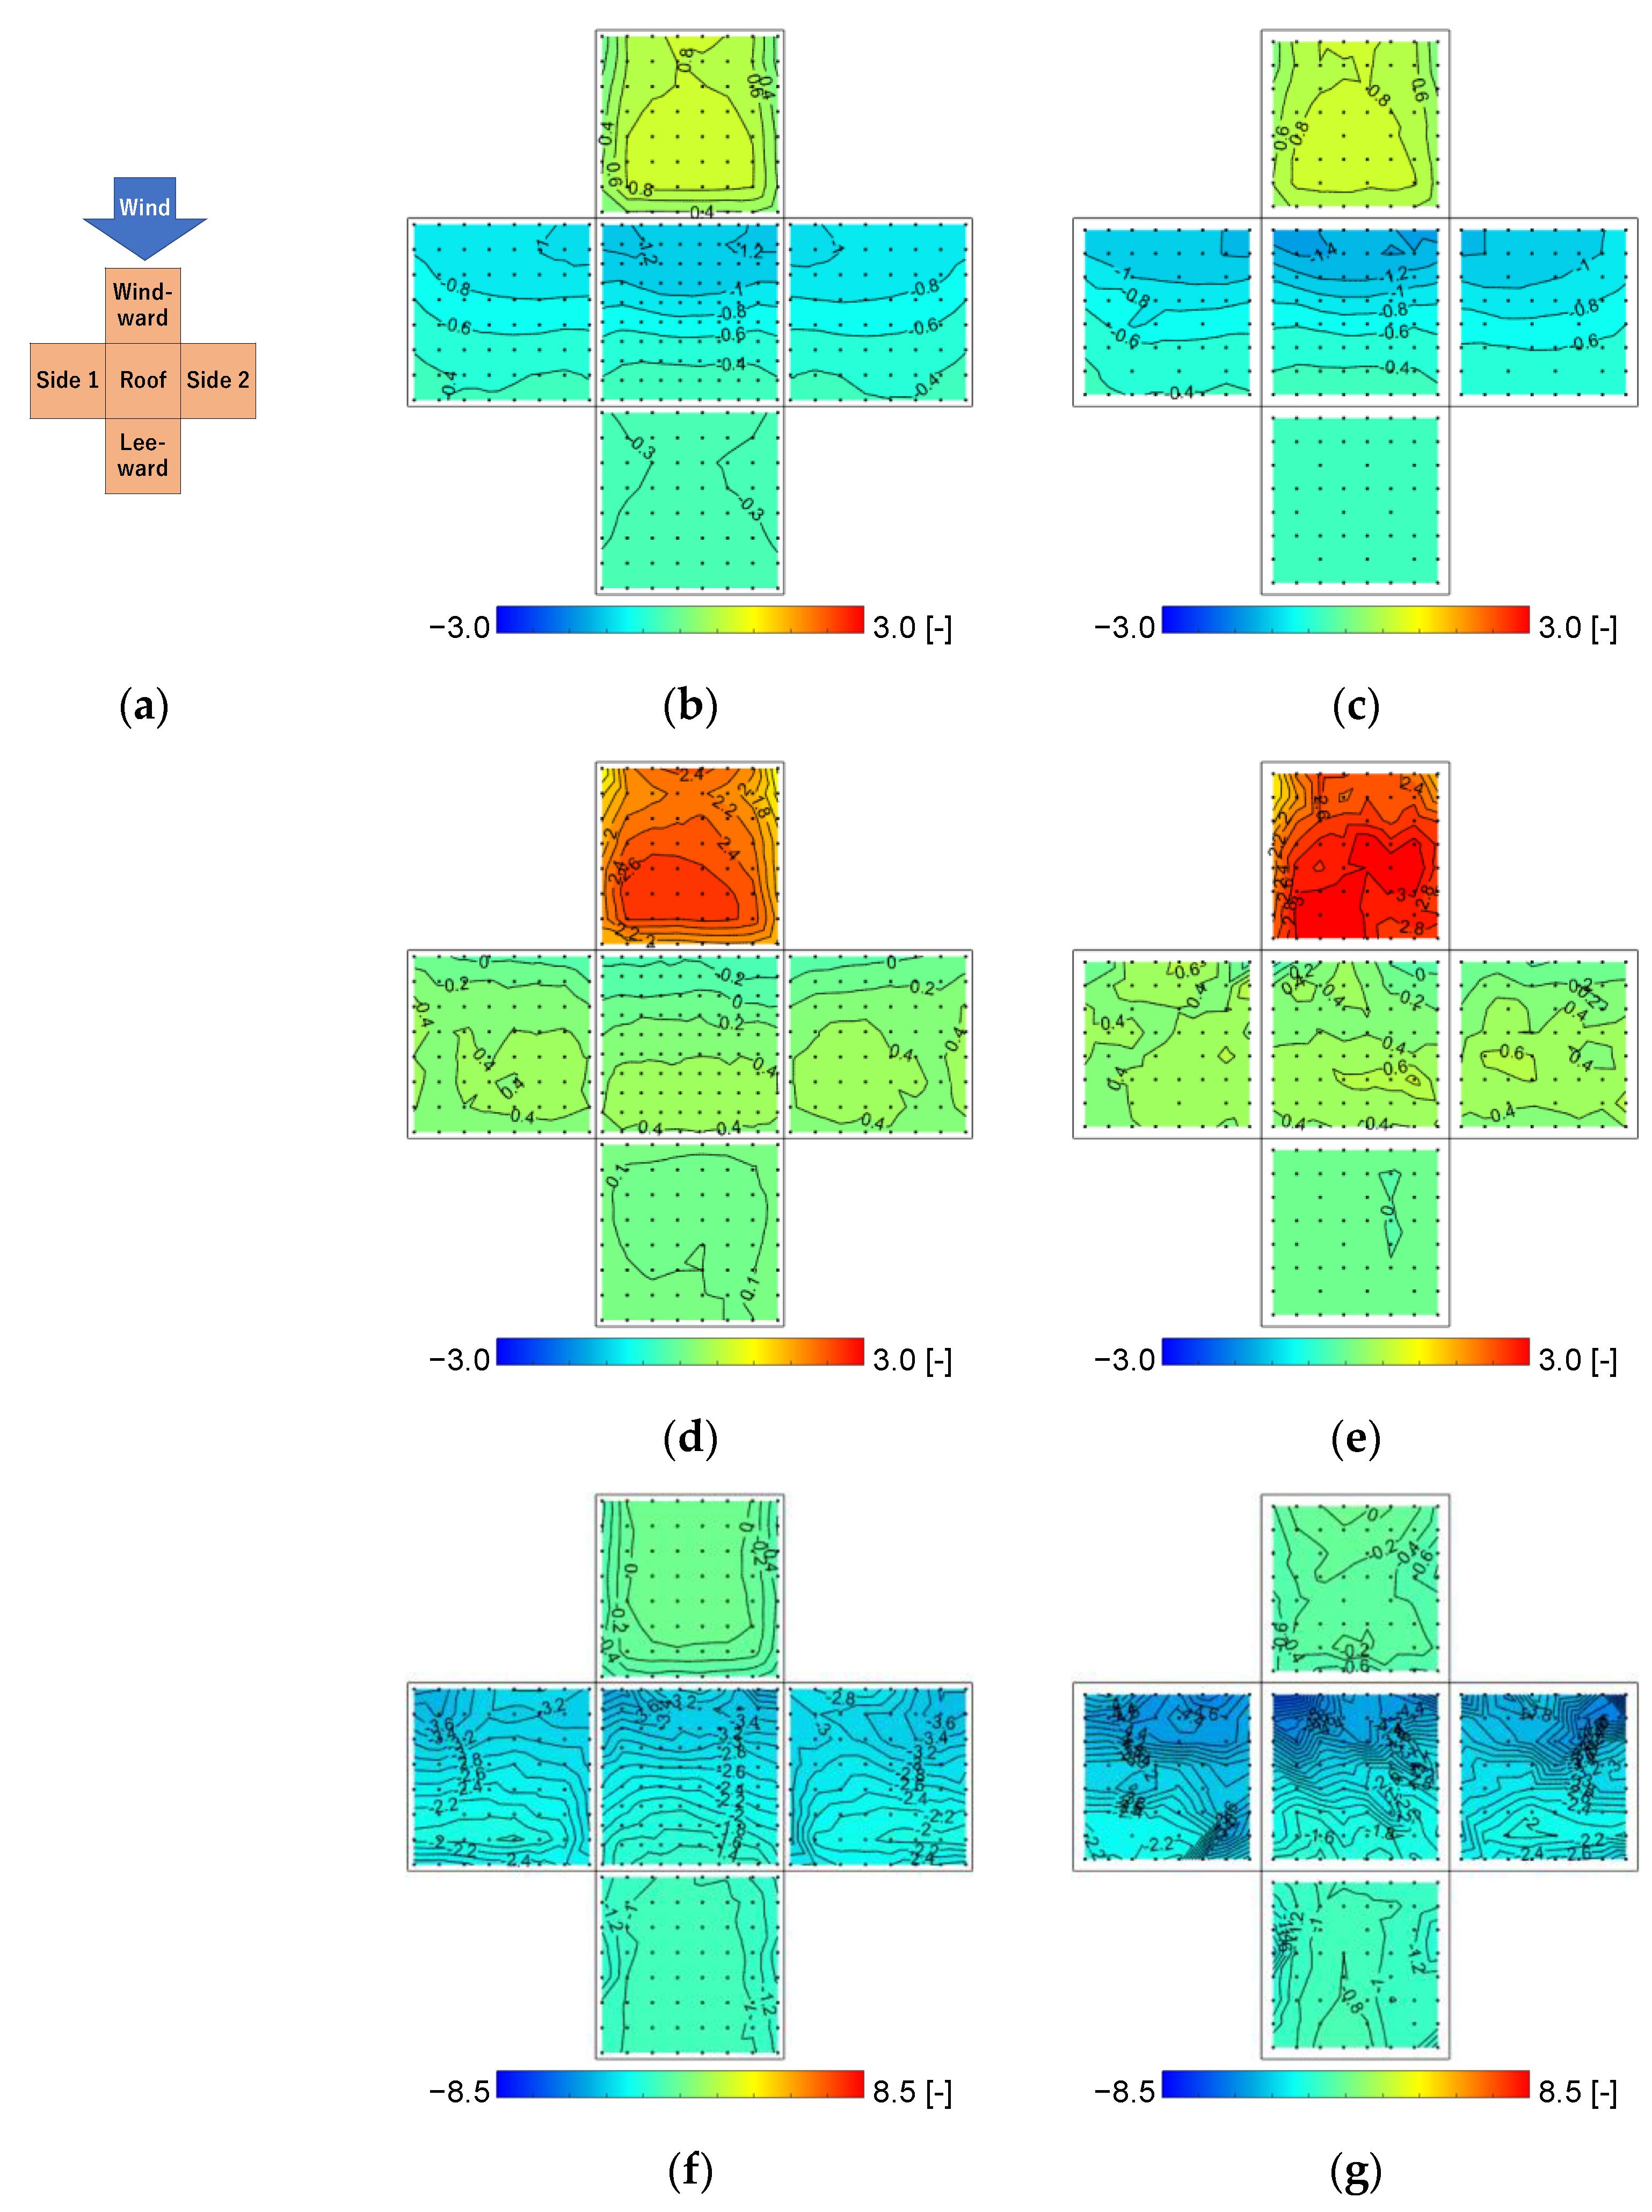
Figure 5 shows the surface distributions of each wind pressure coefficient at a wind direction of 0°.
As shown in the results for the mean wind pressure coefficient C p ¯ , the surface distribution in this study was generally similar to that in the database, although a slightly lower negative pressure occurred on the roof and side 1 and 2 surfaces than in the database. As shown in Figure 5d,e, the distributions of positive p e a k C p were generally similar for both. As for the distributions of the negative p e a k C p , the values on the roof and side 1 and 2 surfaces in the database were approximately 20% larger than those in the present study. The main cause of the difference seems to be the ensemble averaging not being applied to the database results, since only one of 10 samples was publicly available. On the other hand, the regions with a large negative p e a k C p on each surface were similarly distributed in both results; therefore, the data obtained in the current experiments seem to be acceptable for analysis. It is noted that the maximum value of positive p e a k C p and the minimum value of negative p e a k C p among all taps for all wind directions for an isolated cube building model in this study were 3.0 [-] and −8.0 [-], respectively.

3.2. Variations in p e a k C p for Wind Direction and Location of a High-Rise Building

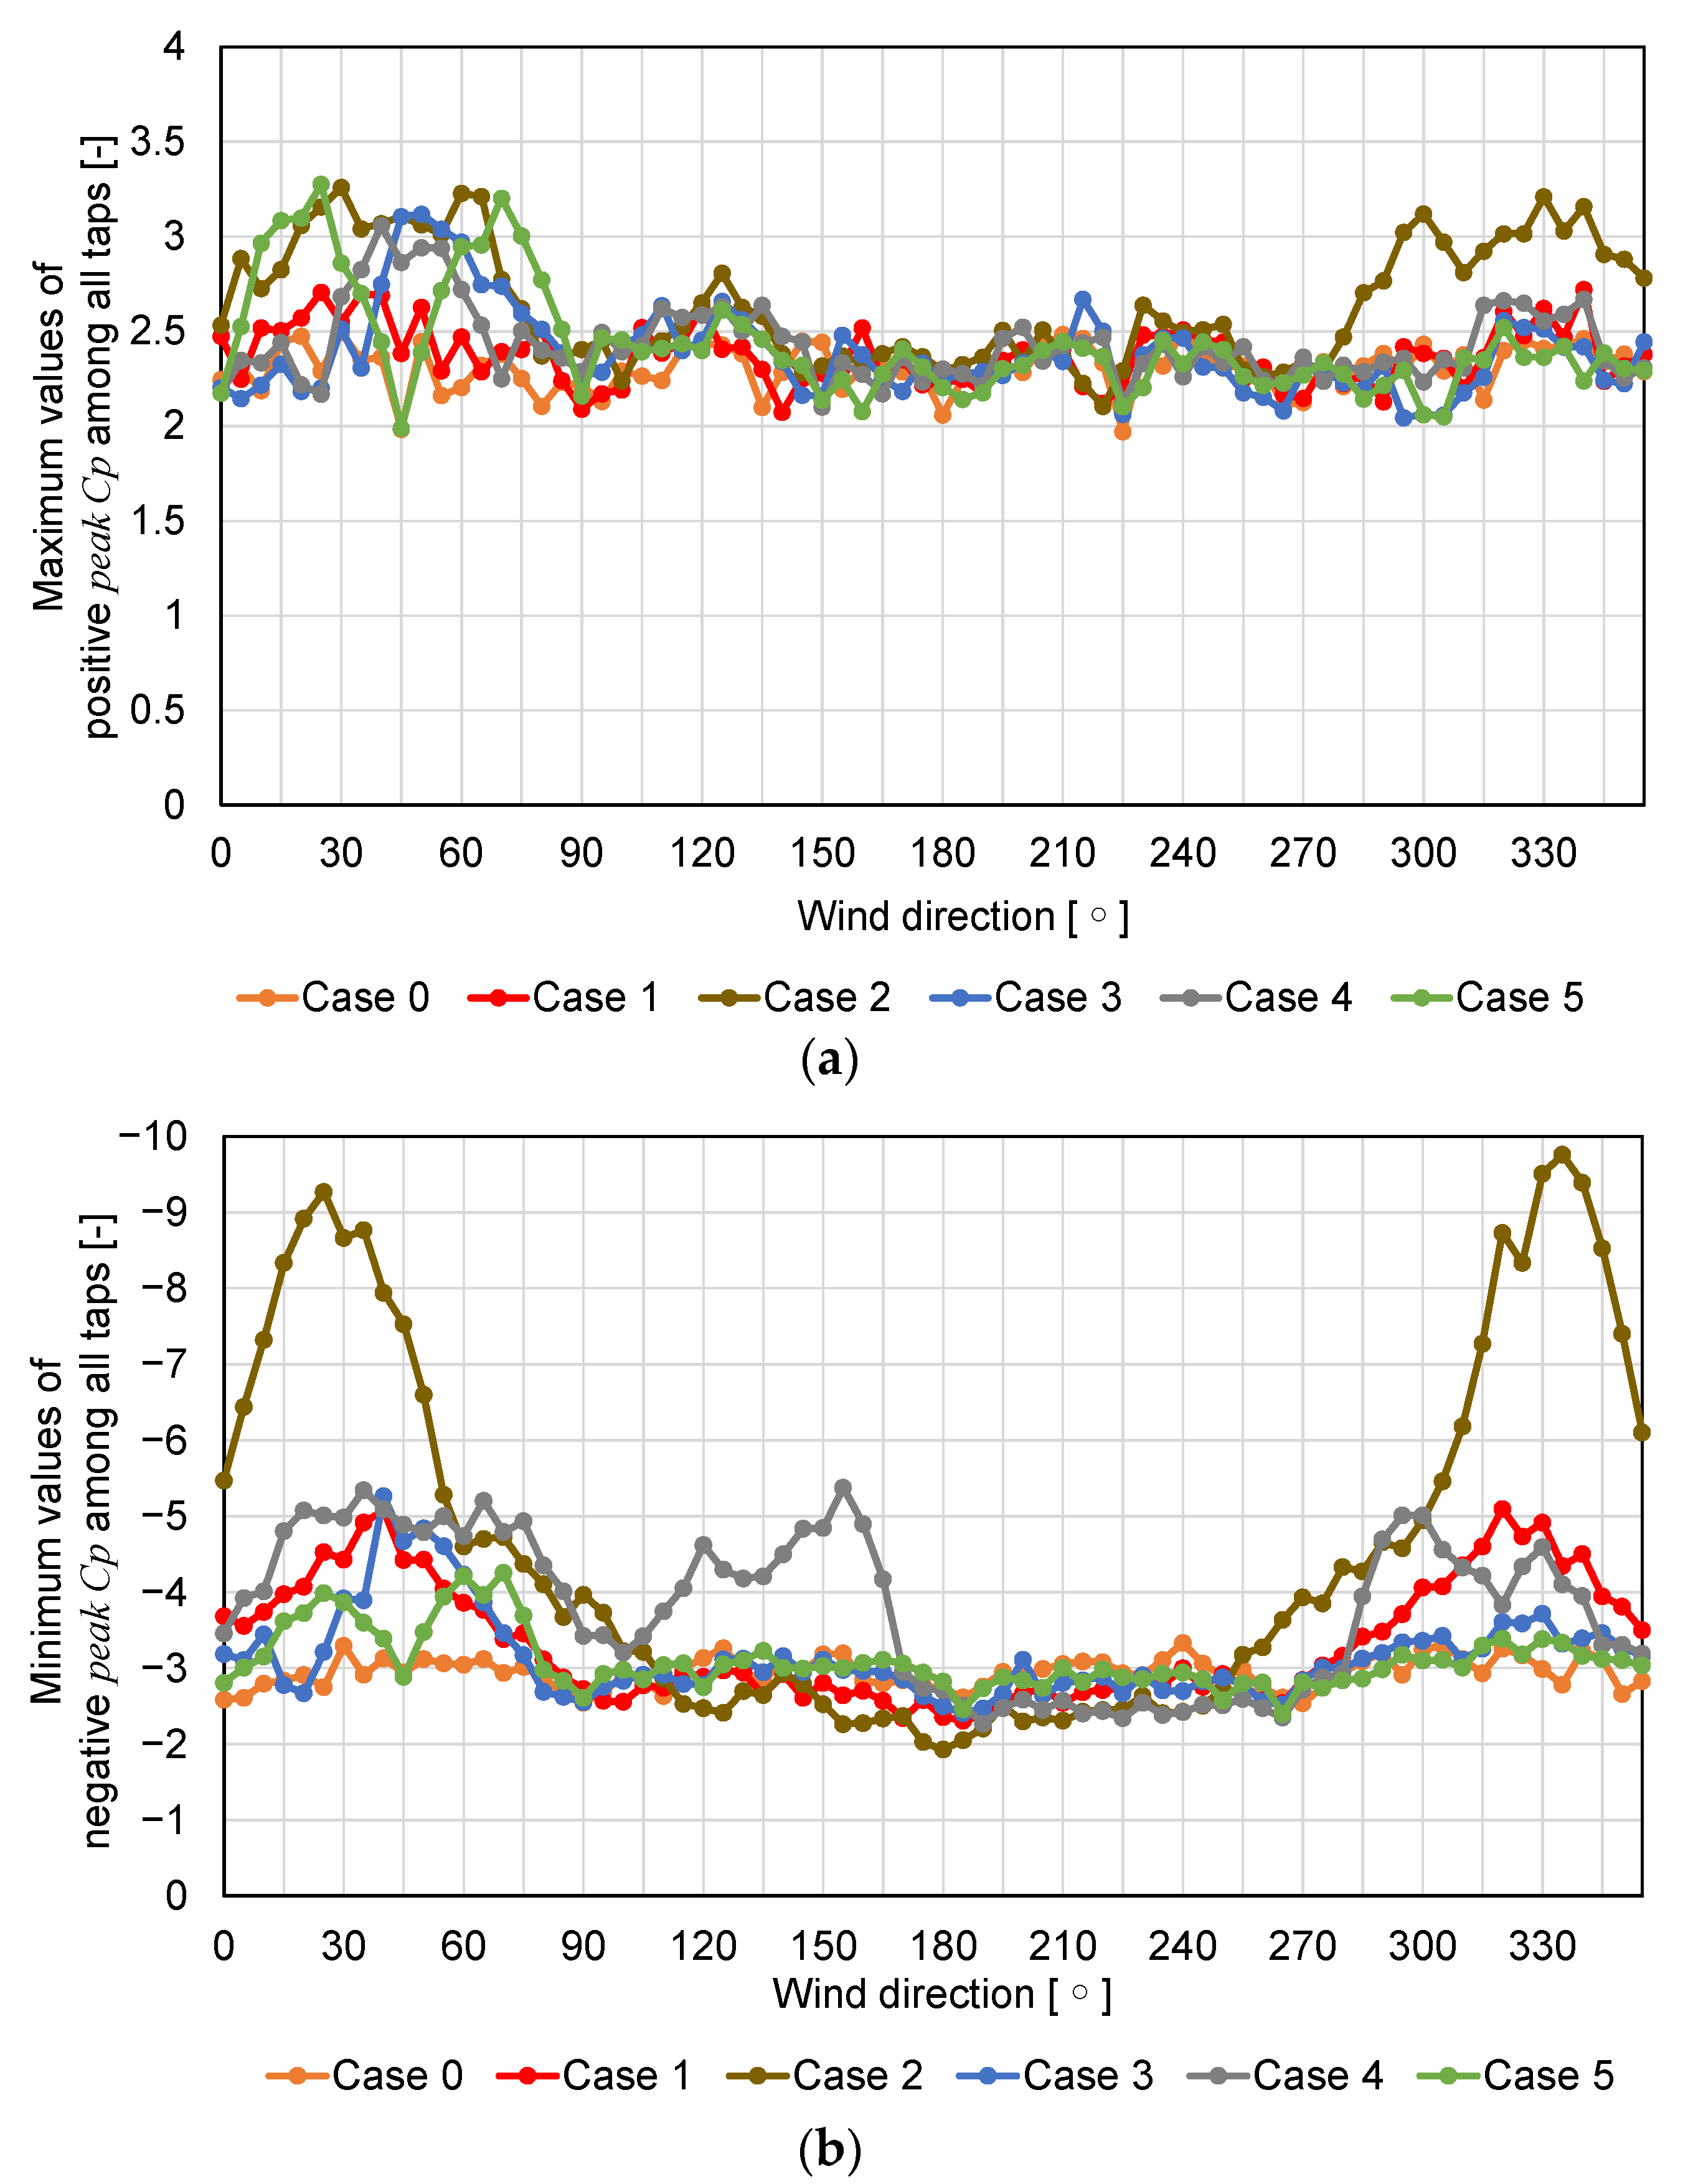
Figure 6 shows variations in the maximum values of positive p e a k C p and minimum values of negative p e a k C p among all taps for the wind directions and location of a high-rise building. For the positive p e a k C p , higher values were obtained at approximately 30° (330°) and 65° (295°) in Case 2, wherein a high-rise building was next to the pressure measurement model, as shown in Figure 2b. These values were approximately 3.3 [-], which was approximately 10% higher than the result for an isolated cube building, as shown in the previous subsection. In Case 5, wherein a high-rise building was relatively far from the pressure measurement model, the values were close to those of Case 2 at wind directions of 30° and 65°. Case 3 and Case 4 showed a value of approximately 3.0 [-] at a wind direction of approximately 45°. The values in Case 1 did not differ significantly from those in Case 0 (no high-rise building), indicating that the influence of the high-rise building was small. As shown in Figure 6b, Case 2 had large negative p e a k C p values at a 30° (330°) wind direction, approximately three times larger than those in Case 0 (no high-rise building) and approximately 18% larger than the result for an isolated cube building. It is noted that the tap with the maximum value of the positive p e a k C p was found on a different vertical wall surface depending on the wind direction, and the minimum value of the negative p e a k C p occurred generally on the roof surface.
In summary, the absolute values of both positive and negative p e a k C p were high, particularly in Case 2. Positive pressure was large at the 30° and 65° wind directions, whereas negative pressure was large at a 30° wind direction.

3.3. Wind Pressure Coefficient Distributions

This subsection presents the surface distributions of each wind pressure coefficient for Case 2, where the p e a k C p values were large among all the cases in the previous section.

3.3.1. Wind Pressure Coefficients at 30° Wind Direction in Case 0 and Case 2

This subsection presents the surface distributions of each wind pressure coefficient for the wind direction condition of 30°, where both the positive and negative p e a k C p were large. For comparison, the results for 0° in Case 2 and for 0° and 30° in Case 0 are shown.
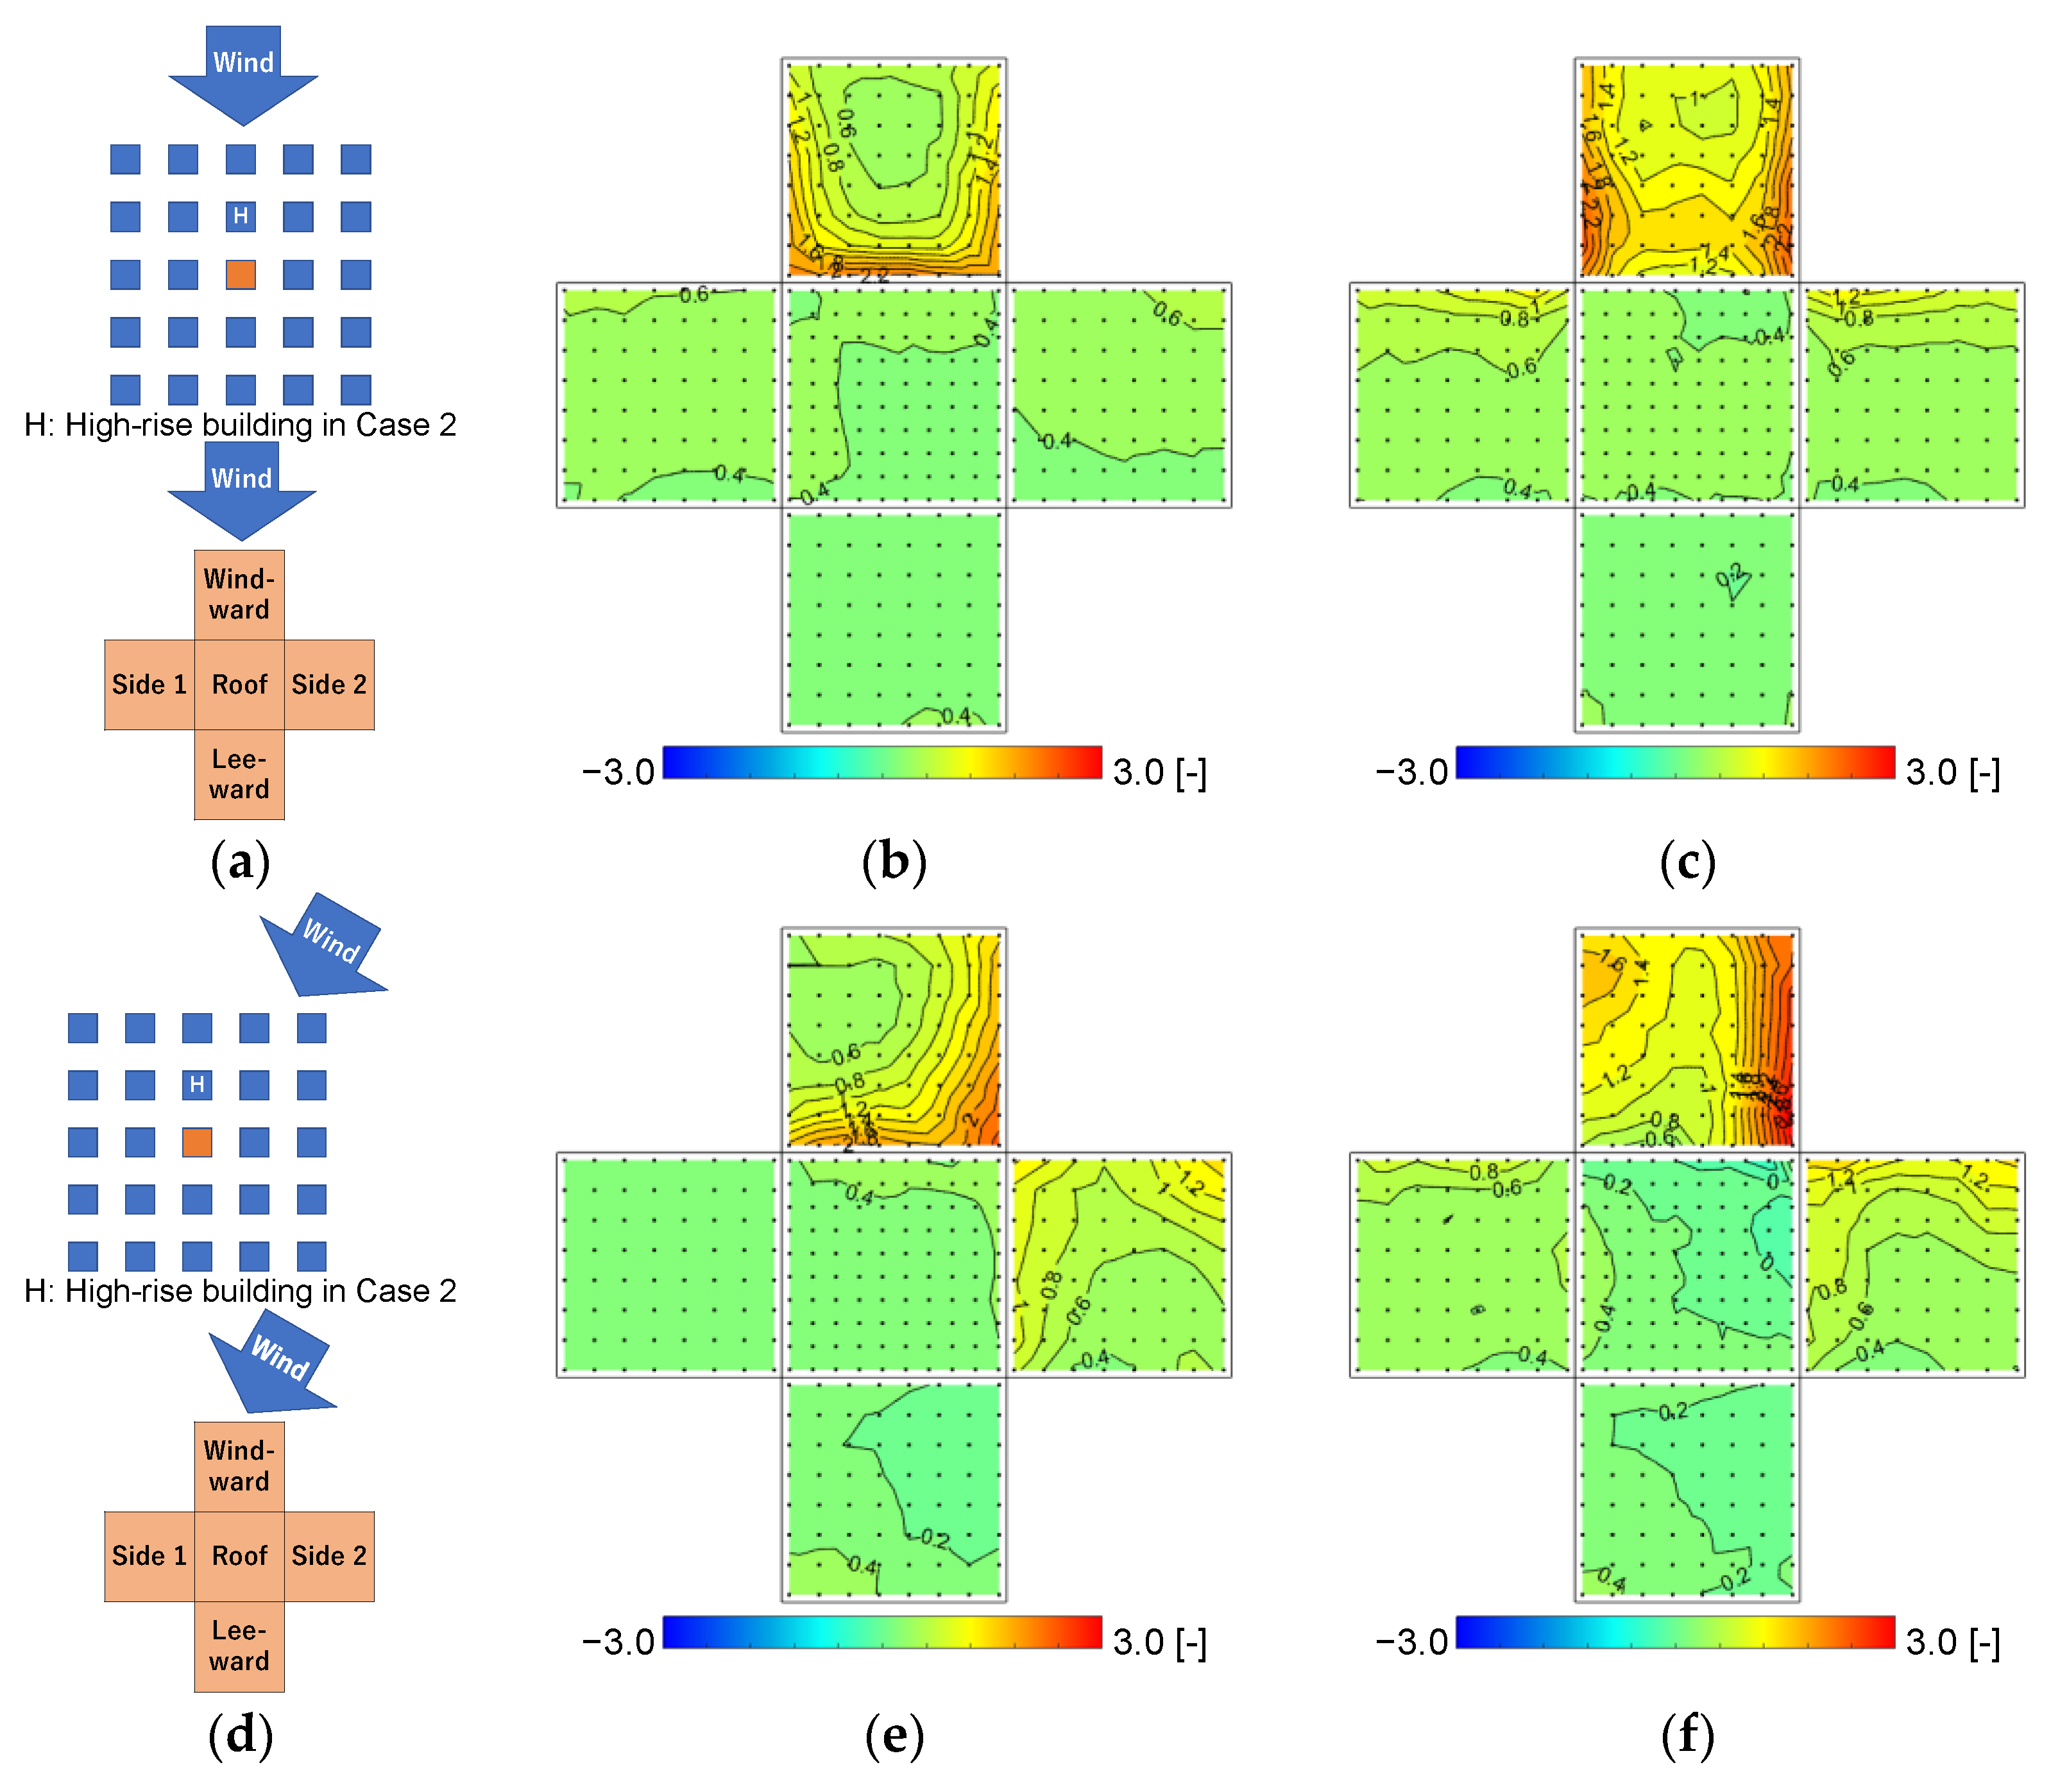
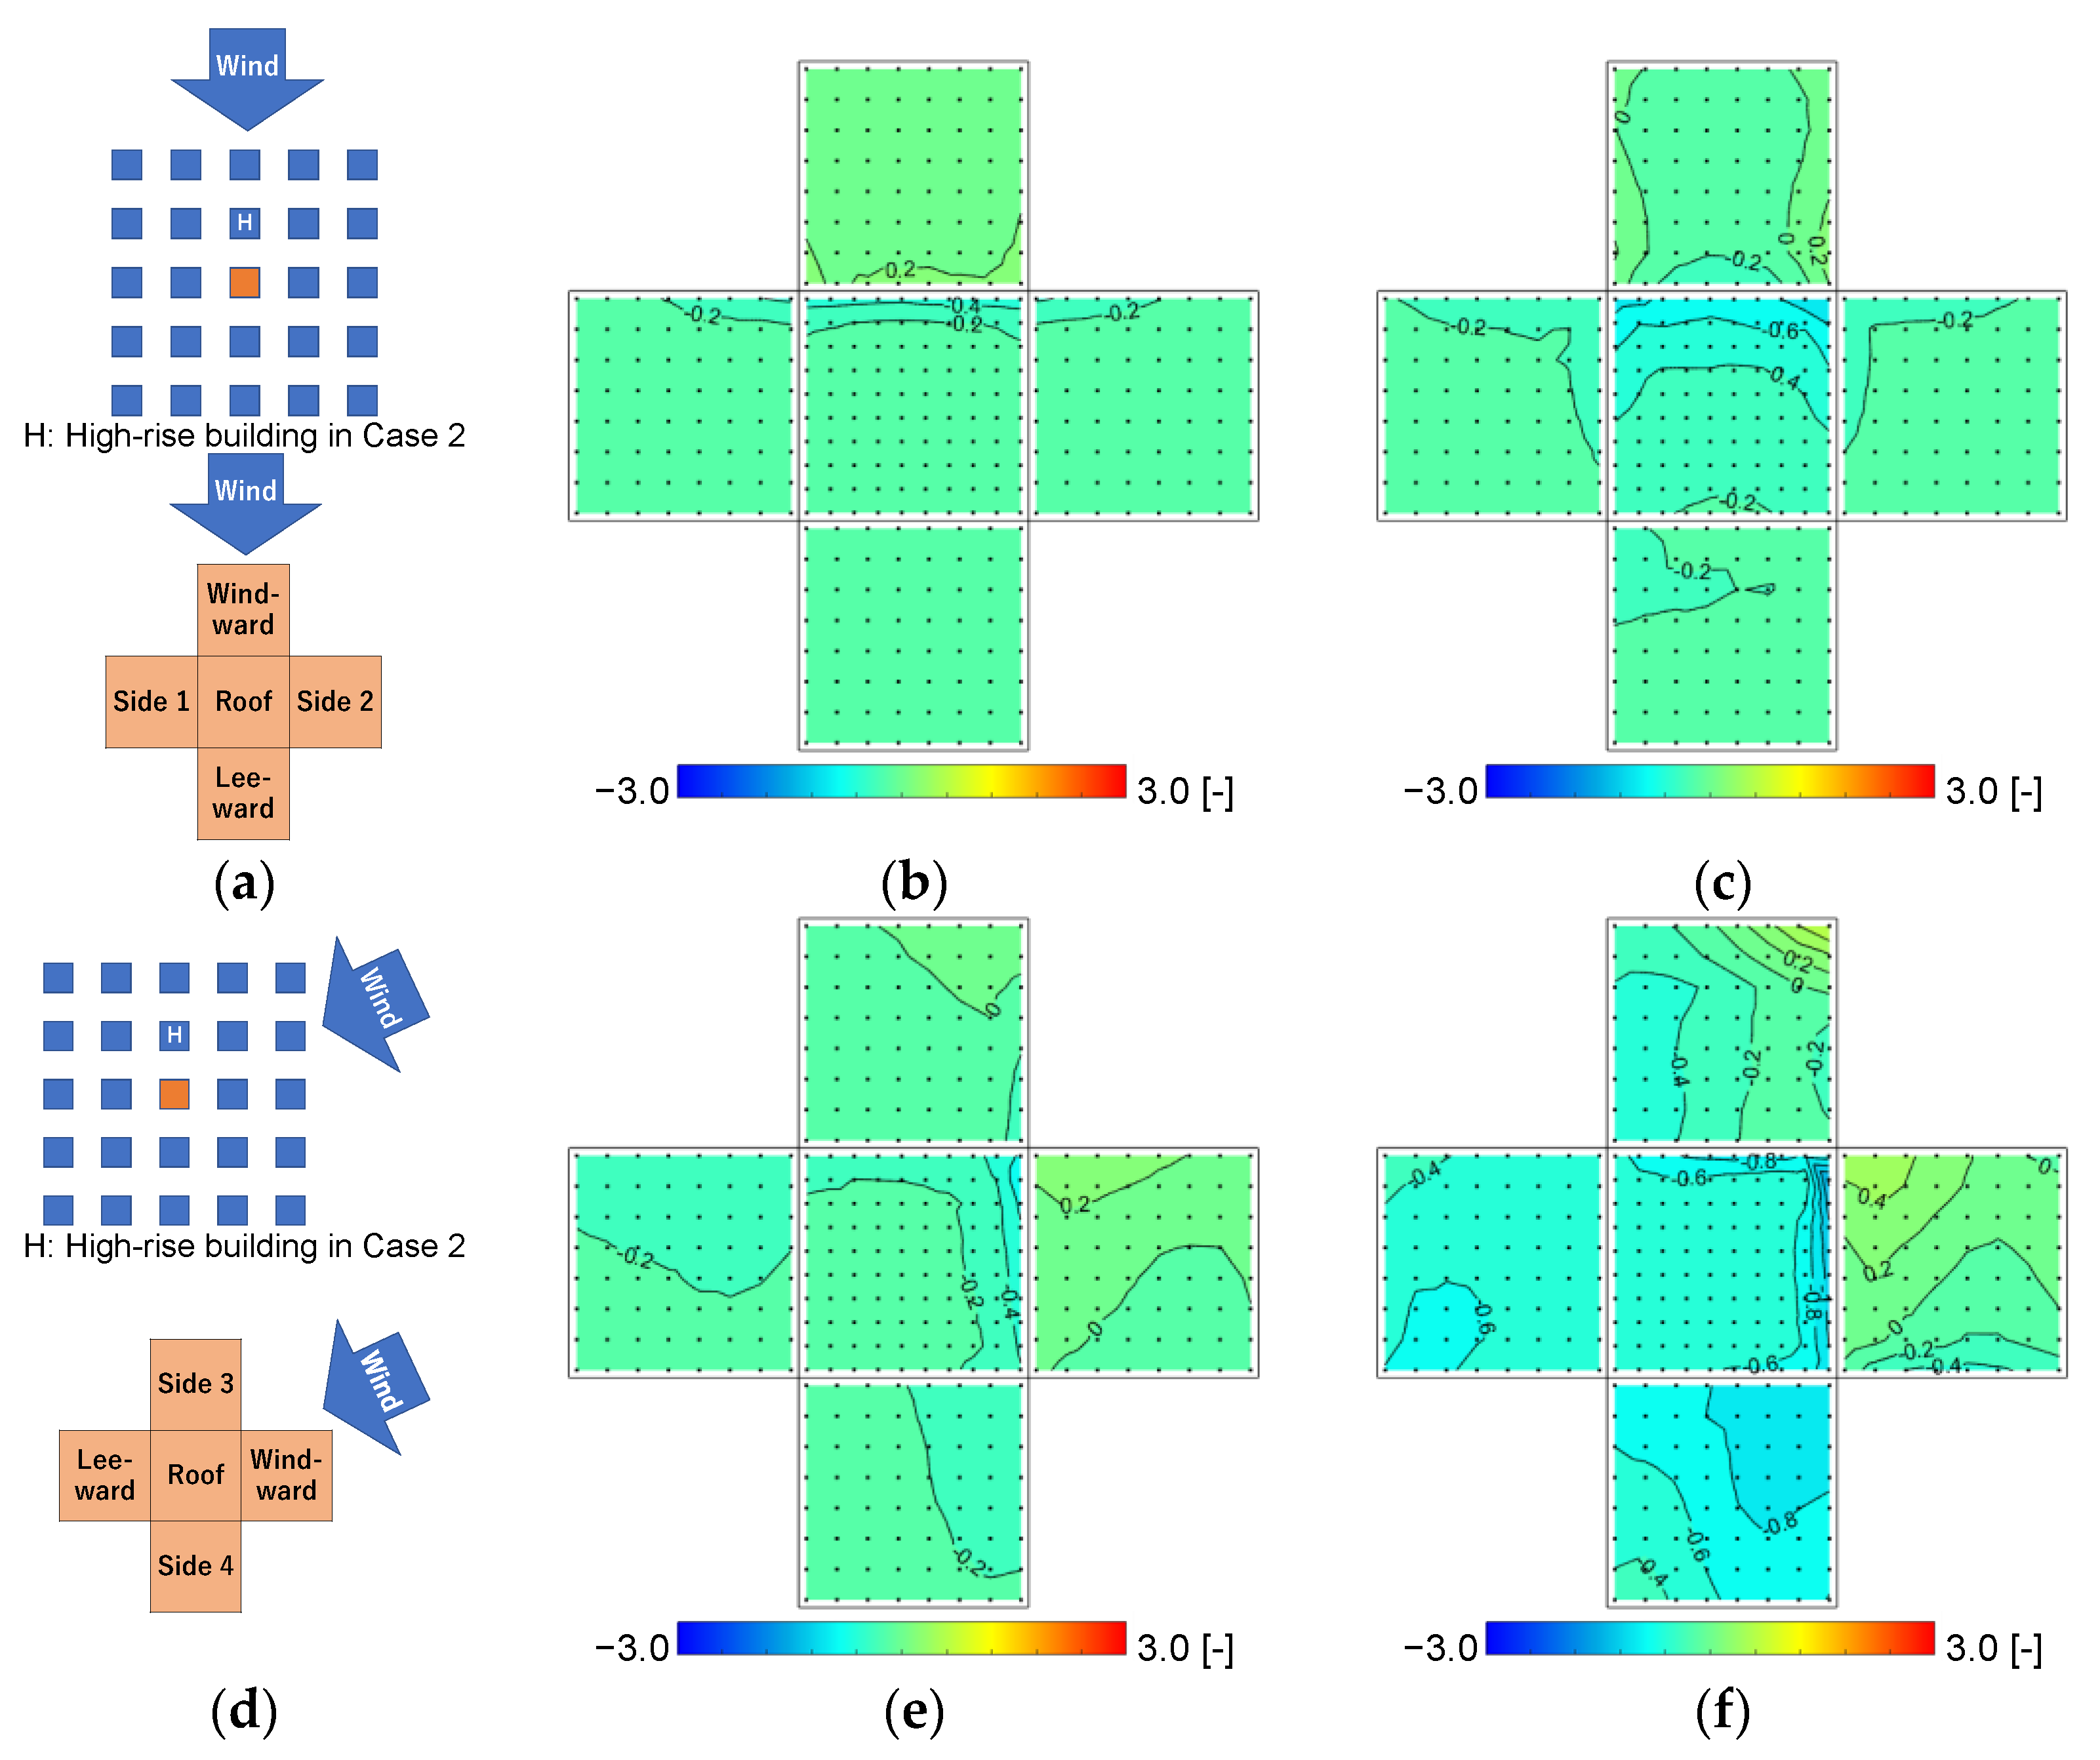
Figure 7 shows the results of the mean wind pressure coefficient, C p ¯ . Comparing the results of Case 0 and Case 2 for a 0° wind direction, the negative pressure on the windward side of the roof surface of the pressure measurement model in Case 0 was intensified in Case 2, and the maximum value in the roof surface was approximately doubled. In addition, the negative pressure areas on sides 1 and 2 and the leeward surfaces of the test model for wind pressure measurement expanded. On the windward surface, the positive pressure region changed from the edge closer to the roof surface in Case 0 to the edges closer to the side 1 and 2 surfaces in Case 2. Moreover, a weak negative pressure appeared on the edge closer to the roof surface. Comparing the results for wind directions of 0° and 30°, the negative pressure region changed in Case 0; however, the change was not substantial. By contrast, a strong negative pressure occurred locally at the windward corner of the roof surface in Case 2. In addition, a higher positive pressure with a value close to 1.0 [-] occurred near the upper windward corner of the windward surface. The downwash flow by the high-rise building impinging on the test model generated a strong separation flow. This may have resulted in the high negative pressure at the roof surface.
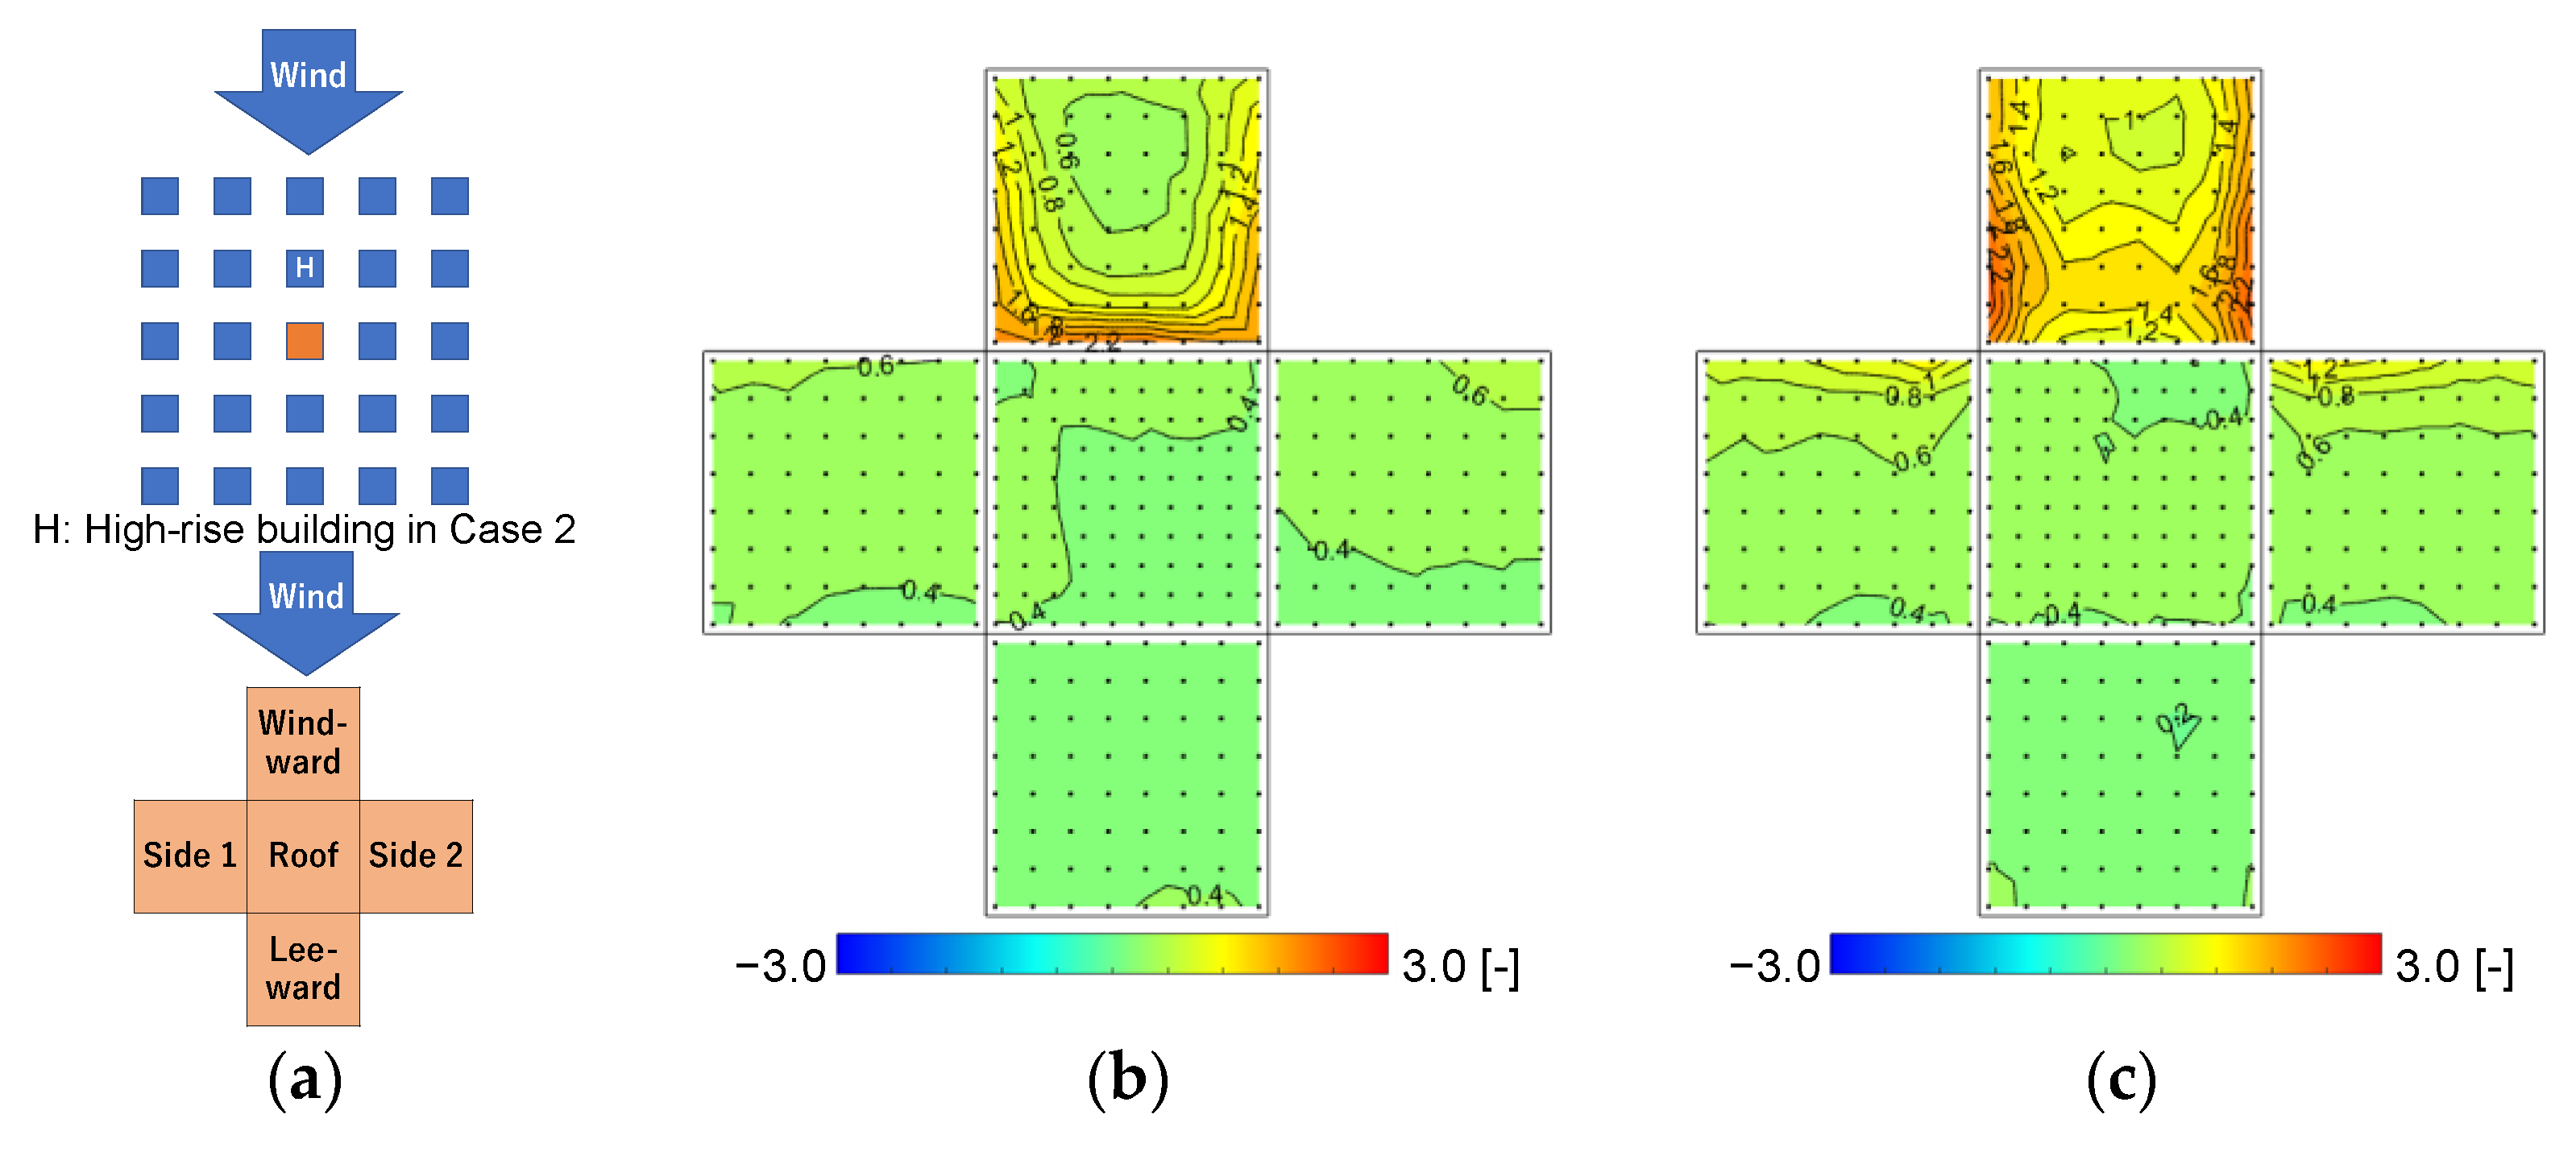
Figure 8 shows the distributions of the positive p e a k C p (spatial distributions of the positive p e a k C p at each tap). Comparing the results for the 0° and 30° wind directions in Case 0, on the windward surface, the higher-value region close to the roof surface and the upper side of the side 1 and 2 surfaces shifted toward the side 2 surface, the direction from which the wind was blowing at a 30° angle. The maximum values of the surfaces changed only slightly. Comparing Case 0 and Case 2 with a 0° wind direction, the value in the region close to the roof surface on the windward surface in Case 2 was smaller than that in Case 0, and higher values in Case 2 occurred close to the side 1 and 2 surfaces. In Case 2, it was assumed that the positive pressure caused by the incoming wind impinging on the area closer to the roof surface of the windward surface of the test model was weakened by the blocking effect of the high-rise building at the windward side of the test model. It was also assumed that the downwash flow caused by the high-rise building entered the leeward side of the high-rise building, resulting in higher values when the flow impinged on the windward surface closer to side 1 and side 2. The maximum values on the windward surfaces were 2.2 [-]. Although the positive pressure action region changed, the maximum values changed only slightly. Comparing the wind directions of 0° and 30° in Case 2, it was observed that the trend for the area with high values on the windward surface moved toward side 2, where the direction from which the wind was blowing was the same as that in Case 0. However, under the 30° wind direction condition, the maximum value on the surface increased approximately 1.4 times from 2.4 [-] in Case 0 to 3.2 [-] in Case 2. This was presumably owing to the downwash flow generated by the high-rise building acting directly on the pressure measurement model.
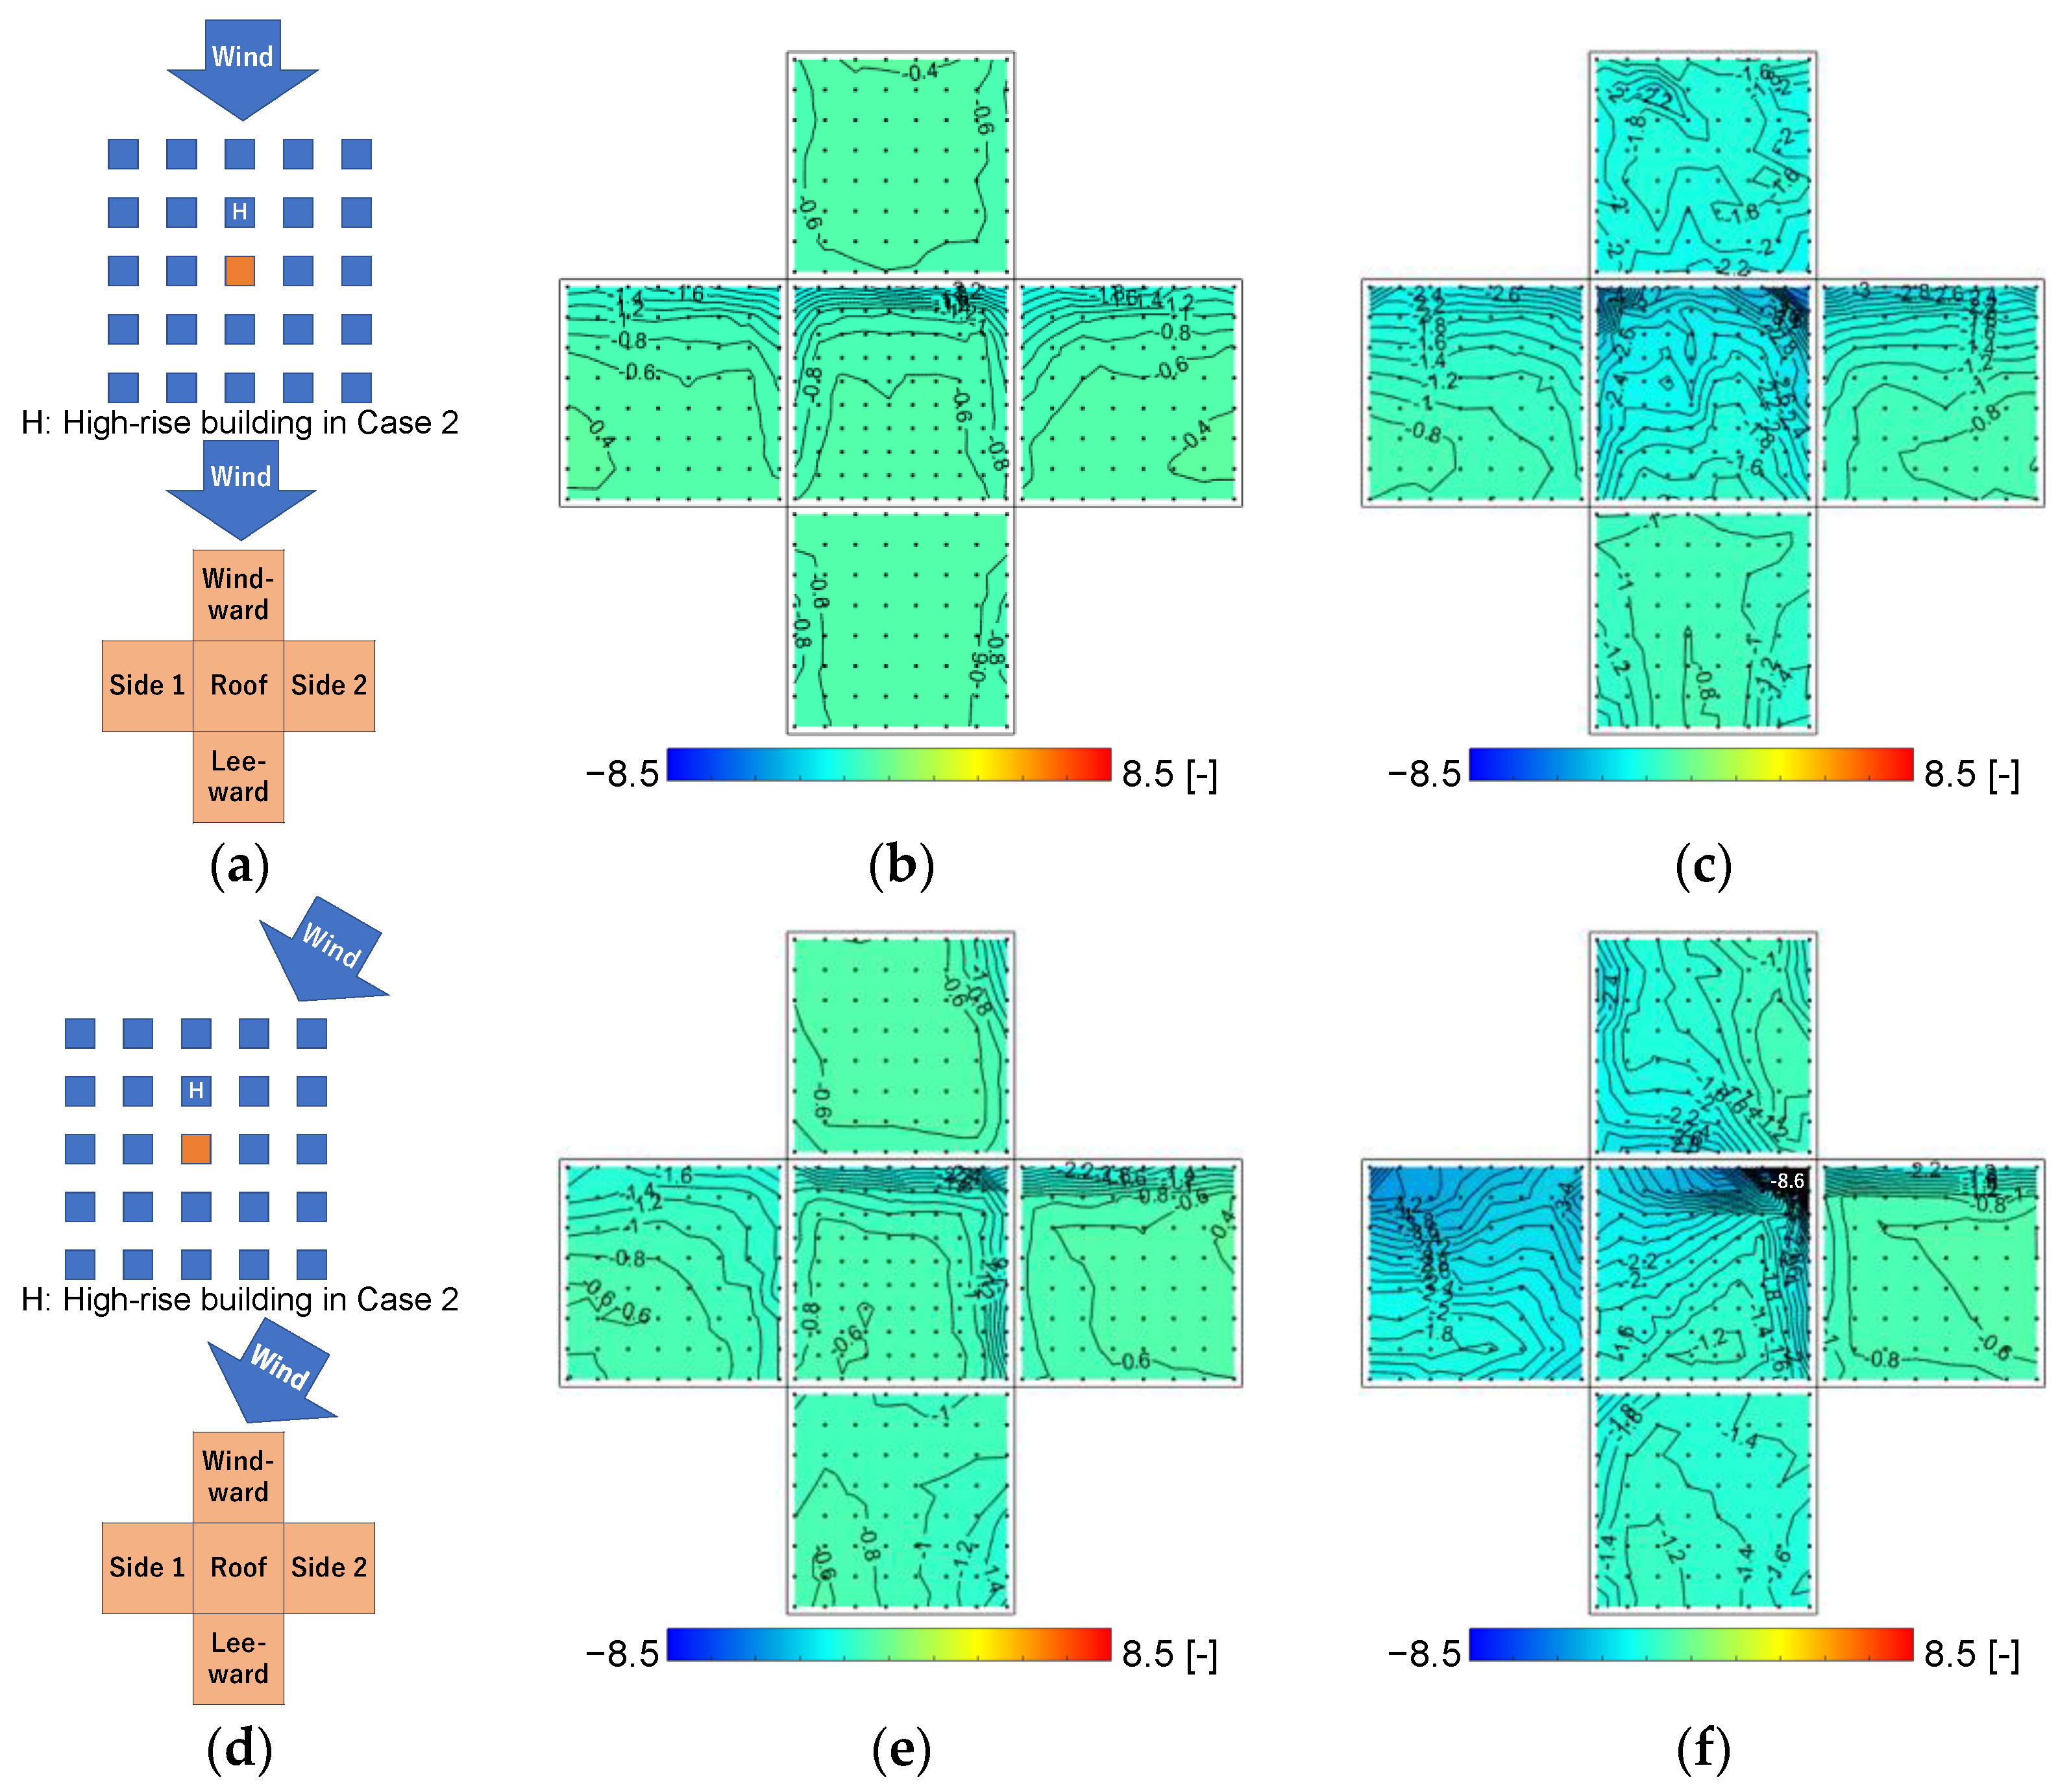
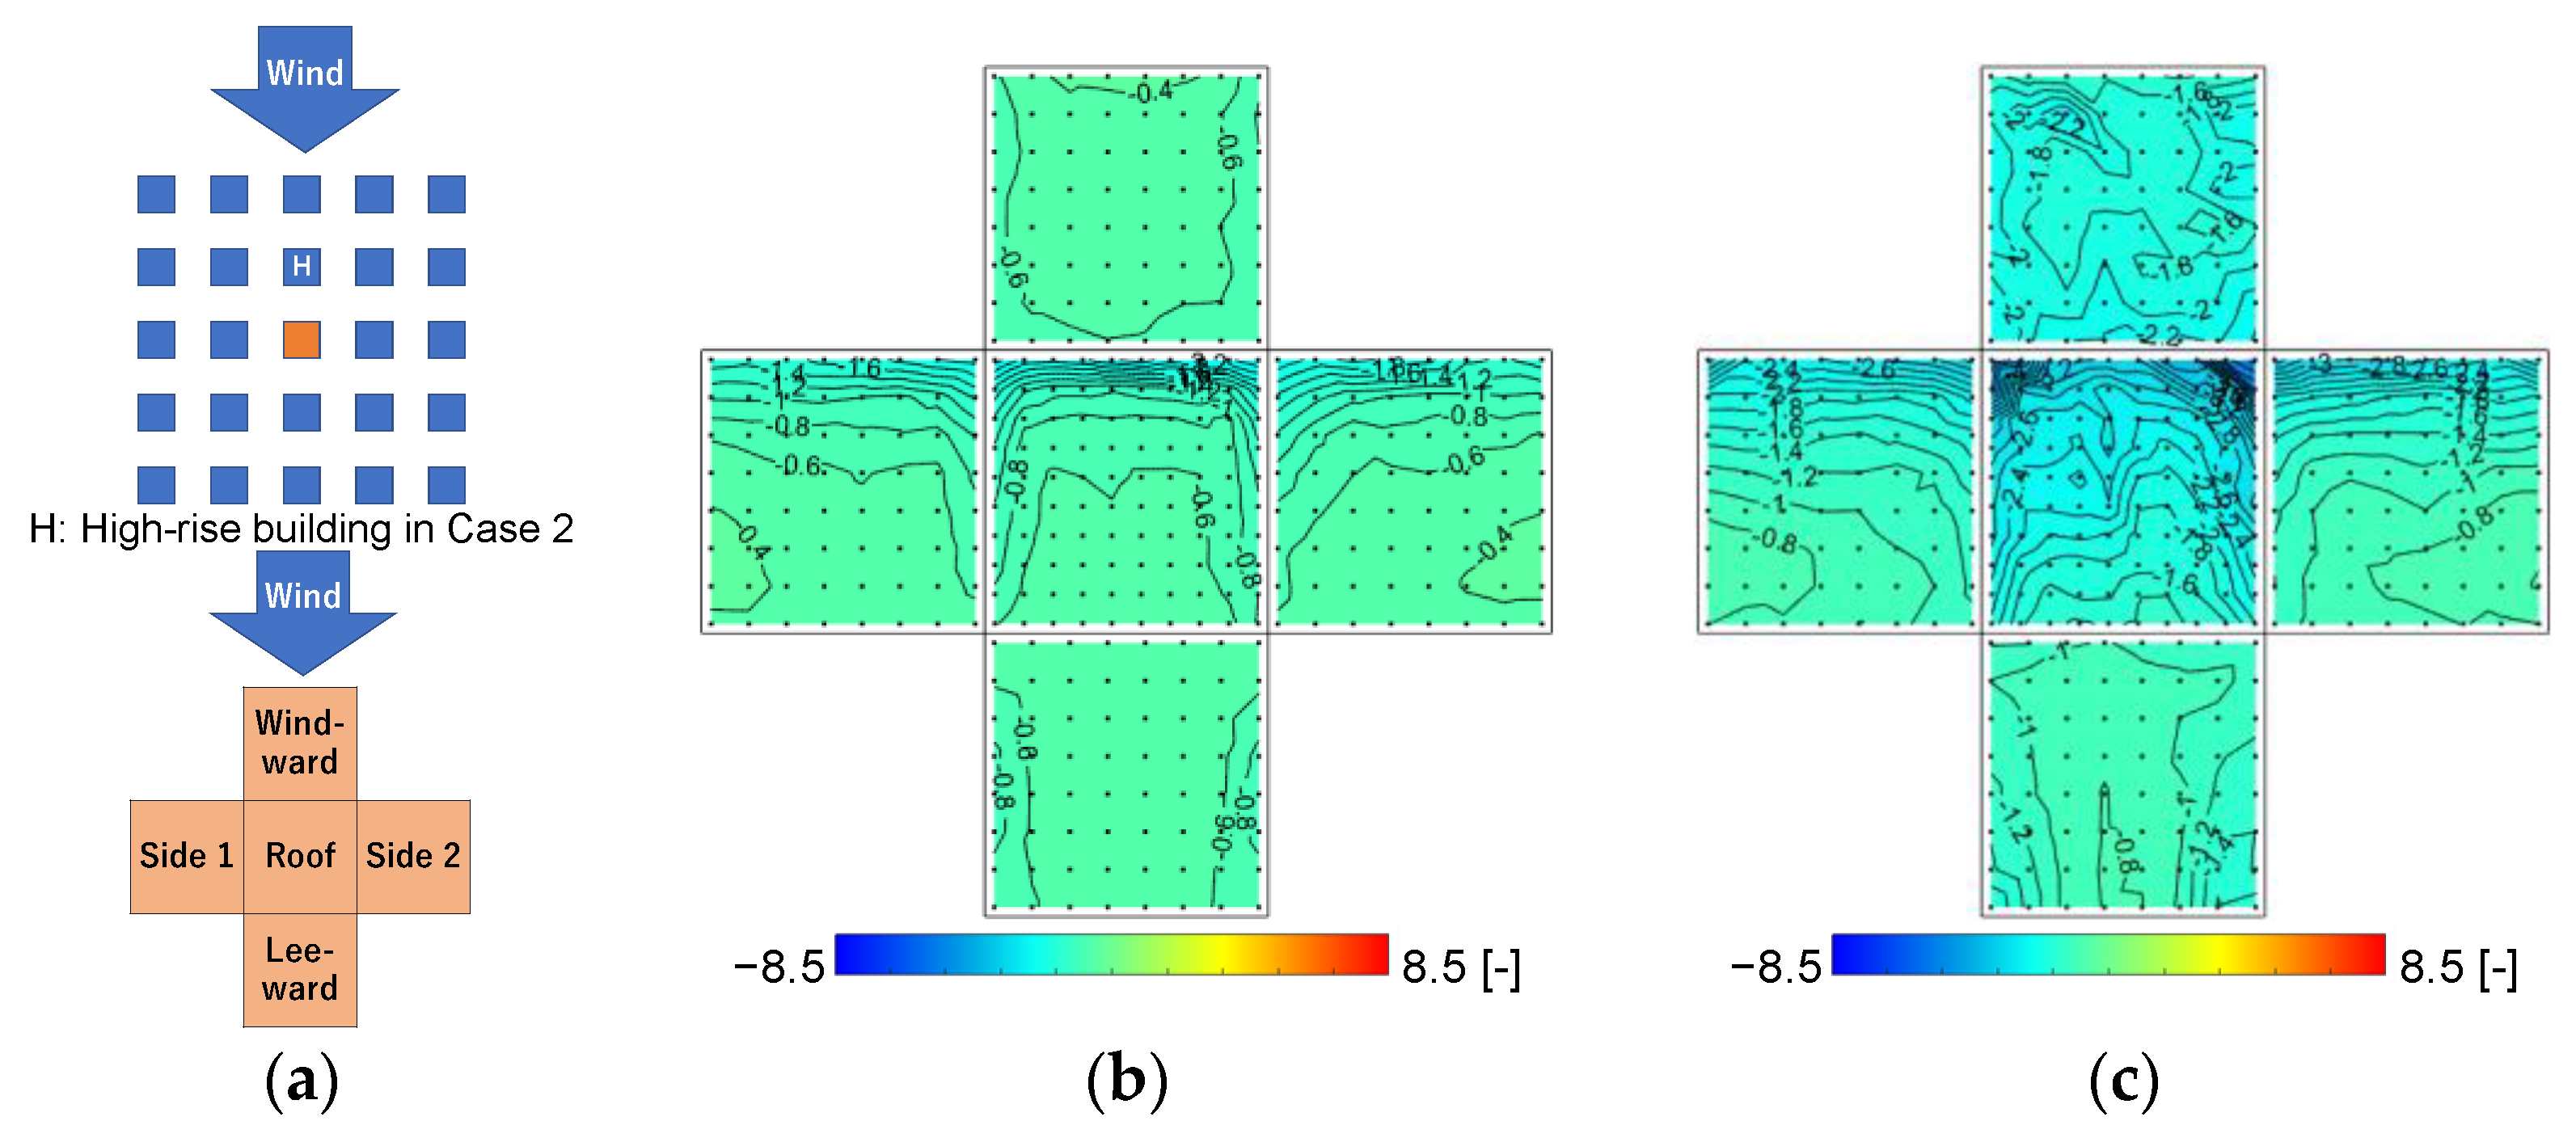
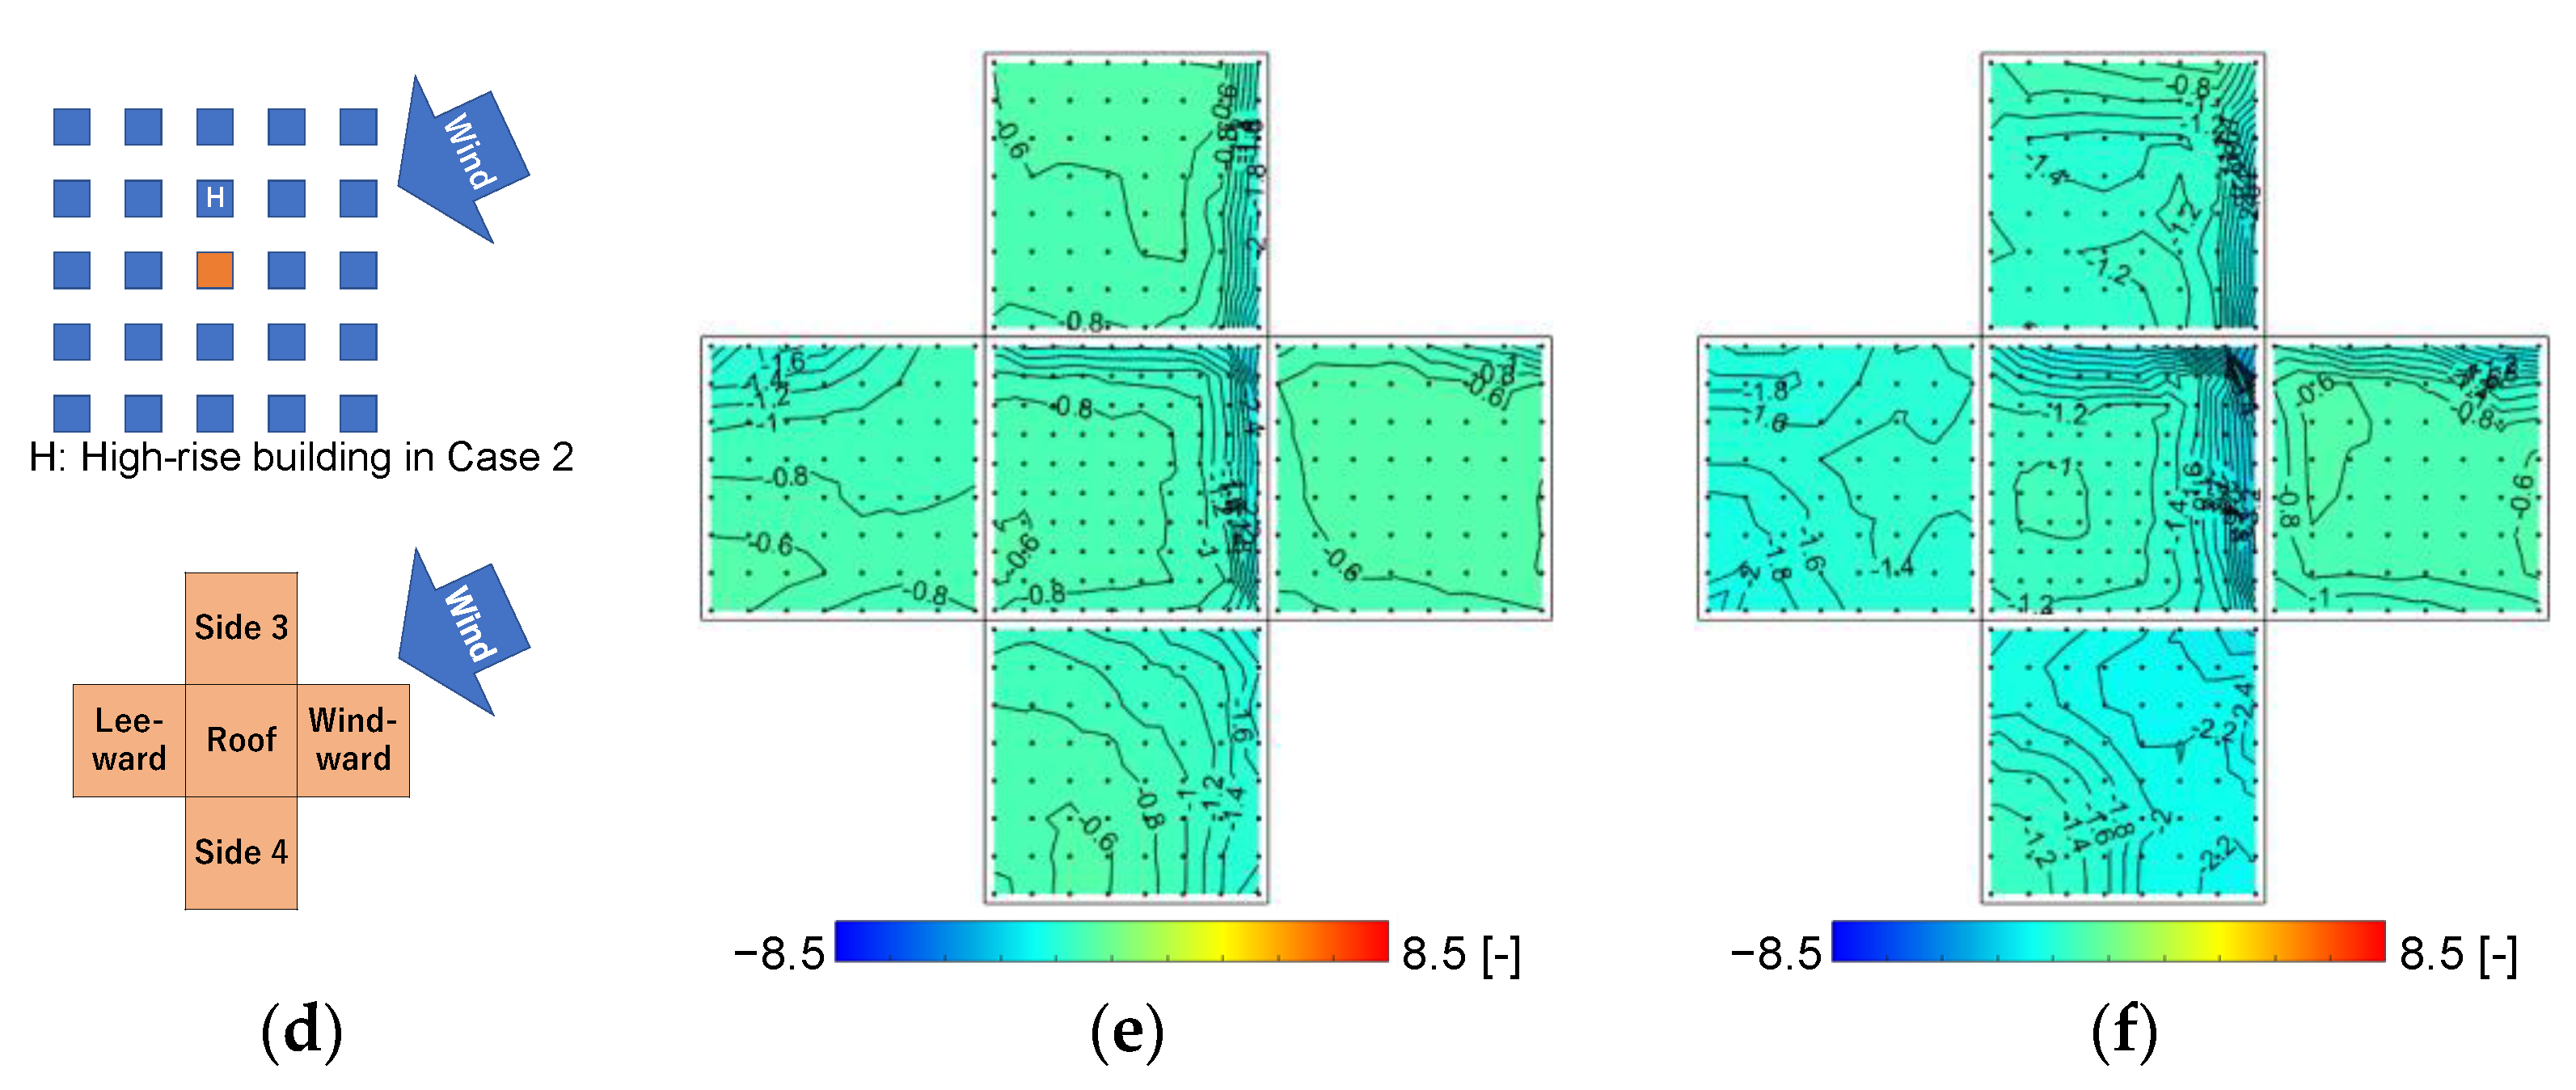
Figure 9 shows the distributions of the negative p e a k C p (spatial distributions of the negative p e a k C p value at each tap). As shown in the figures comparing the influence of wind direction in Case 0, at a 0° wind direction, relatively large negative pressures of approximately −2.2 [-] on the roof surface and −1.6 [-] and −1.8 [-] on side 1 and side 2 occurred. In both wind directions, high absolute values were observed along the windward edge lines. As with the positive p e a k C p distributions, the absolute values changed little in both wind directions. At a 0° wind direction in Case 2, all surfaces had negative pressures of approximately 1.5 to 3 times those of Case 0. A locally strong negative p e a k C p was observed at the windward corner of the roof surface with values of approximately −4.0 [-]. Comparing Case 0 and Case 2 with a 30° wind direction, it was observed that the high-rise building caused a strong negative p e a k C p of −8.6 [-] locally at the windward corner of the roof surface, with a value approximately three times larger than that in Case 0. This might be because of the downwash flow caused by the high-rise building impinging on the pressure measurement model and the strong separation at the roof surface. In addition, a high-value area of approximately −4.2 [-] was also observed near the windward side of the ground surface on side 1.
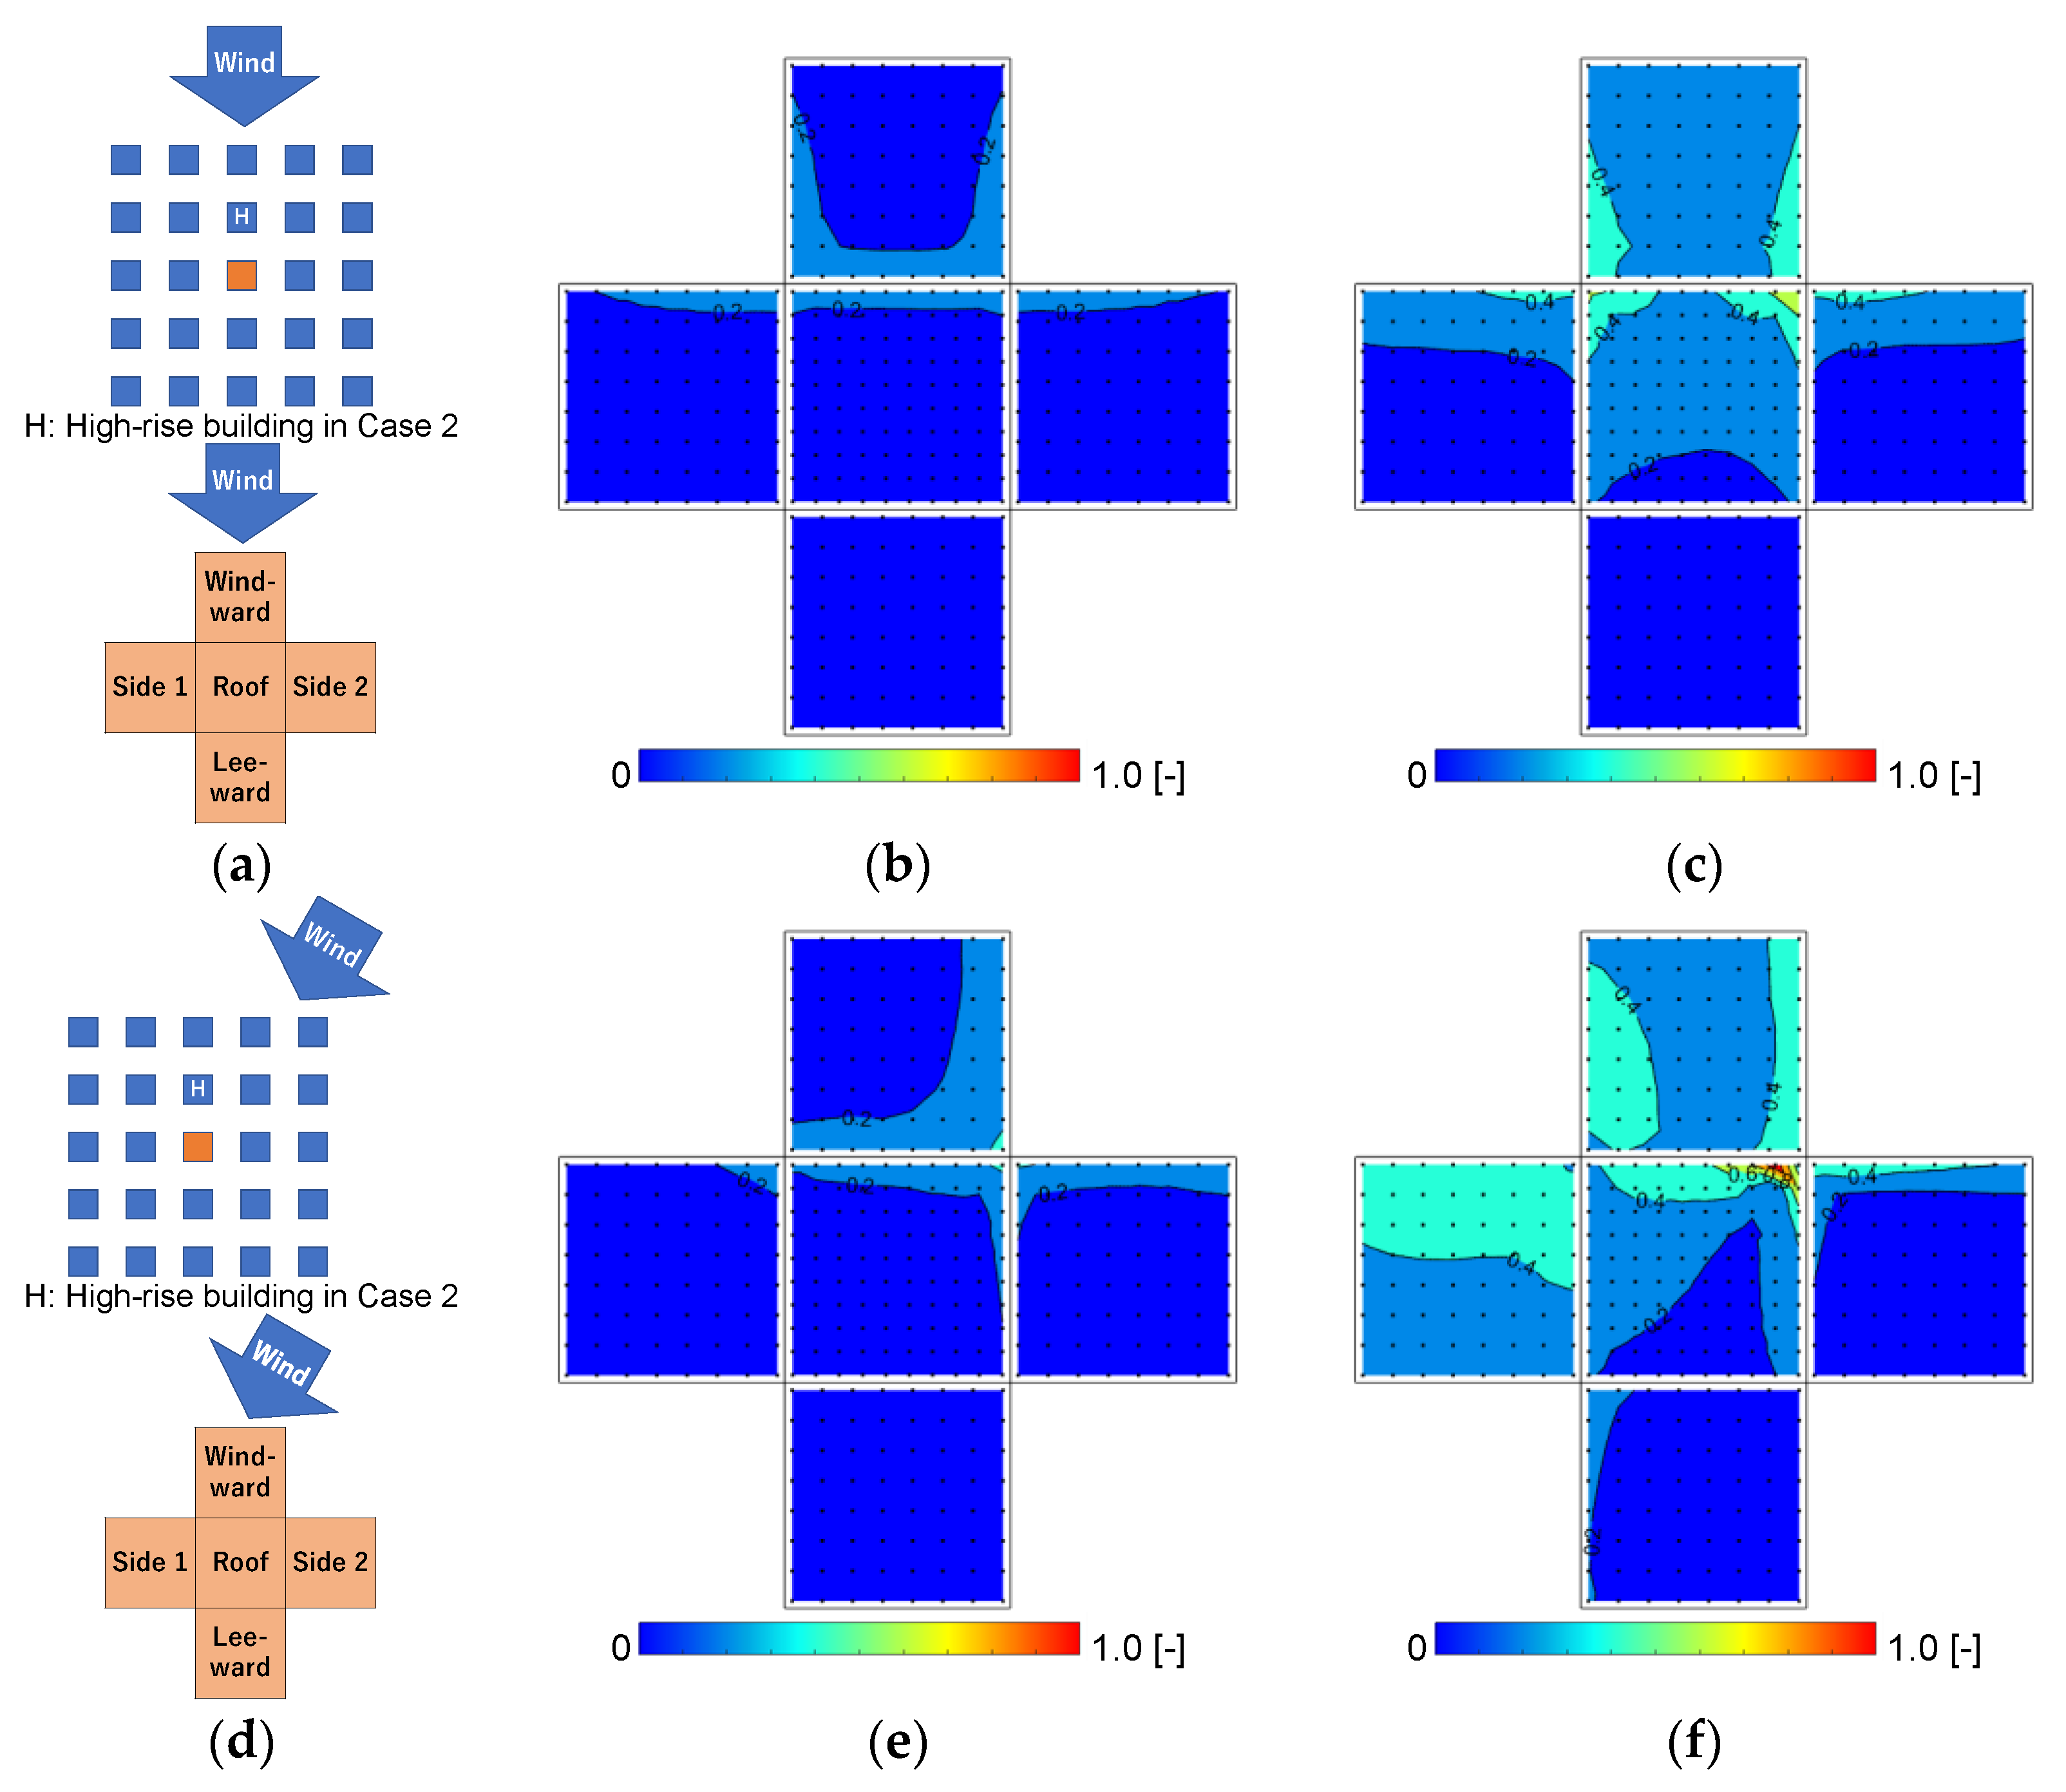
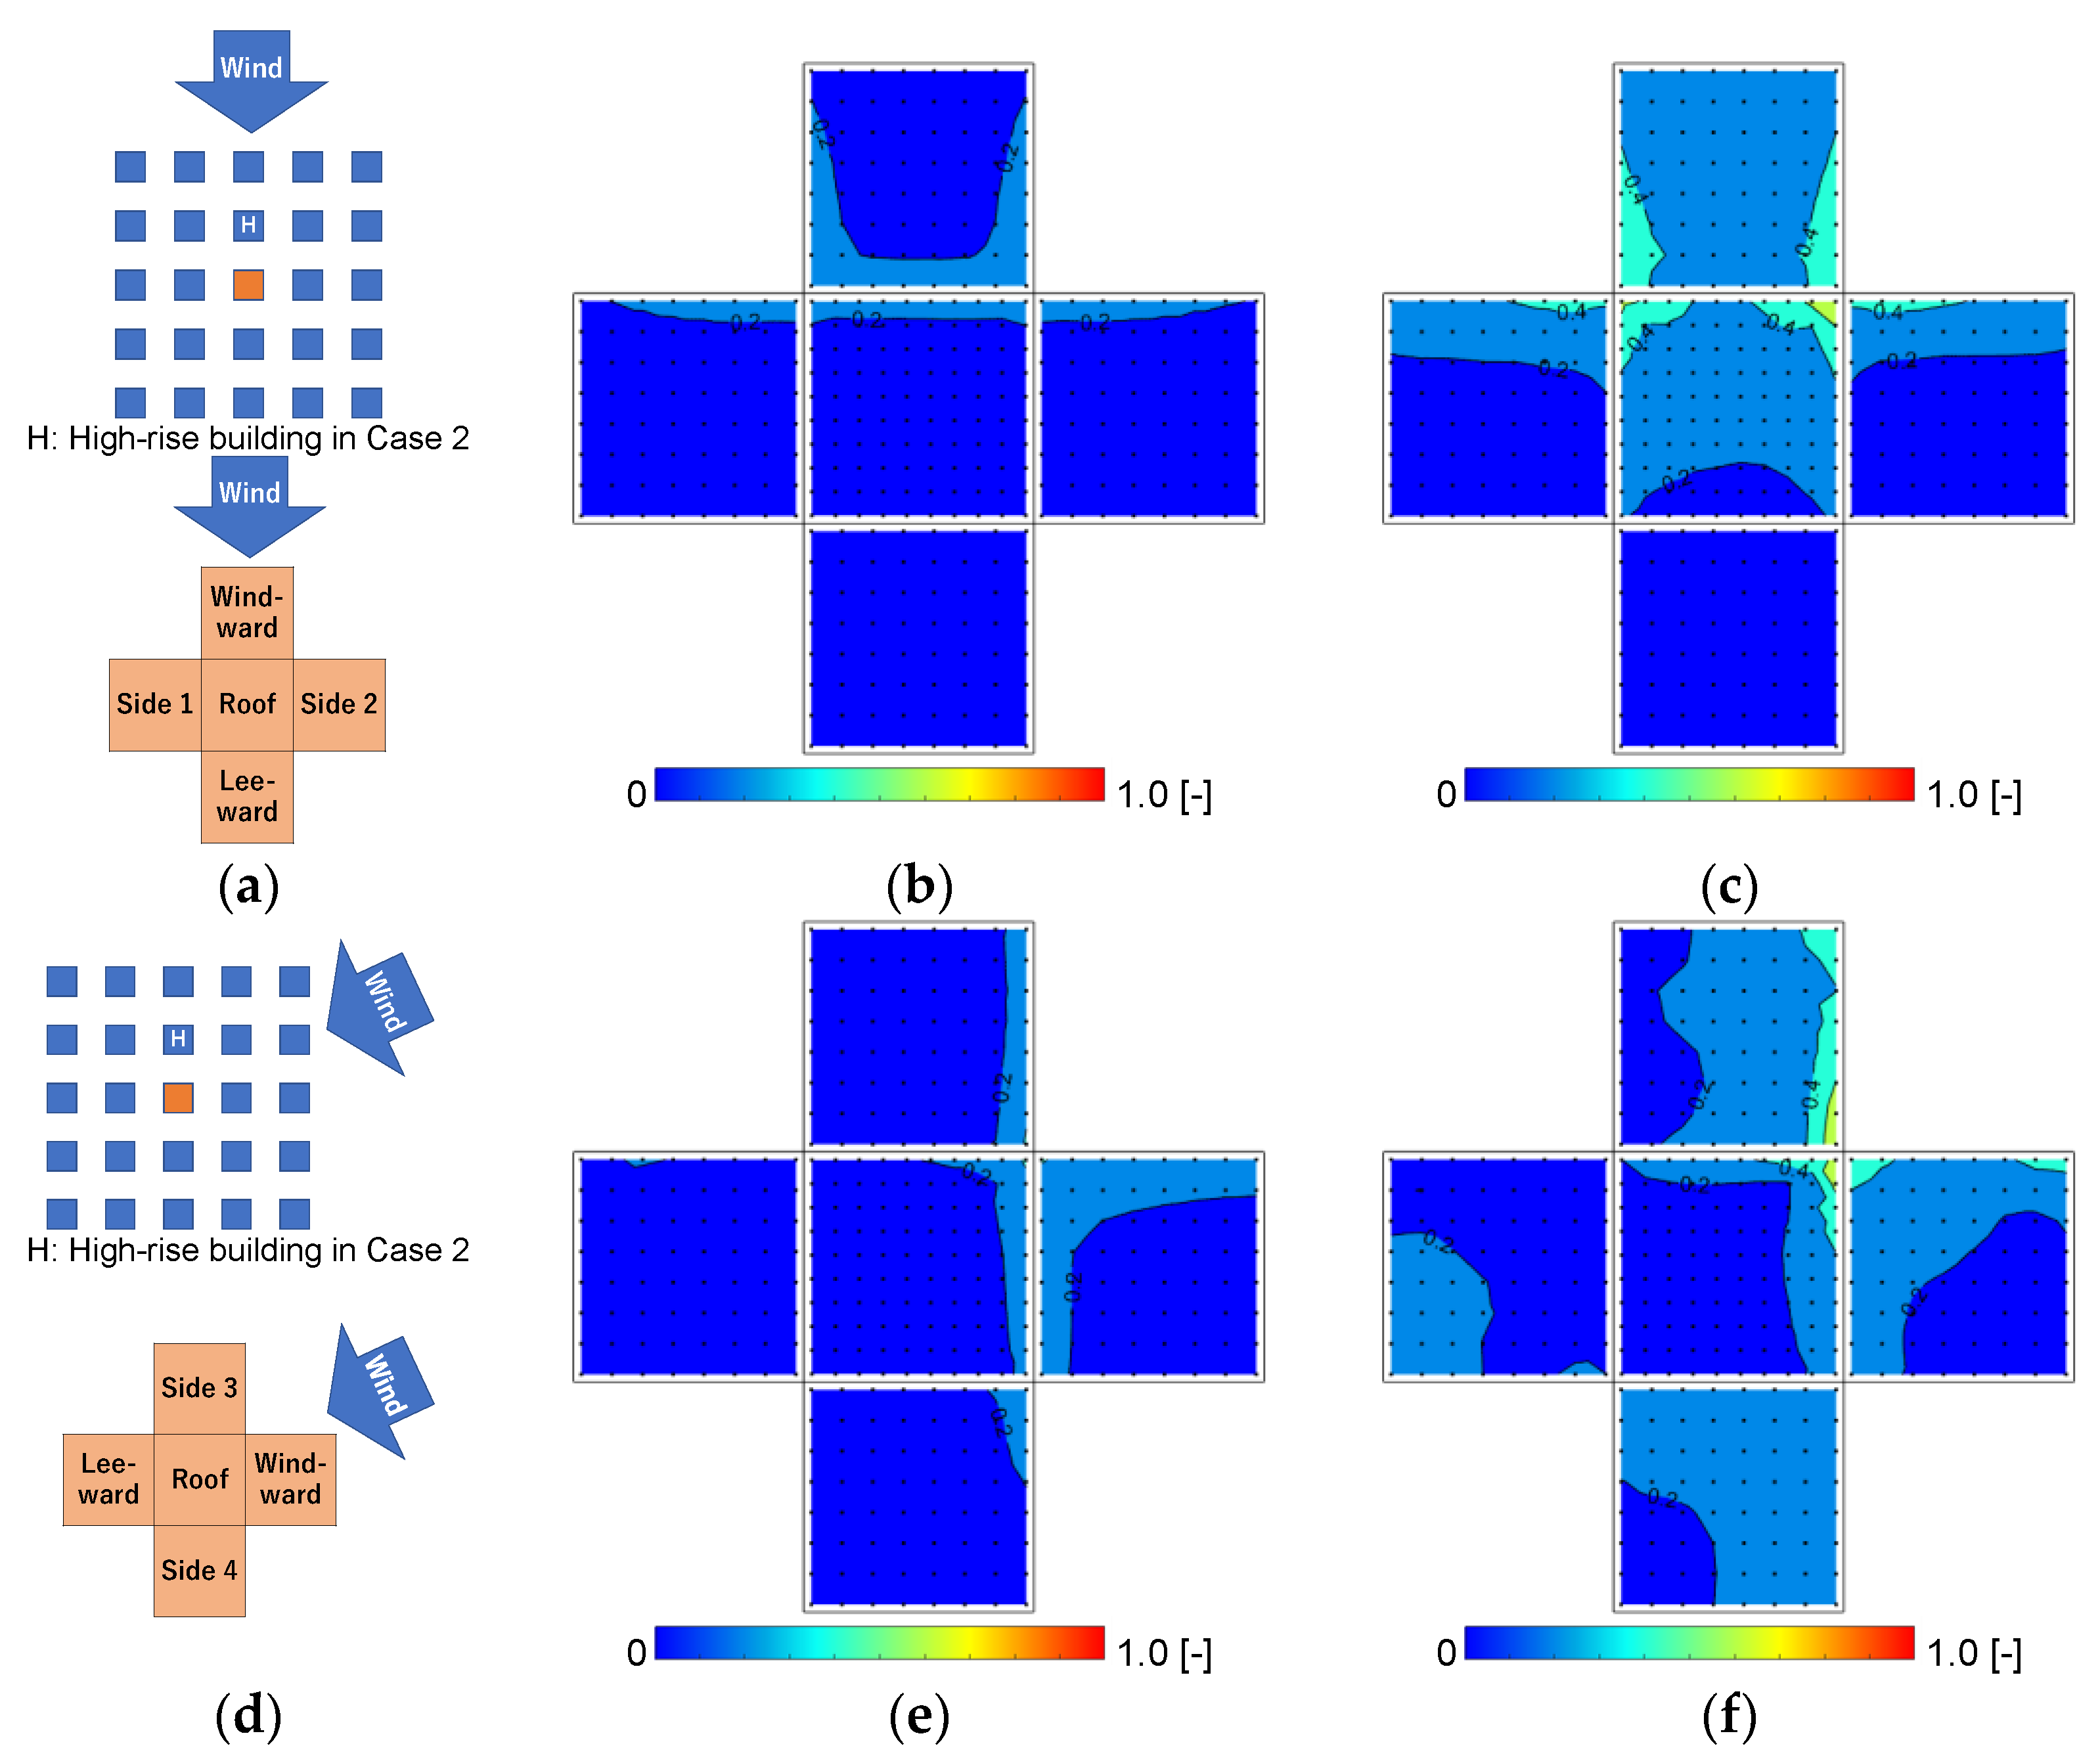
Figure 10 shows the distributions of the fluctuating pressure coefficient, C p . The values were small for both the 0° and 30° wind directions in Case 0. The values were relatively high in the region with a high mean wind pressure coefficient, C p ¯ , as shown in Figure 7. The region with relatively high values in Case 2 was similar to that in Case 0, but the values were higher. In particular, at a 30° wind direction, the value at the windward corner of the roof surface, where a large negative p e a k   C p occurred (Figure 9), was high compared with that in the other conditions, close to 1.0 [-]. This indicates large fluctuations in the values. The values in the region where high positive p e a k C p values were identified in Figure 8 were approximately 0.4 [-], smaller than the values at the windward corners of the roof surface.
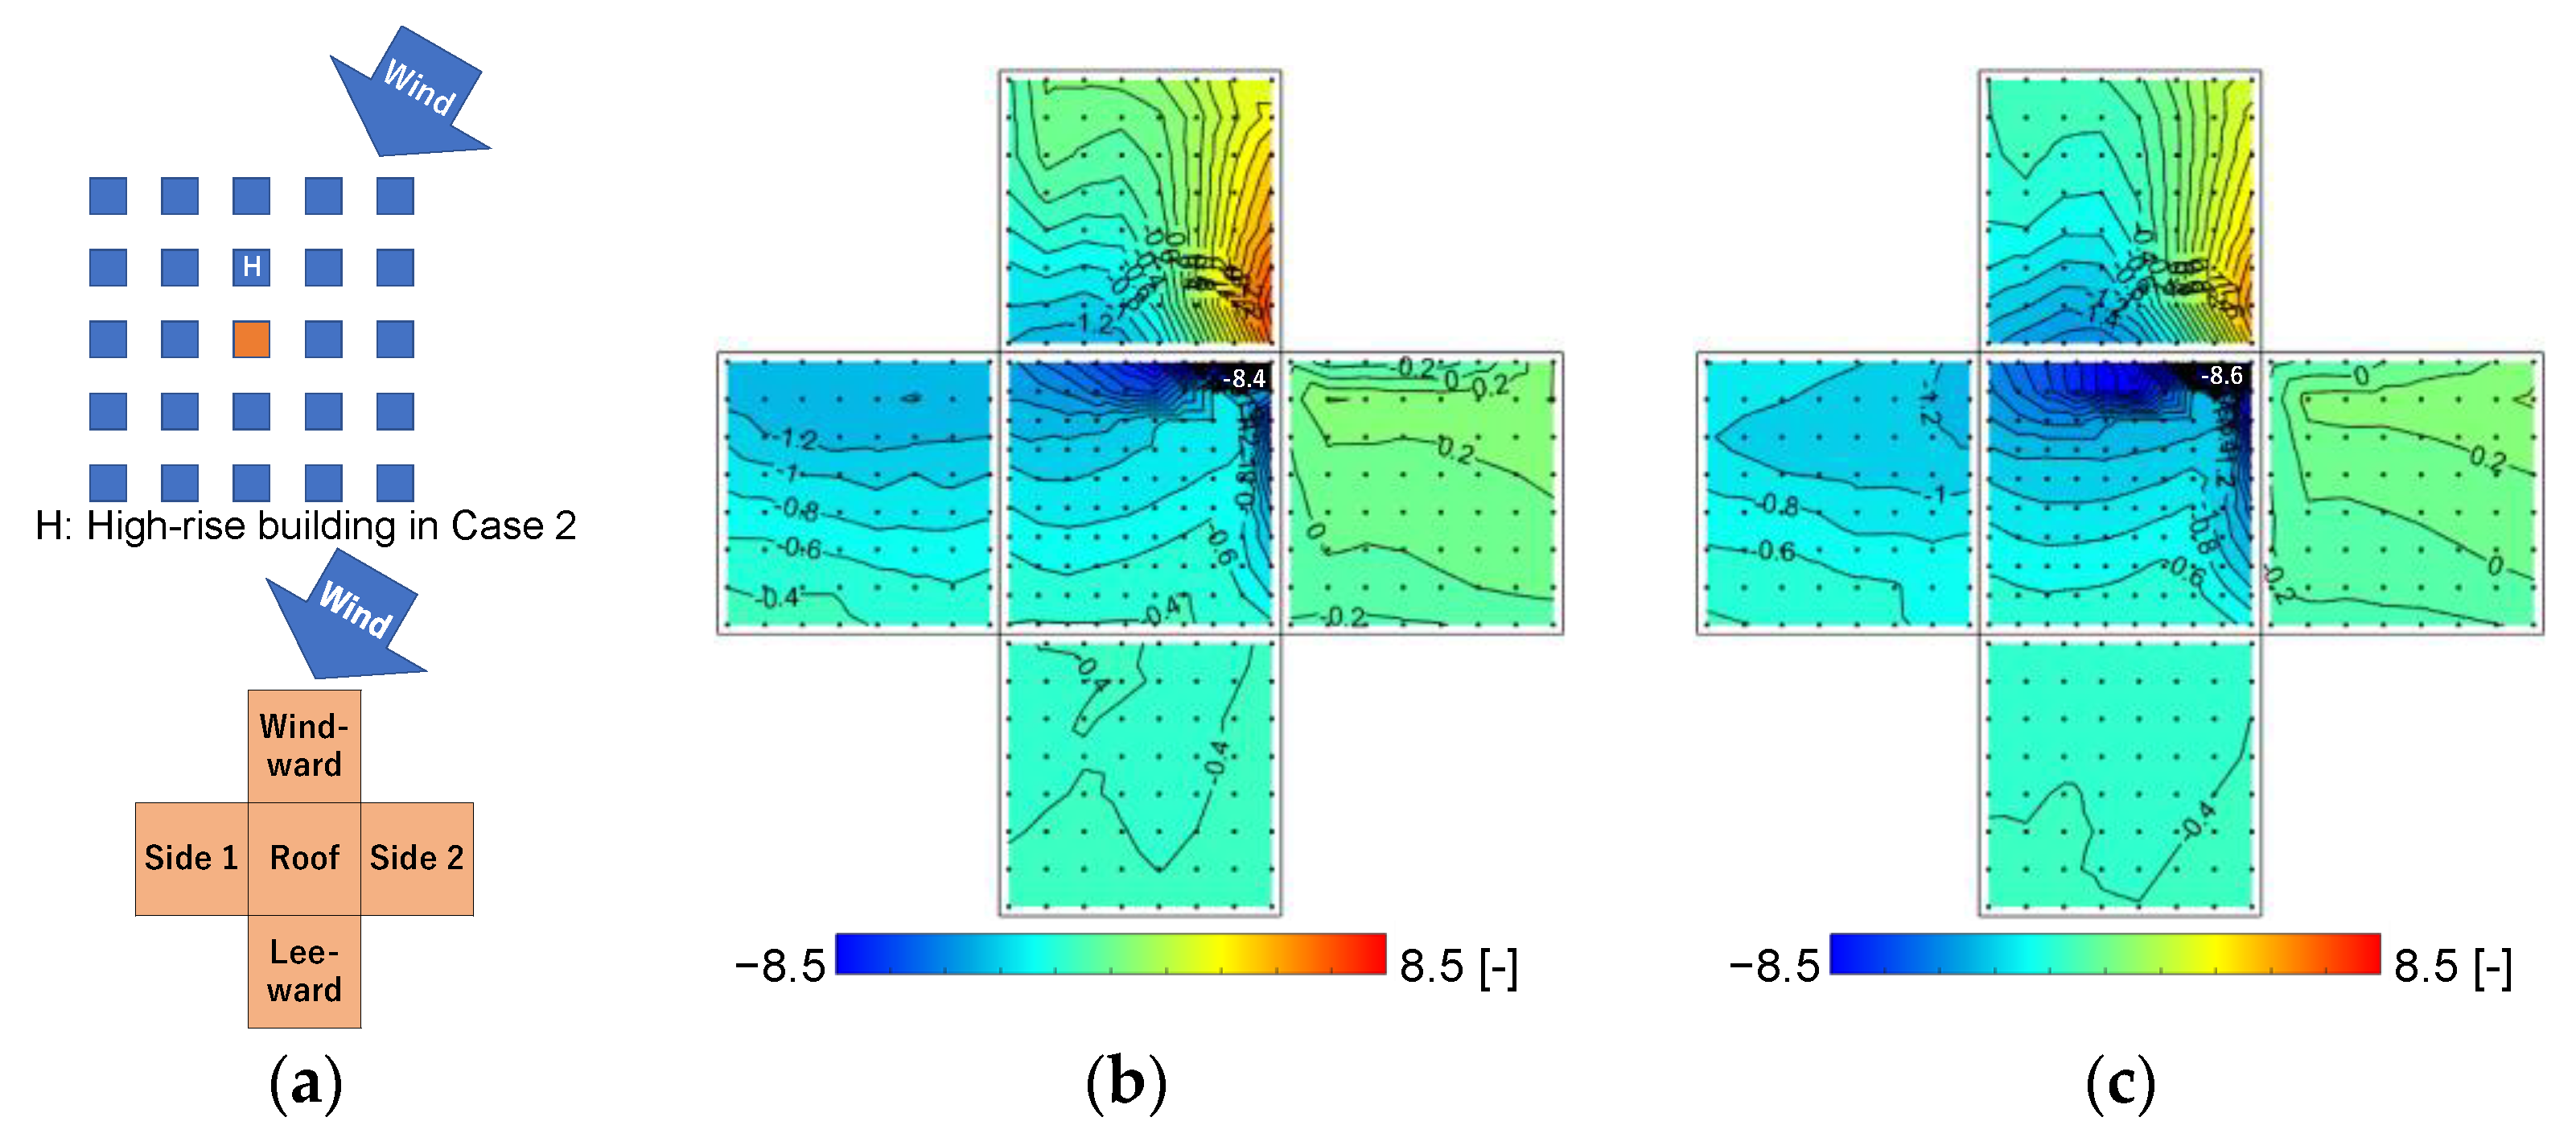
The distributions of the wind pressure coefficients when the maximum and minimum p e a k C p occurred among all taps were obtained for all 10 samples. Figure 11 shows the ensemble-averaged results. Figure 11 confirms that when the maximum negative p e a k C p occurred at the windward corner of the roof surface, the positive p e a k C p on the windward surface had a high value simultaneously.

3.3.2. Wind Pressure Coefficients at a 65° Wind Direction in Case 0 and Case 2

This subsection presents the surface distributions of the wind pressure coefficients for Case 0 and Case 2, where the positive p e a k C p was large for a 65° wind direction in Case 2. Note that the results for wind direction 0° show the same figure as in Section 3.3.1. Regarding the notation of each surface of the pressure measurement model in this section, the windward surface under the 65° wind condition corresponds to the position of the side 2 surface with a 0° wind direction; thus, the position of the windward surface changed under the 65° wind direction condition, as shown in (d) of each figure in this section. The new surfaces, referred to as side 3 and side 4, were established for the 65° wind direction condition. Note that the positions of the windward and leeward surfaces and surface names differ for the 0° and 65° wind directions.
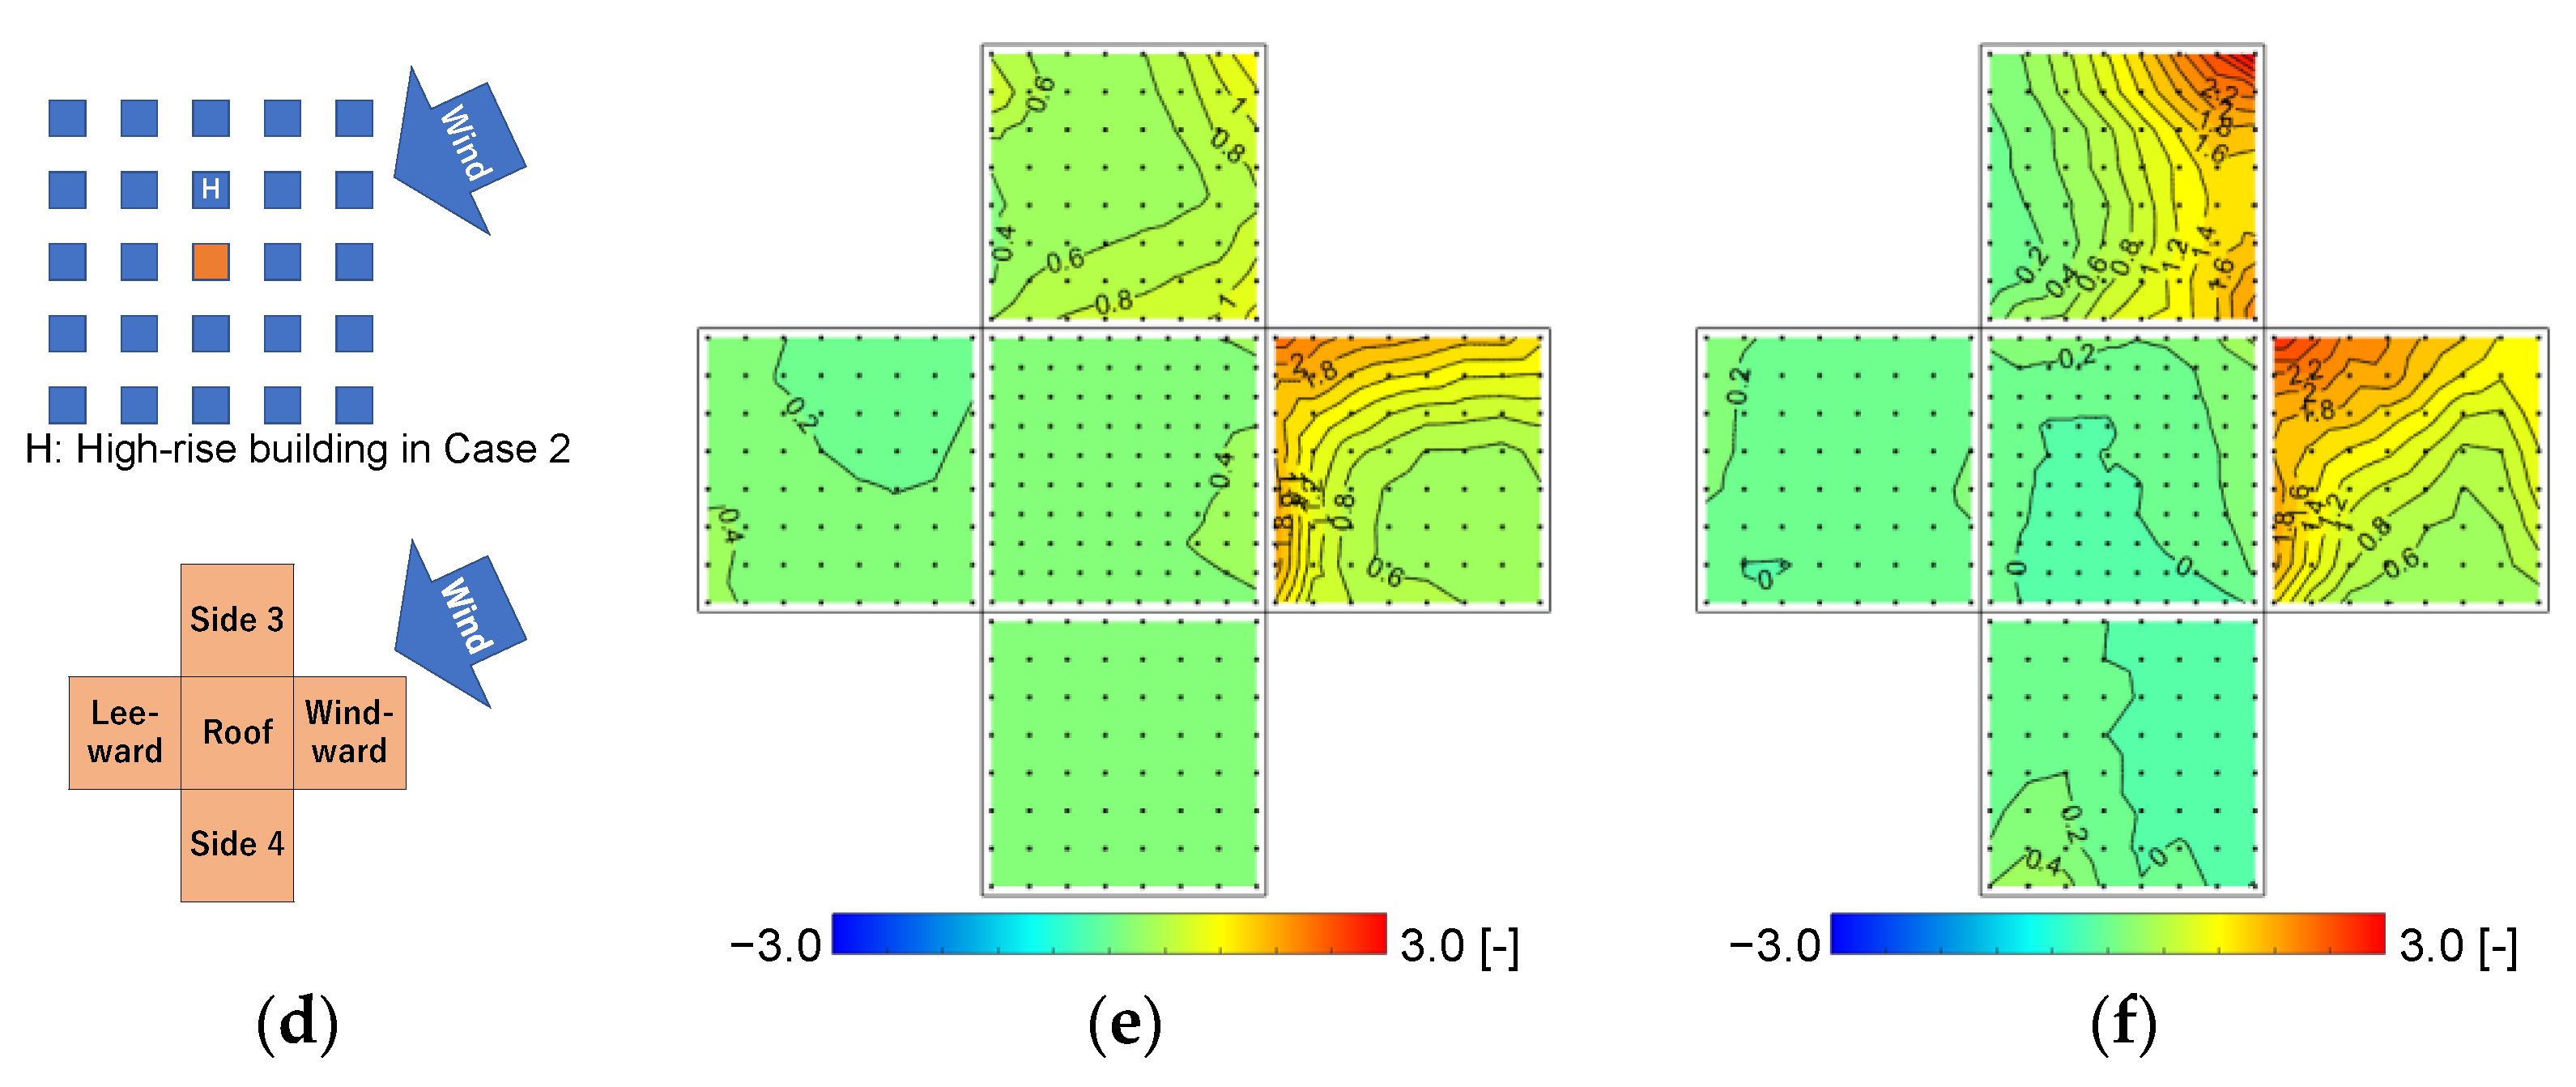
Figure 12 shows the results of the mean wind pressure coefficient C p ¯ . According to the results for Case 0 with a 65° wind direction, similar to the results with a 30° wind direction (Figure 7 in Section 3.3.1), the negative pressure region on the roof surface occurred in the direction from which the wind blew, and a positive pressure region was generated on the windward side wall. Moreover, their values did not change significantly from the 0° results. Comparing Case 0 and Case 2 with a 65° wind direction, the positive and negative pressure regions were approximately equal; however, the absolute values both increased owing to the influence of the high-rise building. The maximum positive pressures on the windward surface were 0.2 [-] and 0.6 [-] in Case 0 and Case 2, respectively. The minimum negative pressures on the roof surface were −0.6 [-] and −1.2 [-] in Case 0 and Case 2, respectively.
Figure 13 shows the distributions of the positive p e a k C p . As shown in the result of Case 0 with a 65° wind direction, similar to the result with a 30° wind direction (Figure 8), the region of the higher-value area on the windward surface occurred close to the roof surface and upper side close to the side 3 surface, the direction from which the wind was blowing at a 65° wind direction; however, the maximum values in the surfaces changed minimally. In the result of Case 2 with a 65° wind direction, a strong positive p e a k C p appeared closer to the roof surface on the windward surface and near the ground on the side 3 surface. The high value of approximately 3.0 [-] near the ground on the side 3 surface was presumed to be the direct impact of the downwash flow generated by a high-rise building.
Figure 14 shows the distributions of the negative p e a k C p . As shown in the figures comparing the influence of the wind direction in Case 0, relatively large negative pressures of approximately −2.2 [-] on the roof surface and −1.6 [-] and −1.8 [-] on side 1 and side 2 occurred at a 0° wind direction. Under both wind direction conditions, high absolute values were observed along the windward edge lines. As with the positive p e a k C p distributions, the absolute values changed minimally in both wind directions. At the 0° wind direction in Case 2, all surfaces had negative pressures of approximately 1.5 to 3 times those in Case 0. A locally strong negative p e a k C p was observed at the windward corner of the roof surface with values of approximately −4.0 [-]. Comparing Case 0 and Case 2 with a 30° wind direction, it can be observed that the high-rise building caused a strong negative p e a k C p of −9.4 [-] locally at the windward corner of the roof surface. This might be because of the downwash flow caused by the high-rise building impinging on the pressure measurement model and the strong separation at the roof surface. In addition, a high-value area of approximately −4.2 [-] was also observed near the windward side of the ground surface on side 1.
Figure 15 compares the distributions of the fluctuating pressure coefficient C p . In Case 0, the values were relatively high in the region of the relatively large absolute value of mean wind pressure coefficient C p ¯ , as shown in Figure 12, similar to the result of the 30° wind direction condition. Under the 65° wind direction condition in Case 2, the C p in the region of the large negative p e a k C p was relatively high; however, the C p in the region of the large positive p e a k C p was smaller. Thus, it was found that the strong negative wind pressure fluctuated significantly, whereas the positive wind pressure was relatively constant.

4. Conclusions

This study investigated the impact of a high-rise building on the wind pressure acting on the surrounding low-rise buildings through wind tunnel experiments. The experiments were performed under the condition that one high-rise building, five times taller than other building models, was built in an ideal urban block with a gross building coverage ratio of 25%. Seventy-two wind directions were considered from 0° to 355° in 5° increments.
At a 30° wind angle direction, strong positive and negative peak wind pressures occurred in a low-rise building at the leeward side of the high-rise building. In particular, the high-rise building caused an extremely strong negative peak wind pressure coefficient of −9.4 [-] locally at the windward corner of the rooftop surface, approximately three times larger than that in the case without high-rise buildings. The fluctuating pressure coefficient in the region of high negative peak wind pressure was high at approximately 1.0 [-] compared with those in the other conditions, indicating large fluctuations. This might be because of the effect of the downwash flow caused by the high-rise building impinging on the pressure measurement model and the strong separation at the rooftop surface. Under the 65° wind angle condition, a positive peak wind pressure of approximately 3.0 [-] occurred on the windward surface, similar to that under the 30° wind angle condition. The fluctuating pressure coefficient in the region where the high positive peak wind pressure coefficient was approximately 0.4 [-] was small compared with that in the region where strong negative wind pressure occurred. Thus, the strong positive wind pressure was relatively constant.
The results indicate that high-rise buildings cause high negative pressure locally on the rooftop surface of the surrounding low-rise buildings, creating a severe risk of associated unexpected exterior material damage. This study extracted and quantified these impacts. As future considerations based on the results of this study, it will be attempted to identify the causes of the locally high wind pressure acting on low-rise buildings around a high-rise building by analyzing the response of the flow and vortex generated by the high-rise building [25,26] to the wind pressure on the low-rise buildings.

Author Contributions

Conceptualization, Y.I. and A.M.; methodology, A.Y. and Y.I.; software, A.Y.; validation, S.K. and Y.Y.; formal analysis, Y.I. and S.K.; investigation, Y.I. and Y.Y.; resources, A.Y. and A.M.; data curation, A.Y., S.K. and Y.Y.; writing—original draft preparation, Y.I.; writing—review and editing, Y.I.; visualization, S.K. and Y.Y.; supervision, A.Y.; project administration, A.M.; funding acquisition, A.M. All authors have read and agreed to the published version of the manuscript.

Funding

This research was funded by JSPS KAKENHI, grant number 21H01486.

Institutional Review Board Statement

Not applicable.

Informed Consent Statement

Not applicable.

Data Availability Statement

Not applicable.

Acknowledgments

We are grateful to Yokoyama, a fourth-year undergraduate student at the Tokyo Polytechnic University, for performing the wind tunnel experiments.

Conflicts of Interest

The authors declare no conflict of interest.

References

  1. Kwok, K.C.S.; Wilhelm, P.A.; Wilkie, B.G. Effect of edge configuration on wind-induced response of tall buildings. Eng. Struct. 1988, 10, 135–140. [Google Scholar] [CrossRef]
  2. Miyashita, K.; Katagiri, J.; Nakamura, O.; Ohkuma, T.; Tamura, Y.; Itoh, M.; Mimachi, T. Wind-induced response of high-rise buildings Effects of corner cuts or openings in square buildings. J. Wind. Eng. Ind. Aerodyna. 1993, 50, 319–328. [Google Scholar] [CrossRef]
  3. Zhou, Y.; Kijewski, T.; Kareem, A. Along-Wind Load Effects on Tall Buildings: Comparative Study of Major International Codes and Standards. J. Struct. Eng. 2002, 128, 788–796. [Google Scholar] [CrossRef]
  4. Kim, Y.M.; You, K.P.; Ko, N.H. Across-wind responses of an aeroelastic tapered tall building. J. Fluids Struct. 2008, 96, 1307–1319. [Google Scholar] [CrossRef]
  5. Tanaka, H.; Tamura, Y.; Ohtake, K.; Nakai, M.; Kim, Y.C. Experimental investigation of aerodynamic forces and wind pressures acting on tall buildings with various unconventional configurations. J. Wind. Eng. Ind. Aerodyn. 2012, 107–108, 179–191. [Google Scholar] [CrossRef]
  6. Blocken, B. 50 years of Computational Wind Engineering: Past, present and future. J. Wind. Eng. Ind. Aerodyn. 2014, 129, 69–102. [Google Scholar] [CrossRef]
  7. Kawai, H.; Tamura, T.; Arai, M.; Sayama, H.; Yamaguchi, T.; Yoshie, K. Turbulence and Pressure Fluctuation around High-Rise Building with Complicated Facade in Urban Districts. In Proceedings of the 7th International Symposium on Computational Wind Engineering 2018, Seoul, Republic of Korea, 18−22 June 2018. [Google Scholar]
  8. Ke, Y.; Shen, G.; Yu, H.; Xie, J. Effects of Corner Modification on the Wind-Induced Responses of High-Rise Buildings. Appl. Sci. 2022, 12, 9739. [Google Scholar] [CrossRef]
  9. Xu, X.; Yang, Q.; Yoshida, A.; Tamura, Y. Characteristics of pedestrian-level wind around super-tall buildings with various configurations. J. Wind. Eng. Ind. Aerodyn. 2017, 166, 61–73. [Google Scholar] [CrossRef]
  10. Murakami, S.; Uehara, K.; Komine, H. Amplification of wind speed at ground level due to construction of high-rise building in urban area. J. Wind. Eng. Ind. Aerodyn. 1979, 4, 343–370. [Google Scholar] [CrossRef]
  11. van Druenen, T.; van Hooff, T.; Montazeri, H.; Blocken, B. CFD evaluation of building geometry modifications to reduce pedestrian-level wind speed. Build. Environ. 2019, 163, 106293. [Google Scholar] [CrossRef]
  12. Khanduri, A.C.; Stathopoulos, T.; Bedard, H. Wind-induced interference effects on buildings—A review of the state-of-the-art. Eng. Struct. 1998, 20, 617–630. [Google Scholar] [CrossRef]
  13. Bailey, P.A.; Kwok, K.C.S. Interference Excitation of Twin Tall Buildings. J. Wind. Eng. Ind. Aerodyn. 1985, 21, 323–338. [Google Scholar] [CrossRef]
  14. Kim, W.; Tamura, Y.; Yoshida, A. Interference effects on local peak pressures between two buildings. J. Wind. Eng. Ind. Aerodyn. 2011, 99, 584–600. [Google Scholar] [CrossRef]
  15. Kim, W.; Tamura, Y.; Yoshida, A. Interference effects on aerodynamic wind forces between two buildings. J. Wind. Eng. Ind. Aerodyn. 2013, 147, 186–201. [Google Scholar] [CrossRef]
  16. Hui, Y.; Tamura, Y.; Yang, Q. Analysis of interference effects on torsional moment between two high-rise buildings based on pressure and flow field measurement. J. Wind. Eng. Ind. Aerodyn. 2018, 164, 54–68. [Google Scholar] [CrossRef]
  17. Xie, Z.N.; Gu, M. Simplified formulas for evaluation of wind-induced interference effects among three tall buildings. J. Wind. Eng. Ind. Aerodyn. 2007, 95, 31–52. [Google Scholar] [CrossRef]
  18. Lam, K.M.; Leung, M.Y.H.; Zhao, J.G. Interference effects on wind loading of a row of closely spaced tall buildings. J. Wind. Eng. Ind. Aerodyn. 2008, 96, 562–583. [Google Scholar] [CrossRef]
  19. Chen, B.; Shang, L.; Qin, M.; Chen, X.; Yang, Q. Wind interference effects of high-rise building on low-rise building with flat roof. J. Wind. Eng. Ind. Aerodyn. 2018, 183, 88–113. [Google Scholar] [CrossRef]
  20. Chen, J.; Quan, Y.; Gu, M. Aerodynamic interference effects of a proposed super high-rise building on the aerodynamic forces and responses of an existing building. J. Wind. Eng. Ind. Aerodyn. 2020, 206, 104312. [Google Scholar] [CrossRef]
  21. Architectural Institute of Japan. Recommendations for Loads on Buildings; Architectural Institute of Japan: Tokyo, Japan, 2015. (In Japanese) [Google Scholar]
  22. Irwin, H.; Cooper, K.; Girard, R. Correction of distortion effects caused by tubing systems in measurements of fluctuating pressures. J. Wind. Eng. Ind. Aerodyn. 1979, 5, 93–107. [Google Scholar] [CrossRef]
  23. Holmes, J.D. Equivalent time averaging in wind engineering. J. Wind. Eng. Ind. Aerodyn. 1997, 72, 411–419. [Google Scholar] [CrossRef]
  24. TPU (Tokyo Polytechnic University) Aerodynamic Database. Available online: http://db.wind.arch.t-kougei.ac.jp/ (accessed on 27 January 2023).
  25. Hosseini, Z.; Bourgeoisa, J.A.; Martinuzzi, R.J. Large-scale structures in dipole and quadrupole wakes of a wall-mounted finite rectangular cylinder. Exp. in Fluids 2013, 54, 1595. [Google Scholar] [CrossRef]
  26. Cao, Y.; Tamura, T.; Zhou, D.; Bao, Y.; Han, Z. Topological description of near-wall flows around a surface-mounted square cylinder at high Reynolds numbers. J. Fluid Mech. 2022, 933, A39. [Google Scholar] [CrossRef]
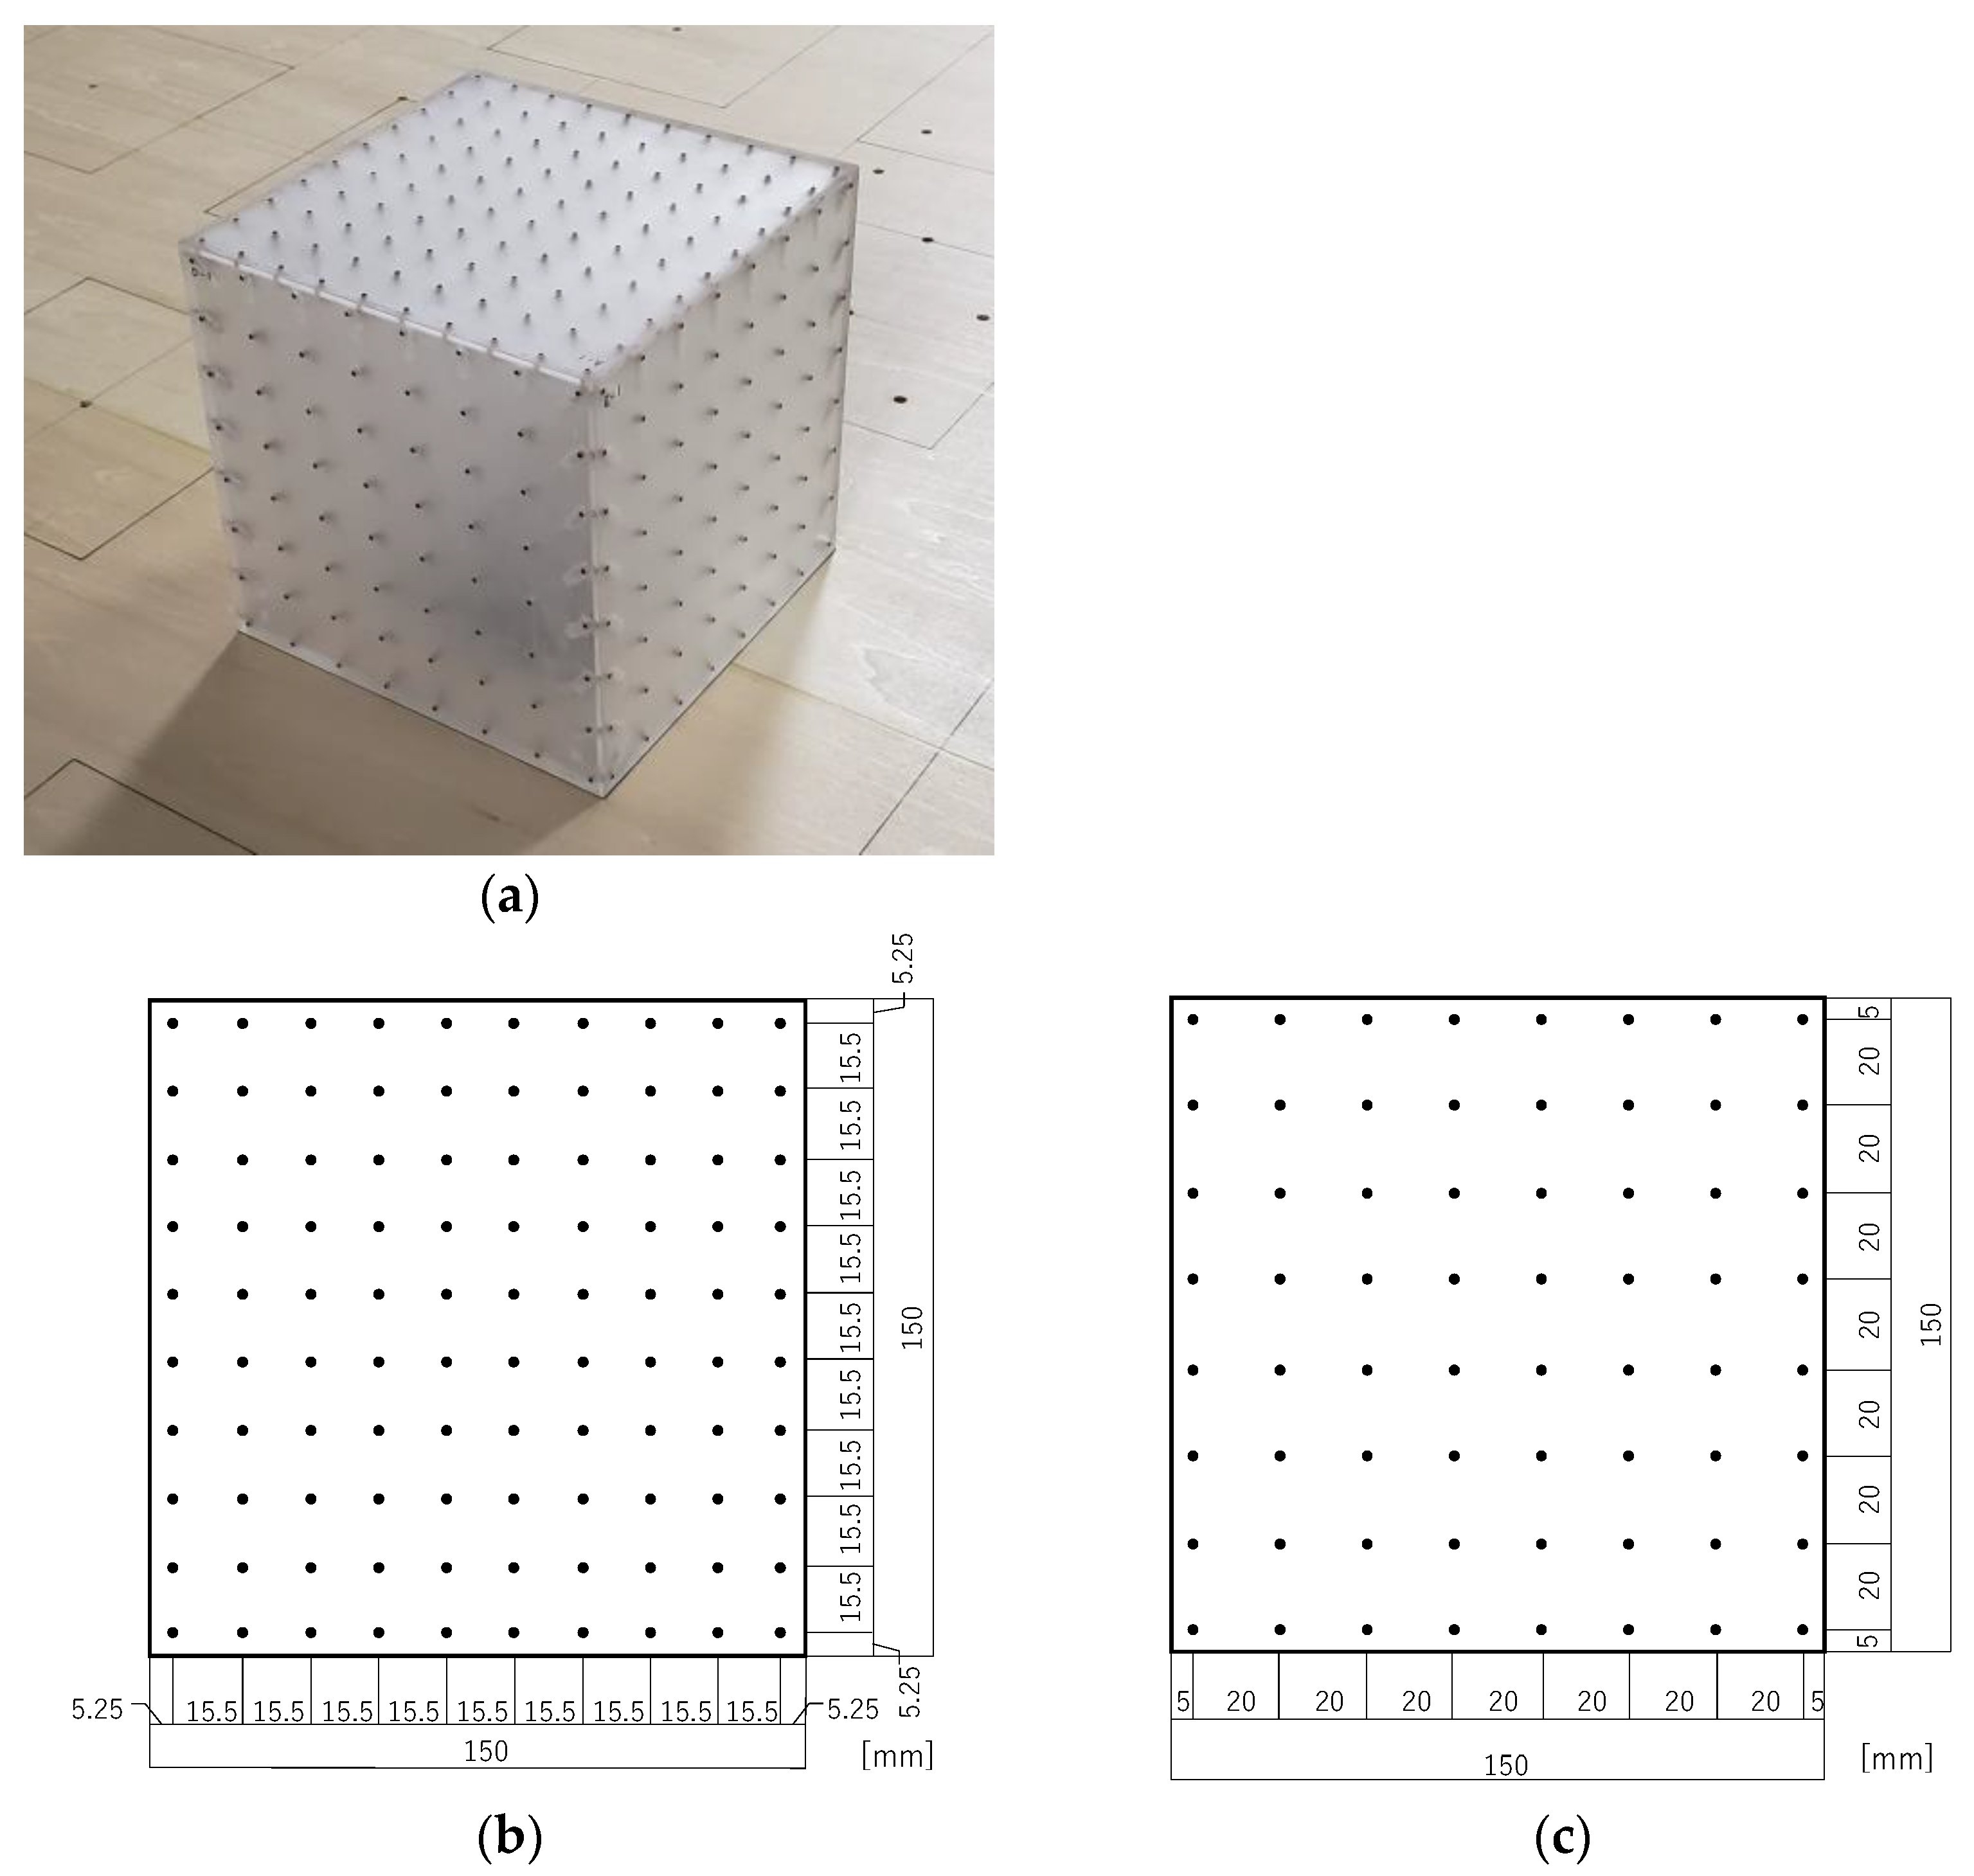
Figure 1. Pressure taps: (a) test model for wind pressure measurement; (b) pressure taps on roof surface; (c) pressure taps on side surfaces.
Wind 03 00007 g001
Figure 2. Building models and their placement on the turntable: (a) size of building models; (b) model placement on the turntable (orange: test model for wind pressure measurement, blue: dummy models, number: location of a high-rise building in each case).
Wind 03 00007 g002
Figure 3. Photo of the experimental models installed in the wind tunnel of Case 1.
Wind 03 00007 g003
Figure 4. Characteristics of approach flow: (a) mean wind velocity; (b) turbulent intensity; (c) power spectrum density.
Wind 03 00007 g004
Figure 5. (a) Prevailing wind direction; (b) mean wind pressure coefficient C p ¯ at wind direction of 0° in this study; (c) mean wind pressure coefficient C p ¯ at wind direction of 0° in previous study [24]; (d) positive p e a k C p at wind direction of 0° in this study; (e) positive p e a k C p at wind direction of 0° in previous study [24]; (f) negative p e a k C p at wind direction of 0° in this study; (g) negative p e a k C p at wind direction of 0° in previous study [24].
Wind 03 00007 g005
Figure 6. Variations in maximum values of positive p e a k C p and minimum values of negative p e a k C p among all taps for wind directions and locations of a high-rise building; (a) positive p e a k C p ; (b) negative p e a k C p .
Wind 03 00007 g006
Figure 7. Mean wind pressure coefficient, C p ¯ ; (a) building model arrangement and prevailing wind direction for (b,c); (b) wind direction of 0° in Case 0 with no high-rise building; (c) wind direction of 0° in Case 2 with a high-rise building next to the pressure measurement model; (d) building model arrangement and prevailing wind direction for (e,f); (e) wind direction of 30° in Case 0; (f) wind direction of 30° in Case 2.
Wind 03 00007 g007
Figure 8. Positive p e a k C p ; (a) building model arrangement and prevailing wind direction for (b,c); (b) wind direction of 0° in Case 0 with no high-rise building; (c) wind direction of 0° in Case 2 with a high-rise building next to the pressure measurement model; (d) building model arrangement and prevailing wind direction for (e,f); (e) wind direction of 30° in Case 0; (f) wind direction of 30° in Case 2.
Wind 03 00007 g008
Figure 9. Negative p e a k C p ; (a) building model arrangement and prevailing wind direction for (b,c); (b) wind direction of 0° in Case 0 with no high-rise building; (c) wind direction of 0° in Case 2 with a high-rise building next to the pressure measurement model; (d) building model arrangement and prevailing wind direction for (e,f); (e) wind direction of 30° in Case 0; (f) wind direction of 30° in Case 2.
Wind 03 00007 g009
Figure 10. Fluctuating wind pressure coefficient C p ; (a) building model arrangement and prevailing wind direction for (b,c); (b) wind direction of 0° in Case 0 with no high-rise building; (c) wind direction of 0° in Case 2 with a high-rise building next to the pressure measurement model; (d) building model arrangement and prevailing wind direction for (e,f); (e) wind direction of 30° in Case 0; (f) wind direction of 30° in Case 2.
Wind 03 00007 g010
Figure 11. Instantaneous wind pressure coefficient distributions when the maximum and minimum value occurs among all taps in the condition of 0° wind direction; (a) building model arrangement and prevailing wind direction; (b) distribution when the maximum value of positive p e a k C p occurs among all taps; (c) distribution when the minimum value of positive p e a k C p occurs among all taps.
Wind 03 00007 g011
Figure 12. Mean wind pressure coefficient C p ¯ ; (a) building model arrangement and prevailing wind direction for (b,c); (b) wind direction of 0° in Case 0 with no high-rise building; (c) wind direction of 0° in Case 2 with a high-rise building next to the pressure measurement model; (d) building model arrangement and prevailing wind direction for (e,f); (e) wind direction of 65° in Case 0; (f) wind direction of 65° in Case 2.
Wind 03 00007 g012
Figure 13. Positive p e a k C p ; (a) building model arrangement and prevailing wind direction for (b,c); (b) wind direction of 0° in Case 0 with no high-rise building; (c) wind direction of 0° in Case 2 with a high-rise building next to the pressure measurement model; (d) building model arrangement and prevailing wind direction for (e,f); (e) wind direction of 65° in Case 0; (f) wind direction of 65° in Case 2.
Wind 03 00007 g013aWind 03 00007 g013b
Figure 14. Negative p e a k C p ; (a) building model arrangement and prevailing wind direction for (b,c); (b) wind direction of 0° in Case 0 with no high-rise building; (c) wind direction of 0° in Case 2 with a high-rise building next to the pressure measurement model; (d) building model arrangement and prevailing wind direction for (e,f); (e) wind direction of 65° in Case 0; (f) wind direction of 65° in Case 2.
Wind 03 00007 g014aWind 03 00007 g014b
Figure 15. Fluctuating wind pressure coefficient C p ; (a) building model arrangement and prevailing wind direction for (b,c); (b) wind direction of 0° in Case 0 with no high-rise building; (c) wind direction of 0° in Case 2 with a high-rise building next to the pressure measurement model; (d) building model arrangement and prevailing wind direction for (e,f); (e) wind direction of 65° in Case 0; (f) wind direction of 65° in Case 2.
Wind 03 00007 g015
Table 1. Experimental cases.
Case NameLocation of a High-Rise Building
(The Number in Figure 2)
Case 0Uniform height (No high-rise building)
Case 11
Case 22
Case 33
Case 44
Case 55
Disclaimer/Publisher’s Note: The statements, opinions and data contained in all publications are solely those of the individual author(s) and contributor(s) and not of MDPI and/or the editor(s). MDPI and/or the editor(s) disclaim responsibility for any injury to people or property resulting from any ideas, methods, instructions or products referred to in the content.