1. Introduction
Over the last few decades, and more prominently currently, many countries have launched and reinforced campaigns to reduce CO2 emissions from all human activities and, in the area of energy, promote generation technologies from low carbon renewable sources, especially wind and solar.
This promotion of renewables can be seen in statistics, and the extraordinary increase in plants using renewable sources in recent years (in 2020 was 1590 TWh of electricity from wind power [
1]). There is more activity in using distributed generation close to consumers, such as photovoltaic plants on roofs and Small Wind Turbines (SWT) [
2,
3].
In cities, the most suitable places to install SWT are tall buildings. Thus, the Institute of Energy and Environment of the University of São Paulo (IEE-USP) has installed a small wind turbine in an existing high-height building on its campus in São Paulo, Brazil. This SWT serves as a didactic apparatus and demonstration initiative of wind energy generation connected directly to the university’s electric grid, which already has other embedded renewable sources installed, namely photovoltaic and biogas plants. The SWT was placed on the roof of the existing high voltage laboratory building, leading to an operating height of 35 m.
The high voltage laboratory building on the campus was inaugurated in 1949. It is built of bricks and concrete with dimensions of 20 m in width, 35 m long, and 30 m in height. It is on a plain terrain not surrounded by other taller buildings, which provides an excellent location for renewable energy generation.
Several other projects, studies, and practical implementations of small wind turbines (SWT) can be found in existing literature, and some of their key aspects are summarized below.
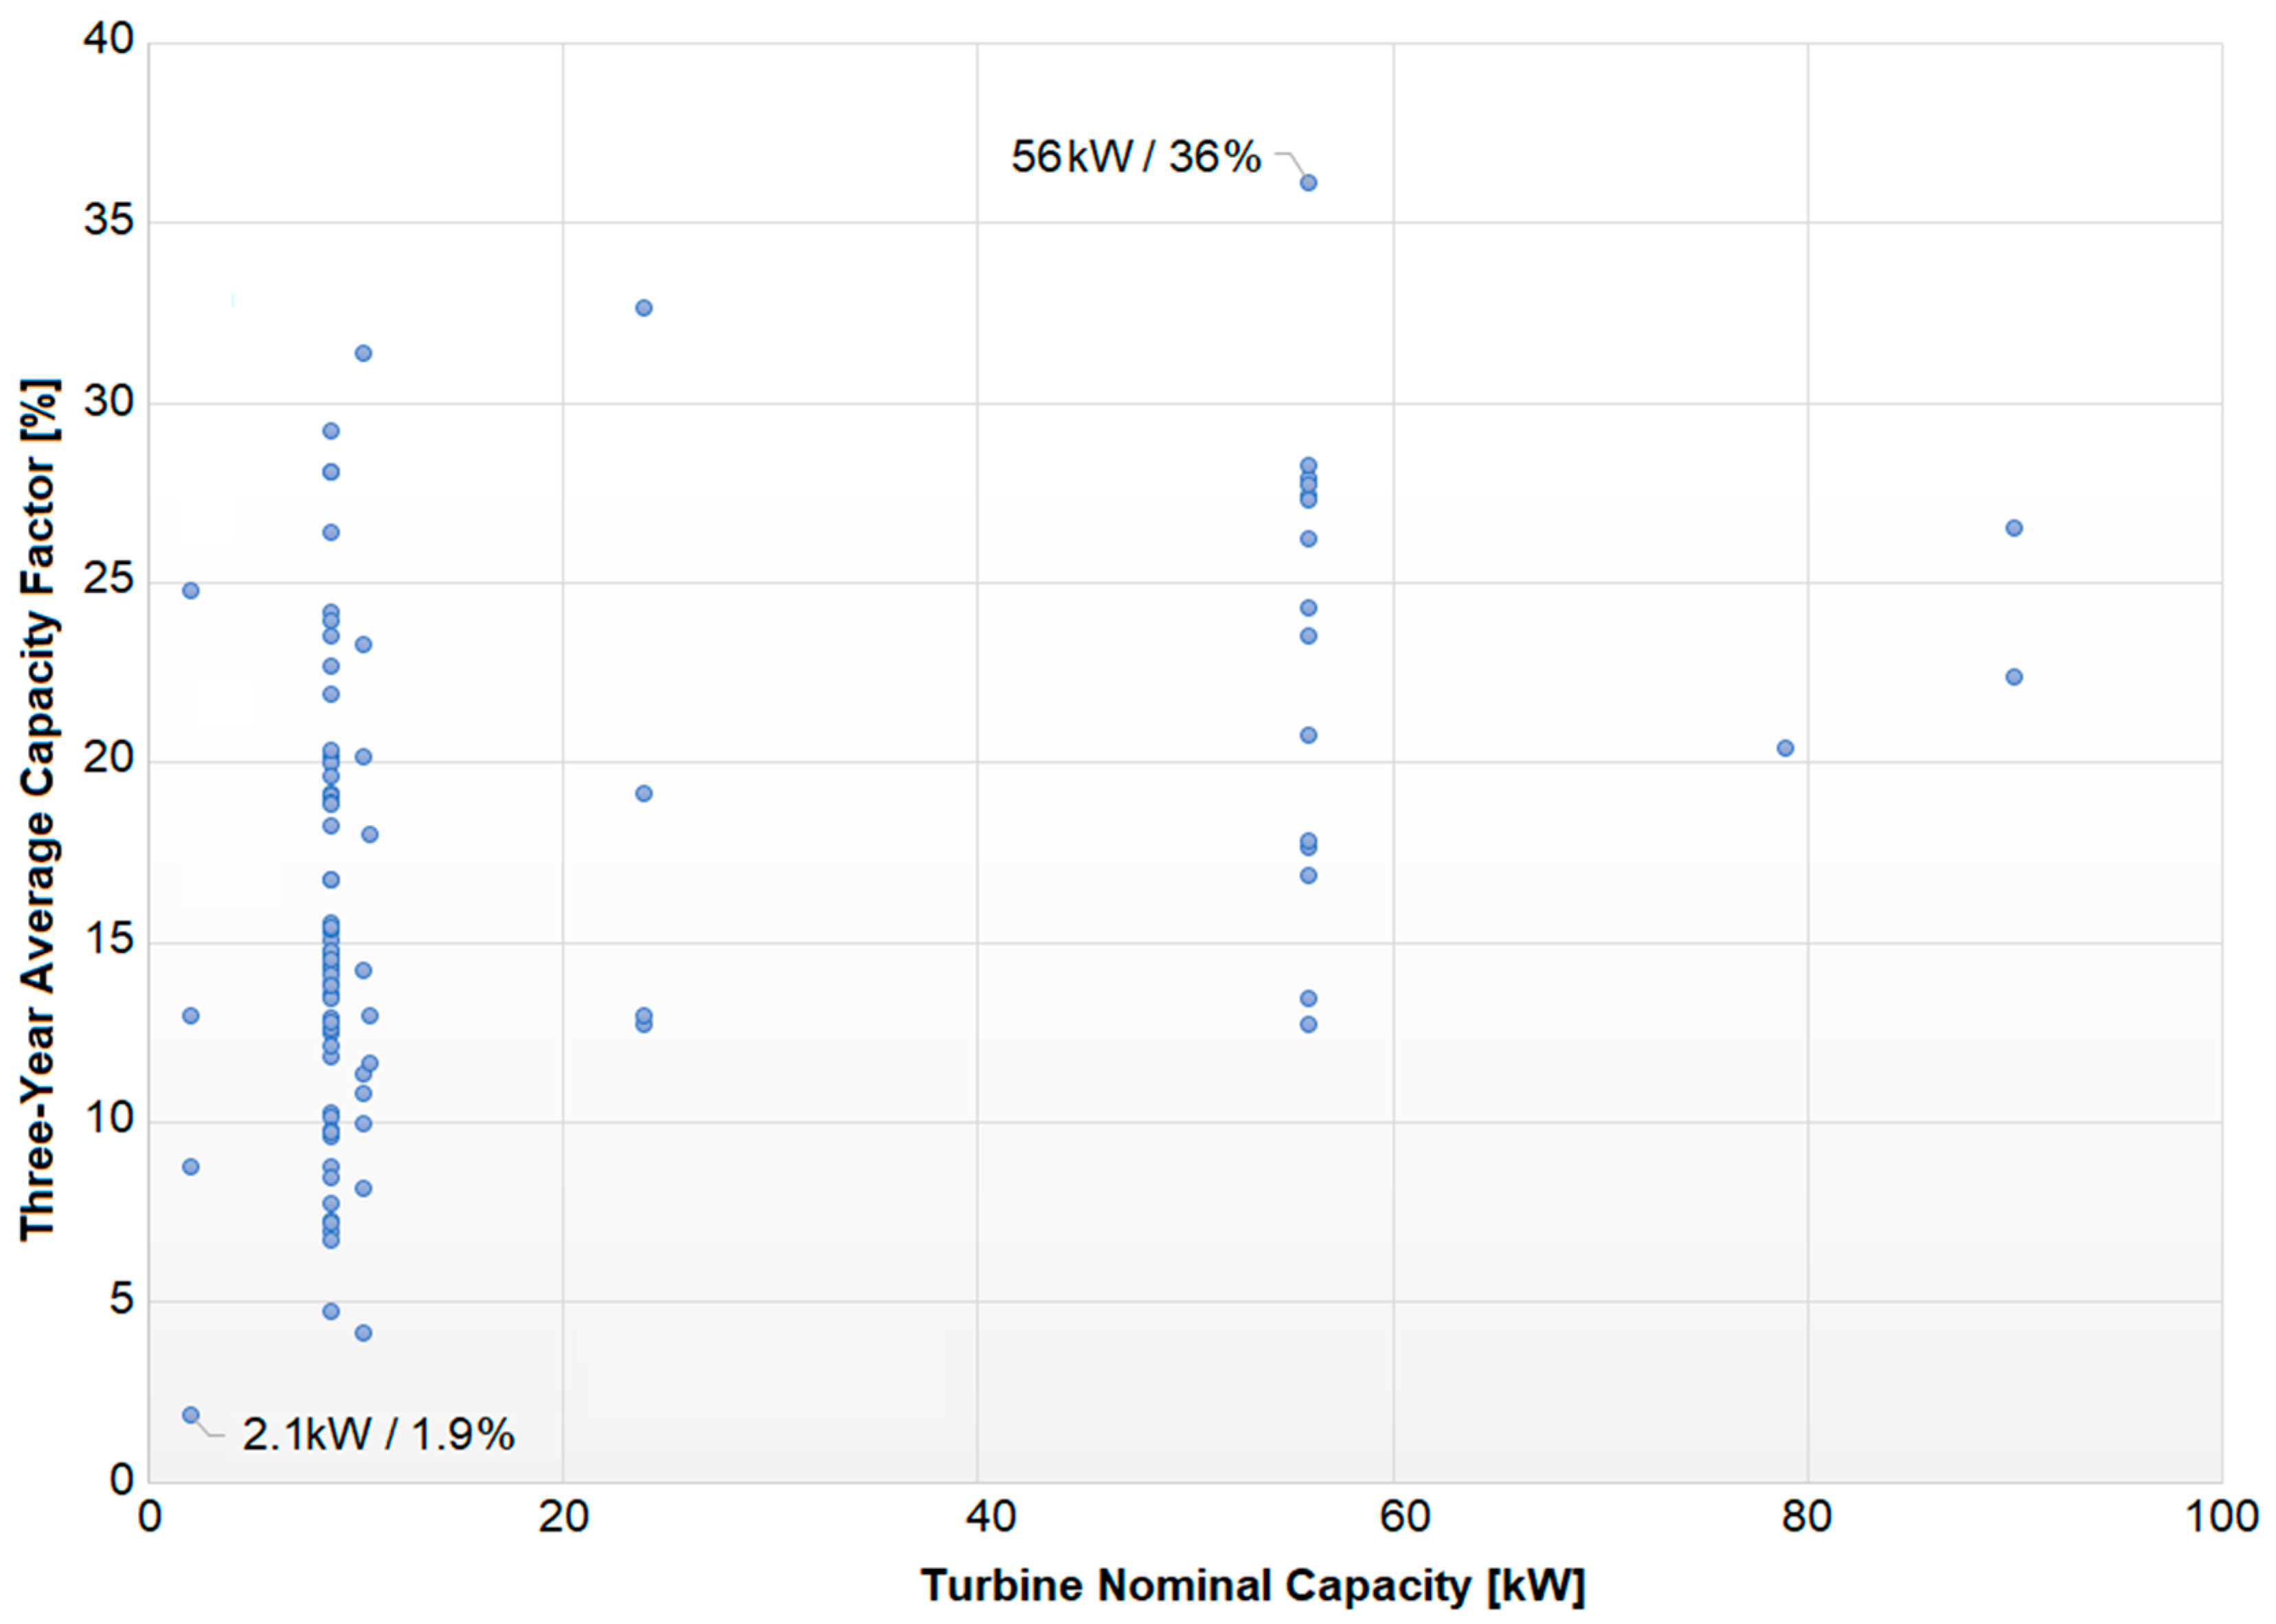
A comprehensive report published by the US Department of Energy in the 2018 Distributed Wind Energy Market Report [
4] shows, among other information, that the three-year average capacity factor (CF) of small wind turbines, for the 93 SWT units covered in the study, is 17%. The CF data varies from as low as 1.9% to as high as 36%, as shown in
Figure 1. This is important information concerning the CF, considering that the overall combined aspects of the turbine performance, installation conditions, and wind quality at the sites lead naturally to smaller capacity factors for SWT than bigger wind turbines.
Small wind power electric systems can contribute to the renewable energy portfolio in rural and urban areas. The rooftop of high-rise buildings [
5,
6], roof ventilators, and open regions spread over the city, such as parking lots and many other towns, may become increasingly attractive sites for wind power production. The advances in power electronics and inverters lead to a vast simplicity of the grid connection, resulting in the exponential increase of the distributed generation, mainly due to photovoltaic systems.
SWT represents an opportunity to complement solar generation in urban or suburban areas [
7] because the available commercial solutions are almost “plug and play.” The micro-controlled inverters control the operation and generation, grid integration, protection, measurement, wireless communication, and data storage.
When considering a wind turbine, the energy power output due to the incident wind velocity is:
where:
P is the electrical output power;
ρ is the density of air;
Cp is the performance coefficient of the turbine;
A is the area swept by the turbine positioned in the direction of the wind, and
υ is the wind speed.
Aerodynamic conversion losses are high when converting kinetic mechanical energy into valuable electrical energy. According to the Betz limit, the maximum possible conversion factor for the rotor is 59.3% [
8]. In practice, however, losses due to (airfoil) blade roughness, wake effects, hub losses, and tip losses can significantly reduce efficiency (~17% [
9]).
When the wind is unstable, the turbine’s energy conversion capability is further reduced, which is one of the challenges when considering wind energy utilization in urban areas. The presence of buildings, obstacles, low installation heights, vegetation, and other structures that change high-velocity laminar flow to low-velocity turbulent flow makes the performance of wind generators worse. Despite these complications, the implantation of the generation very close to the loads tends, on the other hand, to reduce electrical losses.
In Berling’s city [
10] presents a potential of 207,281 MWh of energy per year (savings 80,568 tons of CO
2 emissions) simulations from SWT installed in high buildings.
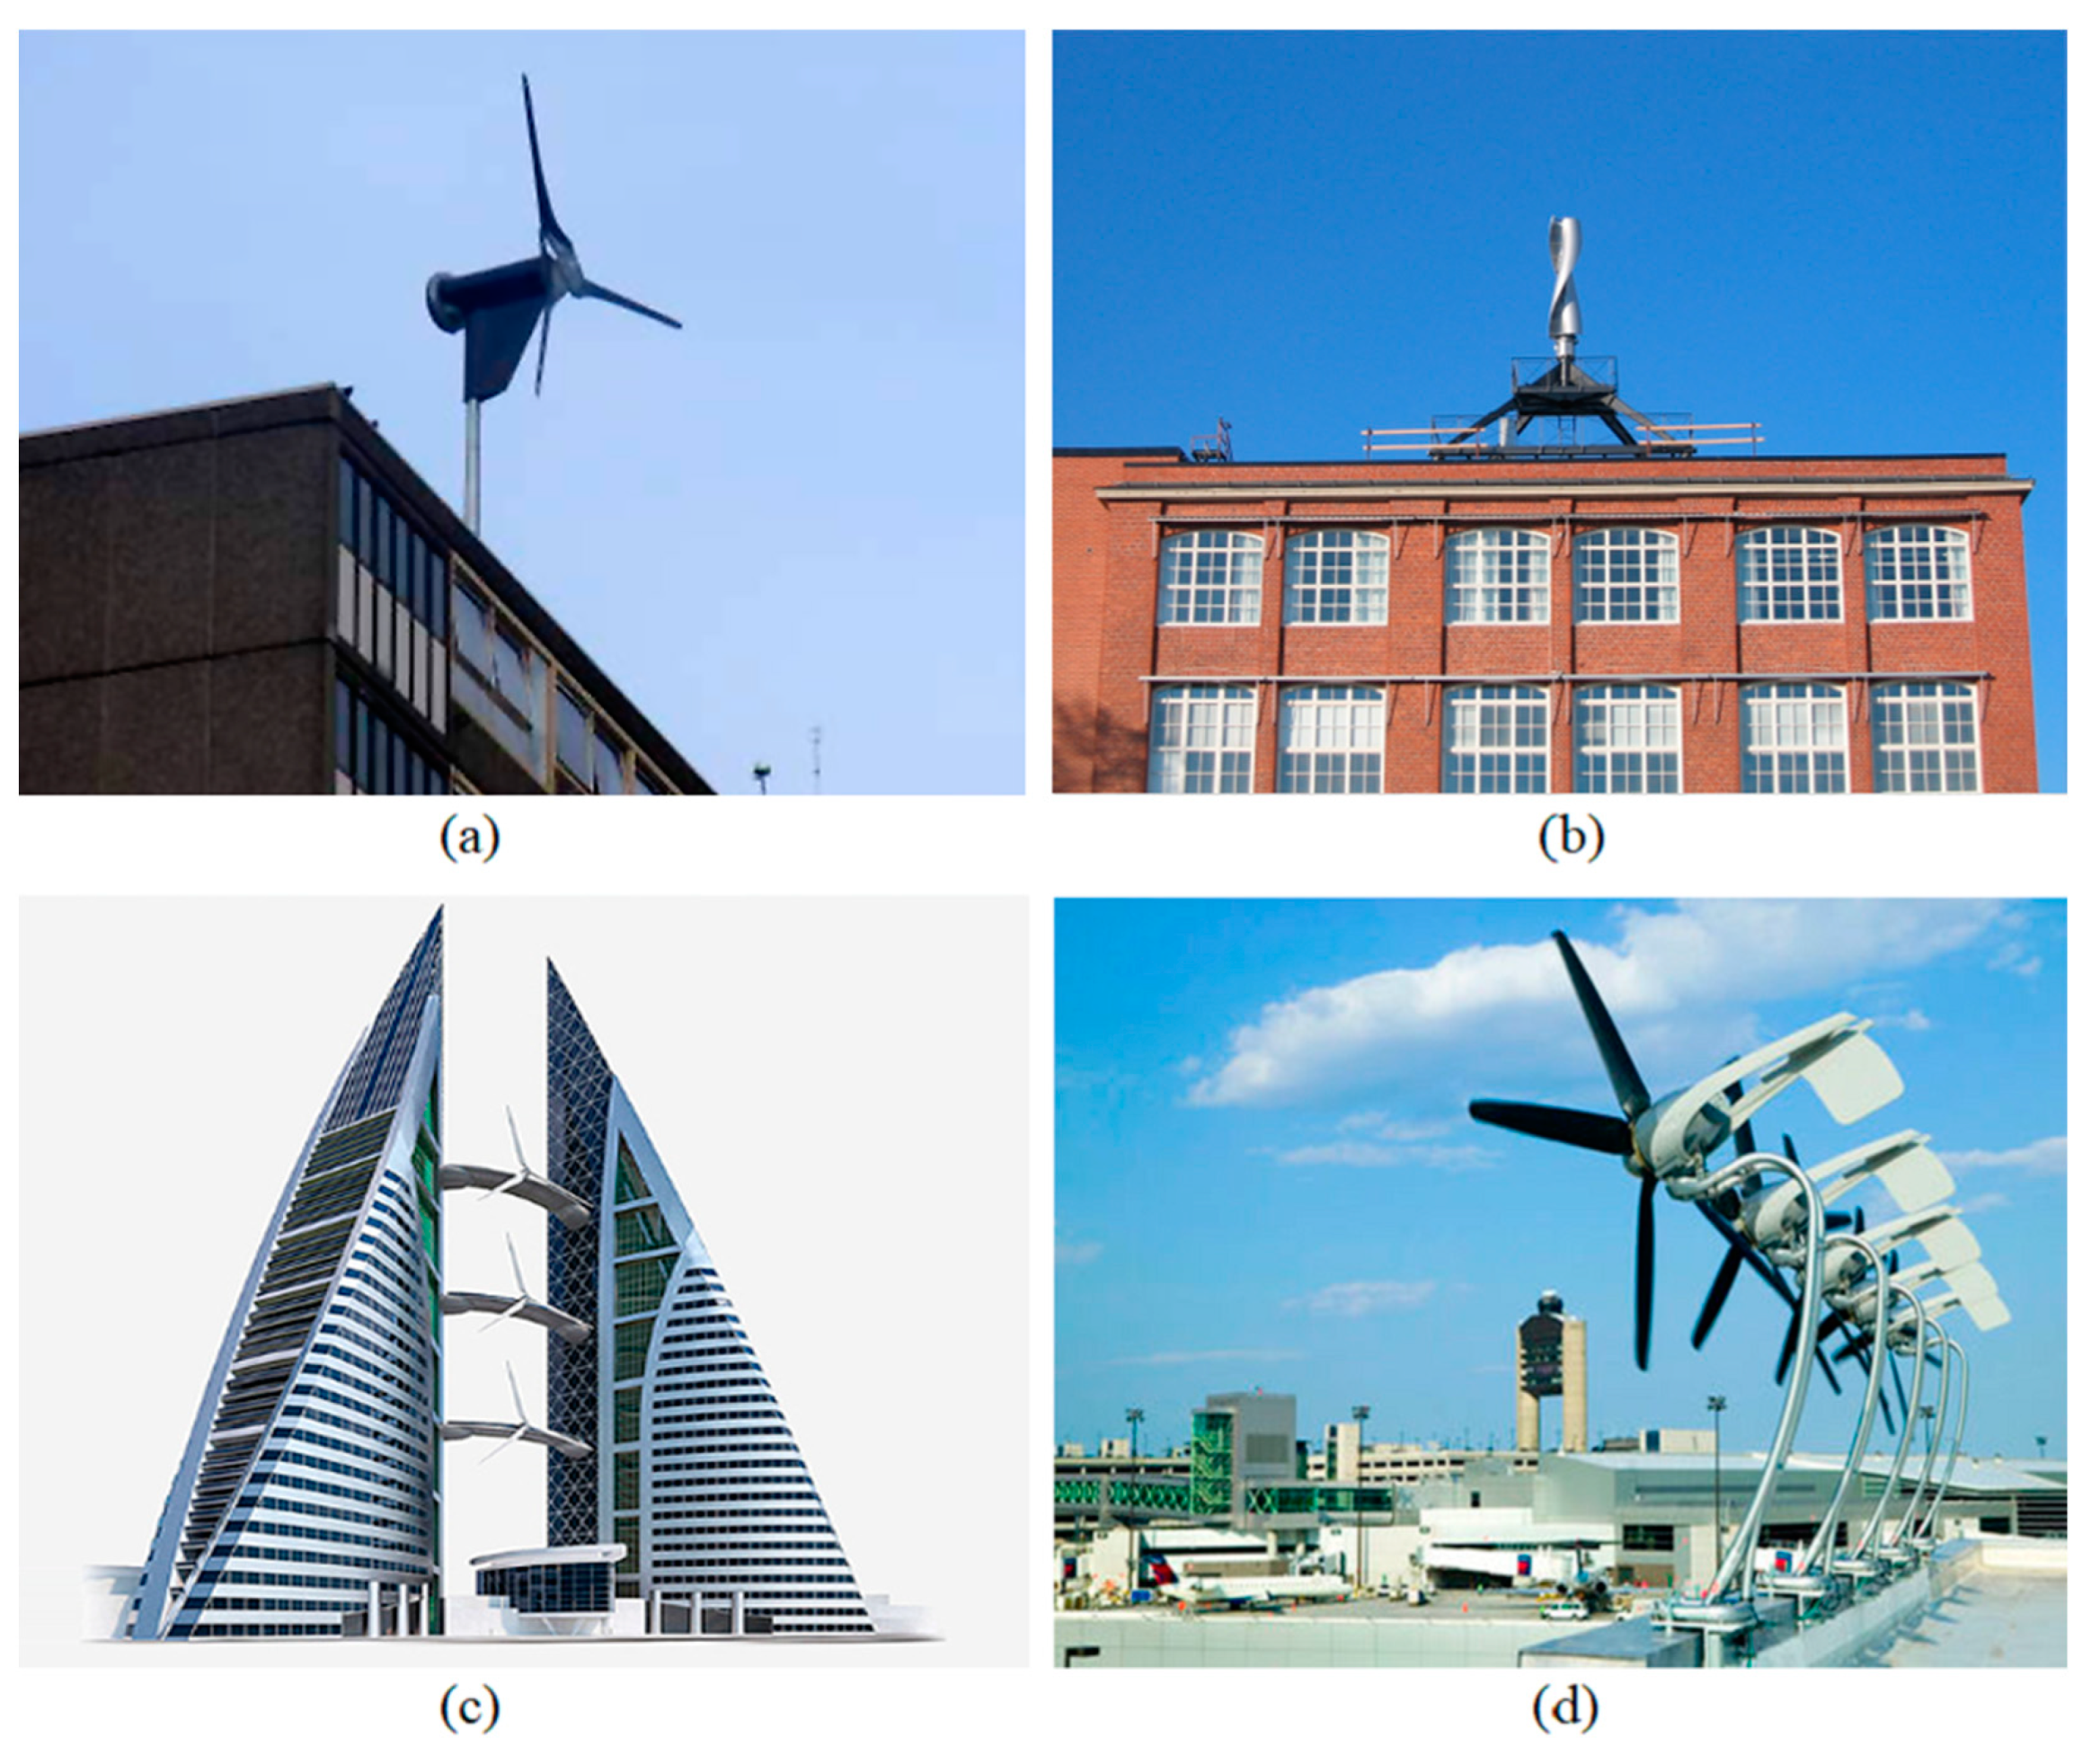
Figure 2 shows some actual installations of single units SWT.
Figure 2a shows a Proven 6 kW, 5.50 m in diameter, installed in the Ashenden building, London, UK, [
11].
Figure 2b [
12] brings a 300 W modified SWT Savonius type by Windside, with a swept area of 0.3 m
2 installed on the roof of a building at the University of Vaasa, Finland.
The installation of multiple SWT is also a frequent configuration. The Bahrain World Trade Center is a 240 m high building, and it was projected to accommodate three vertical axis wind turbines measuring 29 m in diameter as part of its architectural design, as shown in
Figure 2c [
5,
12]. On an office building located at Boston Logan Airport [
12], various 1 kW wind turbines were installed in a row on the edge of the building to better take advantage of the wind that rises through the wall,
Figure 2d.
Despite the enormous energy wind energy potential [
1], the economic feasibility of SWT in urban areas is not easy to achieve, occurring only under some favorable conditions, and a feed-in tariff specifically adapted to the SWT technology is pointed out as an essential driver of diffusion [
13,
14,
15].
As a sensitive economic analysis example, the study in [
16] has shown that only 30% of the 88 studied regions present the economic feasibility of SWT. Discount rate, capital cost, capacity, speed and pattern of wind, and feed-in tariff are the most influential factors for the cost-effectiveness of SWT.
There is no extensive literature on the subject, presenting the complete sequence of elements, for the implementation of SWT in an urban environment, from the capture and evaluation of the wind resource (ex-ante) to the details of installation and operation data (ex-post), as presented in this research.
In November 2017, the IEE-USP implemented a horizontal axis SWT, 1.8 kW rated power grid-connected on the University of São Paulo campus in the urban area of São Paulo, Brazil.
The main scope of this paper is to present and disseminate all the aspects, details, and obtained results of the study case of the implantation and the operation of the 1.8 kW SWT installed at the University of São Paulo. The article compares past data measurements of the local wind resource and the corresponding predicted energy production from the SWT with three years of subsequently recorded data outputs of electricity production from the implemented SWT. It is essential to highlight that the energy measurement and forecast data correspond to the adequate generation data for the next three years.
Section 2 presents the device implementation, the site characterization of previous wind measurements obtained from a Lidar sensor measuring campaign near the installation point, and the predicted energy production calculations.
Section 3 presents the measured actual operation data results.
Section 4 compares SWTs commercially available and the potential improvement and indications of further research development efforts, and in
Section 5 comments and conclusions are drawn.
The study findings show an excellent adherence to the measured wind speeds and the speeds obtained from the SWT measured rotation and an outstanding energy yield prediction agreement calculated by standard tools, the same used for large wind projects, compared to the measured value.
2. Materials and Methods
This section presents essential aspects of the study’s development and methodologies, such as the site’s geographic characterization, previously measured wind resource, and the SWT characterization and installation.
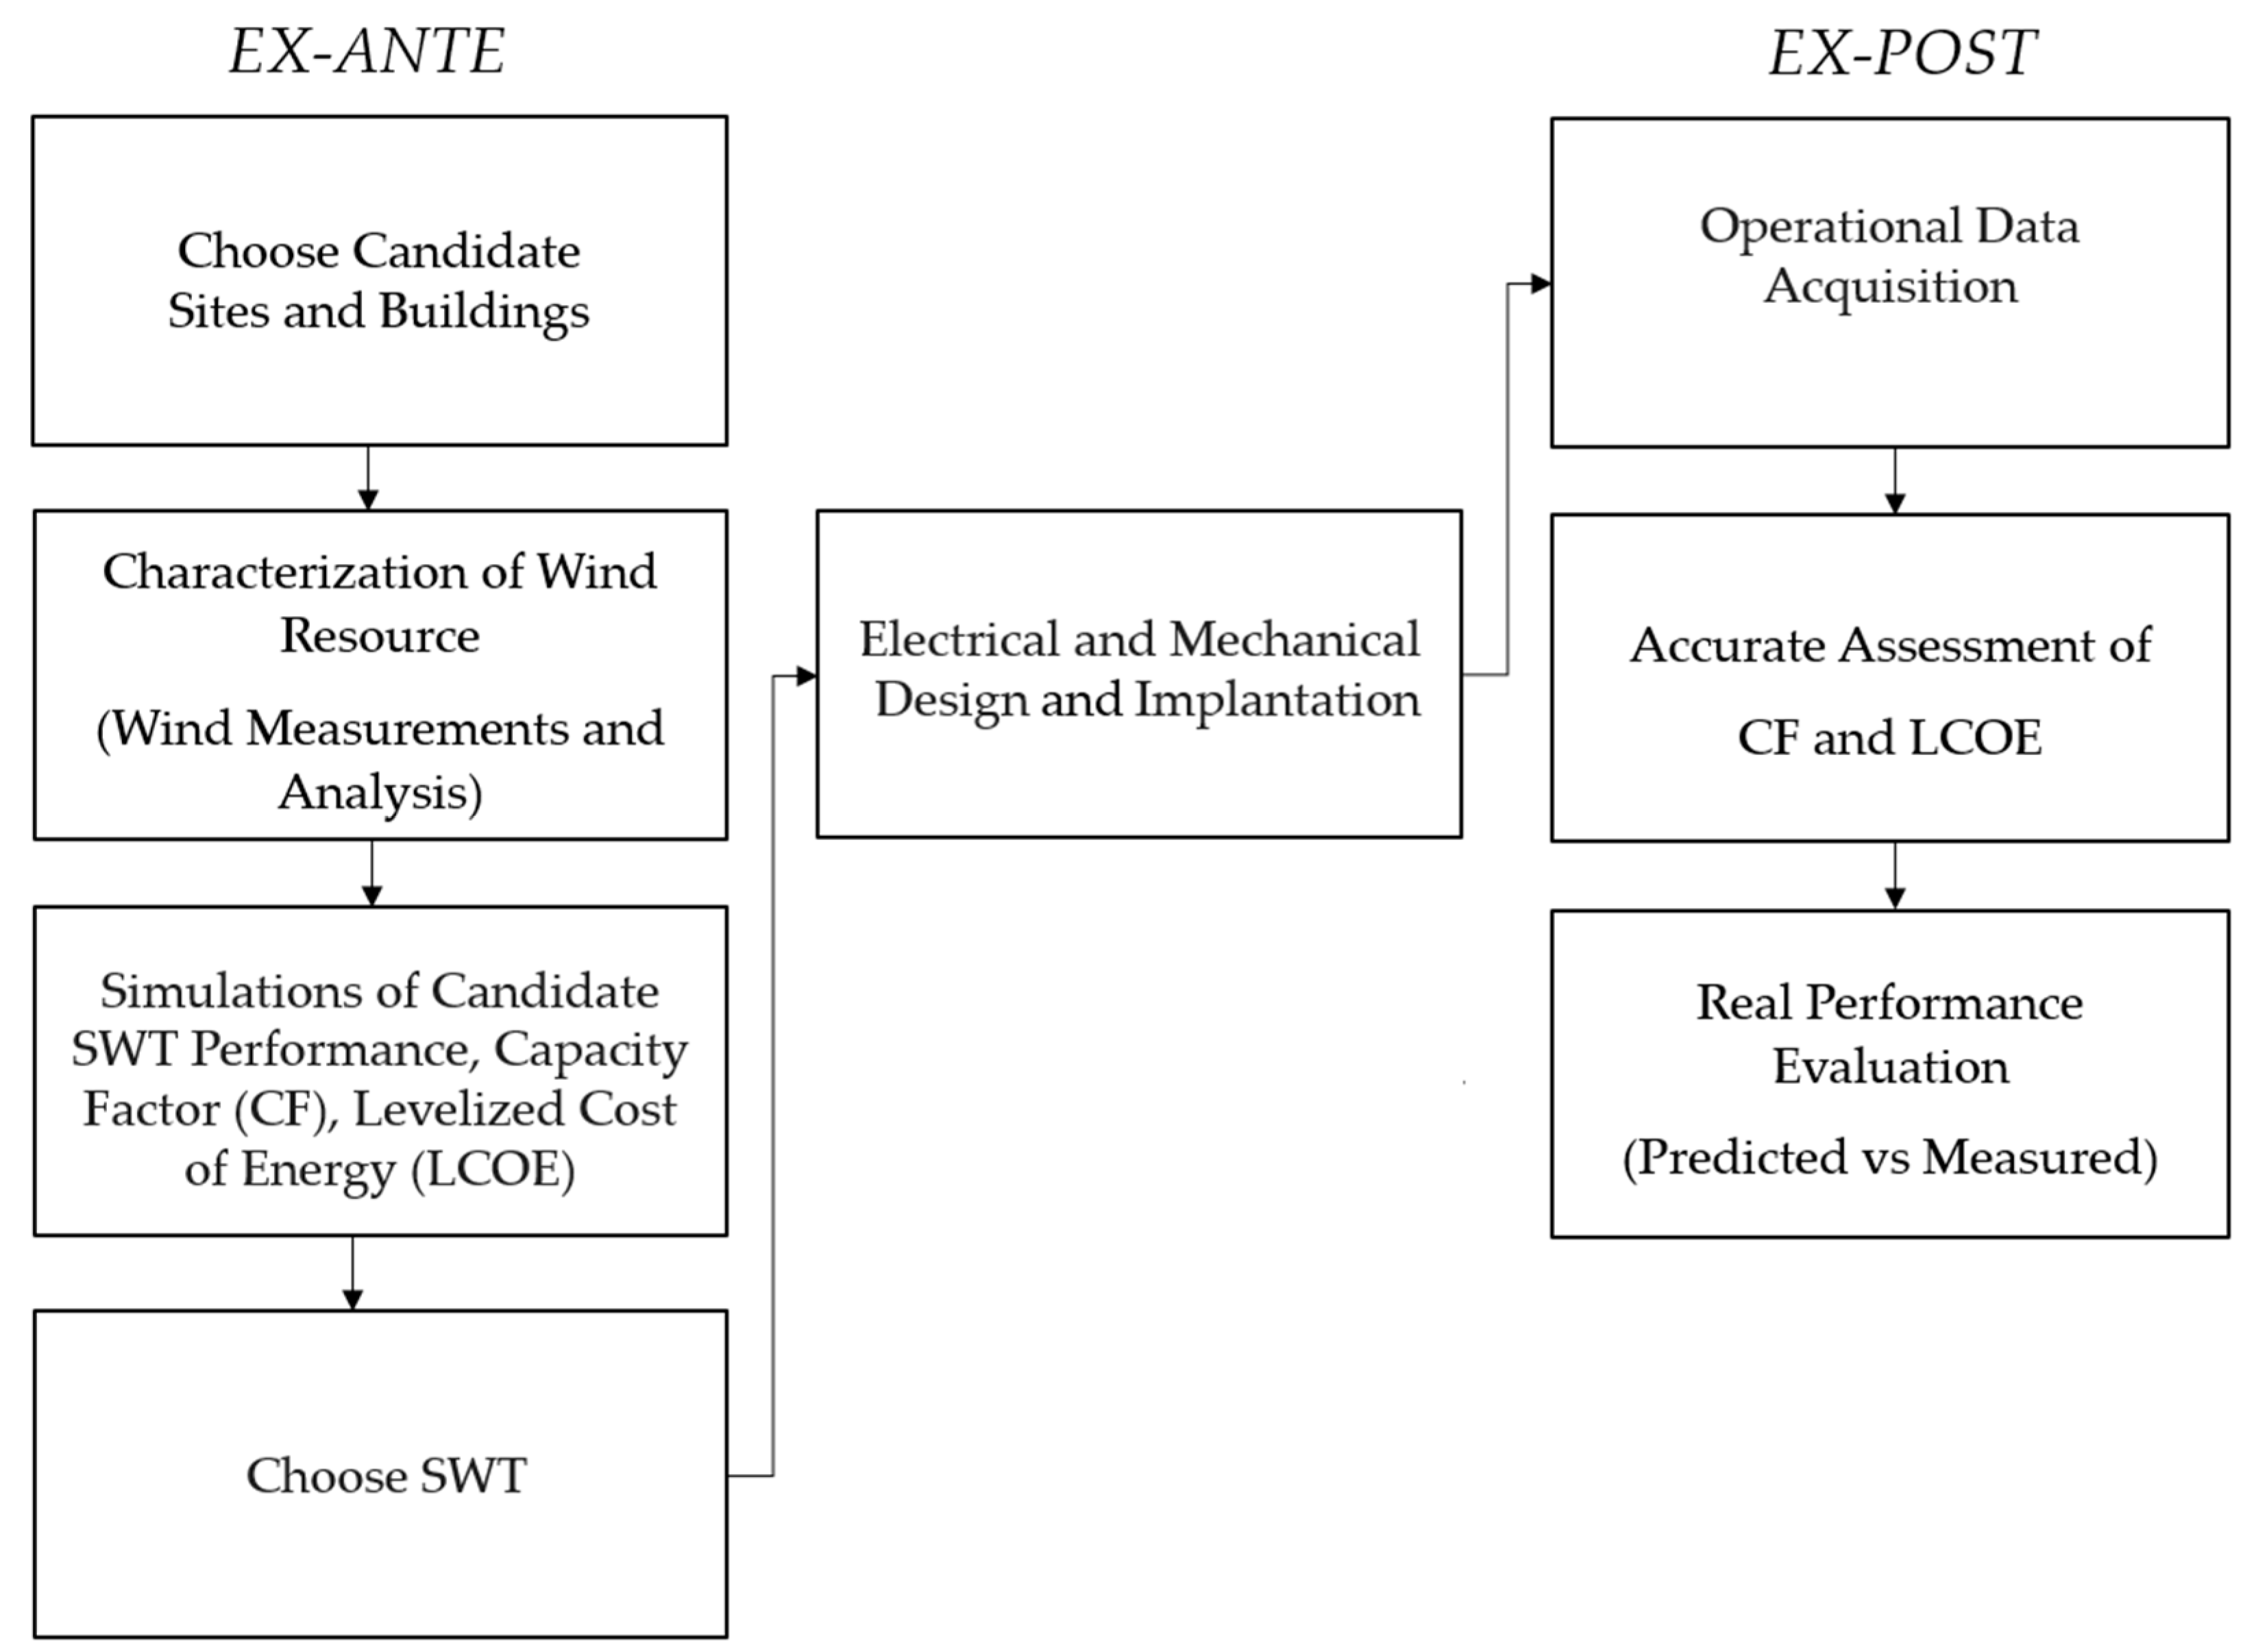
Figure 3 shows the overall systematic procedure to collect, store and analyze data regarding wind resources, and the wind turbine technical performance and economics assessment. This methodology is essential before installing any wind turbine, and can be applied elsewhere.
All the data collection tools and software used in the project are the same applied for large wind generation projects, without any adaptation or constraints.
2.1. Localization and Climatology
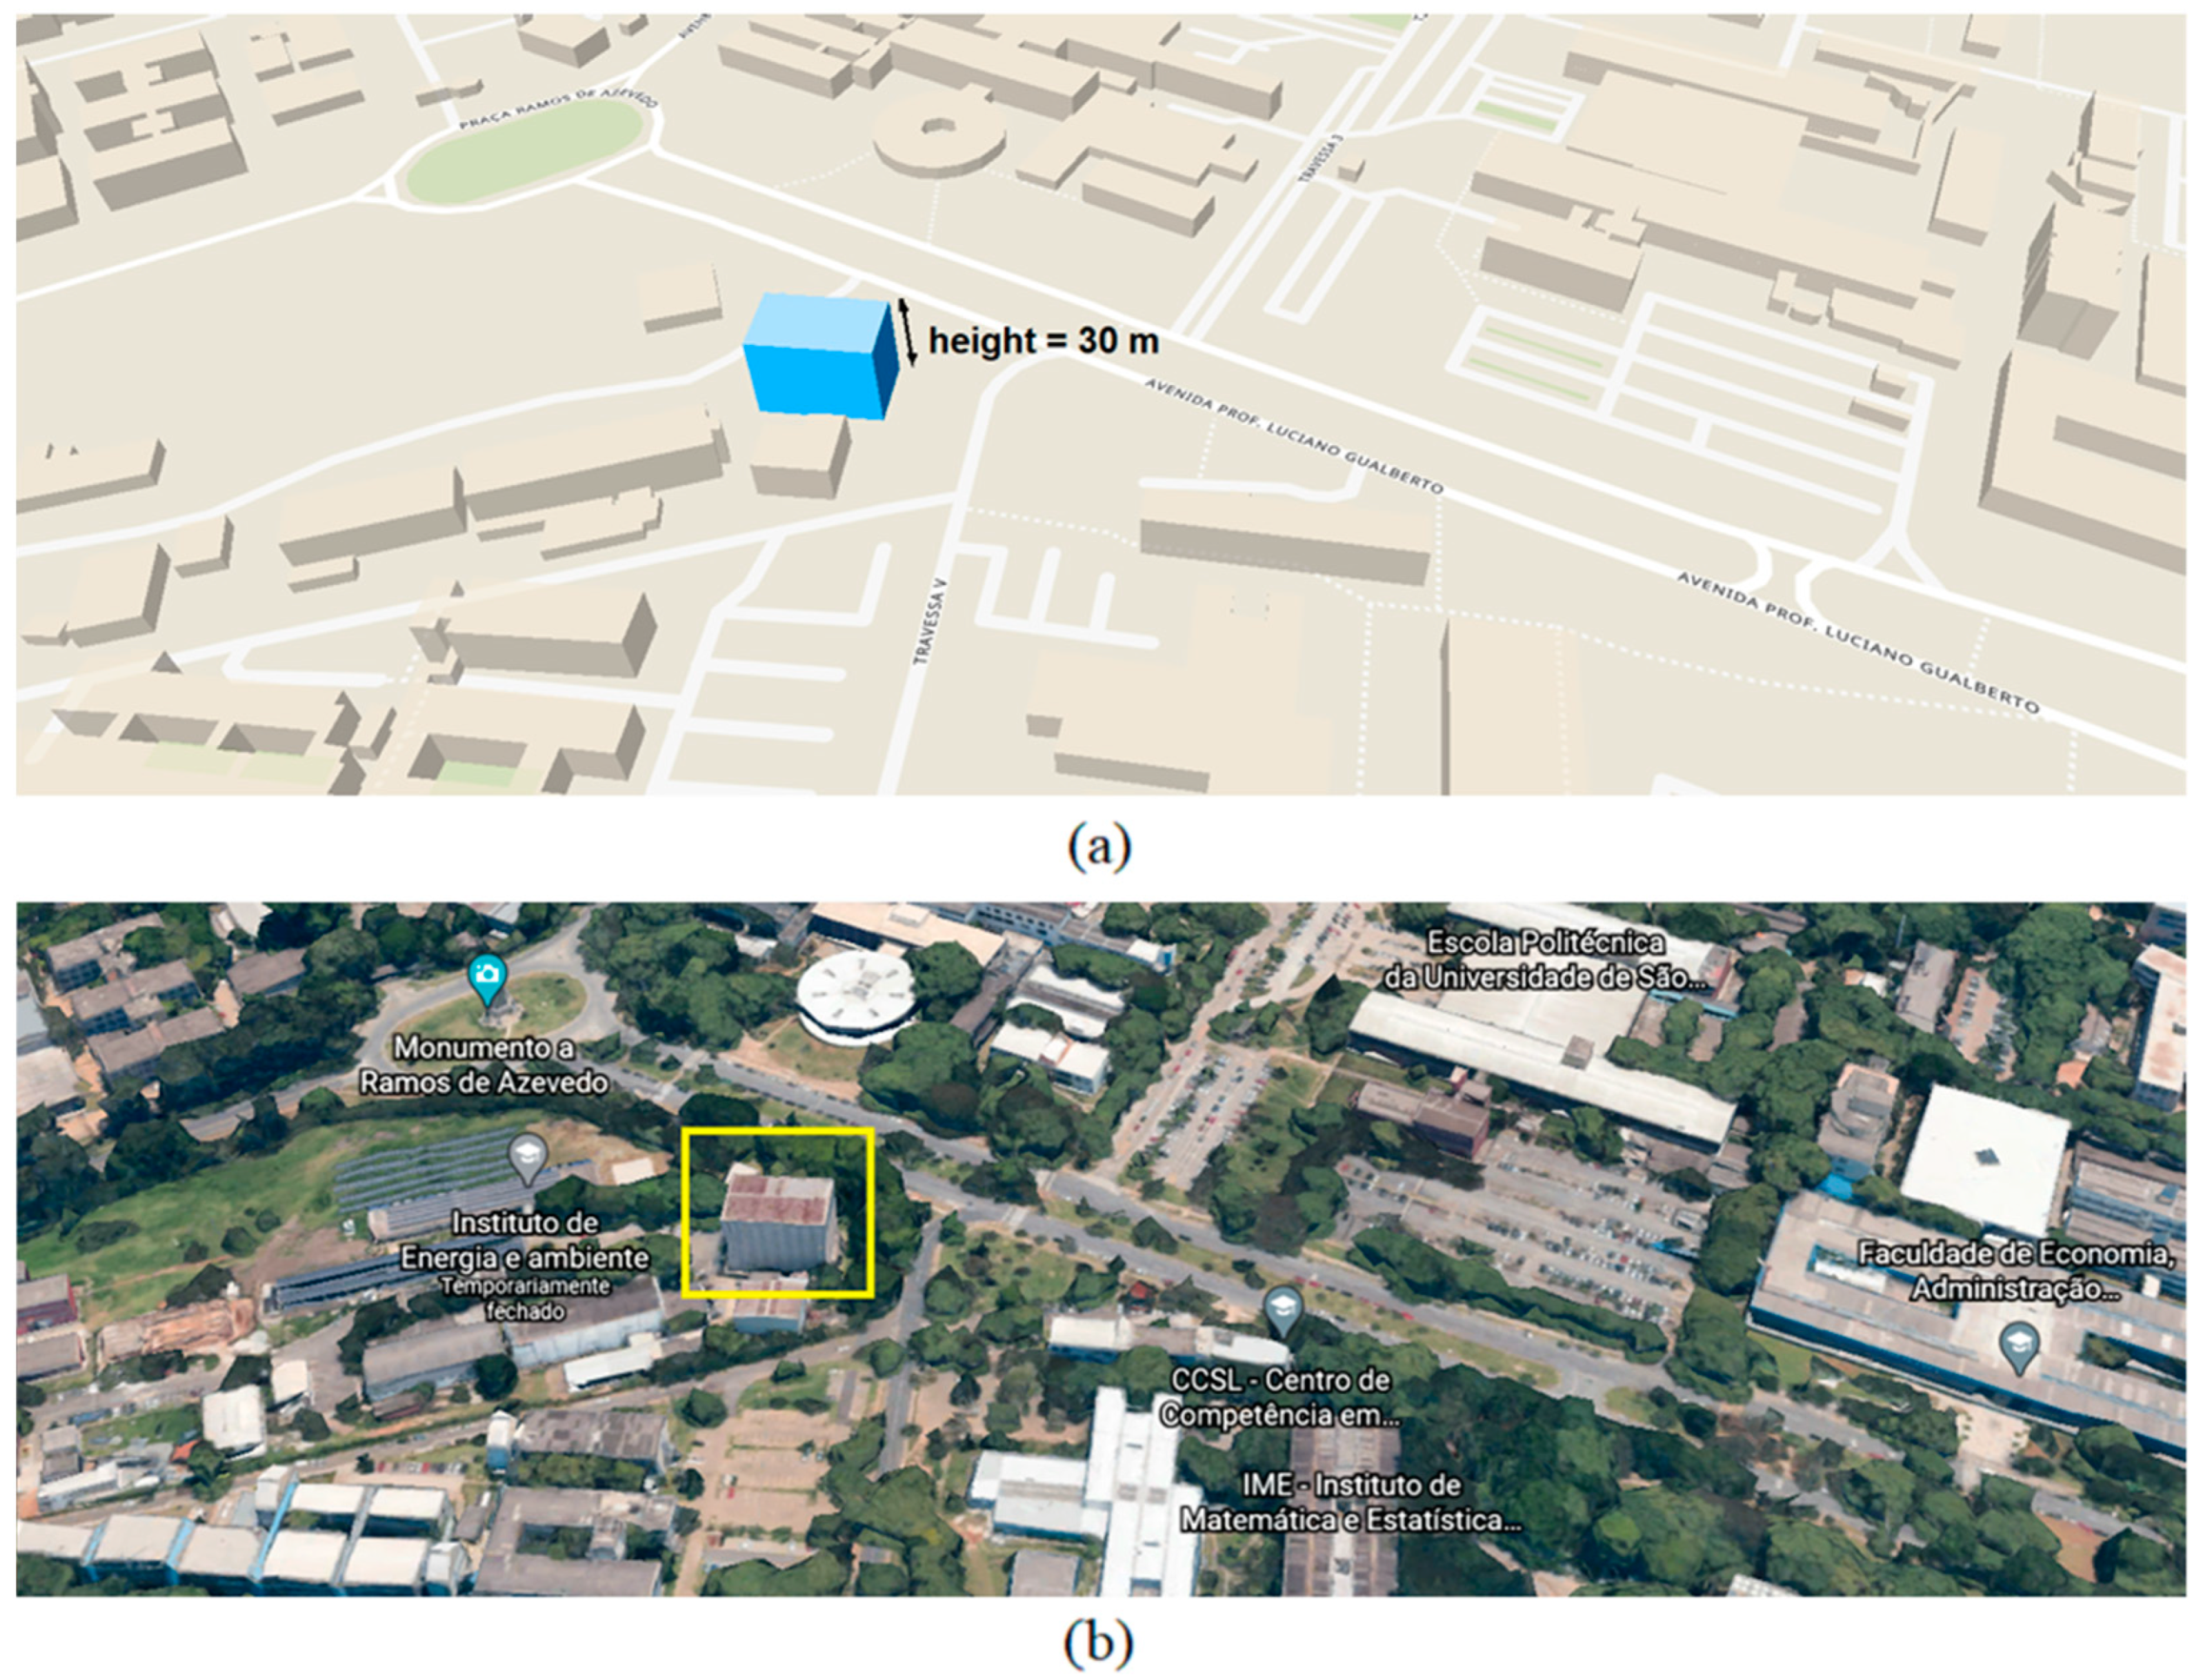
The University of São Paulo’s campus is in São Paulo, Brazil. The rooftop of the High Voltage Laboratory building at the Institute of Energy and Environment (IEE-USP) was selected to install the SWT due to its convenience: height well above surrounding buildings, and vegetation.
The site’s approximate GPS coordinates are −23.558160, −46.732895 (23°33′29.376″ S, 46°43′58.421″ W). The altitude of the terrain is around 740 m above sea level.
The regional climate and geophysical characteristics of the SWT site are relevant. The Environmental of São Paulo City, according to the Köppen–Geiger, climate classification system, is humid subtropical, with dry winter and hot summer (Cwa) [
17].
This climate, characteristic of Brazil’s subtropical regions, presents a dry winter from June to August and wet summer from December to March. The minimum daily monthly-averaged temperature and relative humidity values (16 °C and 74%, respectively) occur in July and August. The maximum daily average temperature value occurs in February (22.5 °C), and the maximum value of daily monthly-averaged relative humidity occurs from December through January and from March through April (80%).
The relative intensity of the semi-stationary South-Atlantic Anticyclone and Continental low-pressure systems’ combined effects at the geographic site position control the seasonal variation of surface winds in São Paulo City. They induce surface winds from N-NE during summer and from NE-E during winter. This pattern is frequently affected by winter synoptic-scale systems, such as cold and summer sea breeze fronts. Cold fronts penetrate the NW prefrontal winds and SE post-frontal winds.
Despite the high elevation and distance from the ocean, the sea breeze penetrates São Paulo City about 50% of the year’s days. Other mesoscale effects in São Paulo include thermal circulation induced by the mountain-valley system and urban effects due to roughness, building barriers, and shelter-level urban heat island (UHI) circulation effects [
18]. Due to the intense dynamics of the air masses, large-scale and local circulations, and seasonal and even daily changes disturb the weather conditions [
19]. São Paulo has weak predominance surface winds throughout the year, with speeds varying from minimum of 1.7 m/s to 2.3 m/s in May to maximum of 2.3 m/s to 3.1 m/s in November [
20].
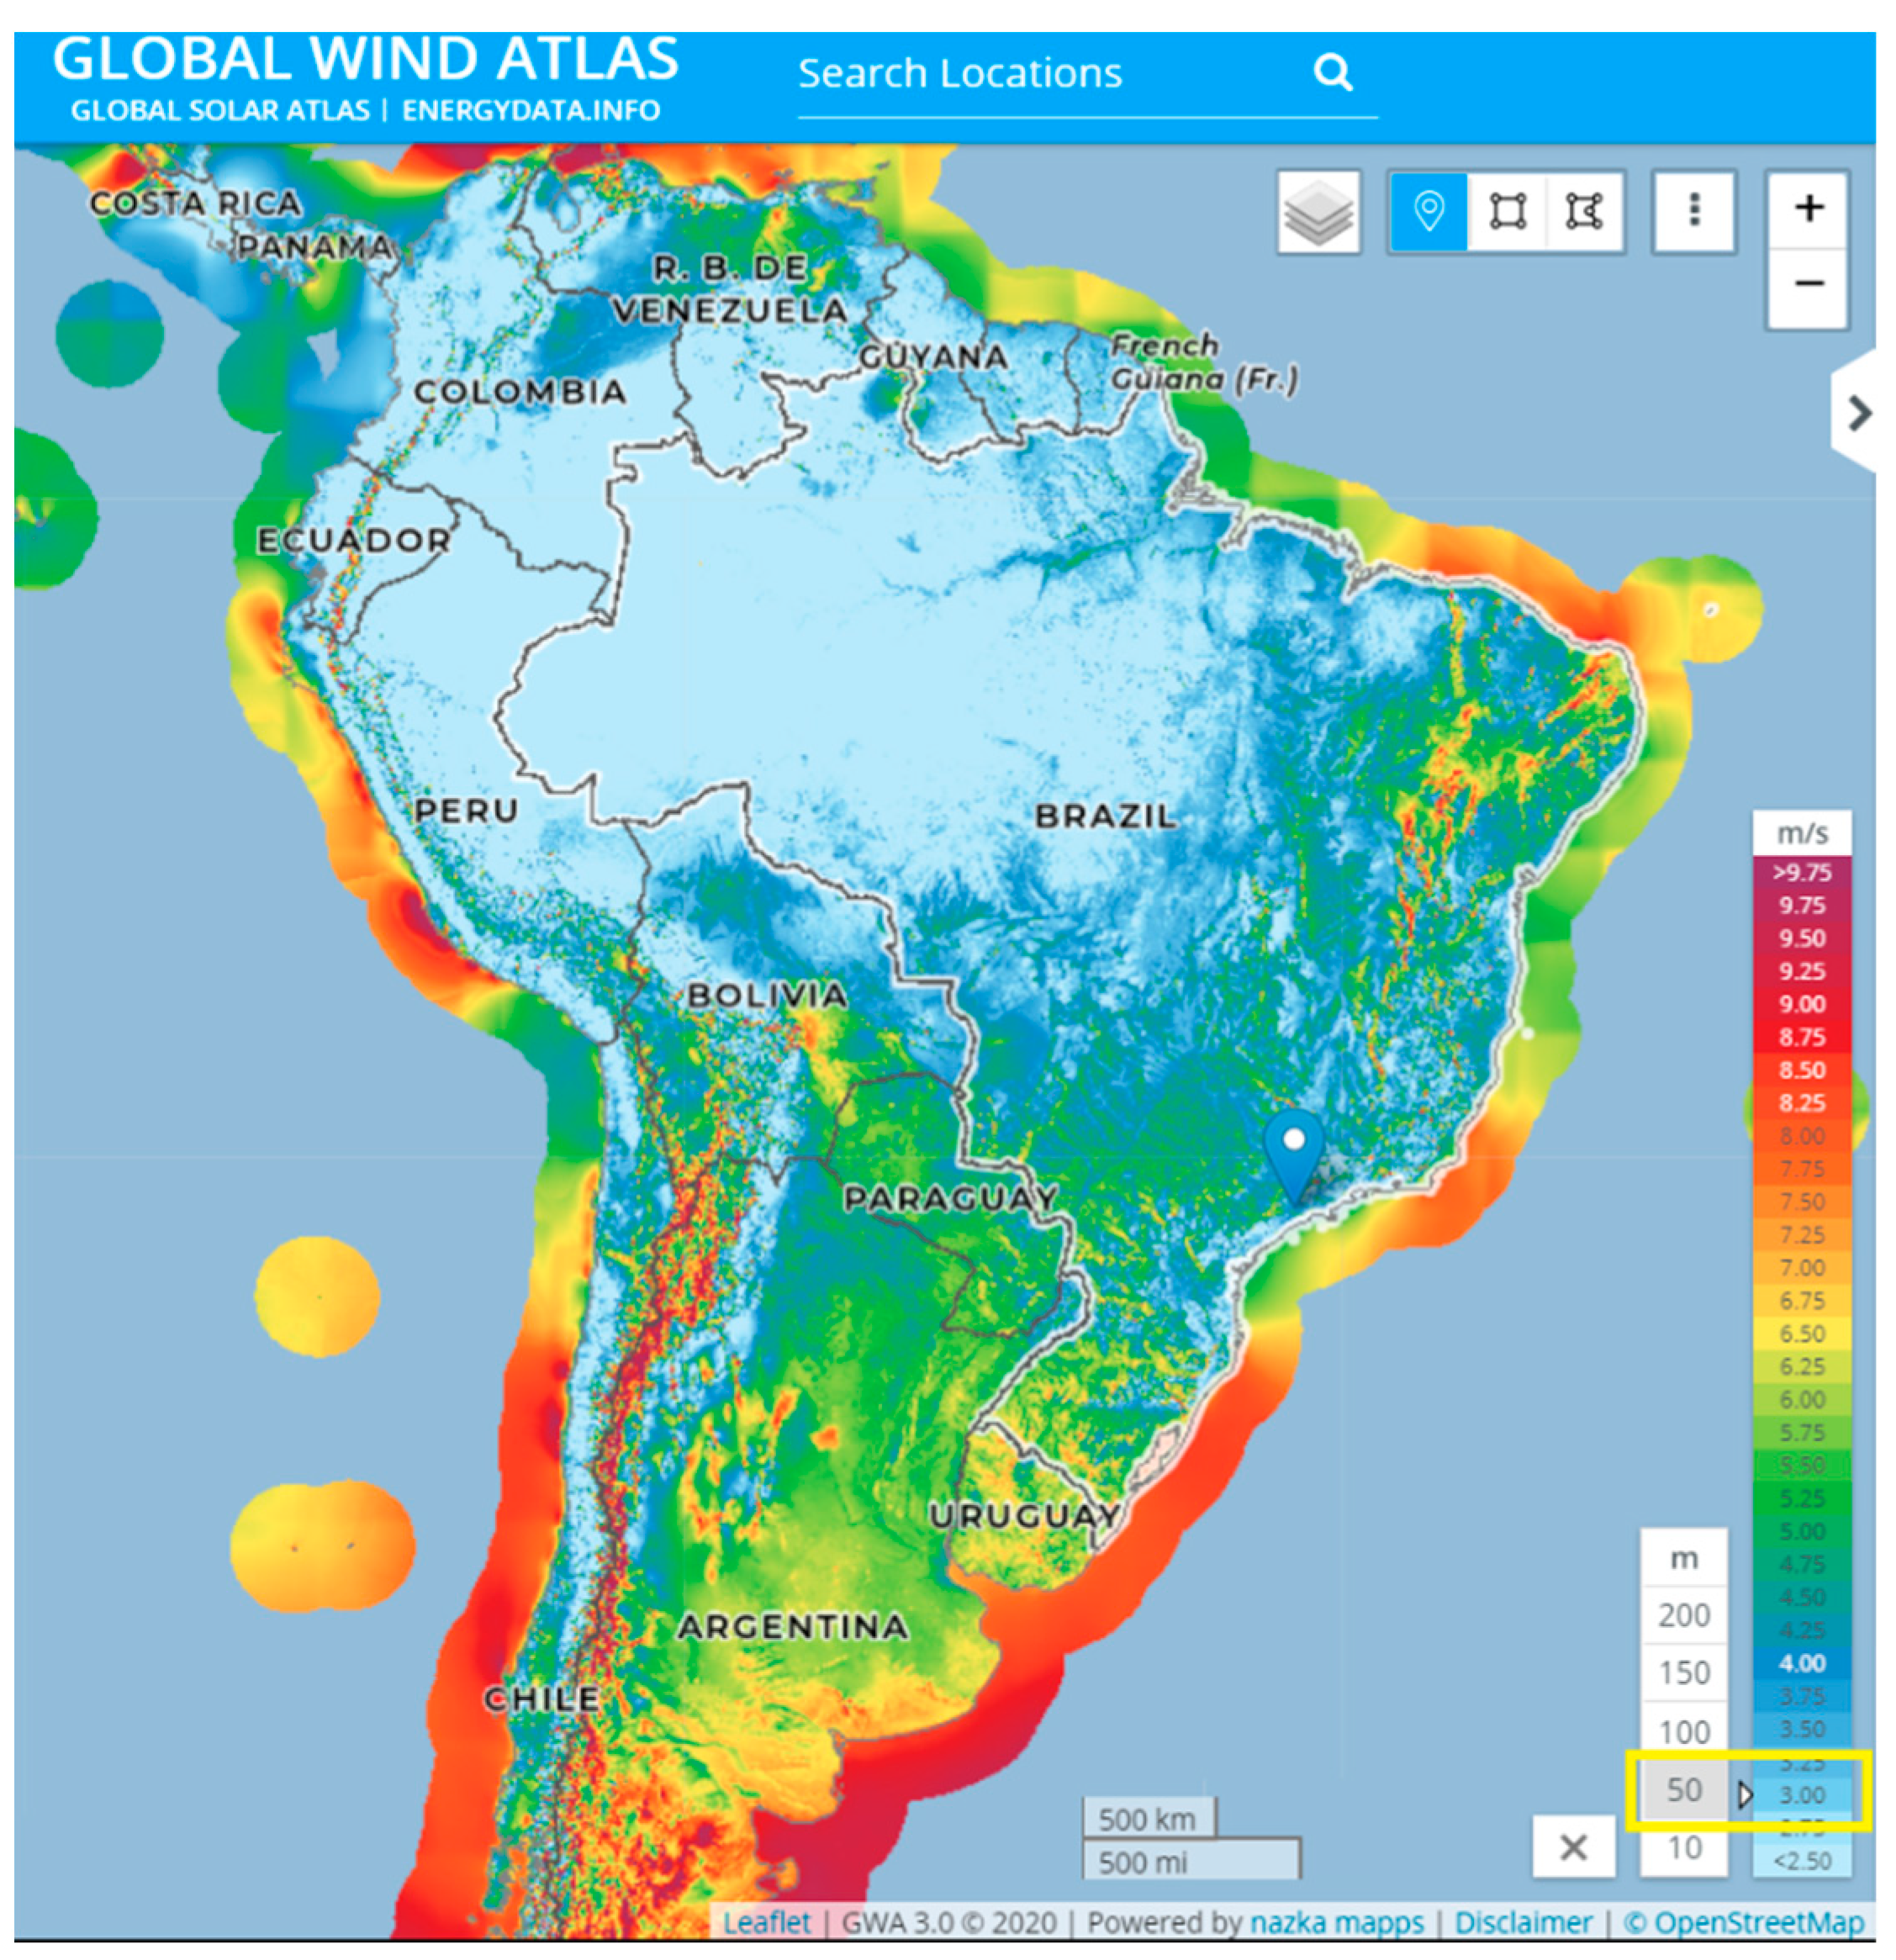
Figure 4 shows a map plotted from [
21]. At the SWT location point (pin), the mean average wind speed at 50 m height is 3 m/s. On the map, colors closer to red indicate locations with wind speeds ranging from ~6 to ~10 m/s, while colors closer to blue correspond to speeds ranging from ~2 m/s to ~6 m/s. It is noted that the coast, especially the Northeast, has excellent wind potential. On the other hand, continental areas such as the Amazon and the Midwest have possibilities of lower magnitude.
Table 1 shows a summary of the main climatology data presented above.
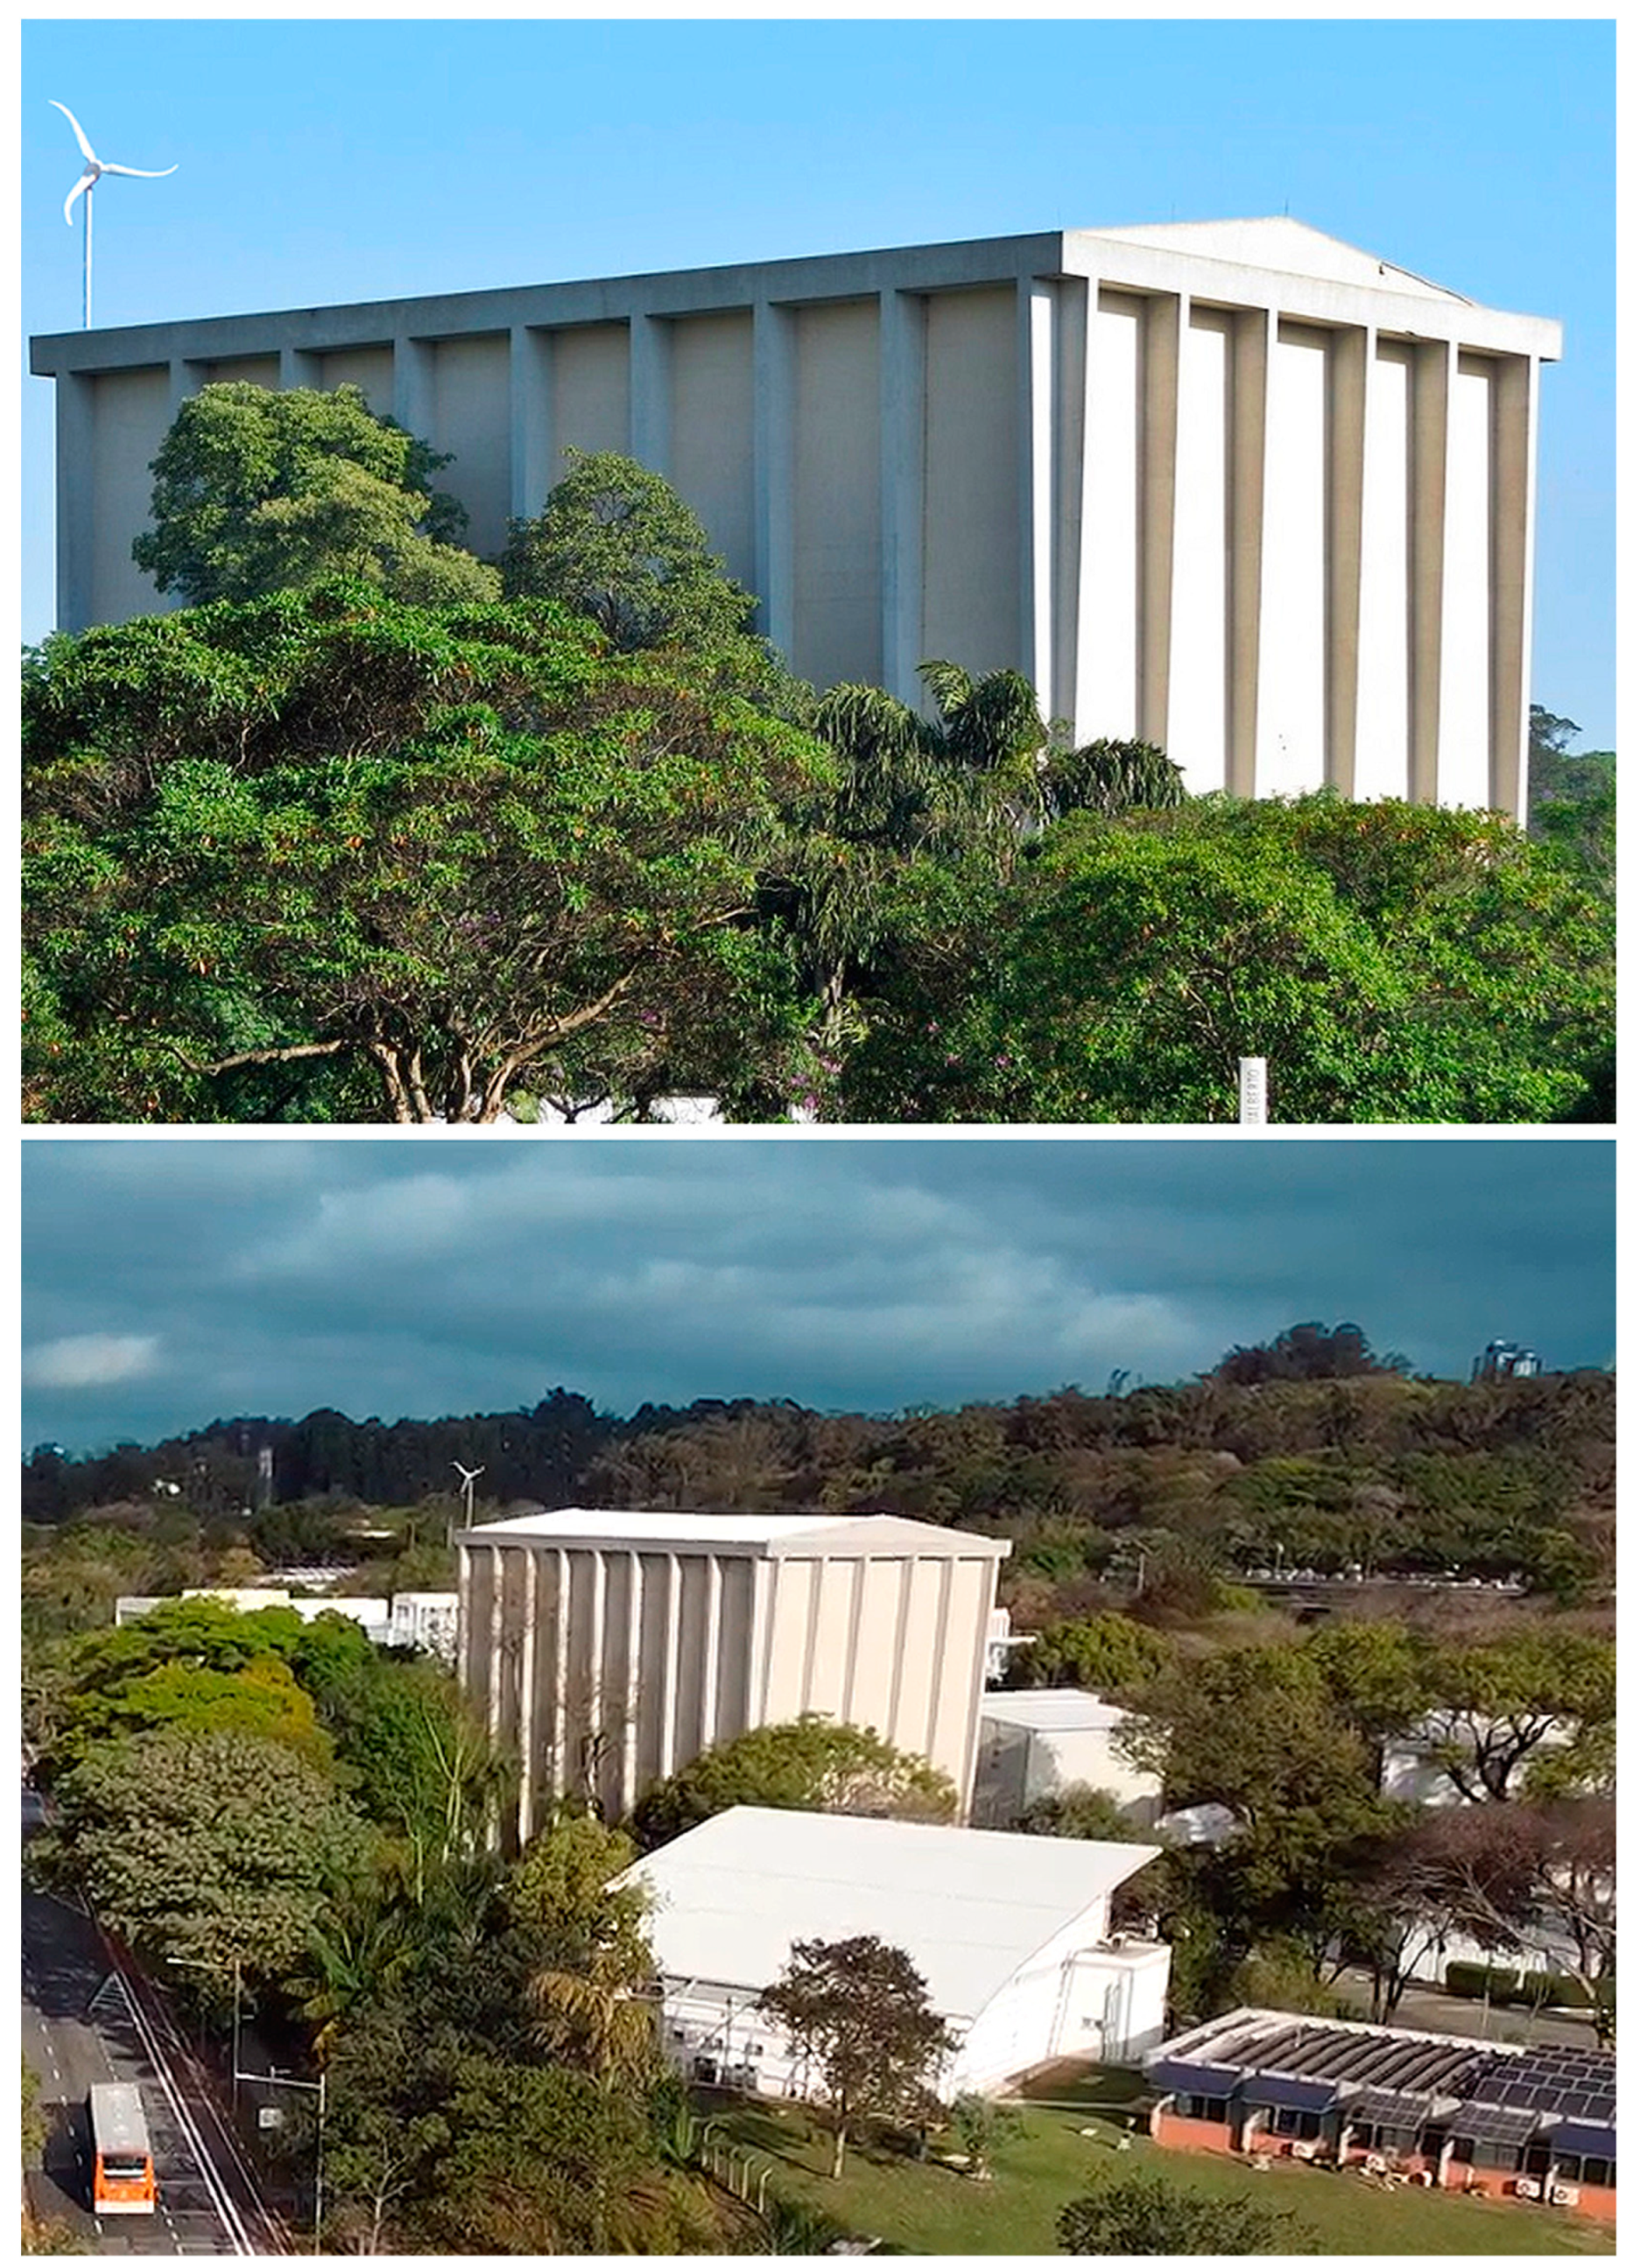
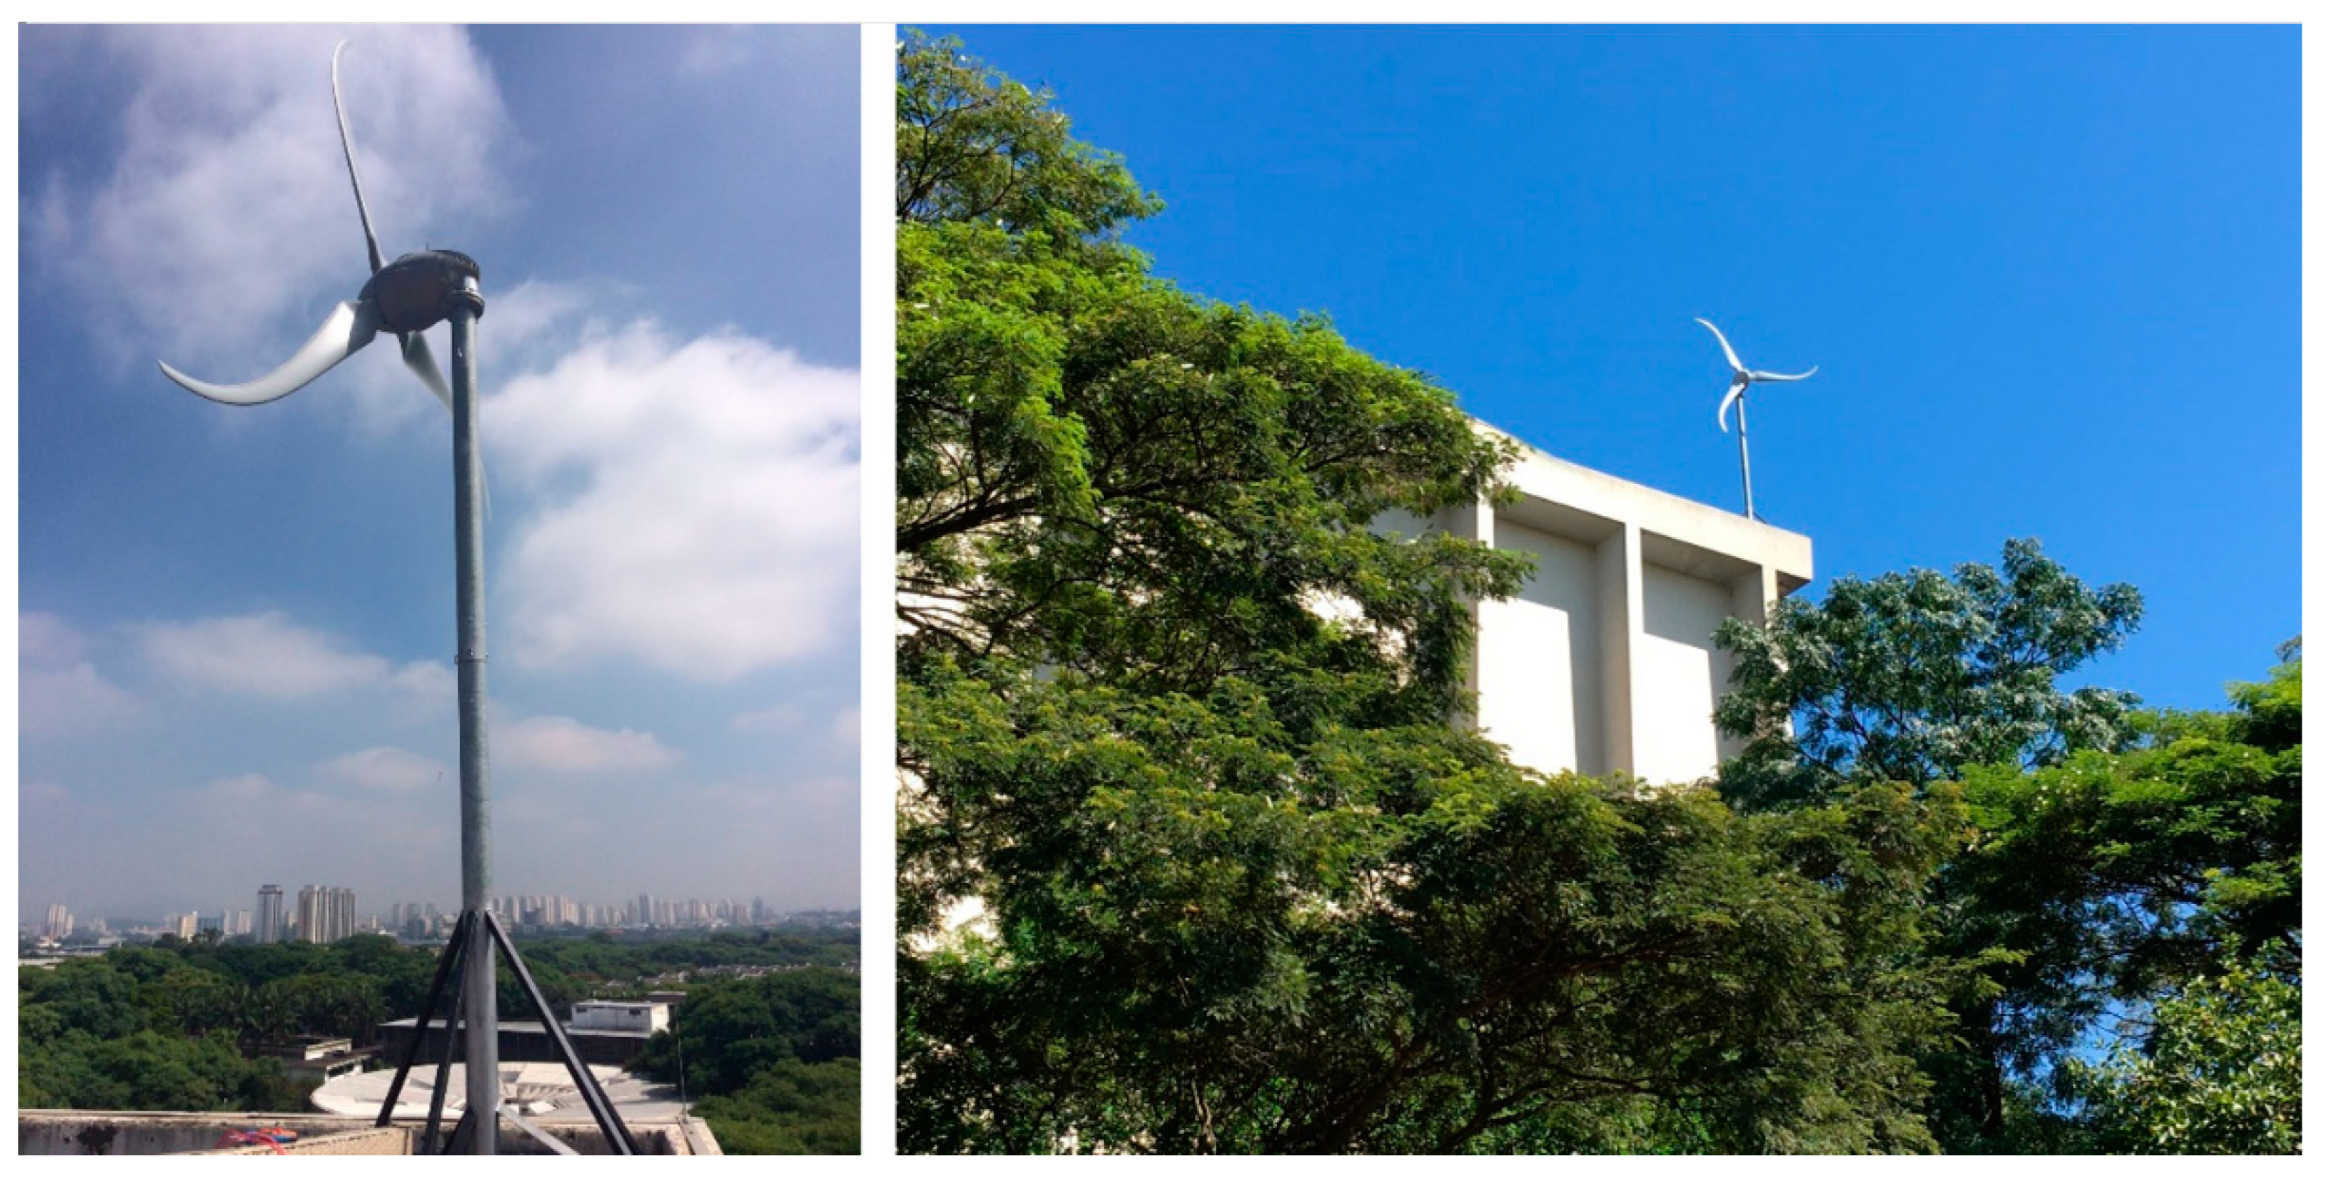
Although low average wind speeds were previously observed, the installation site was selected to take advantage of a relatively tall existing and isolated building, shown in
Figure 5, and involved infrastructure facilities.
The high voltage laboratory building on the campus has a 30 m tall roof and it is on plain terrain, which provides an excellent environment for renewable energy generation.
Figure 5 shows that the building is the tallest nearby. Note the southeast positioning of the SWT, which favors the attack of the most prevalent winds on the SWT blades.
Concurrently,
Figure 5 and
Figure 6 show the upper elevation of the structure compared to the surrounding buildings. The construction is surrounded by trees with around half of the construction height, which tend to somewhat somewhat turbulence and wind drags [
22,
23].
2.2. Local Wind Resource Measurements
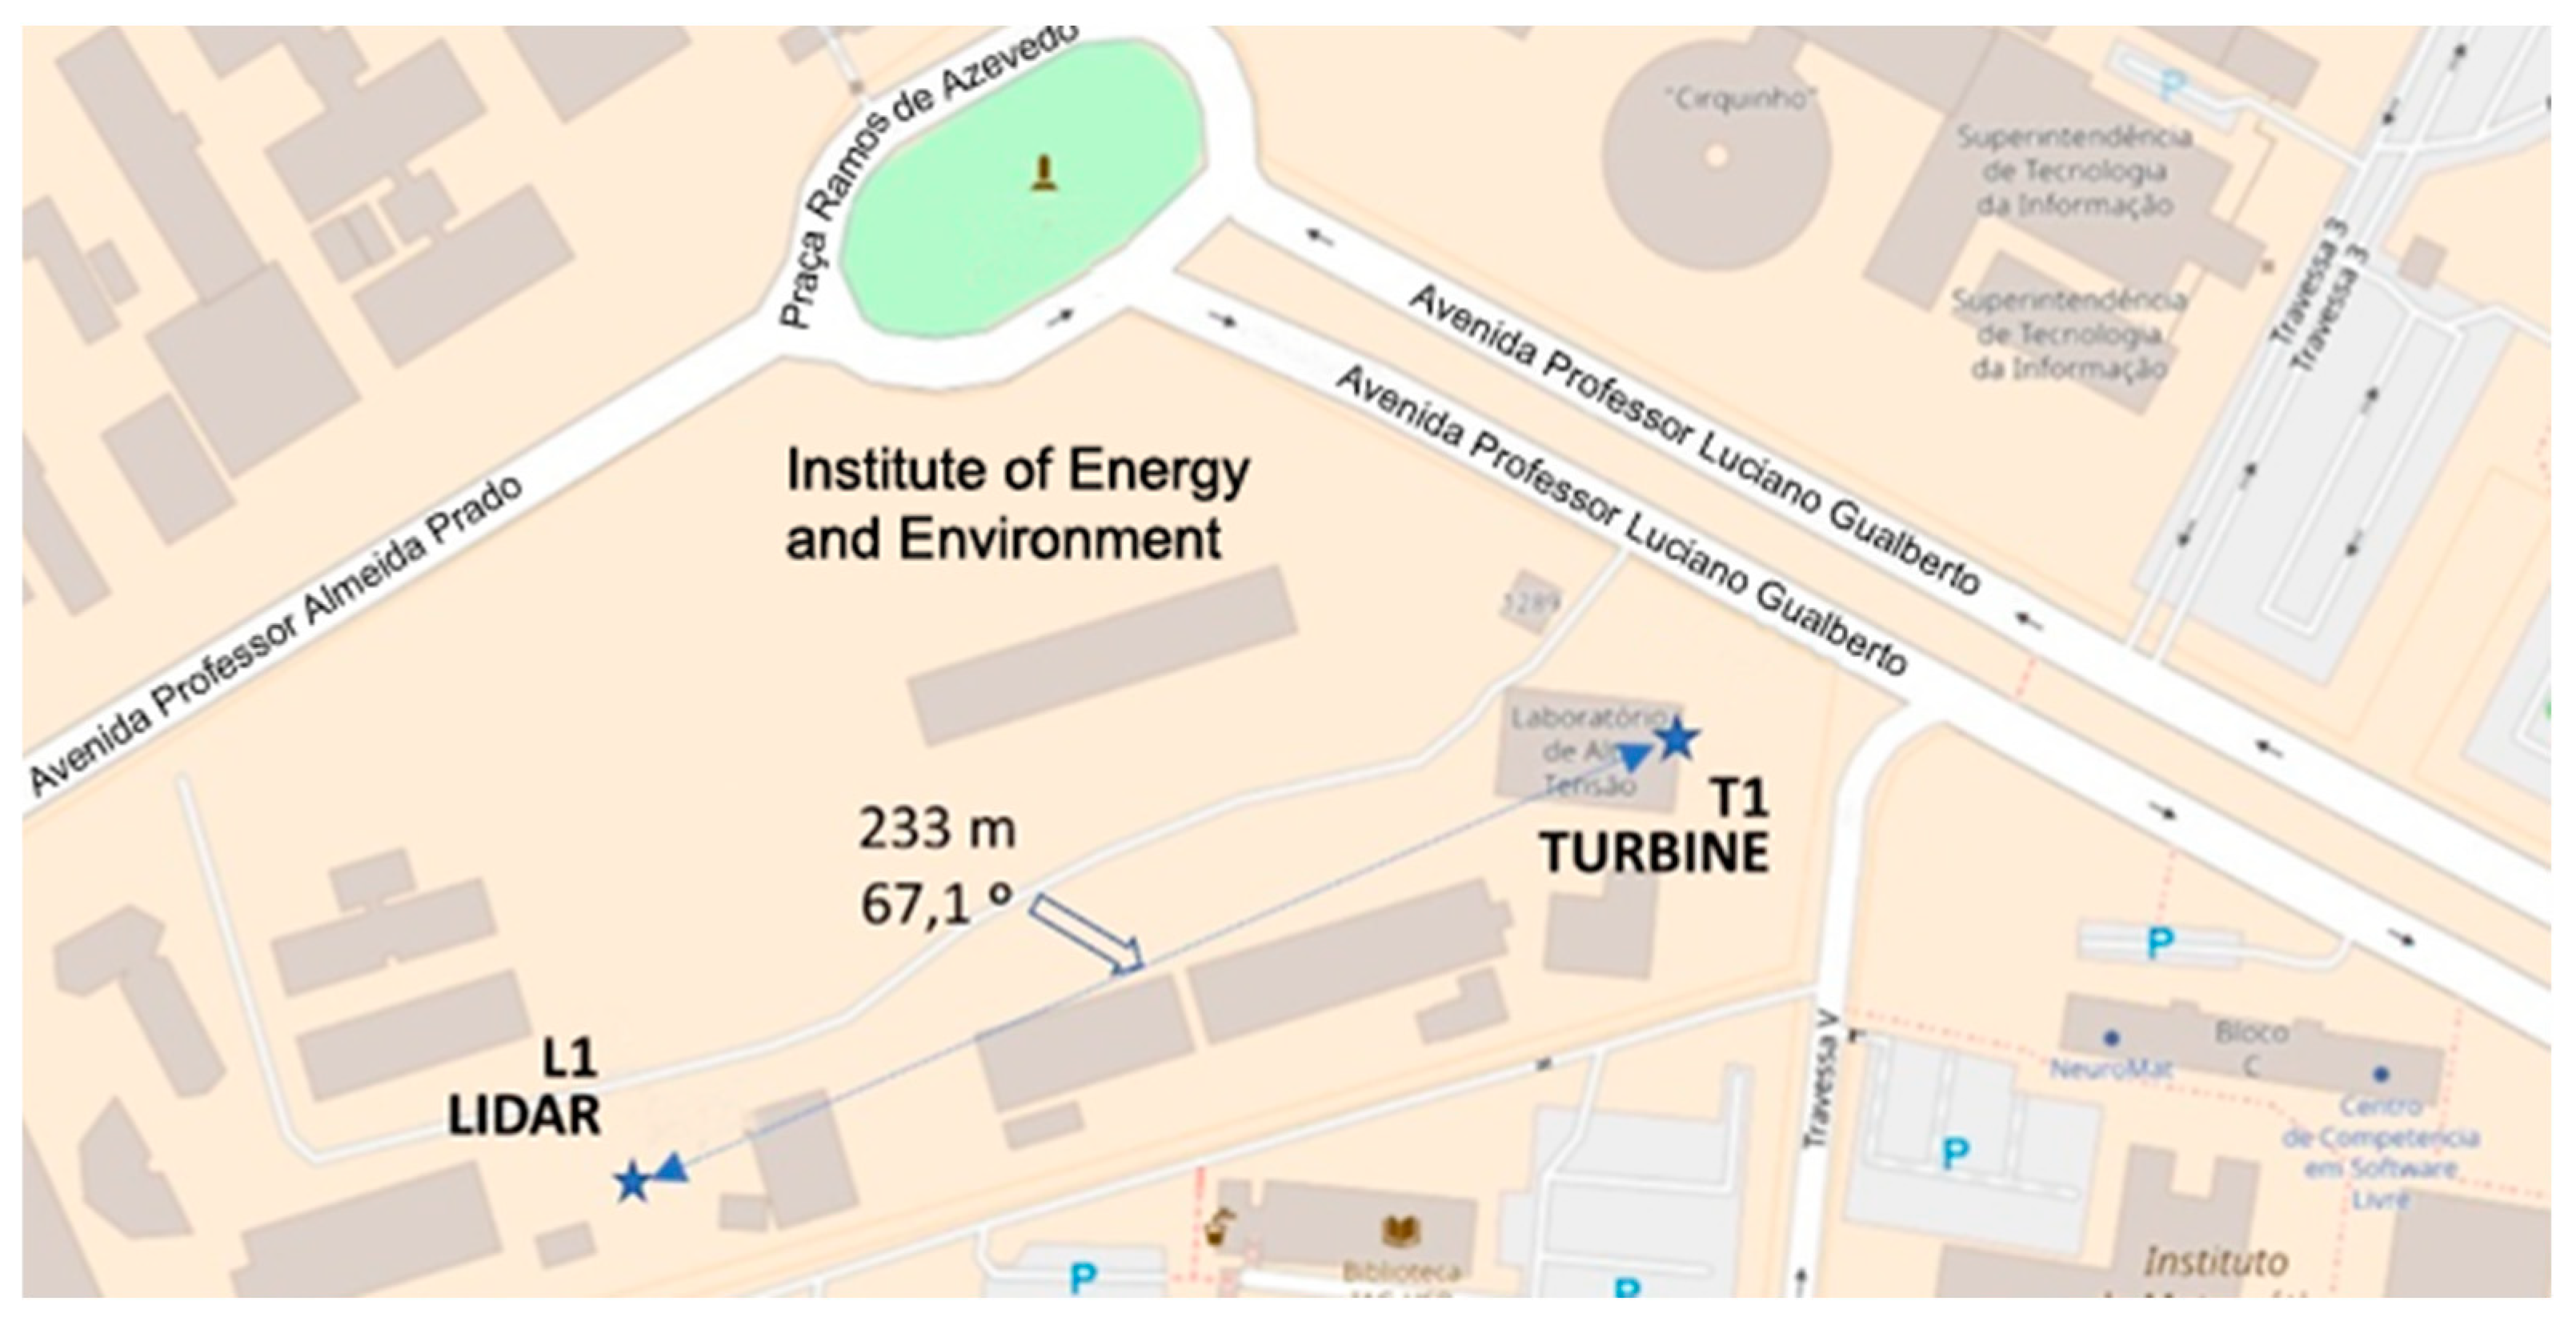
Previous wind measurements with a remote sensing technology LIDAR (Light Detection and Ranging) sensor, from December 2015 to January 2018, were recorded in a fixed location about 230 m away from the wind turbine installation point, show in
Figure 7. This remote sensor provides vertical height wind measurements, from 40 m to 290 m, stepped in 12 heights. Thus, wind profile mapping and several associated parameters can be achieved.
Wind resource assessments have been made using the Windographer
® software [
26] (AWS Truepower—UL Company, Albany, NY, USA) and WindPro
® software [
27] (EMD International A/S, Aalborg, Denmark). Windographer
® is a wind data analysis program. It reads various data files and allows for visualization, quality control, and datasets analysis. Windpro
® is suitable for the project design of wind farms, and regional resource mapping and feasibility analysis [
28,
29,
30,
31,
32].
The wind data were measured by Windcube
® Light Detection and Ranging (Lidar) [
33] (Leosphere, Orsay, France).
The wind measurement point used is in São Paulo University, latitude −23.558923 and longitude −46.735042, about 233 m (67°) distant from the SWT building. The 10 min interval registration and 12 heights (from 40 to 290 m height) of wind speeds from 6 December 2015 16:00 to 3 January 2018 00:00 (31 months, n = 21,280,704) were used to calculate the monthly mean wind speeds and approximate the annual wind profile of the SWT.
The power-law exponent, or wind profile power law [
34] (sometimes called the power-law coefficient or only ‘alpha’), is the rate at which wind speed changes with height above ground. The power-law parameter states the variation of wind speed by height above ground according to the following equation:
where:
z is the effective height above ground [m];
U(
z) is the wind speed [m/s] at some effective height
z;
β is a constant, and
α is the power-law exponent (alpha).
For data sets containing wind speeds at two or more heights above ground, Windographer
® calculates the power-law exponent that best fits the vertical wind speed profile. If one takes the natural logarithm of both sides of the power-law equation above:
Equation (3) is in the general slope-intercept form: y = mx + b, the slope is equal to the power-law exponent α, and the intercept equal to ln (β).
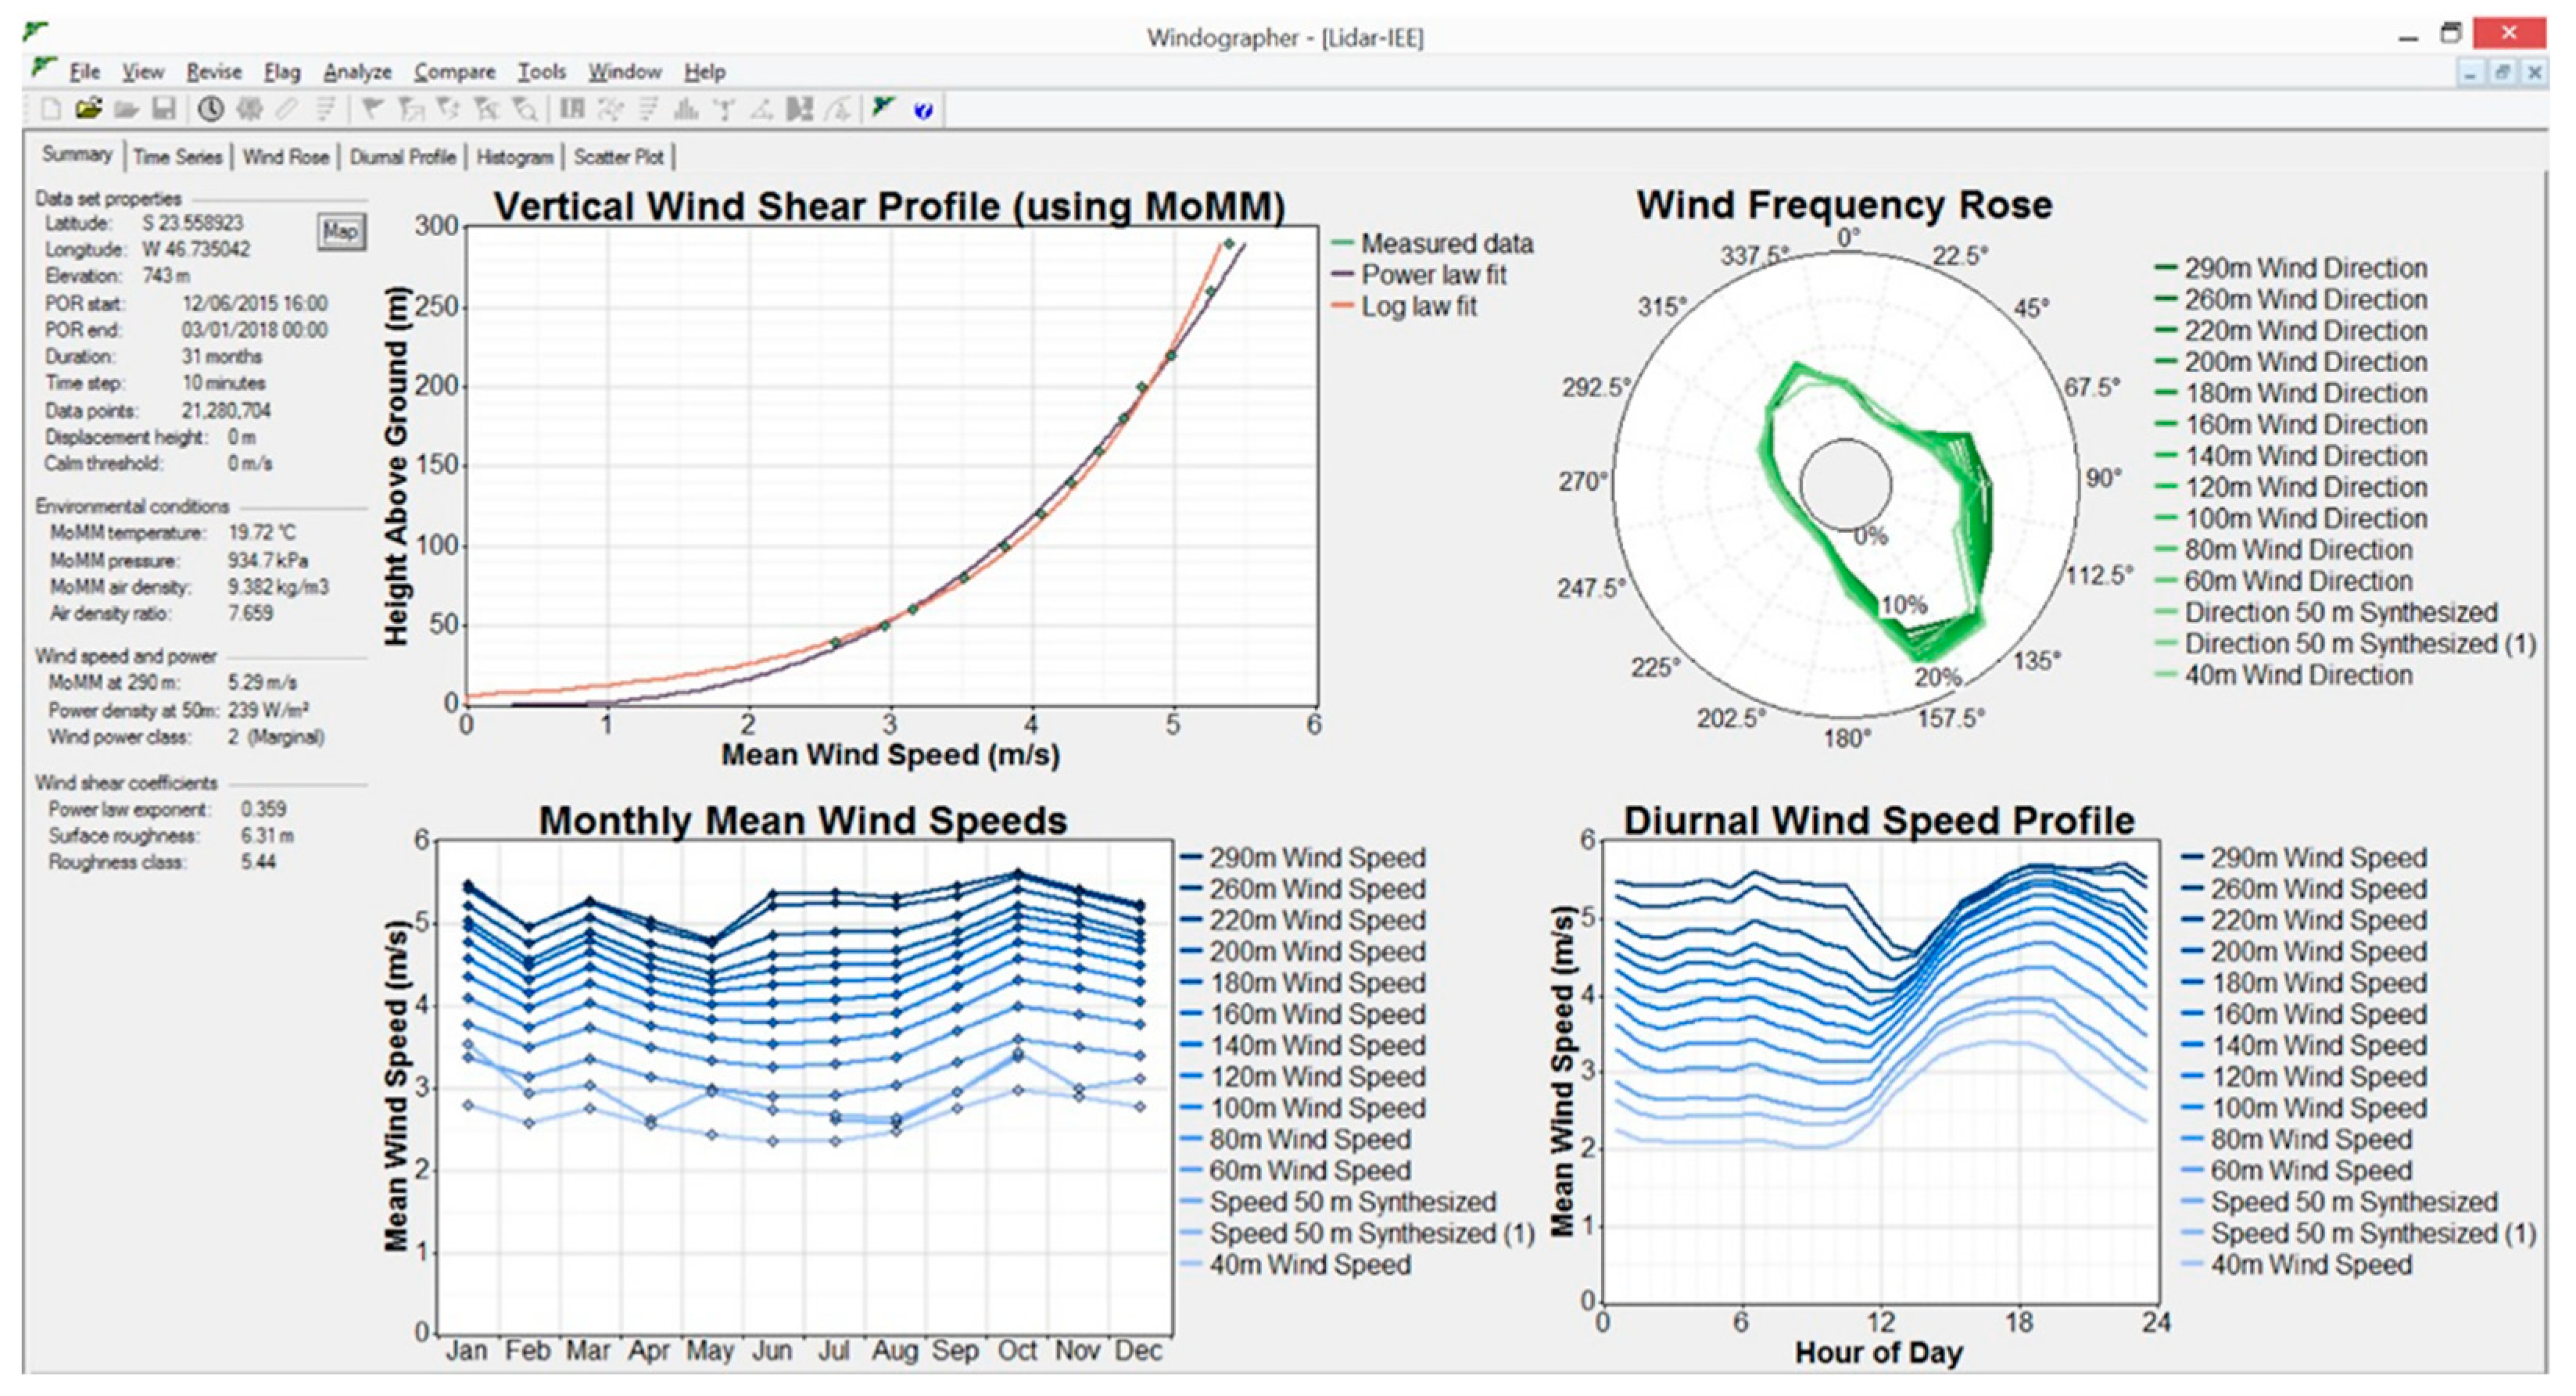
From the dataset measured at 12 heights, Windographer
® has calculated the power-law exponent
α as 0.359 (related to the wind shear and ground roughness).
Figure 8 shows a screen-capture of the software, where the wind profiles for different heights and the wind of roses, the vertical wind shear profile, and the calculated power-law exponent coefficient are shown.
The summary of wind measurement results are presented in
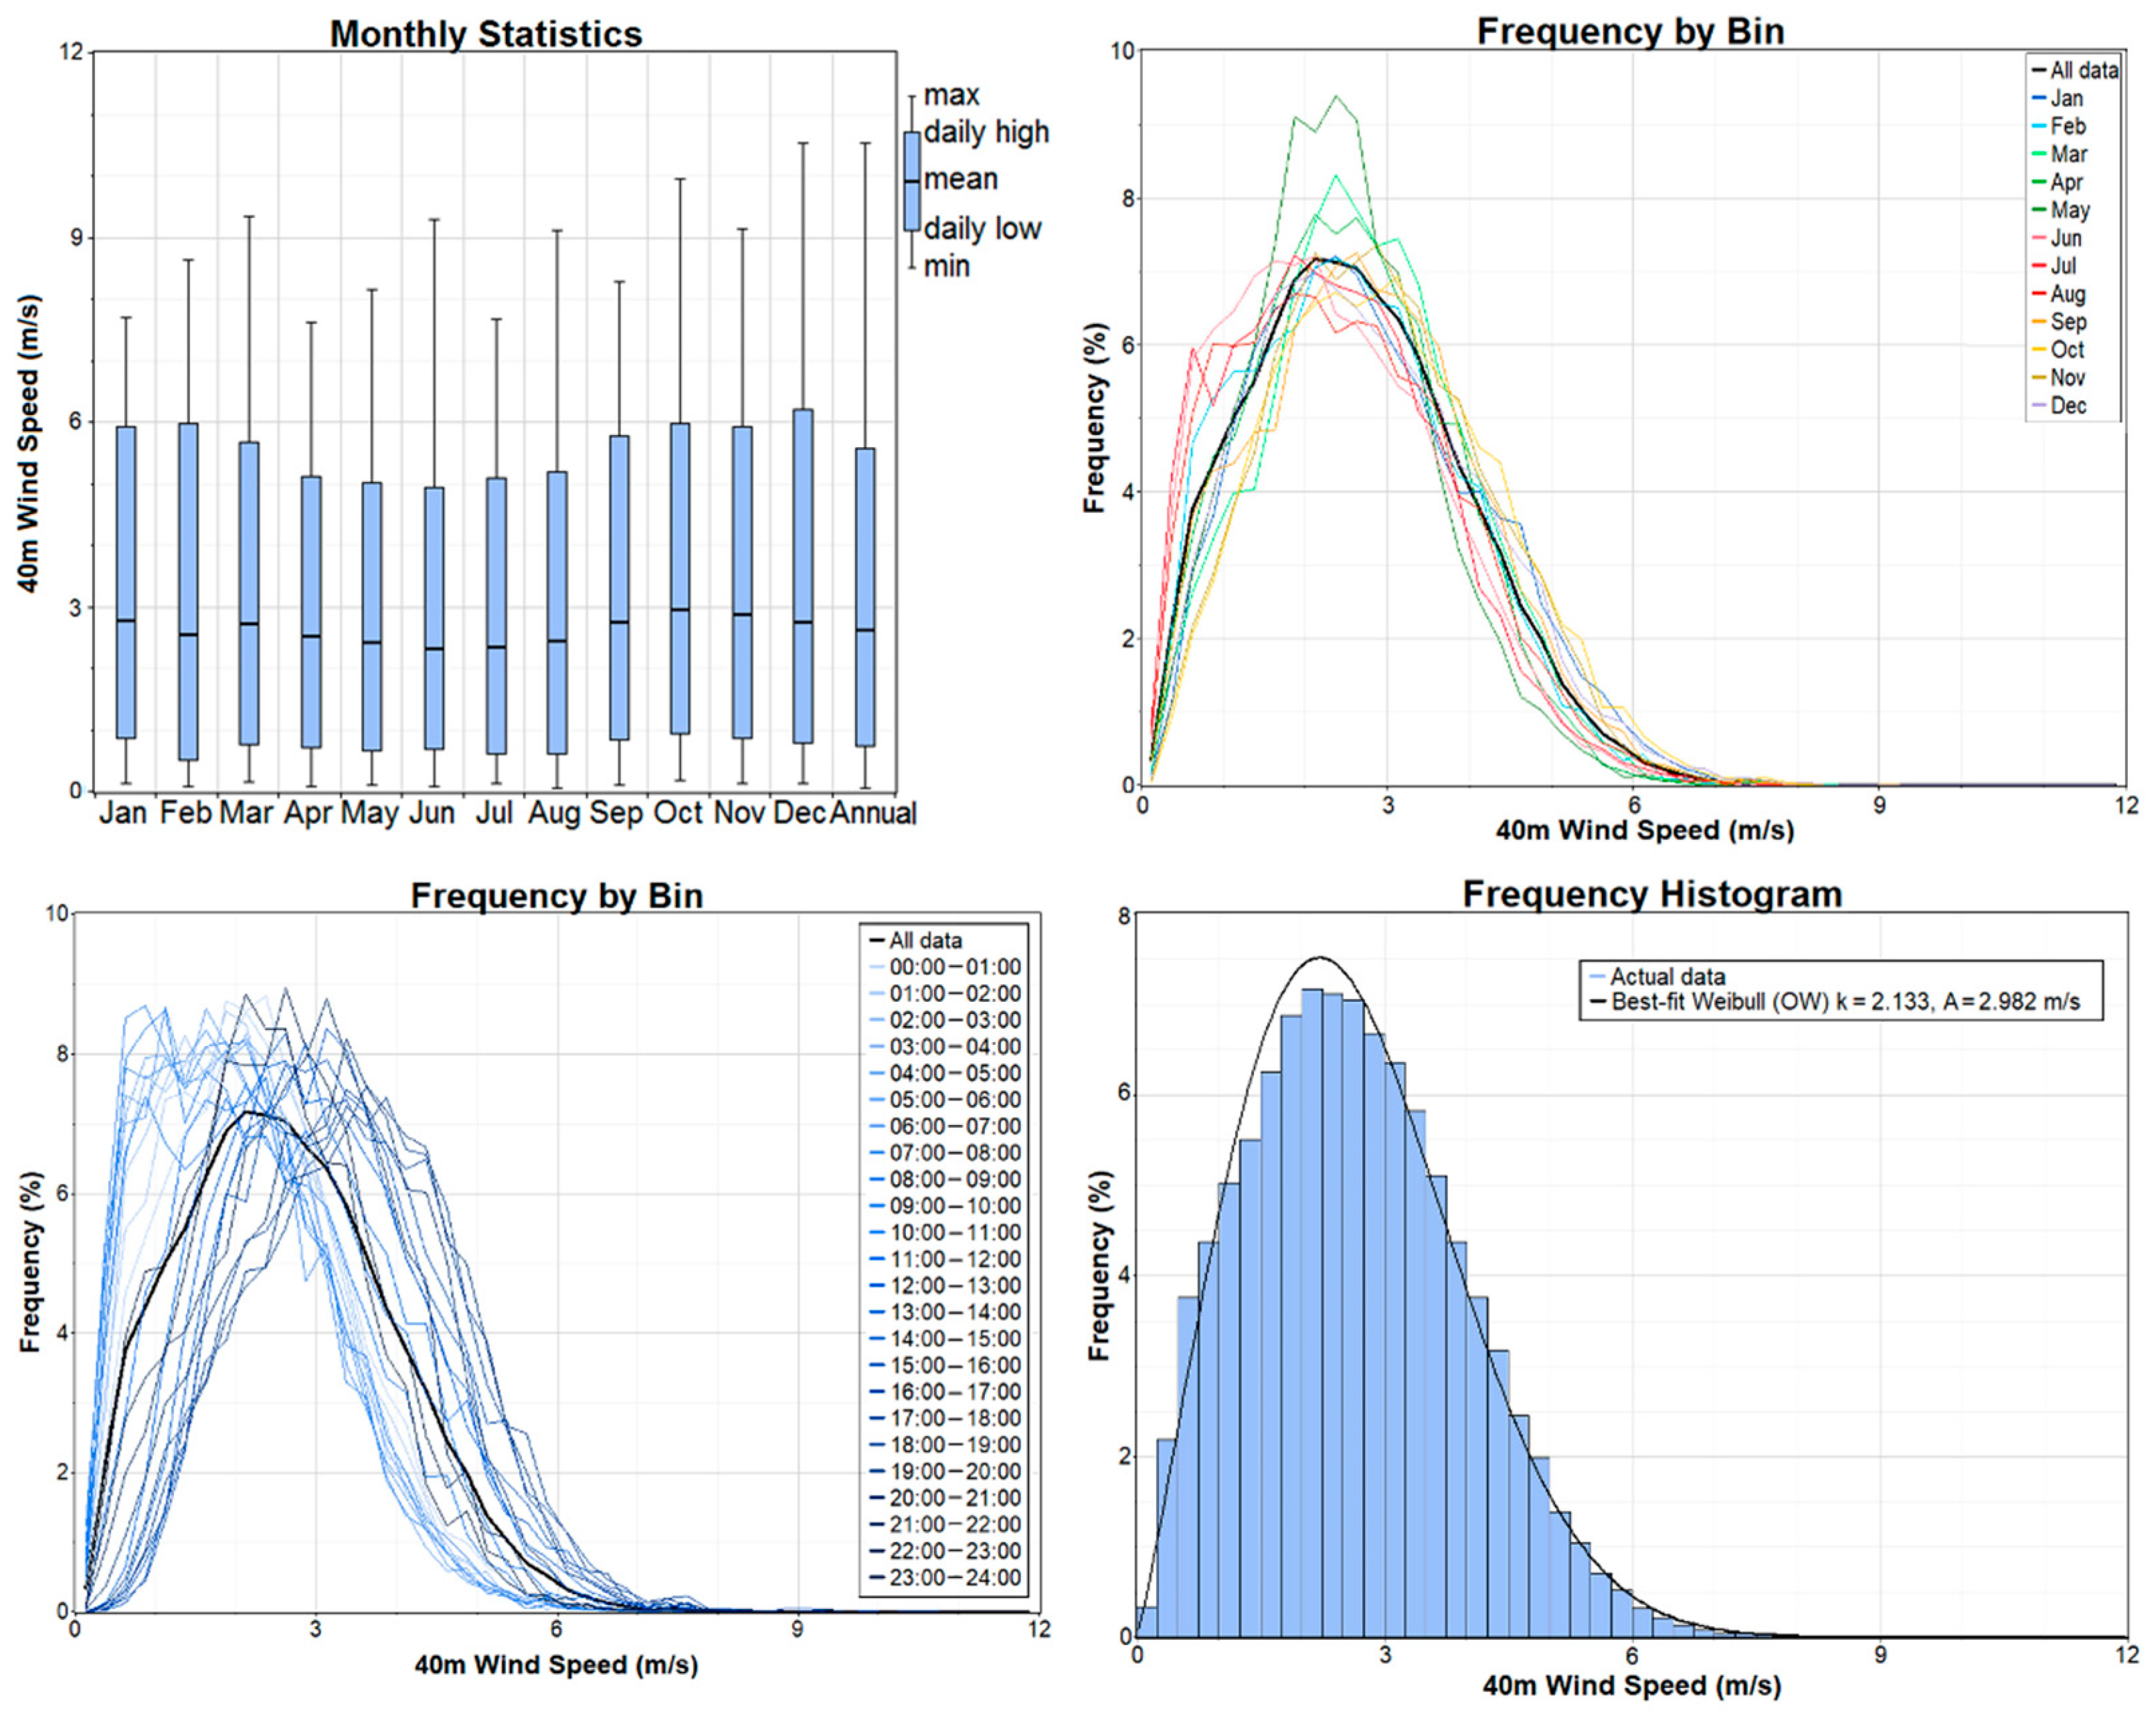
Table 2, highlighting the 40 m data because it is the closest height value to the wind turbine’s operating height. The Mean of Monthly Means (MoMM) wind speed at 40 m is 2.645 m/s, which is the value selected for the annual energy production estimation.
Figure 9 shows wind statistics, monthly and hourly distribution frequencies, and the overall frequency of wind speeds measured by the Lidar sensor with the corresponding Weibull distribution fitting.
2.3. Fitting and Building Installation
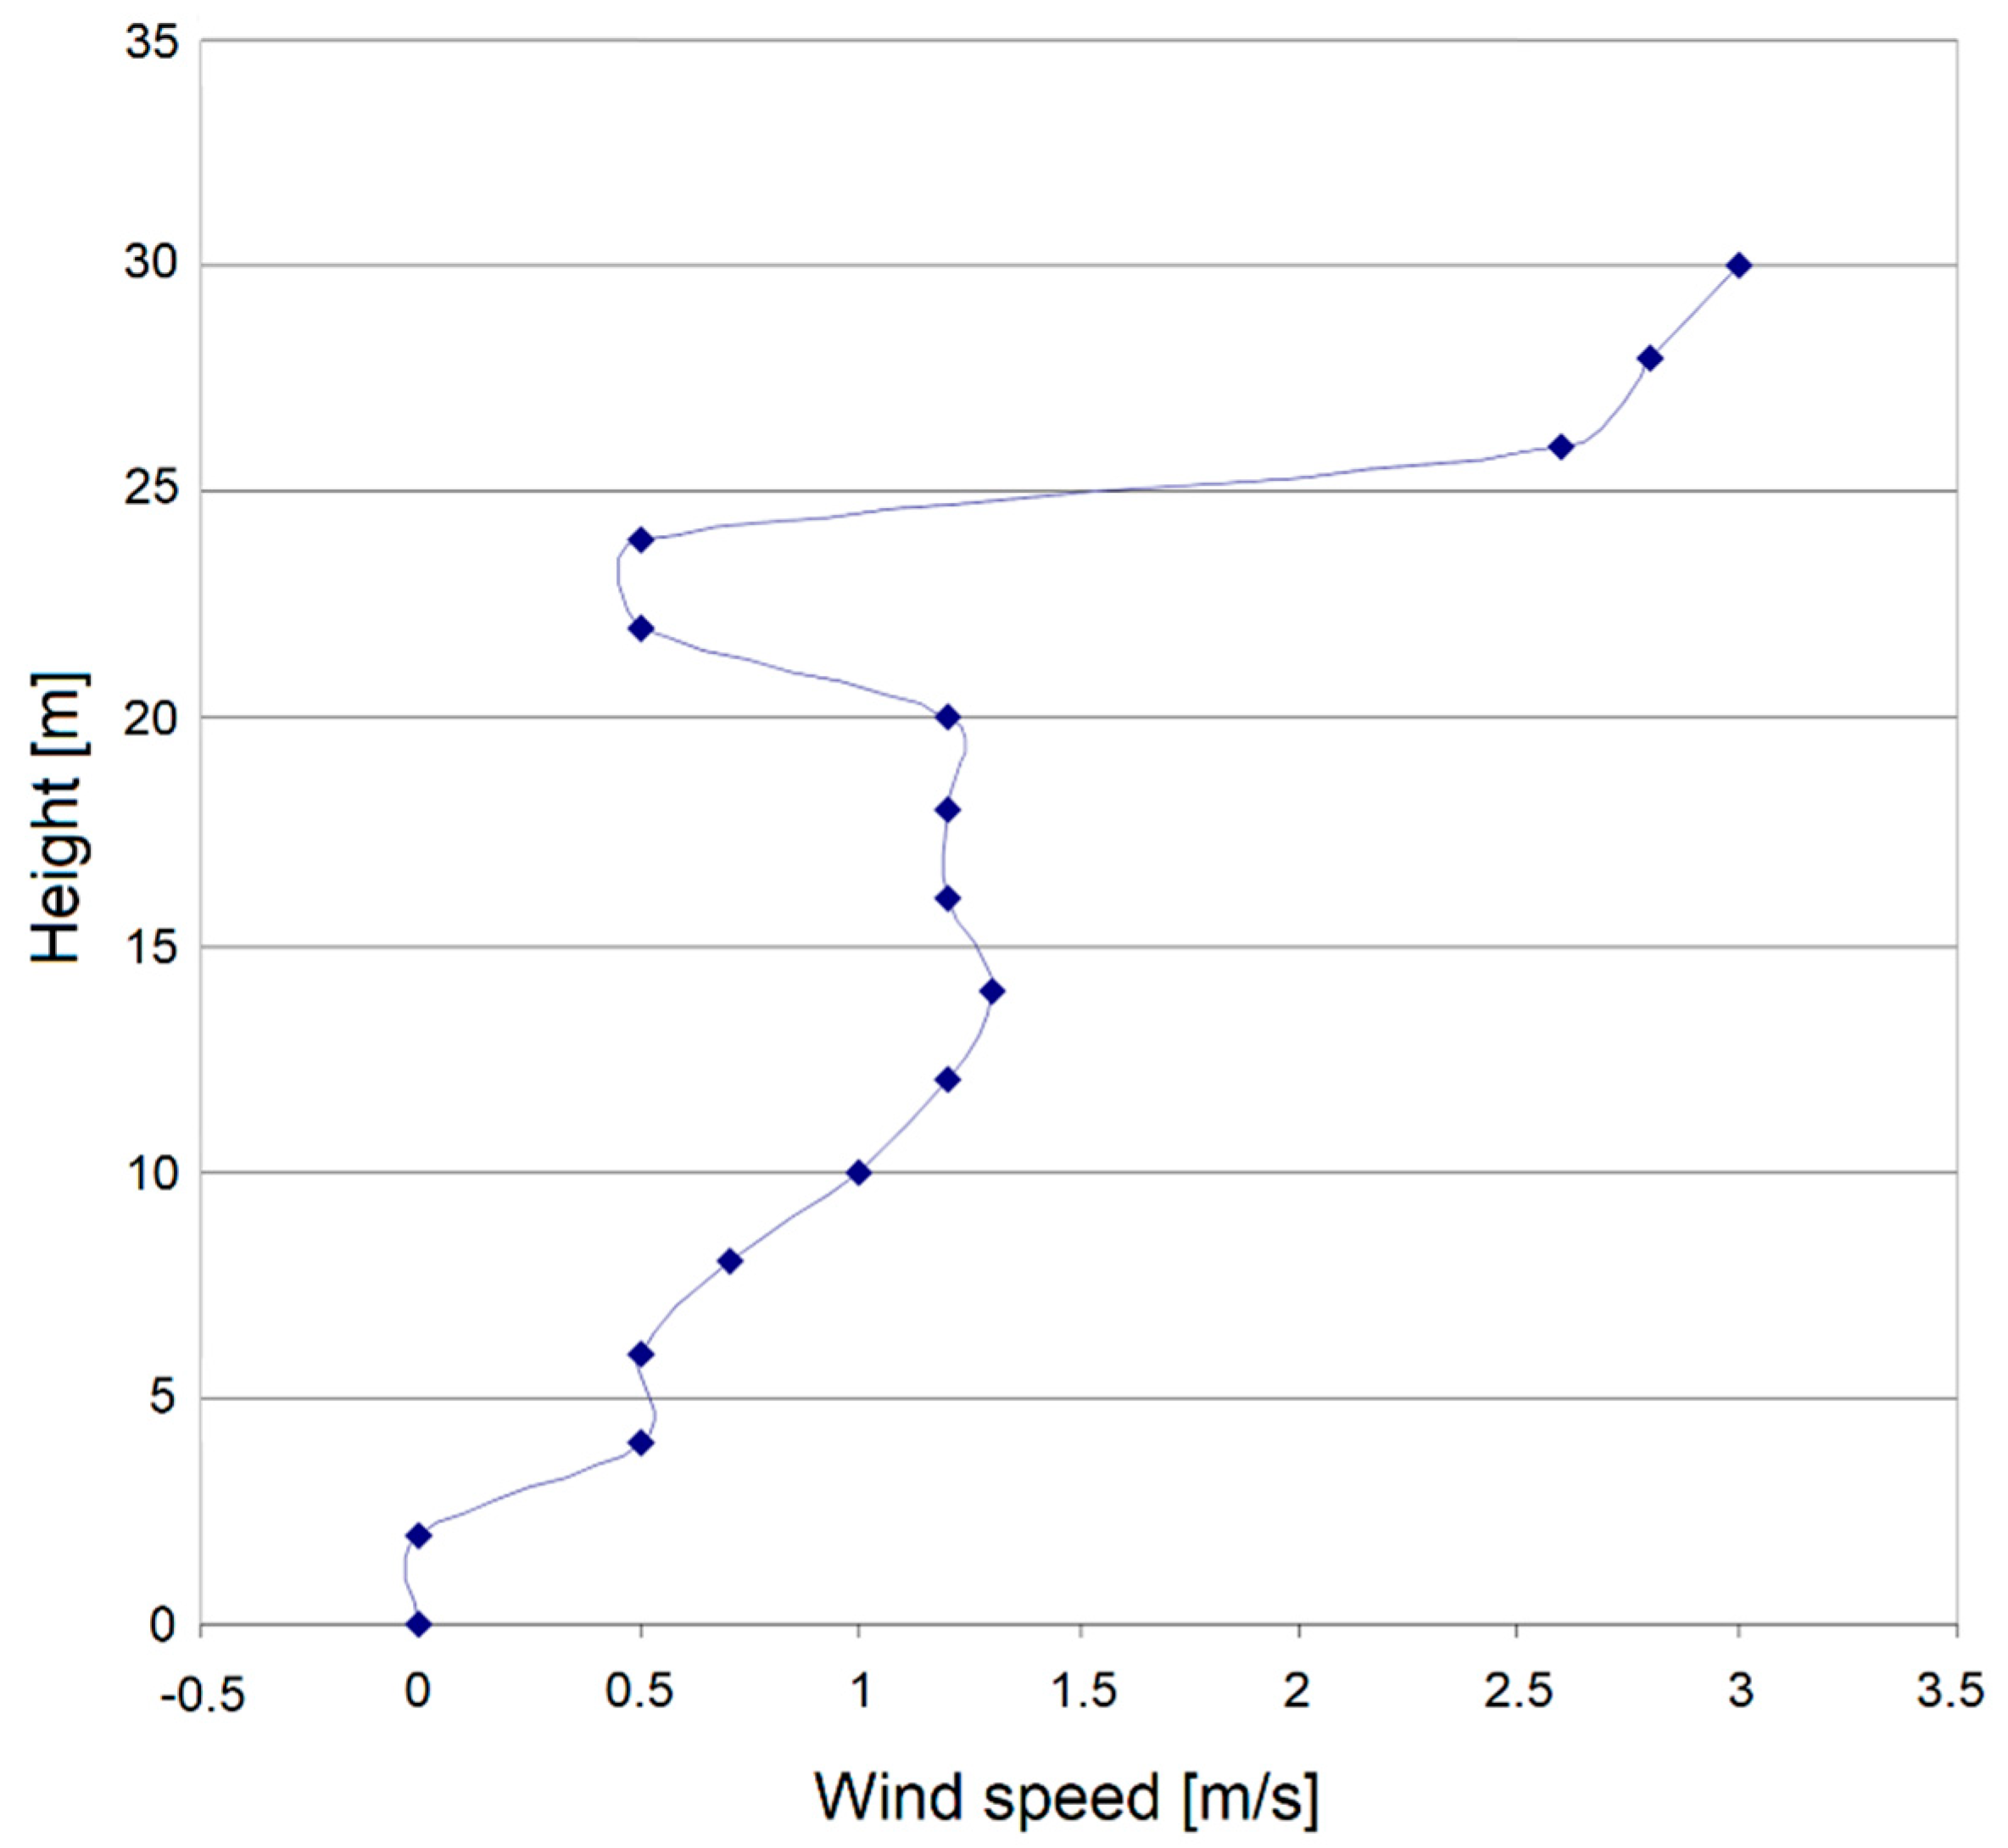
The SWT must be installed properly due to the wind disturbance from surrounding areas and the building itself. Along with its structure, the wind loses or gains speed magnitude. As an illustration,
Figure 10 shows the wind speed profile, calculated through computational fluid dynamic (CFD) simulation in [
35], performed near a 23 m height building surrounded by other constructions. A sudden drop in wind speed can be observed, depending on the height of the adjacent buildings and there is an increase in speed above the height of 26 m (i.e., outside the disturbed area), where the absence of turbulence stands out.
Thus, despite the implementation in this study not presenting the critical situation of many surrounding buildings as in [
35], the heights and profile of the structures are quite similar and the same approach was used for selecting the implantation height. The SWT positioning was carried out to avoid the region of wind speed reduction close to building edge borders. The nacelle was fitted using a 5 m mast to maximize the wind speeds by leaving the rotor outside the expected region of more severe disturbance promoted by the building edges. Therefore, the final operation height is 35 m.
It is also worth noting that the distance from the closest building to the IEE-USP is about 90 m, which favors higher wind speeds (d/h > 1.5 d-distance and h-height).
Figure 11 shows a closer view of the definitive implantation on the building.
The grid connection was performed directly on the internal building installation. The wiring is formed by 2 phases (127 V), neutral and ground wire (TN earthing system).
A connection and protection box were installed between the turbine and the low voltage installation, containing a safety disconnect switch, short-circuit, and overload protection circuit breakers surge protective devices (phases-to-ground).
2.4. Small Wind Turbine Characteristics
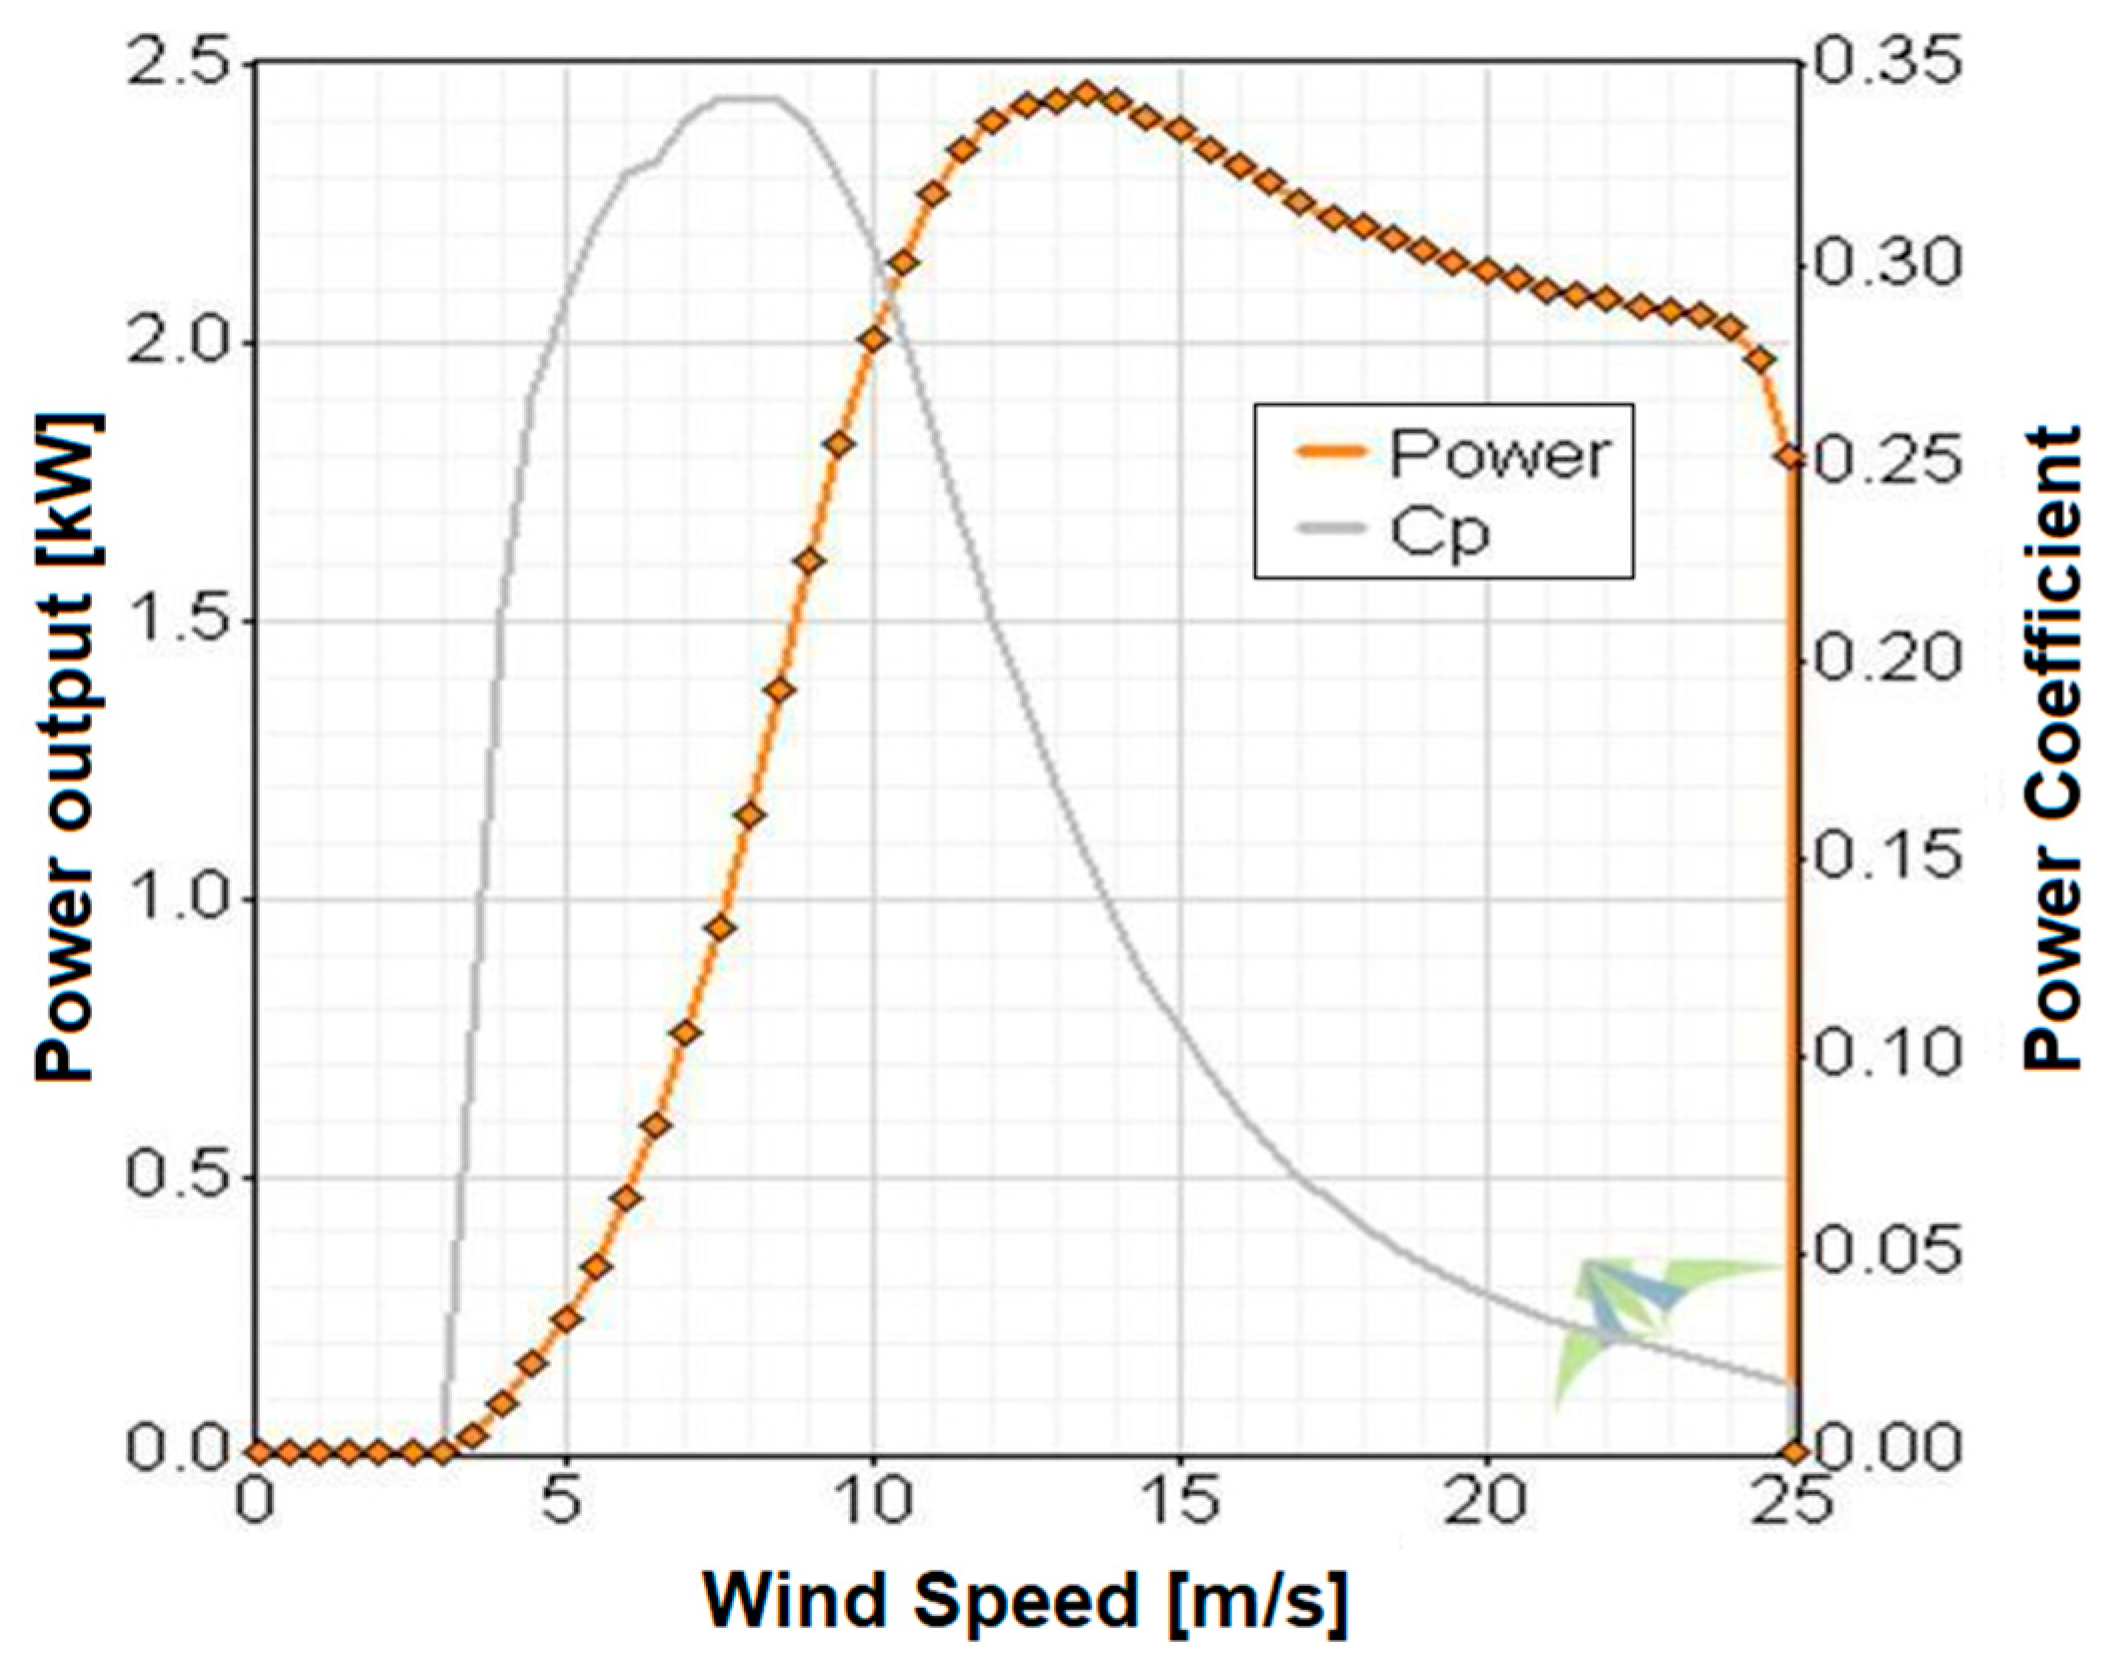
The turbine model Skystream® 3.7’s main characteristics are a horizontal axis type with electronic stall regulation and passive yaw control. The alternator is a slotless, brushless permanent magnet, and an inverter with a built-in direct grid connection and non-island operation. The rotor is comprised of three fiberglass-reinforced composite blades 3.72 m in diameter, resulting in 10.87 m2 of swept area.
Figure 12 shows the turbine’s Power and Cp (Power Coefficient) curves. The cut-in wind speed is 3.0 m/s, the rated wind speed is 9.0 m/s, and the maximum power output is 2.4 kW [
26].
2.5. Energy Yield Prediction
The energy yield and annual energy production assessment can be performed based on the wind measurement statistics and the SWT’s power curve characteristics.
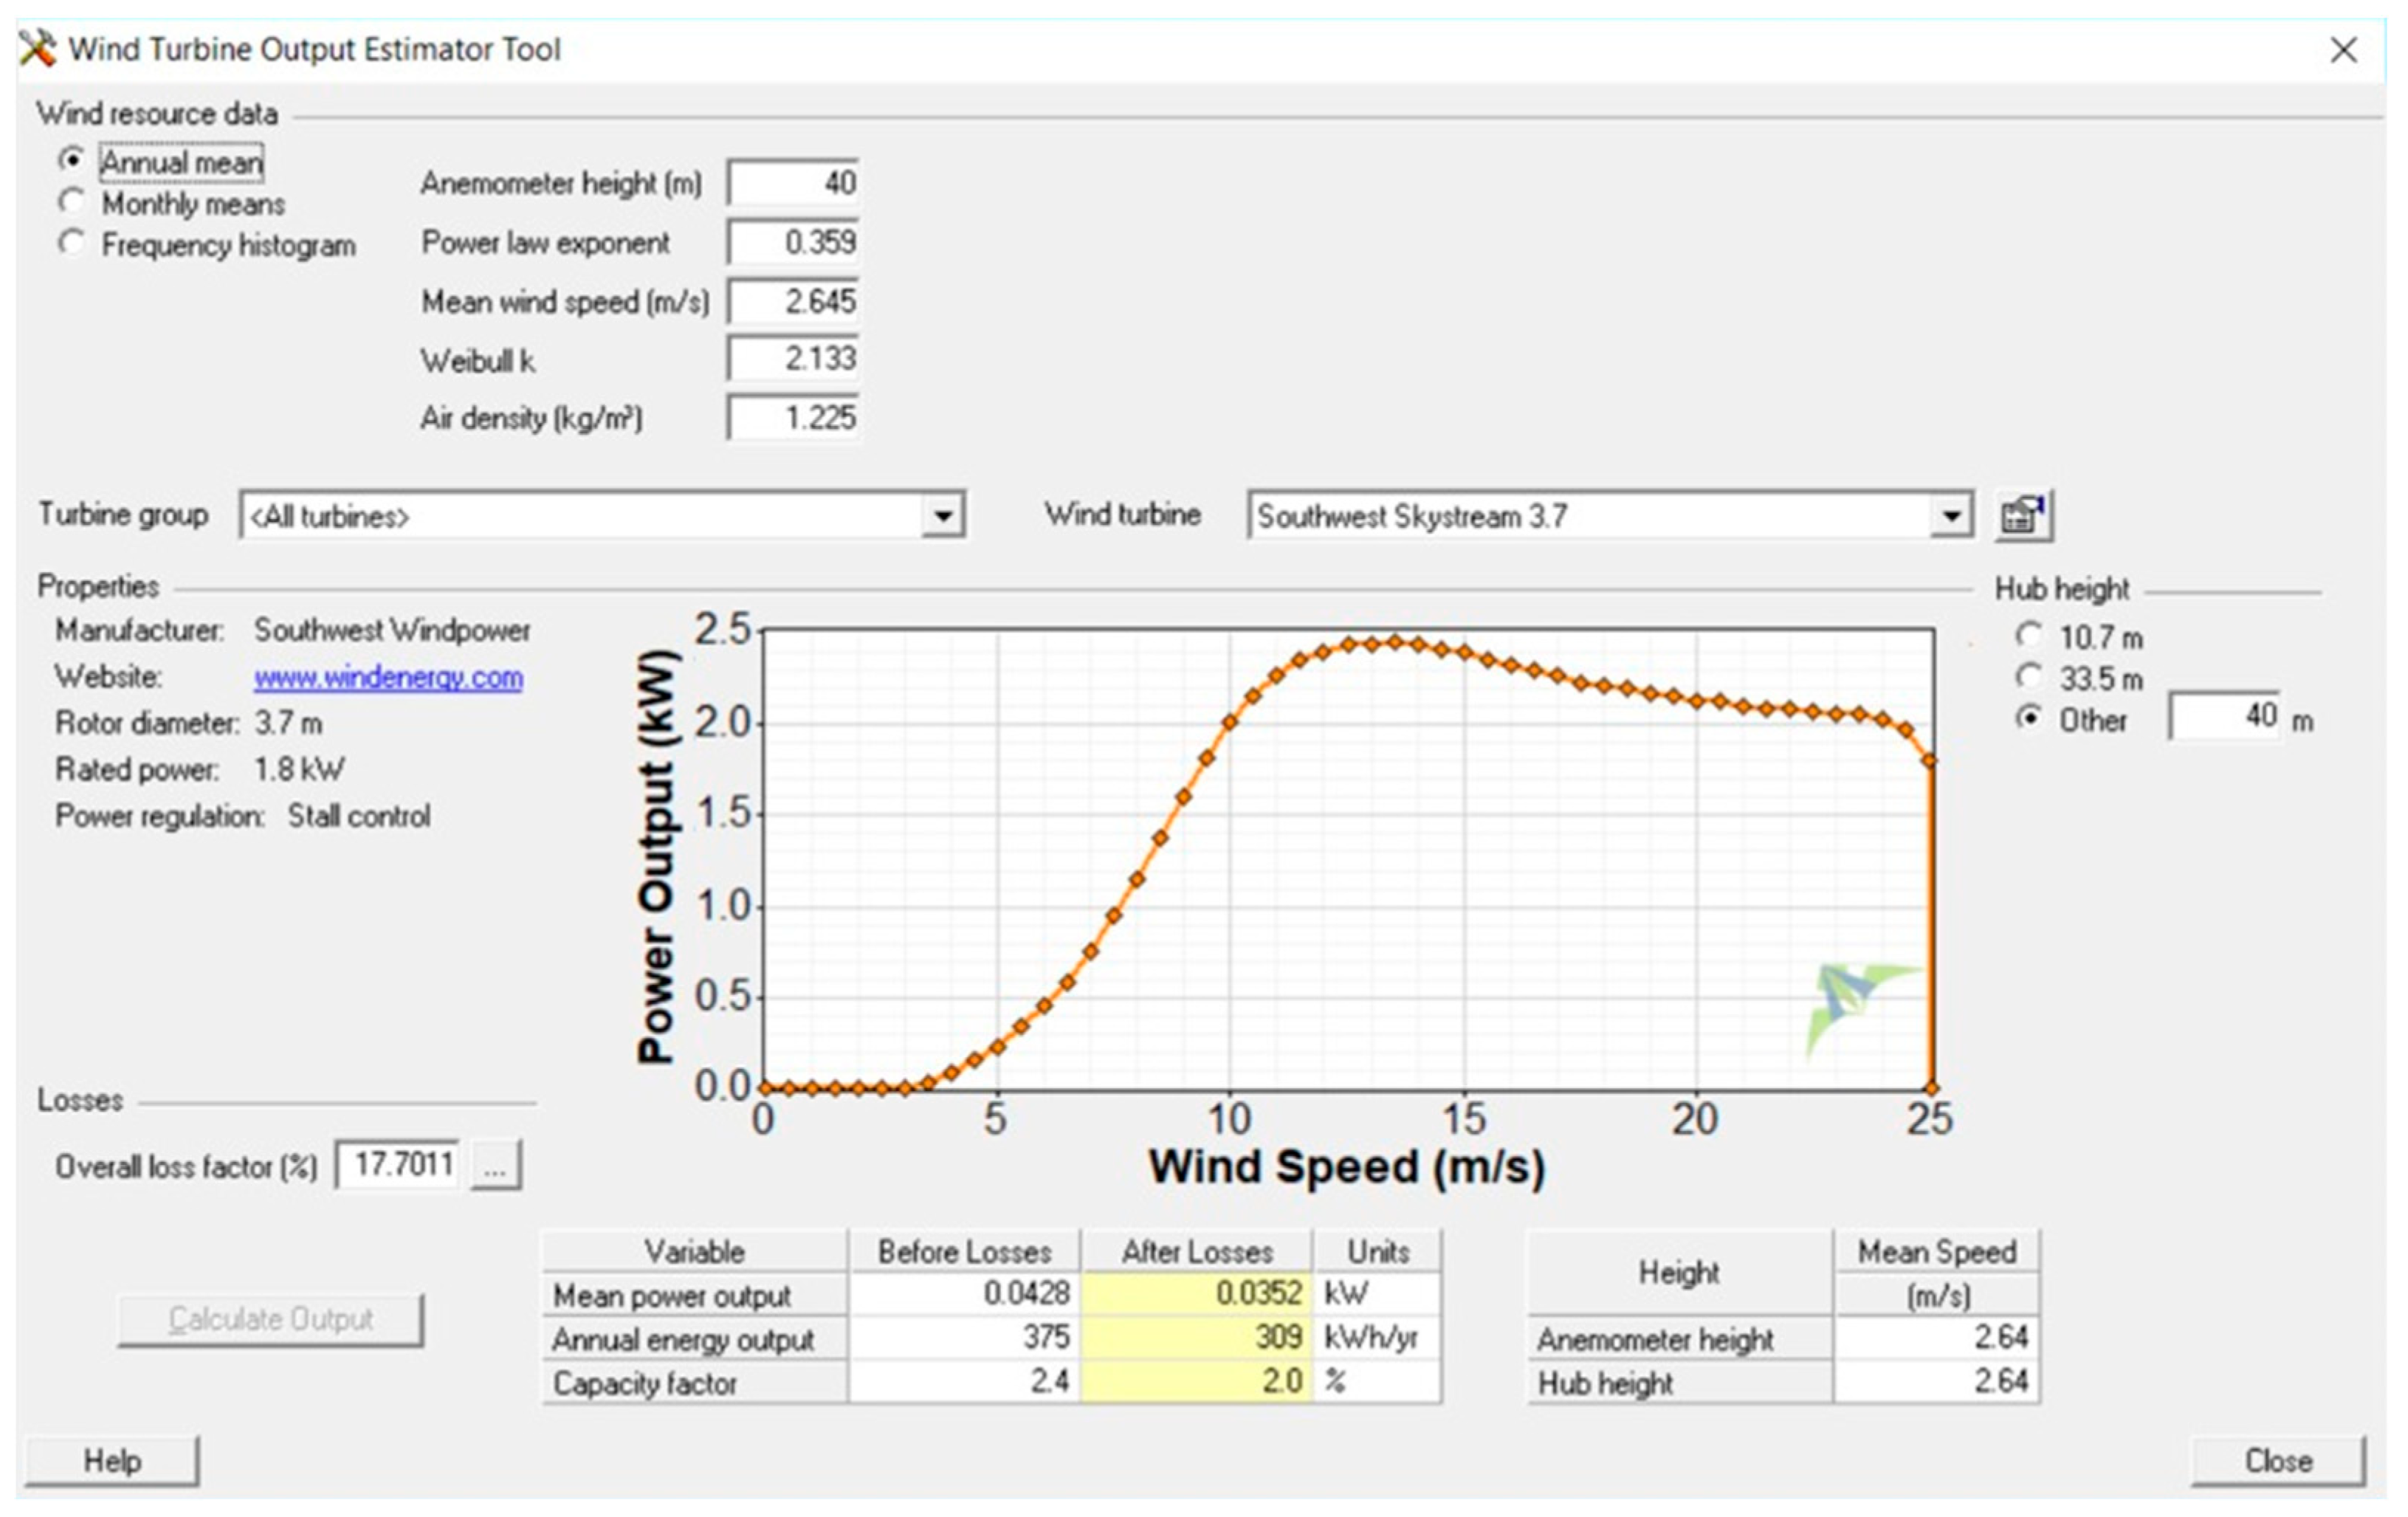
The software Windographer® has been used to estimate annual energy production. The calculation parameters are installation height 40 m, power-law exponent 0.359, mean wind speed of 2.645 m/s, Weibull factor of 2.133, and assumed air density of 1.225 kg/m3. The Skystream® 3.7 wind turbine model was selected automatically, providing the respective power curve and power losses factor.
After losses, the annual production has been estimated at 309 kWh, with a mean power of about 35 W and a capacity factor of 2.0%. The screen capture showing the calculation results is in
Figure 13.
2.6. Economic Evaluation
The power production capacity has been calculated, and the economic trade-offs of the installation are demonstrated.
In ref. [
36], the Levelized Cost of Energy (LCOE) for an SWT is calculated. The LCOE shows the current net cost of energy over the SWT’s lifetime. As the LCOE is calculated in a monetary unit of power, it must be less than the energy price to not cause losses over the turbine’s lifetime [
37]. The simple LCOE is calculated based on the equations:
where:
C0 is the initial investment per installed kW;
ot are the cash outflows in the period
t;
CRF is the capital recovery factor;
rd is the discount rate;
CF is the capacity factor, and
N is the total number of years.
3. Results
Several data were taken and stored during three operation years, thanks to the turbine manufacturer’s supervision software (
Figure 14). The electronic system inside the nacelle transmits wireless (using Zigbee technology). A receiver with a USB connection can be attached to a computer to communicate with the turbine.
A computer has been installed about 100 m away from the nacelle, and the data is received and processed by the supervision software, and then recorded on a local computer server. The operational data is volatile information programmed to record all of the available parameters every 1 s, the manufacturer’s maximum rate. For example, the supervision system can store, among others, the following data: line voltages, current and power outputs, frequency, the turbine rotation speed, and referential value of the wind speed.
Successful data recording is highly dependent on many factors, such as the wireless signal transmission and reception, and the processing capabilities of the personal computer for receiving the data.
During the three years, 2,352,474 readings were stored, representing about 25% of all possible recordings. The most recurrent data recording failures were wireless connection losses between the computer and the wind turbine, and the computer’s processing lapses during the operation.
Unlike the operation data, the energy total production is permanently stored information and can be retrieved without the need for a computer to store the data.
3.1. Wind Speed Data
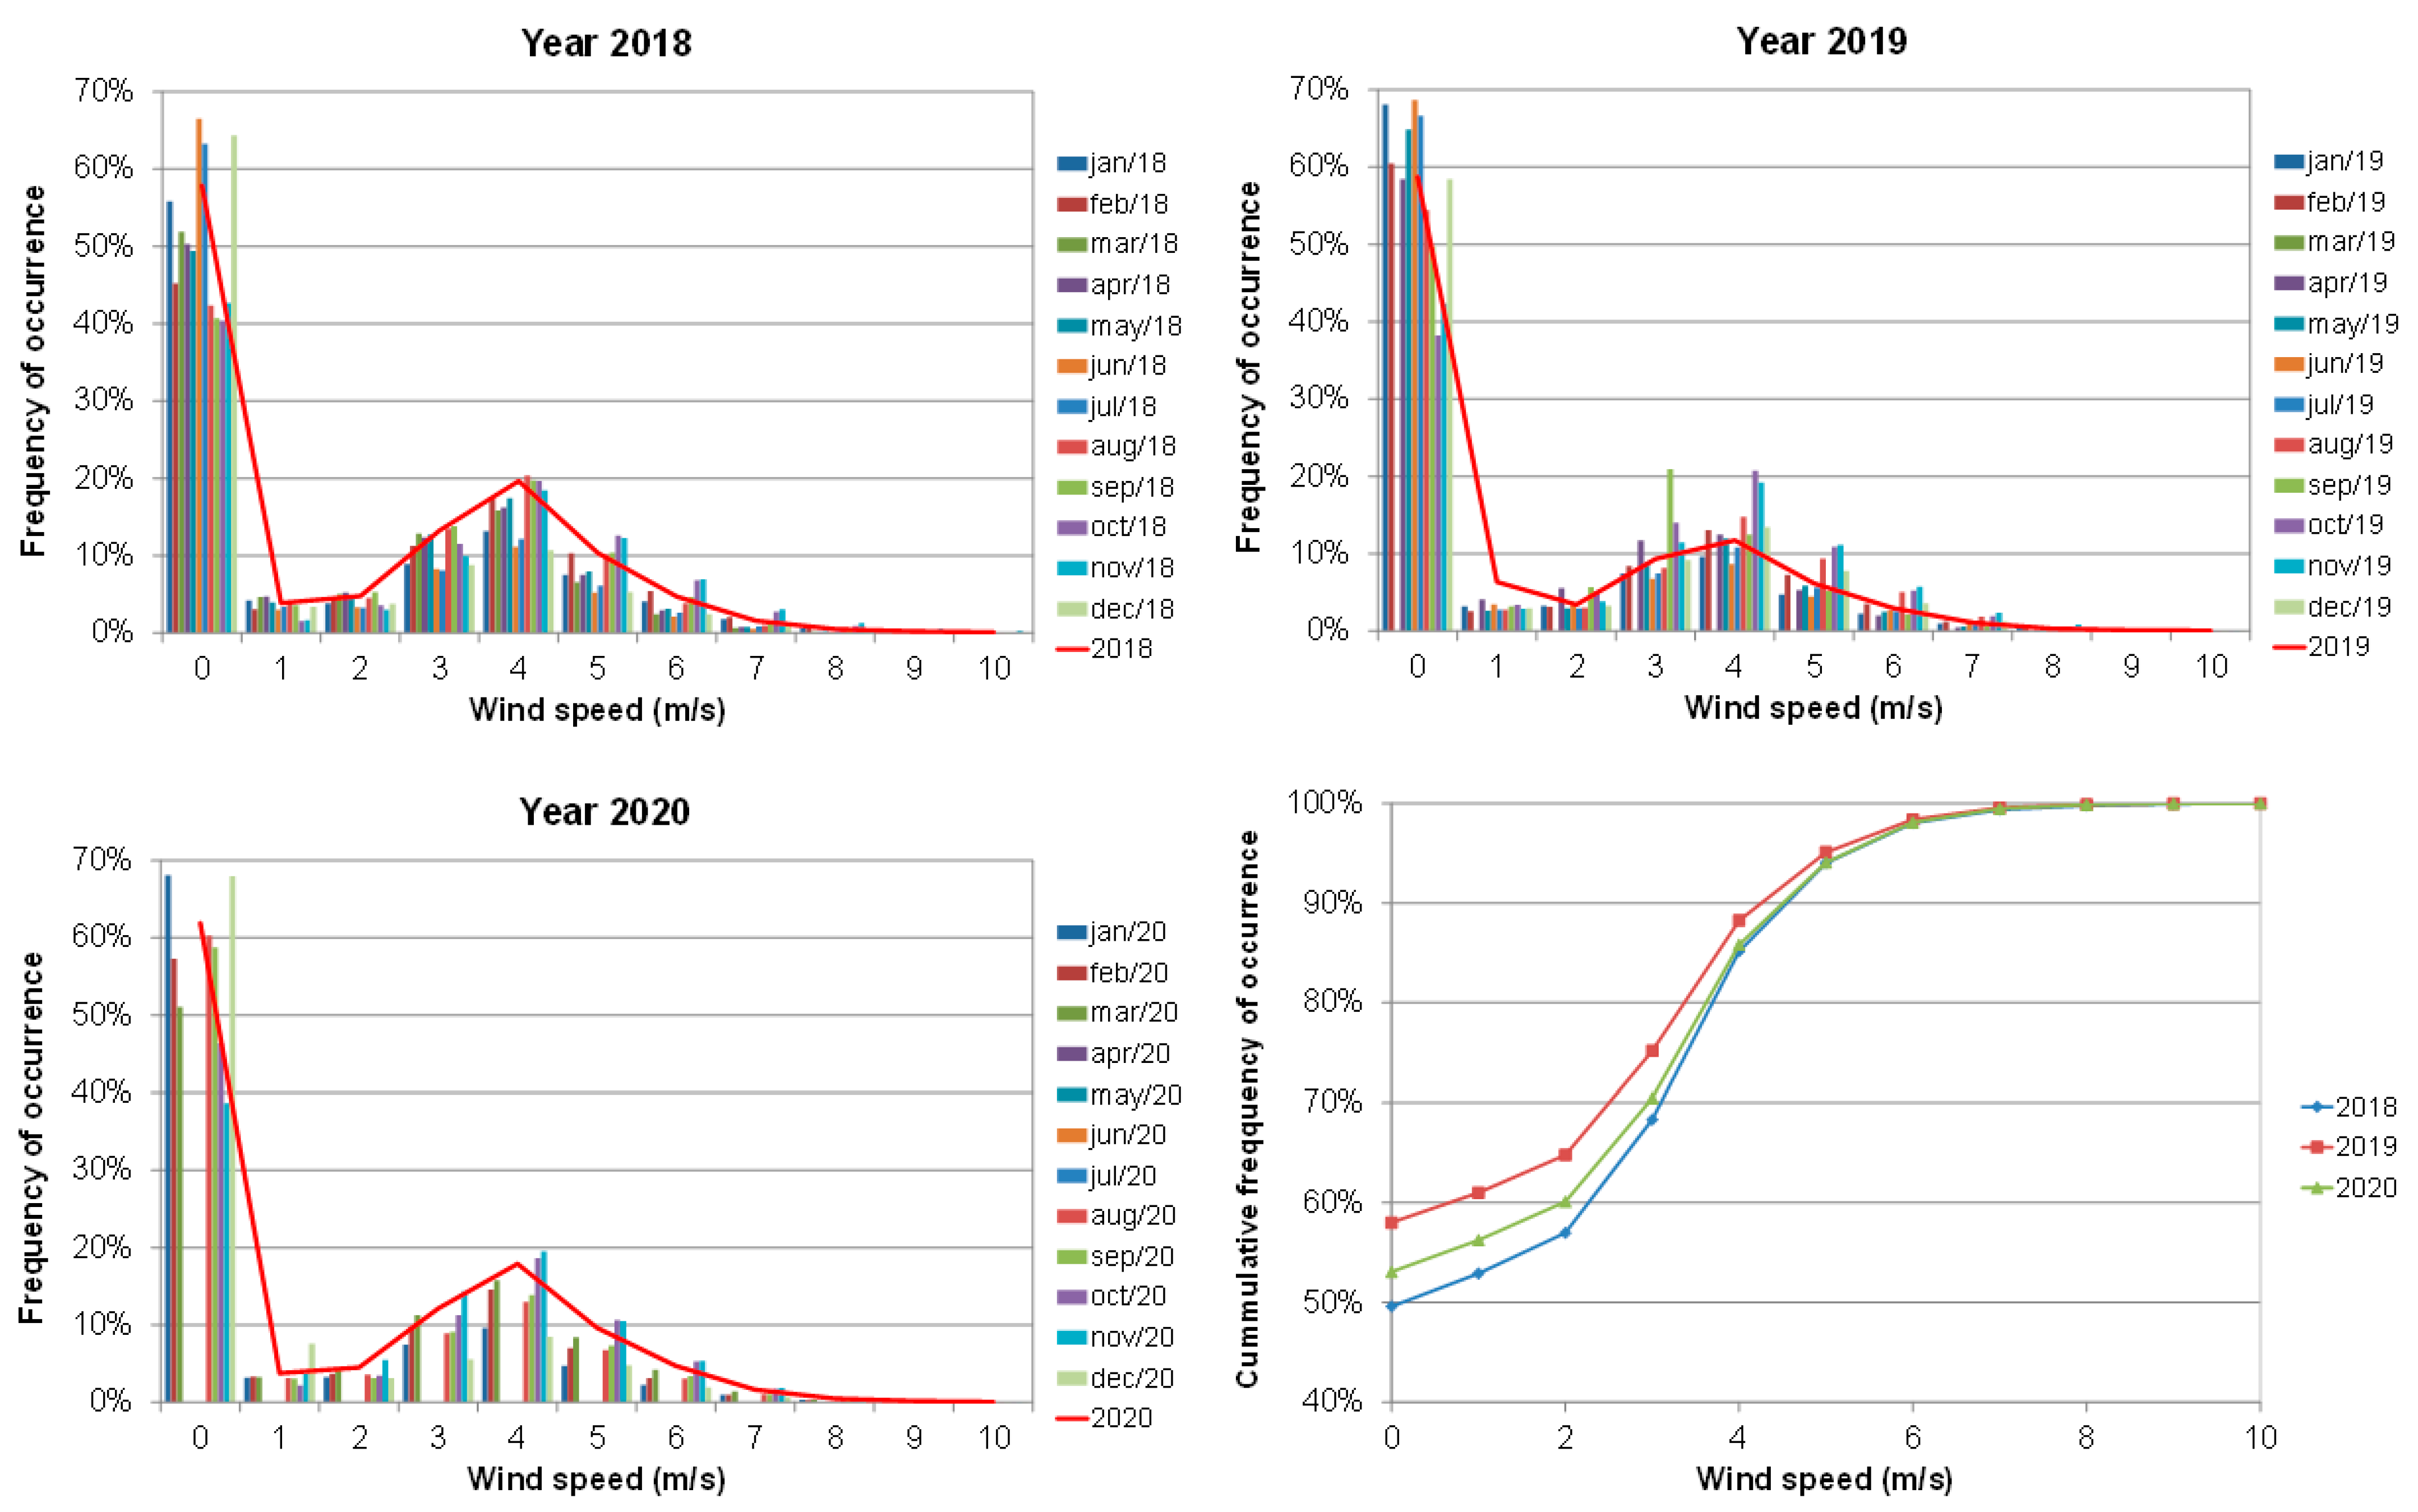
From the records of the wind operation rotation speeds obtained using the supervision software, it was possible to estimate the frequency distribution of wind effectively spinning the rotor over the years and months from 2018 to 2020, as illustrated in
Figure 15. The average wind speed was 2.3 m/s, and the mean wind speed was in the range of 0 to 1 m/s. Values of 3 m/s (cut-in speed) exceeded only about 30% of the time.
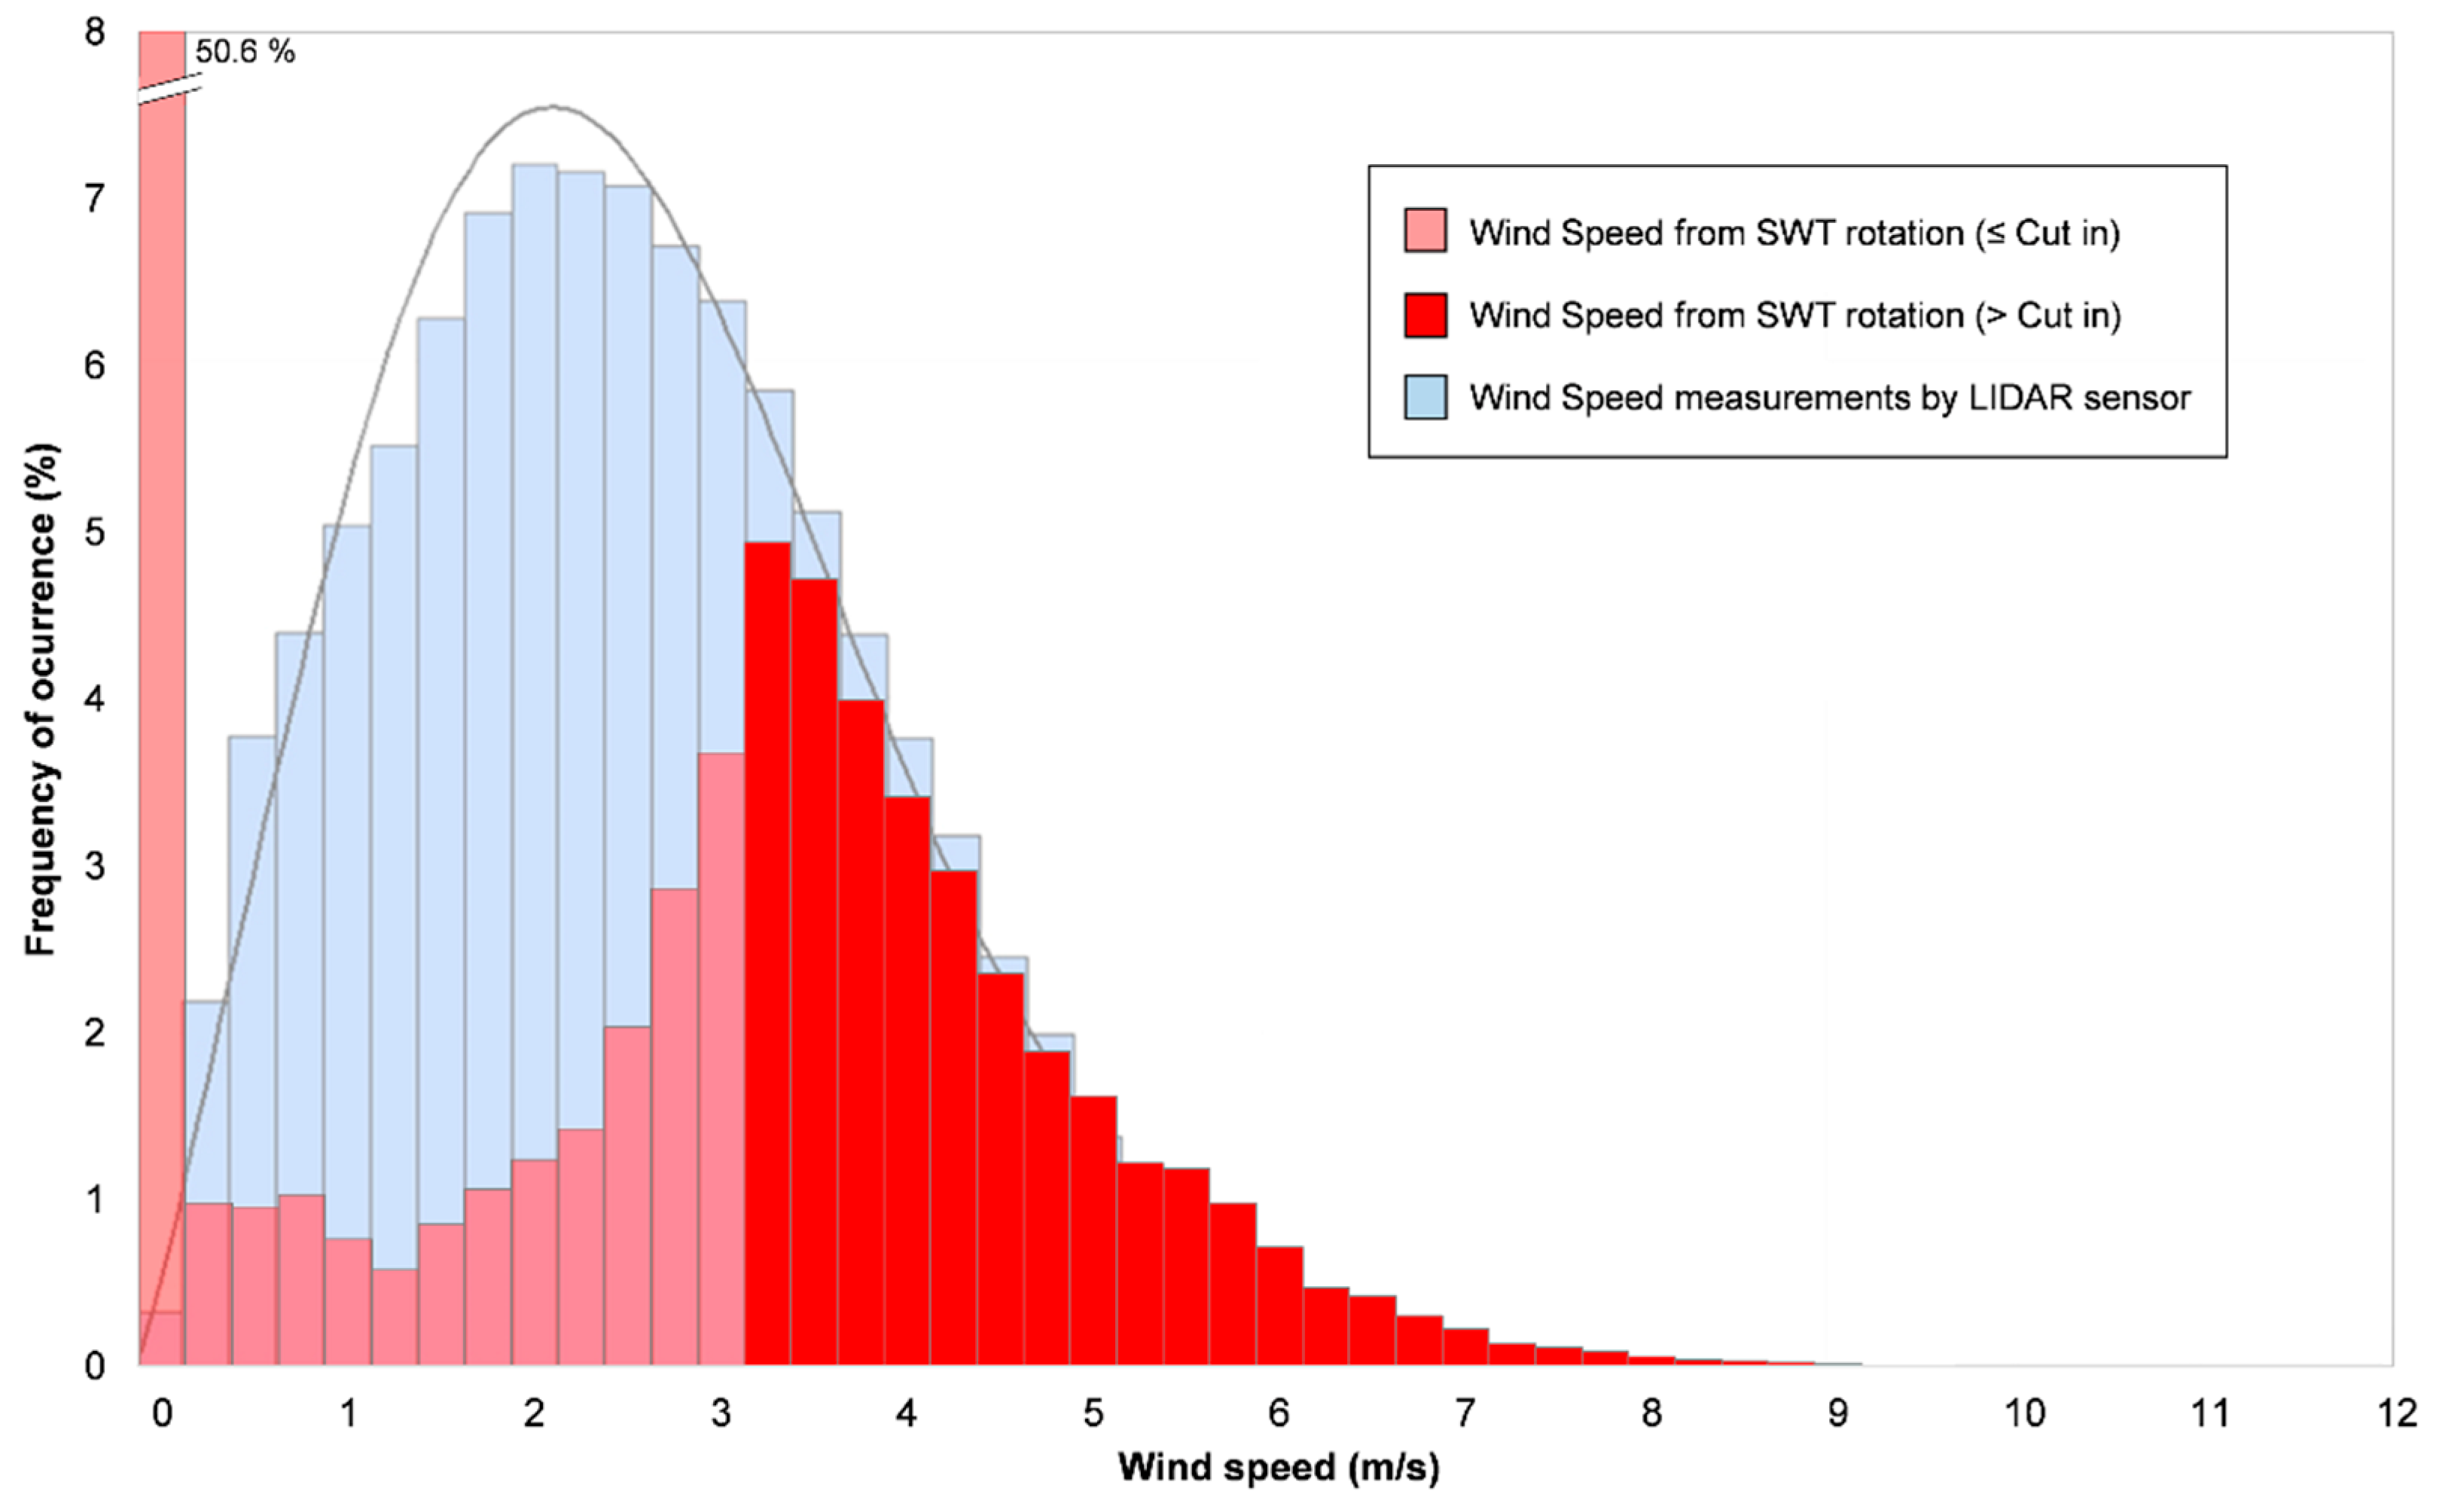
Figure 16 shows the wind frequency distribution’s superposition with more detailed wind speed bins by estimation from STW rotation with the Lidar measurements (as shown in
Figure 10). The superposition is highlighted in two regions: below the SWT cut-in wind speed (light red) and above the SWT cut-in wind speed (dark red).
3.2. Power and Energy Production
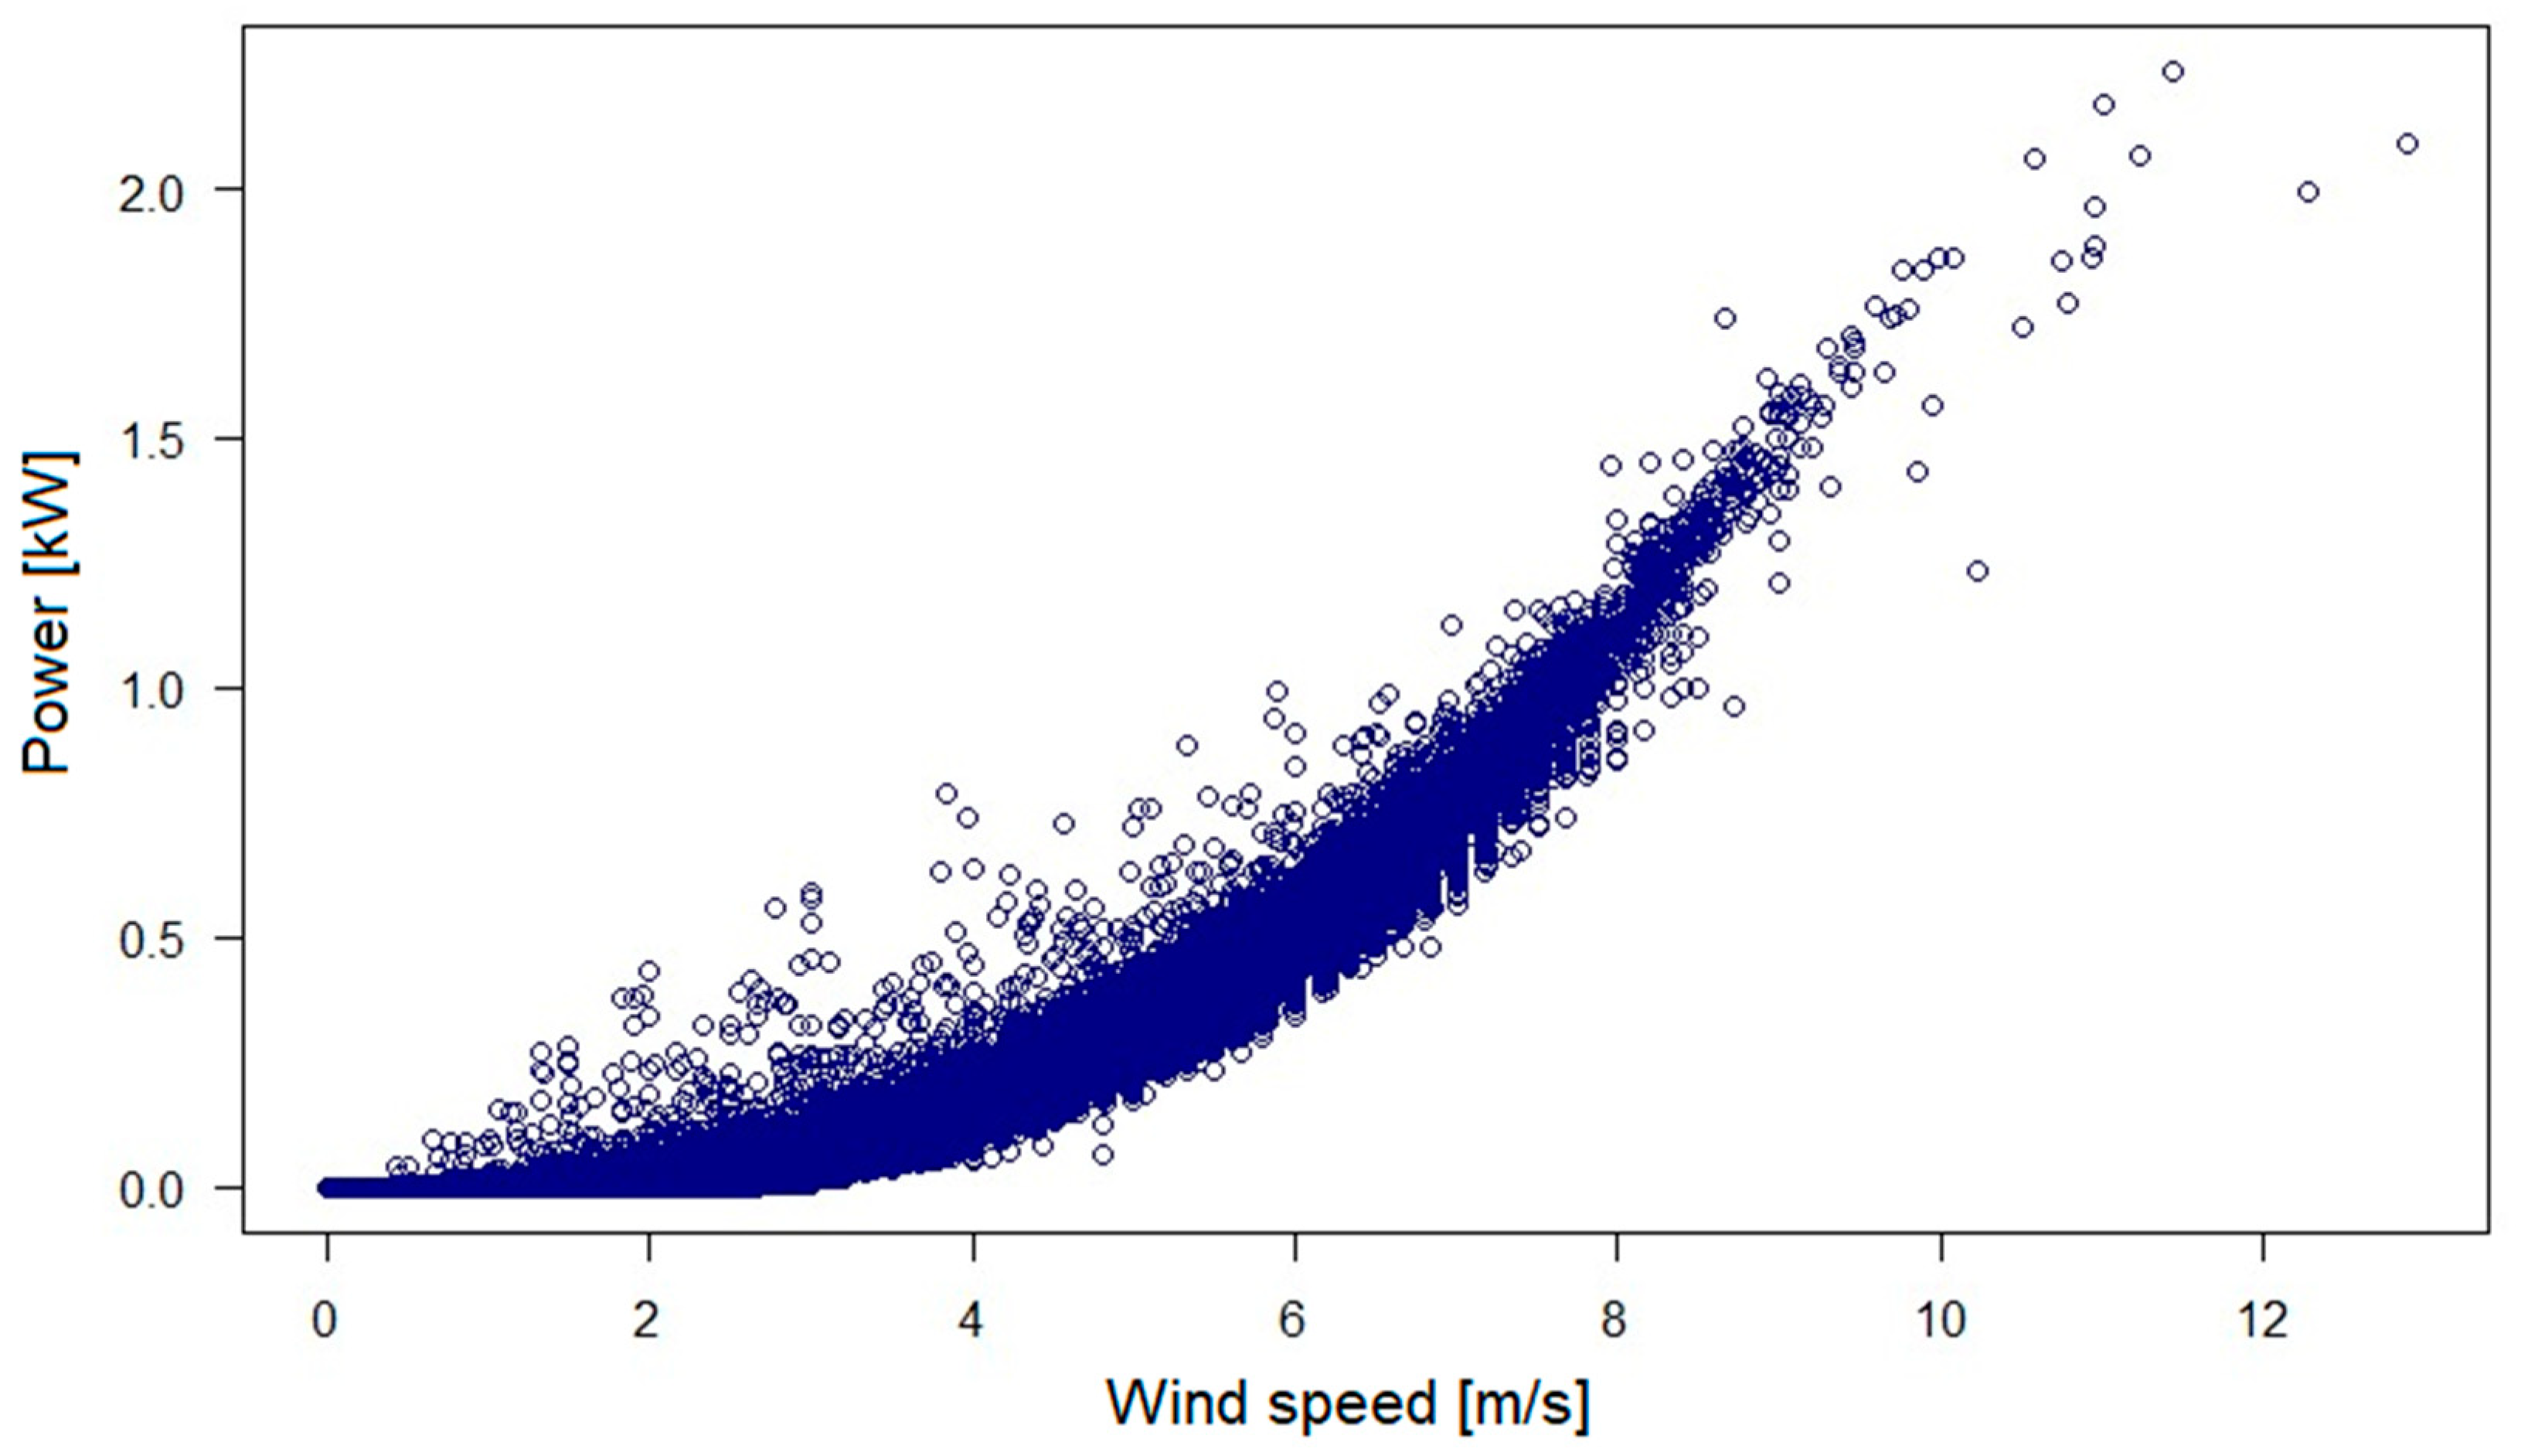
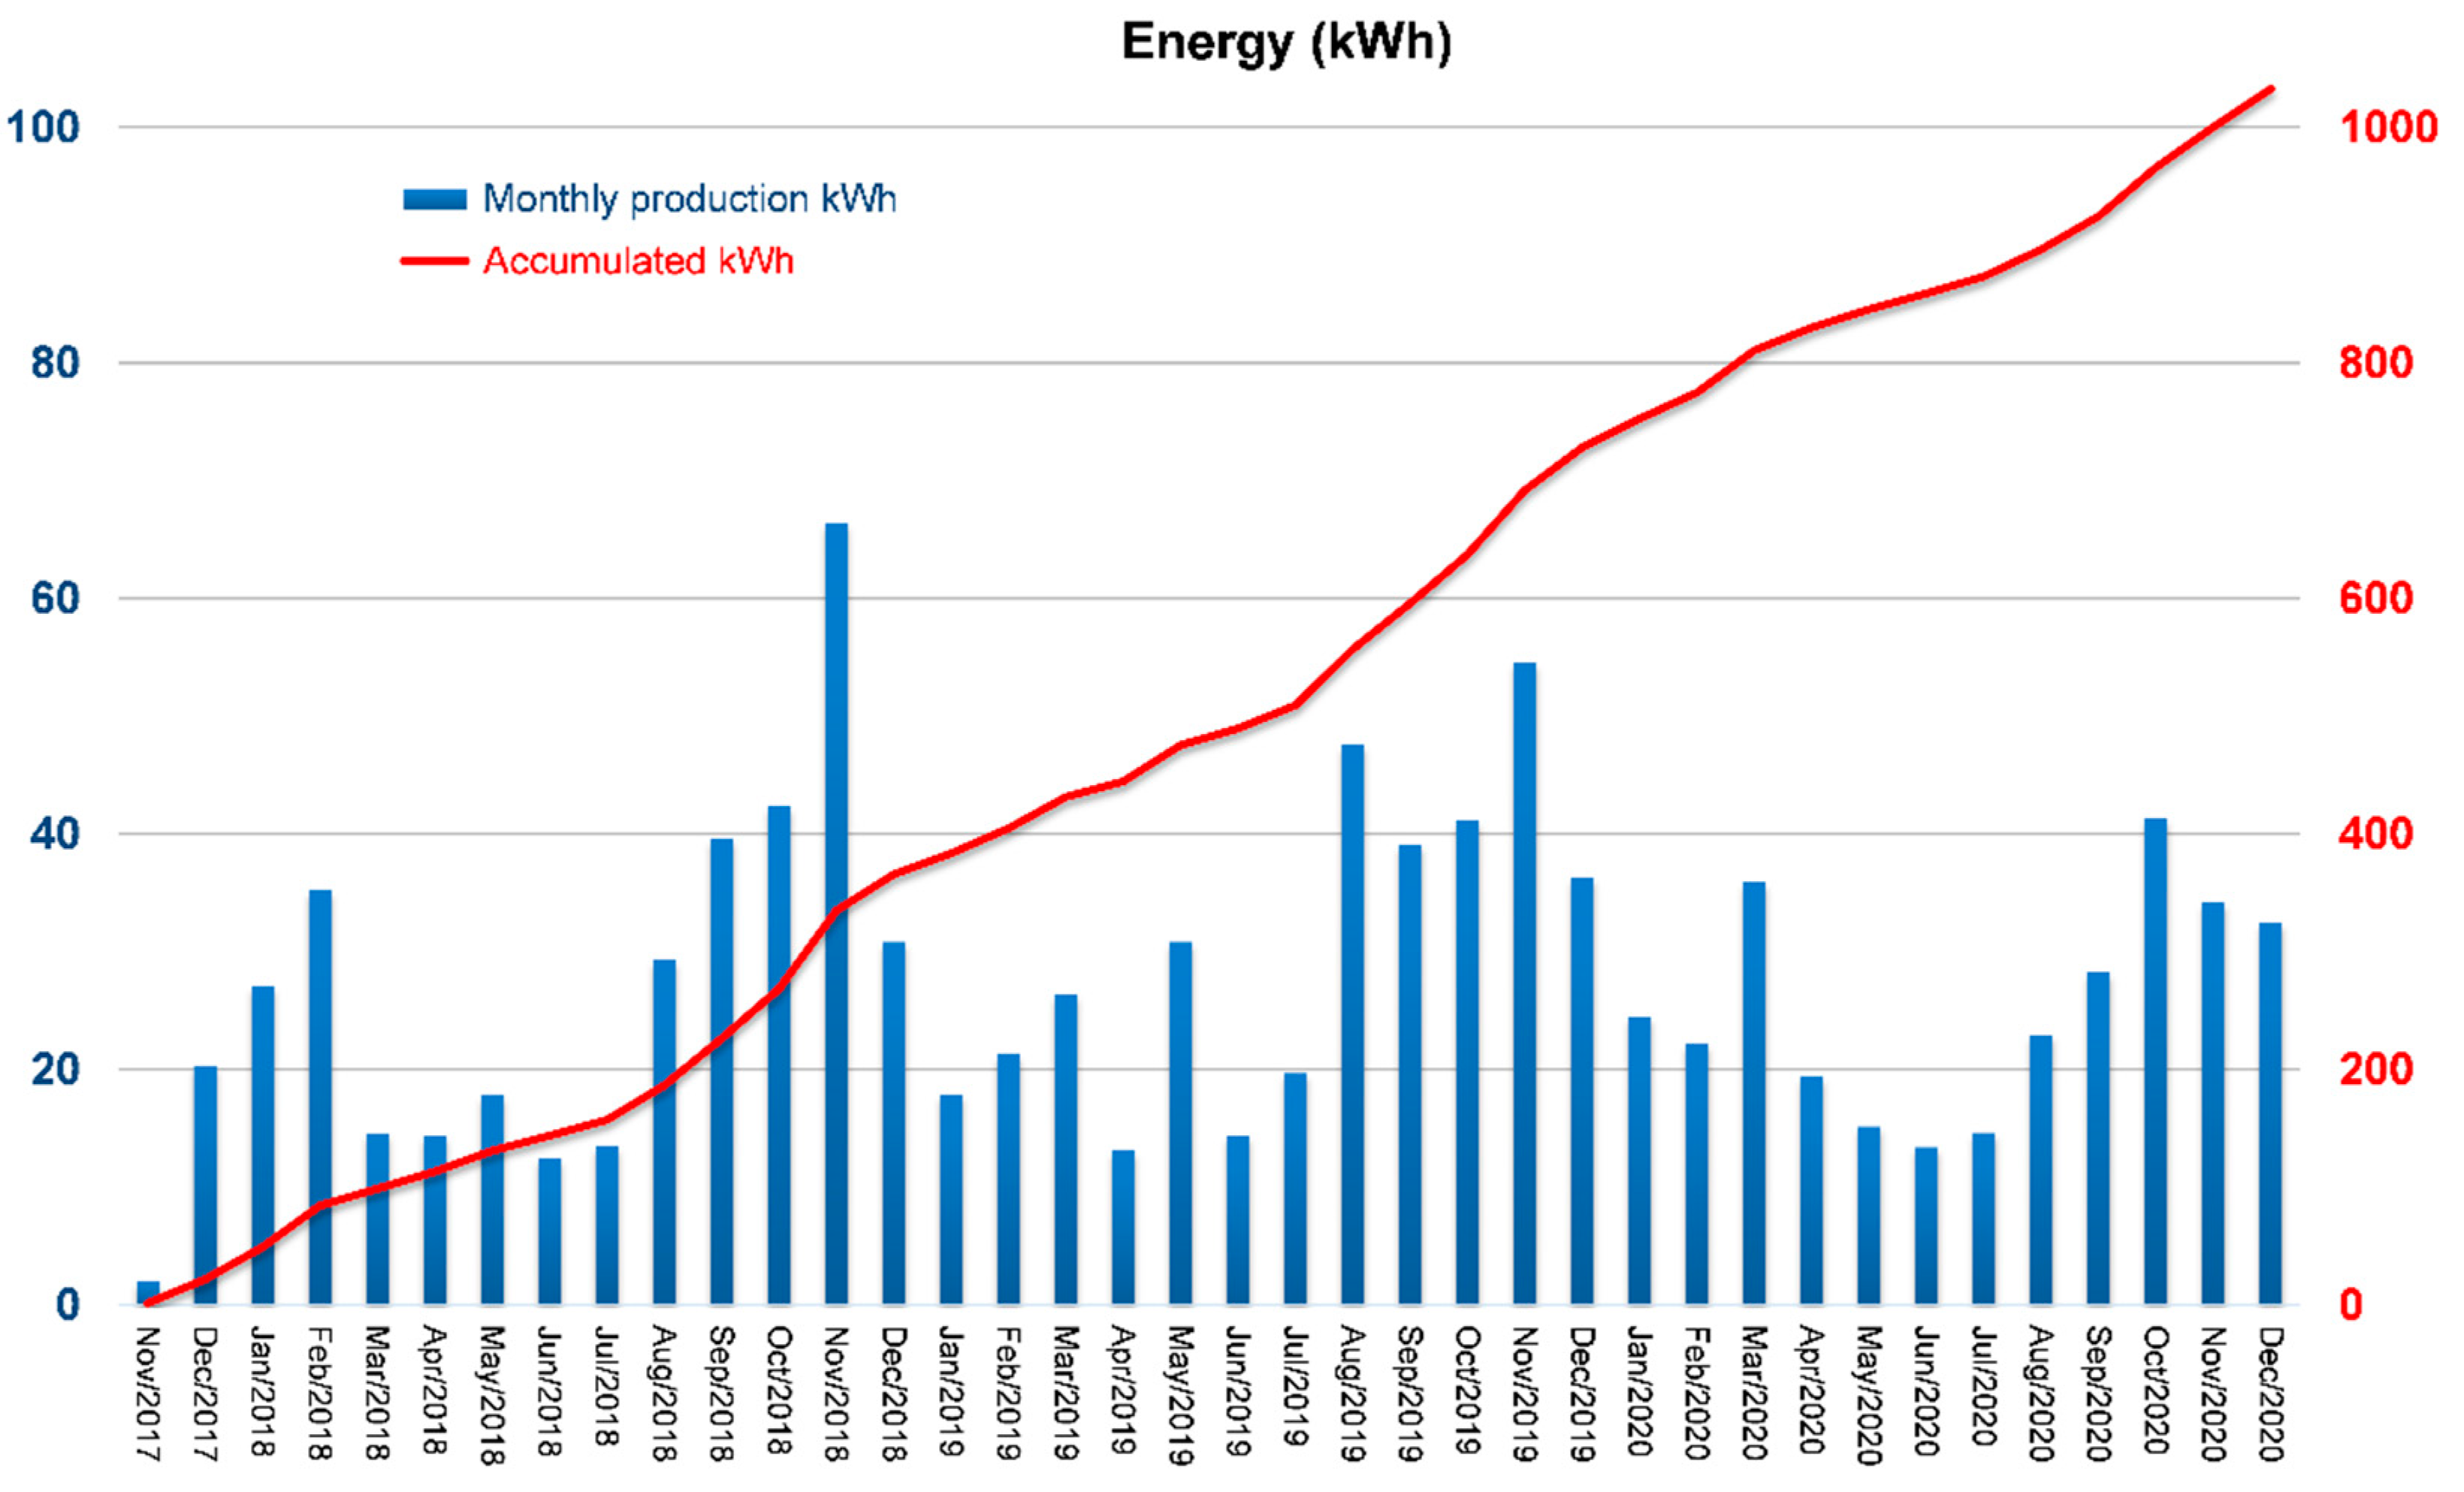
Figure 17 shows the turbine’s wind power delivered to the grid, recorded and averaged every 1 min, during the three operation years from 2018 to 2020 as a function of the estimated wind speed. The calculated mean power is 44 W. The energy along the months and the accumulated production are in
Figure 18.
The accumulated production has reached 1033 kWh in the period, with 1.8 kW of rated power. The resulting capacity factor was 2.1% showing an excellent agreement with the simulated value of 2.0% (
Section 2.5).
3.3. Sensitive Economic Analysis
The SWT’s investment in this analysis is the amount cost in Reals (R$—Brazilian currency) for a complete installation, directly converted into US dollars (US$).
The price of electric energy in Brazil is included in the Residential Tariff Ranking in R
$/kWh, published by the National Electric Energy Agency—Aneel. In Brazil, the average tariff for all electricity distributors is R
$ 0.66/kWh, which corresponds to an average of about US
$ 0.14/kWh in June 2022 [
38].
The economic equilibrium of the project is achieved if the LCOE value, calculated by Equation (4), is smaller than the value of the energy price.
Table 3 lists the parameters used to calculate the LCOE, considering 100% the use of equity and a discount rate of 3%.
Due to the small-obtained value of the capacitor factor, the LCOE is much higher than the electricity price for the project and economic equilibrium is not reached. For the current implantation equilibrium would be achieved, e.g., with a CF of 35.2%.
4. Discussion
The competitiveness of small wind turbines for distributed grid-connected power generation is strongly dependent on the capacity factor.
Despite the low CF, the 1.8 kW SWT case study at the University of São Paulo can be replicated in other parts of Brazil, or worldwide. For example, using preliminary wind speed data from reanalysis [
24,
25,
26,
27,
28] for different locations in Brazil, (South and Northeast), higher CFs were obtained, reaching even better values than those presented in
Figure 1. From equation 4, the higher the CF values, the lower the LCOE, thus improving, in direct proportion, the competitiveness of this SWT in such locations.
The choice of different SWTs can be more or less suitable according to the wind patterns, the height available for installation in the buildings, the size, and other properties that the turbines must present for the viability of the structure. The availability of SWT products on the market is essential for choosing.
Therefore, a survey of simulation results of upwind blades, downwind horizontal axes (HAWT), and vertical axis (VAWT) wind turbines commercially available was performed.
Table 4 lists the selected models and presents the respective calculated production parameters. The calculations were made by the Windographer
® software using the same input parameters presented in
Section 2.2.
The performance data were obtained from the Windographer® catalog. Data in the table indicated with (*) are from the manufacturer’s specifications. The maximum power coefficient (Cpmax) indicates that the turbine has some wind speed bin where the relationship between electricity output and kinectic wind power input is better than other wind speed bins.
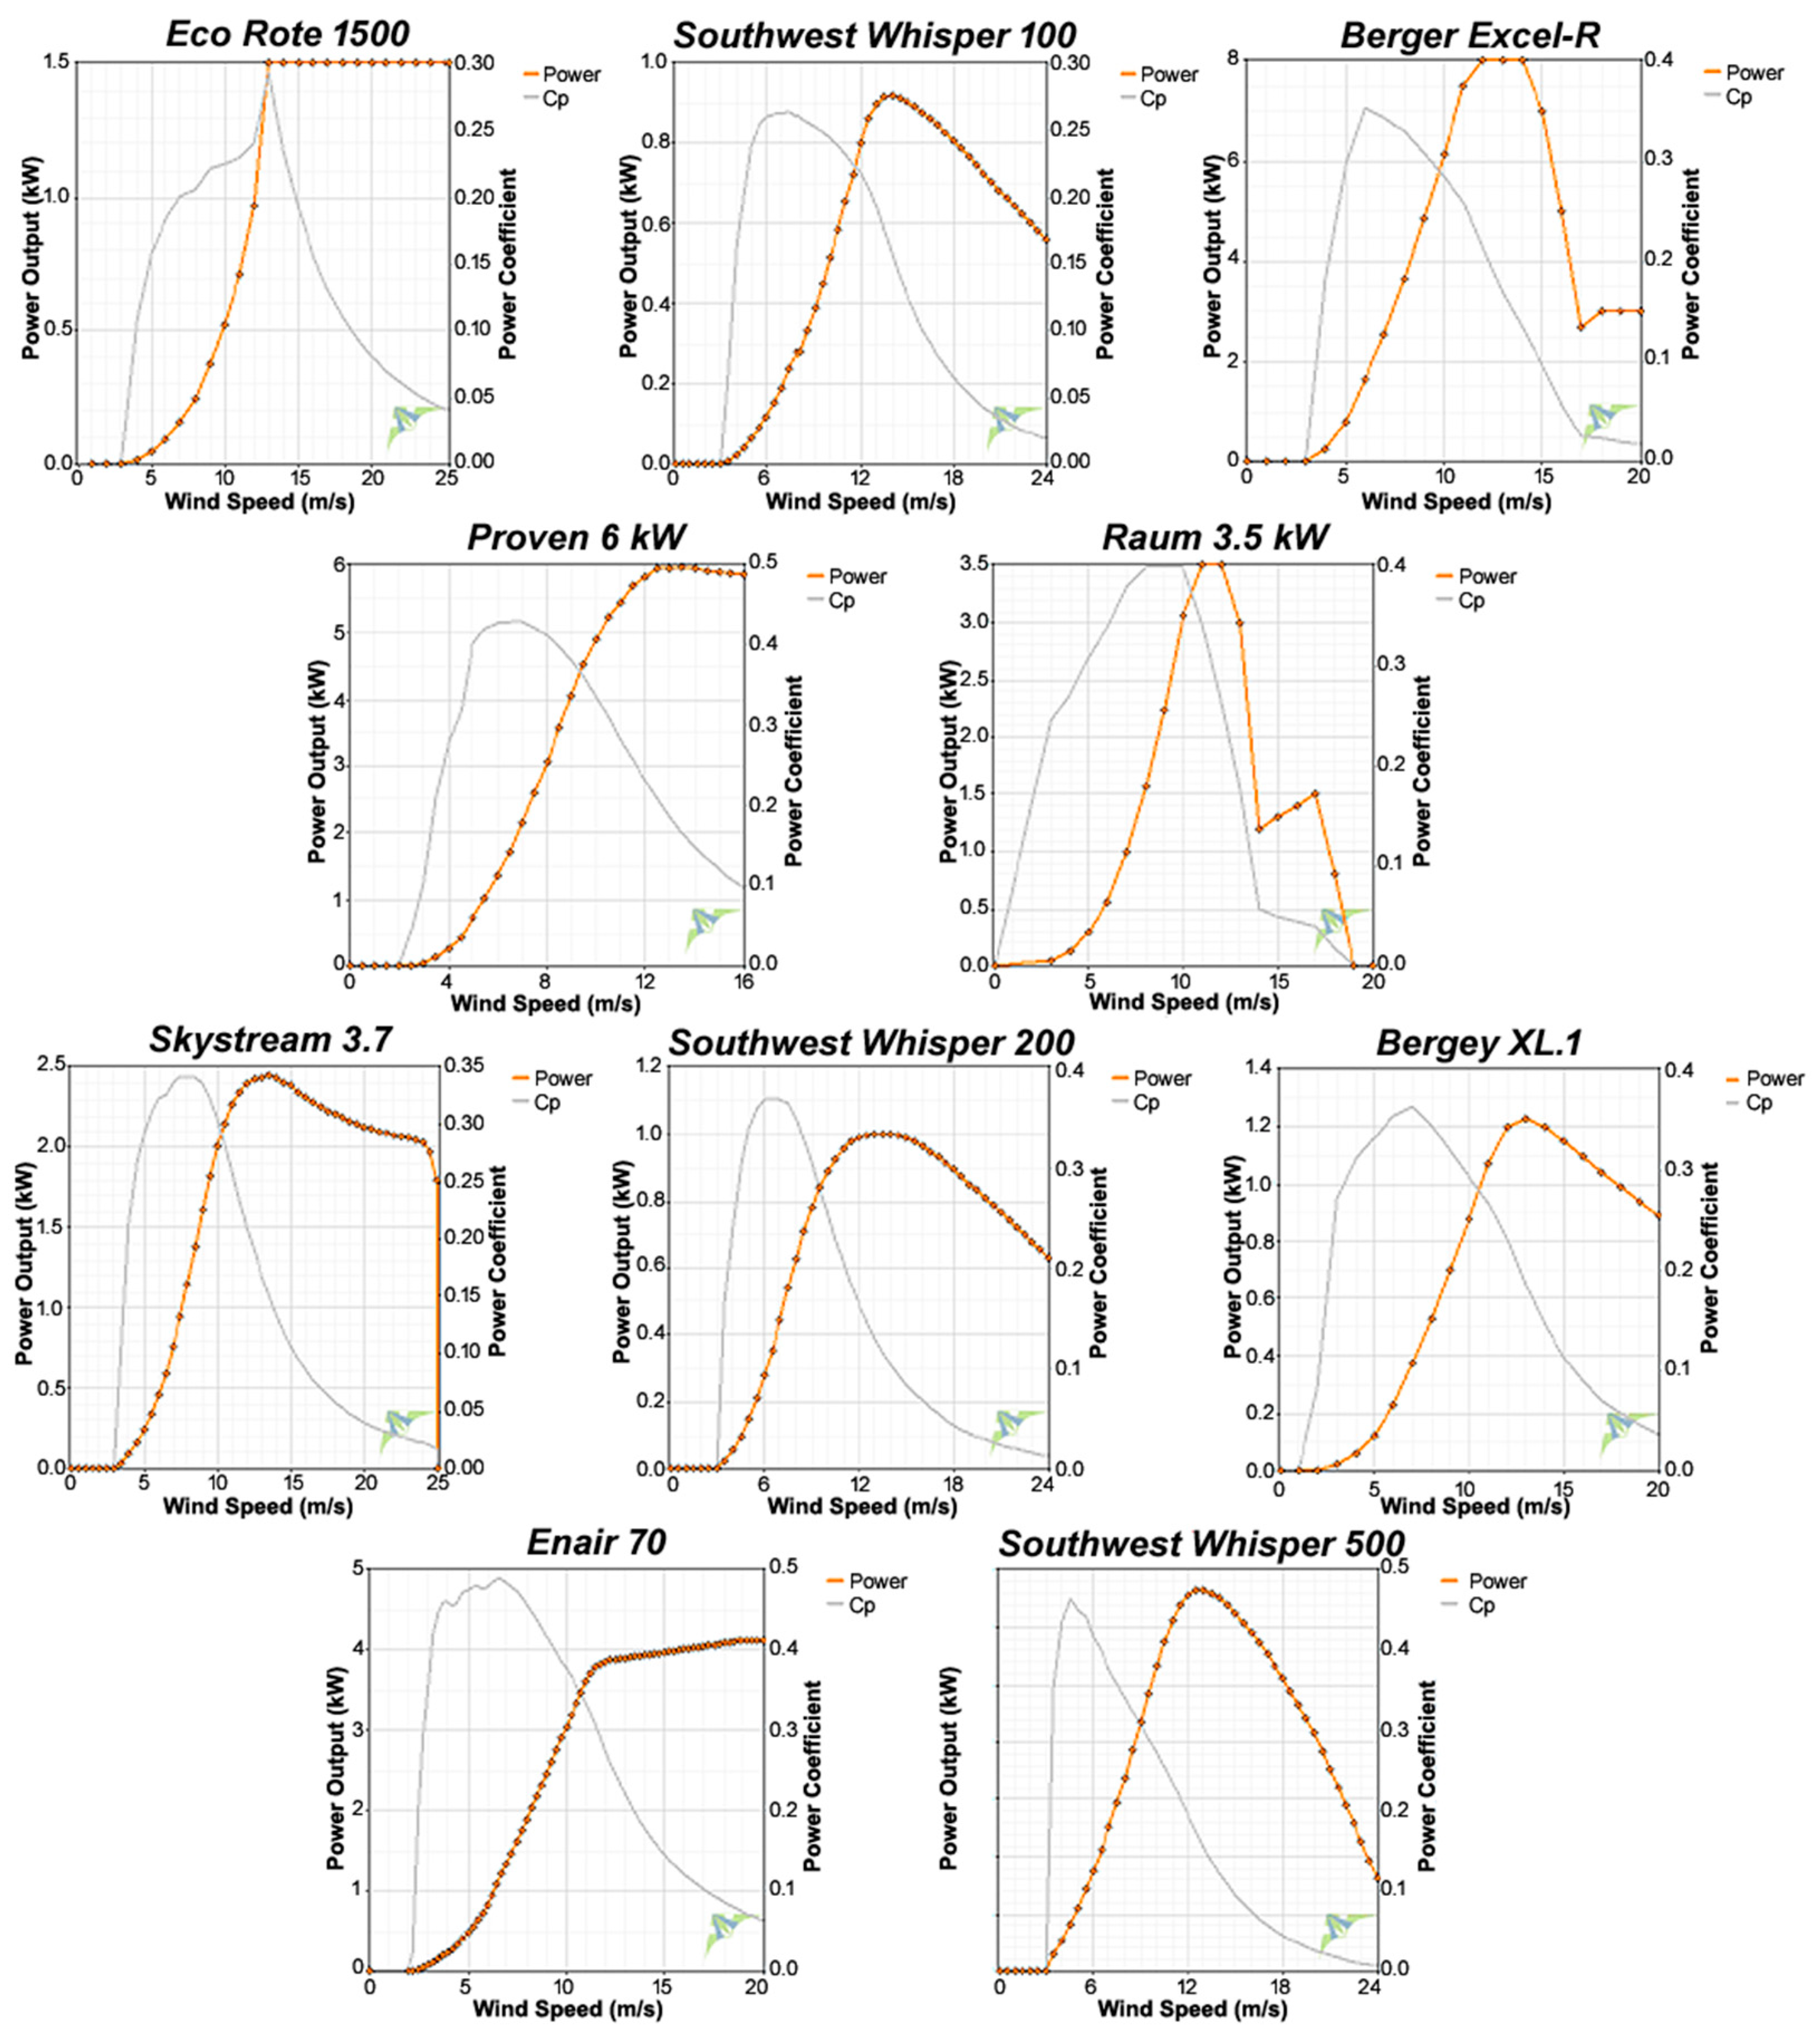
Figure 19 shows the power output and power coefficient curves selected for comparative analysis of the wind turbines.
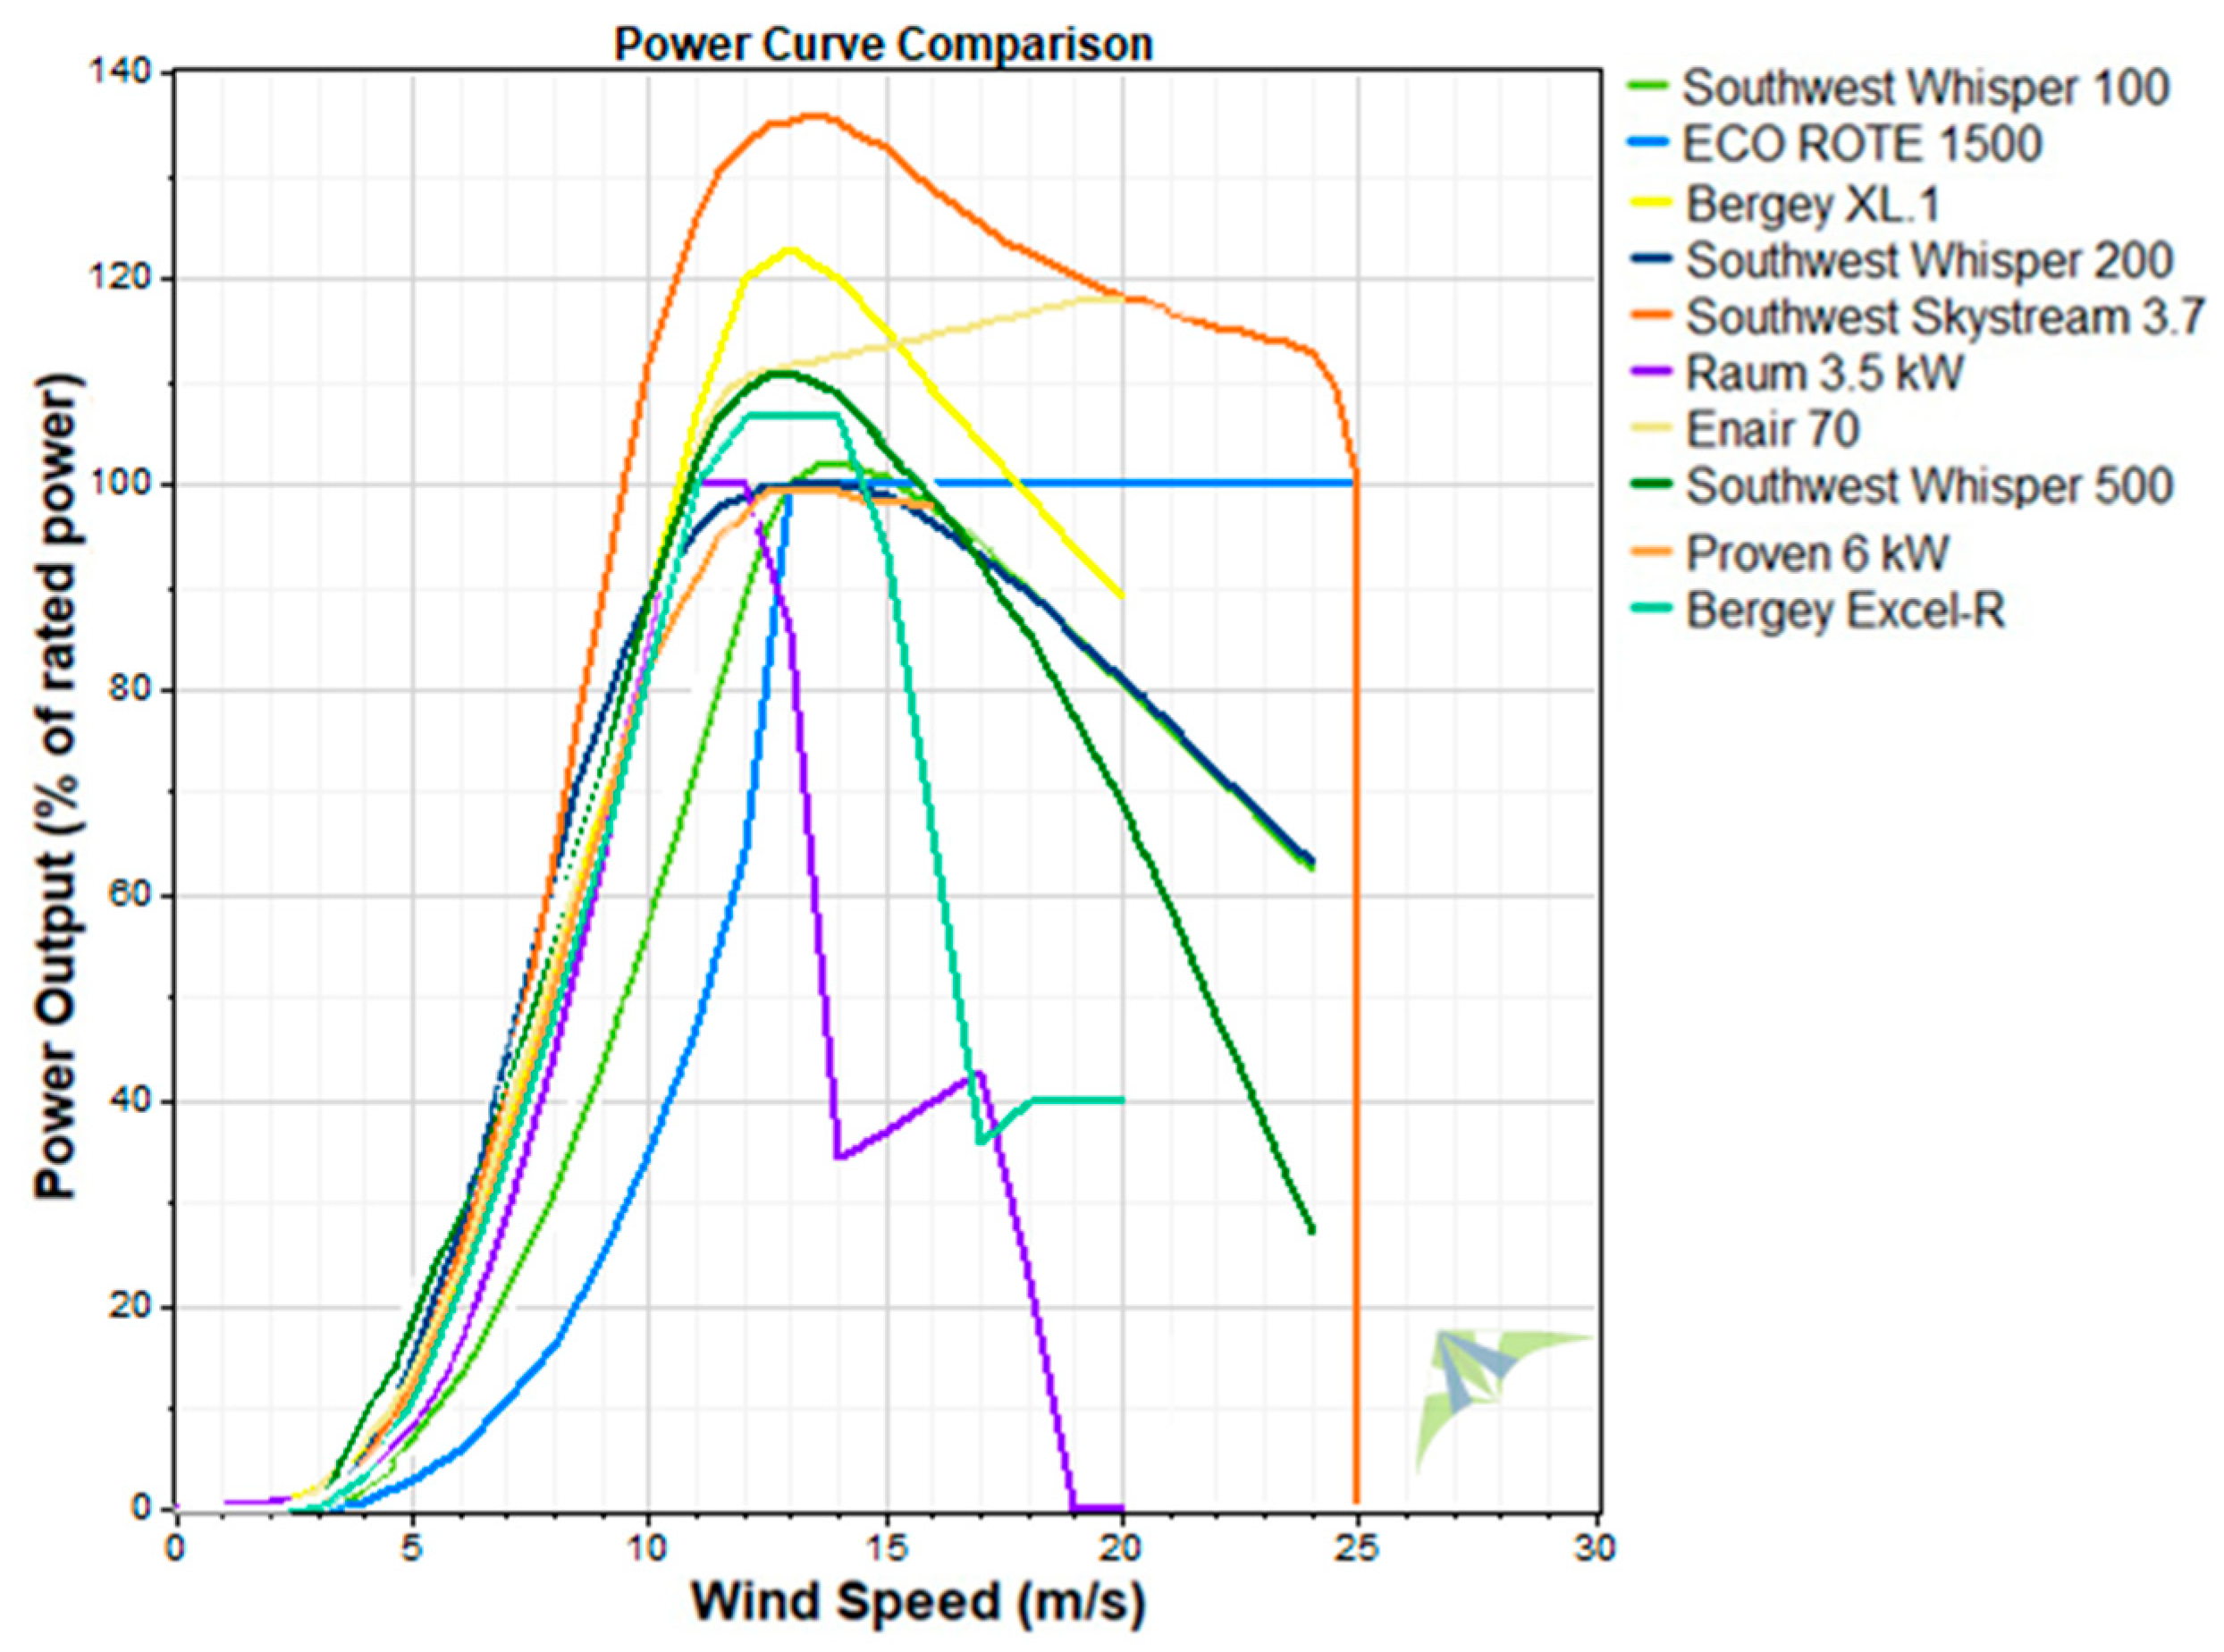
Figure 20 compares 10 wind turbines where Skystream
® is at the top in the rated power percentage. As observed, no wind turbine has a sound power output for wind speeds between bins 0 and 4 m/s.
Wind energy in the urban environment should not yet be ruled out, notwithstanding the low values of capacity factors achieved, which may hamper competitiveness with other alternatives for grid-connected distributed generation (such as photovoltaics and biogas).
Urban wind power technology options at least deserve further investigation, research, and development efforts to look for optimized designs of rotor and blade systems with improved performance for urban wind typologies, with characteristics such as those of the IEE-USP site.
The century’s long-standing experience of multi-blade American windmills, and perhaps the vertical axis options [
39,
40,
41,
42], are hints for further research and development efforts. The multi-blade American windmills have mainly been used for mechanical power generation with direct shaft connection for water pumping. They have a record recognized performance [
43,
44,
45] in the USA, Australia, Argentine [
46], South Africa, Colombia, India [
47], China, Netherlands, France, Greece [
48], and elsewhere, in an environment of low height and low-speed winds. The main focus of the research should be the optimization of rotor design, once variable frequency generation combined with an inverter system for frequency and voltage regulation and associated power electronics devices are readily available for mechanical power conversion to electricity.
Moreover, the intensity of wind turbulence in urban environments can be much higher than in open fields and, in most cases, can significantly impact energy production requiring additional studies [
49].
Besides further improvements in technical design, the scale gained with SWT’s market expansion can reduce investment is expensive. Projections in [
50] show that residential wind energy’s Levelized Cost of Energy tends to reduce by 25% every decade, decaying from 274 USD/MWh in 2020 to 112 USD/MWh in 2050.
Previous measurements using a Lidar (Jun/2015 to Jan/2018) sensor have shown a relatively low annual average wind speed of about 2.6 m/s at 40 m height compared with 2.3 m/s obtained from the data of production measurements (2018 to 2020). The Windographer® software performed the estimated annual energy and average power, and the calculated and measured results are well matched.
The measured capacity factor agreed with the software estimation, resulting in a rounded 2% value. The mean annual production is 344 kWh/year, slightly higher than the calculated (309 kWh/year). The average power of 44 W was observed against 35 W calculated by the Windographer® software.
Nevertheless, despite the relatively low wind speeds at the site, an excellent adherence was found between the measured wind speeds and the speeds obtained from the SWT rotation above the cut-in value, surpassing the available local winds (refer to
Figure 16). Turbulence can be an additional factor affecting energy production, and should be investigated.
5. Conclusions
The detailed local wind characteristics, selection, installation, and operation data of a small wind turbine (SWT) on the top of a building on the University of São Paulo’s campus in the city’s urban zone are presented.
The central aspect involved in the selection point for installation was an existing tall and isolated building, which simplified the erection and nacelle assembly. This led to to a final height of 35 m above the ground without additional complex structures or towers. A simple and cheap 5 m mast on the roof was used to fix the hub.
The study results show that the measured wind speed agrees with the wind speed obtained from the SWT measurement rotation, and that the measurements obtained with standard tools used for large-scale wind projects provide an excellent prediction of electricity production.
Locations and buildings favorable to wind turbine installations’ adaptations are essential for wind exploitation and distributed generation expansion in urban areas. Although the financial assessment of the project has shown that economic equilibrium is not achieved, the decision to implement the small wind turbine in an existing tall building was made. This initiative was based on not only the investment’s return, but also considering the didactic application and demonstration case of wind energy generation connected directly to the University’s electric grid, which already has other embedded energy renewable sources installed (photovoltaic and biogas plants).
Despite the low capacity factors (CF) achieved, which may reduce commercially available technologies’ competitiveness, further research and development efforts seem to be warranted. The experience of multiple-blade, vertical, and cross-flow wind turbines, combined with state-of-the-art mechanical to electric power conversion technology, may improve rotor and blade performance for typical low-speed wind environments, allowing for increased capacity factors, and, thus, economic prospects. The CF could increase significantly for other sites with higher average wind speeds. With more maturity and spread of SWT installations in the following years, prices and investment costs should reduce considerably. This can foster the creation of additional economically viable projects in SWTs.


