Article

The Climate Footprint of Diabetic and Gluten-Free Diets in Australia

School of Medical, Indigenous and Health Sciences, University of Wollongong, Wollongong, NSW 2500, Australia
*
Author to whom correspondence should be addressed.
Dietetics 2025, 4(2), 12; https://doi.org/10.3390/dietetics4020012
Submission received: 5 December 2024 / Revised: 24 January 2025 / Accepted: 19 March 2025 / Published: 24 March 2025

Abstract

:
Climate change is a global priority requiring immediate action. A thorough understanding of the source of greenhouse gas emissions is essential to inform reduction strategies. This study aimed to quantify the climate footprint of two therapeutic diets—one diet for an adult with coeliac disease and one diet for an adult with type 2 diabetes—and then compare the climate footprint of these diets with the standard Australian diet and the Australian adapted EAT Lancet Planetary Health Diet. In addition, potential areas for reductions in greenhouse gas emissions were explored. All diets were developed for a 71-year-old male reference person. The amount of carbon dioxide produced by each diet was determined using the GWP* calculator for the reference person. Both the gluten-free and diabetic diet had a measurable climate footprint and were not considered climate-neutral. The diabetic diet produced 1.35 kg of carbon dioxide equivalents [CO2e] per day, and the gluten-free diet produced 2.51 kg of CO2e per day. Meat, dairy, and discretionary foods were the major contributors to the climate footprint of the two therapeutic diets. Substituting lamb for beef and soy milk for cow milk in the Australian context resulted in a 25% reduction in the climate footprint for the diabetic diet and 29% reduction for the gluten-free diet. Dietetic advice to reduce the climate footprint of therapeutic diets for coeliac disease and type 2 diabetes should focus on adapting diets to reduce animal-based products.

Graphical Abstract

1. Introduction

Climate change requires immediate action to stabilise the future of our planet [1]. There are several existing global targets outlining the scope of change required. The Paris Agreement [2], Agenda 2030 [3], and the United Nations’ Sustainable Development Goals [4] all seek to prioritise human health whilst simultaneously promoting environmental sustainability.
The Intergovernmental Panel on Climate Change [1] predicts that global warming of 1.5 °C will be exceeded during the 21st century unless drastic reductions in carbon dioxide (CO2) and other greenhouse gas emissions occur in the coming decades [1].
The consequences of this warming will include increases in the frequency and intensity of extreme weather patterns such as heatwaves, droughts, and precipitation [5]. These repercussions of climate change will be reflected in the disruption of and negative impact on terrestrial ecosystems and food security by contributing to desertification and land degradation [5].
Climate change and poor environmental conditions affect both food supply and security, through decreased crop yield, availability, and quality, which in turn negatively impact health [6,7]. A thorough understanding of the sources of greenhouse gases (GHGs) is essential for achieving climate stabilisation.
It is estimated that food production alone contributes between 19 and 29% of total global GHG emissions [5], with an additional 5–10% of GHGs from the combined effects of waste, consumption, and food processing [5,8]. Current Australian food production and consumption patterns are unsustainable and contribute to climate change [4,9,10].
Factors such as urbanisation and eating a Western-style diet are among the highest drivers leading to the instability of current food systems [8]. A typical Western-style diet contains excessive quantities of dairy, red meat, and discretionary items compared to the recommended healthy eating guidelines [11,12] and contributes to environmental degradation [10,13]. Discretionary foods that are high in saturated fat, added sugar, and salt amount to 27% of diet-related GHG emissions in Australia [12,13].
Existing research has indicated the potential for significantly lowering GHG emissions through the consumption of a diet consistent with the Australian Dietary Guidelines (ADG) [9,11]. Ridoutt et al. [9] analysed dietary data from >9300 adults in the Australian Health Survey to determine the CO2 produced per person each day. The analysis suggested that an average diet of 9514 kJ/day for a 71-year-old produced 3.1 kg of carbon dioxide equivalents per person per day (CO2e), whereas a diet consistent with the ADG was 42% lower, producing only 2.07 kg (CO2e) per day.
Given the urgency to address climate change and the intrinsic relationship between climate change and food, many dietetic accreditation bodies now explicitly require dietitians to understand and consider sustainability in their daily practice [6,14]. This extends to the provision of individual medical nutrition therapy, as well as advocacy for sustainable diets at a population level through policy change [6,14,15].
Minimal research and guidance exist to help dietitians apply these competencies, and there are insufficient data that quantify the environmental impact of various therapeutic diets in the Australian context [9,16,17]. We sought to quantify the impact of two common therapeutic diets managed by dietitians: the diabetic diet and the gluten-free diet.
Diabetes impacts approximately 5% of the Australian adult population [18]. The primary goals of treatment for diabetes are to consume a healthy diet to maintain a healthy weight range and reduce hyperglycaemia [19]. Coeliac disease is another common disease, affecting 1 in 70 Australians [20], with the only treatment being adherence to a strict gluten-free diet [20].
The role of therapeutic diets in the treatment of patients with diabetes and coeliac disease is integral to their management. Given the growing prevalence of these non-communicable diseases, a better understanding of the climate impact (or footprint) of these therapeutic diets is required. Currently, the lack of data on the climate impact of therapeutic diets limits the ability of health professionals and nutrition experts to make evidence-based recommendations regarding sustainable diets and lifestyles.
The aims of this study were as follows: (i) to quantify the climate impact (footprint) of two therapeutic diets, one for an individual with type 2 diabetes and one for an individual with coeliac disease; (ii) to compare the climate footprint of these diets with that of two reference diets (the current Australian diet; the Australian adapted EAT Lancet Planetary Health Diet); and (iii) to identify potential areas for reductions in greenhouse gas emissions in the therapeutic diets, offering a tangible solution for clinicians and patients. We hypothesised that the diet for people with type 2 diabetes and the gluten-free diet would have a neutral climate footprint and produce ≤ 0 kg/CO2e per day. The findings of this research may assist dietitians in the provision of dietetic education by improving our understanding of the environmental implications of these therapeutic diets.

2. Materials and Methods

2.1. Study Design

This was a desk-based study using publicly available data and did not require ethical approval.

2.2. Reference Diets

This study consisted of a secondary analysis of dietary data obtained from the following sources:
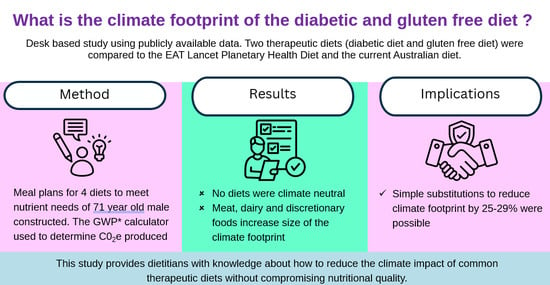
  • The Australian adapted EAT Lancet Planetary Health Diet, found in Supplementary Material Table S1 [21]. The Planetary Health Diet (PHD) was designed to be both sustainable and nutritionally adequate. To reflect the Australian context, the diet was adapted to include Australian vegetables such as sweet potato, with cassava and coconut oil in the place of palm oil (Supplementary Material Table S2).
  • The dietary intake of an Australian male aged 71 yrs was obtained from a previous study [22], whereby a food basket was constructed for an elderly couple based on the 2011 Australian Health Survey and with food intake consistent with the current Australian diet (Supplementary Material Table S3). The diet of the 71-yr-old male had significant amounts of energy from excessive discretionary food intake, with items generally high in saturated fats, added sugar, and salt, as well as meat intake exceeding the recommended levels.
  • A meal plan for an adult with type 2 diabetes (Supplementary Material Table S4). This was developed based on the Australian Dietary Guidelines [12] and based on freely available dietary education material provided by Diabetes Australia [23]. The meal plan contained 3 carbohydrate exchanges in main meals and one exchange in mid-meals. The meal plan additionally included low-glycaemic-index items and was low in added sugars and saturated fat.
  • A meal plan for an adult with coeliac disease (Supplementary Material Table S5). This was developed to meet the Australian Dietary Guidelines and to adhere to a strict gluten-free diet. The meal plan was constructed from the freely available dietary resources provided by Coeliac Australia [24].
All meal plans were adjusted to meet the nutrient needs of a 71-year-old male, which reflected the demographic profile of people most impacted by type 2 diabetes in Australia [18]. This reference person was selected to model the gluten-free diet for ease when comparing the results of the carbon footprint of the two therapeutic diets. This elderly reference person was consistent with a previous Australian study quantifying the climate footprint of a diet for a person with chronic kidney disease [17]. The Australian Nutrient Reference Values (NRVs) [25] were used to determine the energy needs of the reference person, assuming a physical activity level (PAL) of 1.4 (very sedentary) and weight of 85.8 kg, which is the median weight for a male in this age group according to the 2017 Australian Health Survey [26]. These calculations equated to an estimate of 8900 kJ per day.

2.3. Calculation of Climate Footprint

The climate footprints of the diets were estimated using the Global Warming Potential* (GWP*), the gold standard for estimating the climate footprint of foods [27]. The GWP* evaluates climate impact by specifically including cumulative impacts from CO2 and the additional contribution of short-lived gases such as methane [27]. As a result, the metric is particularly relevant to the evaluation of diets as methane, a comparatively short-lived GHG, is one of the most notable emissions from contemporary food systems [9,27,28]. The GWP* uses a Life Cycle Analysis (LCA) approach, considering all environmental impacts of food production and consumption including land use, water use, and gases produced in each stage of production [27,29,30]. The GWP* quantifies the amount of carbon dioxide (CO2) produced, as well as other gases via the conversion of gases such as nitrous oxide, methane, and hydrofluorocarbons into carbon dioxide equivalents (CO2e).
Nutritionally complete meal plans for each therapeutic diet for the reference person (71-year-old male) were analysed, with food intake converted to grams per day. This was achieved through utilising measurements of the meal plan when available and using standard measurements when specifics were not available. Teaspoons and tablespoons were measured as 5 g and 20 g, respectively. Food items described as whole dishes in the meal plans were broken down into core food ingredients in grams for analysis. For example, a gluten-free zucchini slice was entered into the calculator using the recipe on the Coeliac Australia website and including the weights of raw ingredients. The nutrient analysis programme FoodWorks 10 [31] was utilised for determining portion sizes of individual foods in grams for standard mixed dishes. The fruit and vegetable portion size was chosen as a medium or standard size according to the software, unless explicitly stated on the meal plan. The largest Australian online grocery store chains (Coles and Woolworths) were used to determine the size in grams of commercial products, such as gluten-free bread, pastas, and biscuits. The total weekly amount of food in grams per food group was calculated and then divided by seven to determine the daily amount.
Individual food items in grams per day were entered into the GWP* calculator [9] to determine the CO2e. This tool was developed by Ridoutt et al. [9]. This calculator comprised an excel spreadsheet of 232 Australian foods with CO2e values for each food. The weight of each food in the meal plan was multiplied by the GWP* CO2e value to arrive at the final amount of CO2e produced by each diet.
Food items not available in the calculator required appropriate substitutions to be made. A full list of ingredient assumptions and substitutions can be found in Supplementary Material Table S1. This required examining food items and dishes to determine the specific ratio and individual ingredients that made up the items and calculating the amount in grams of an appropriate substitute for entry into the calculator. For example, gluten-free bread was broken down into the following components for inclusion in the calculator: 15% seeds, 42.5% rice flour, and 42.5% tapioca.
The GWP* calculator was used to estimate the minimum climate footprint of all diets, including those for people with type 2 diabetes and coeliac disease. This was calculated as the estimated minimum amount of CO2e produced for each diet. The data were further categorised into each of the five core food groups and discretionary food groups according to the Australian Dietary Guidelines [12], to allow for the analysis of the CO2e contribution of each food group. When categorising food groups, nuts, seeds, pulses, and beans were classified as meat and alternatives for both therapeutic diets. Each diet was compared to the theoretical climate-neutral benchmark of 0 kg of CO2e produced per day (representing diets contributing to climate stabilisation [1,5]). Each diet was further analysed to identify the top 5 individual food items contributing to the total daily CO2e of each therapeutic diet. Suitable alternatives were modelled using the GWP* calculator to quantify the difference in CO2e based on the selection of similar food items with a smaller carbon footprint.

2.4. Statistical Analysis

A Weighted Chi-squared test was undertaken in SPSS [32] to test for significant differences in CO2e produced by each food group between the four diets. This type of test is the preferred method for analysing nominal variables in the form of proportions.

3. Results

3.1. CO2 Produced by Diets

The gluten-free diet had the highest climate impact, at 2.51 CO2e/kg produced per day. The Planetary Health Diet had the lowest climate impact, at 1.04 CO2e/kg per day (see Table 1 below).
When comparing the two therapeutic diets, the type 2 diabetes diet produced 46% less CO2e per day (1.35 CO2e/kg per day) compared to the gluten-free diet (2.51 CO2e/kg per day).

3.2. Contribution of Food Groups to CO2e

See Table 2 for a description of the highest contributing food groups for daily CO2e/kg across all four diets. The highest contributor in the current Australian diet was discretionary foods, followed by meat and alternatives. For the Planetary Health Diet and the gluten-free diet, meat and alternatives, followed by dairy and alternatives, was the highest contributor. For the type 2 diabetes diet, dairy and alternatives, followed by meat and alternatives, was the highest contributor. There were no statistically significant differences in the CO2e produced by each food group between the four diets analysed (p = 0.67). See Figure 1 below for a visual display of the percentage contribution of each food group to the total daily CO2e.
See Table 3 for the top five individual food items with the greatest CO2e contribution across all four diets.

3.3. Dietary Modelling

Several dietary scenarios were modelled to quantify the variation and reduction in CO2e per day for the two therapeutic diets. We substituted the diets with nutritionally similar food items that had a lower climate footprint to evaluate the impact of food choice on overall CO2e within diets. Targeting the highest contributors within both therapeutic diets, beef and full-fat cow’s milk were replaced with lamb and soy milk, respectively. This substitution resulted in a reduction in total daily CO2e emissions by 29% for the gluten-free diet and 25% for the type 2 diabetes diet (Table 4).

4. Discussion

This study extended the analysis conducted by Clay et al. of the carbon footprint of therapeutic diets in the Australian context using the GWP* calculator [17]. No diet analysed was found to be climate neutral as all produced >0 kg/CO2e per day. Therefore, the analysed diets did not align with the goals of the Paris Agreement [2] and the United Nations’ SDGs [4] of climate stabilisation. The diet for people with type 2 diabetes produced 46% less CO2e per day than the gluten-free diet and 43% less CO2e per day than the current Australian diet. The Planetary Health Diet produced the least amount of CO2e overall and half (56%) the amount of CO2e per day produced by the current Australian diet.
The food groups making the largest contribution to emissions across all four diets were the meat and alternatives, dairy and alternatives, and discretionary categories. These food groups contributed to over 82% of the climate footprint of the gluten-free diet, 65% of that of the type 2 diabetes diet, and over two-thirds of that of the Australian diet and Planetary Health Diet. Grains as a food group consistently contributed the least amount of CO2e across all four diets. These findings are consistent with previous research using the GWP* calculator, which indicated dairy, meat, and discretionary food items as major contributors to daily CO2e in Australia [9,13,17,33]. While direct comparison to the existing literature is difficult given limited research using the GWP* calculator, general trends can be observed in studies using similar metrics and food emission calculators. Research conducted in Australia, [11,13,34,35] the United States [36], Sweden [37], and Spain [38] have indicated the largest amounts of daily CO2e produced by meat, dairy, and discretionary foods. Additionally, several systematic reviews have evaluated the total GHG emissions of diets and found the highest contributors to be meat and dairy food groups, with the lowest climate contribution from vegetables, fruits, and grains [39,40]. Evidence suggests that diets based on nutritional recommendations are generally lower in greenhouse gas emissions [41]. Our findings demonstrated that diets that aligned more closely with the Australian dietary guidelines, characterised by increased vegetable and grain intake and reduced meat consumption, had a lower carbon footprint [9,13].
It was surprising to find the gluten-free diet contributed a greater amount of CO2e per day than the current Australian diet. This appeared to be related directly to the high frequency of beef meat consumption (with four main meals per week derived from beef). This is well known to have a high carbon footprint [9,17,42]. Dairy intake in the gluten-free diet was almost double (37% of CO2e) that of the current Australian diet (17% of CO2e), with dairy being another significant contributor to CO2e emissions.
Additionally, the low contribution of the grains food group across all diets was surprising. The contribution of grains in both the Planetary Health Diet and the gluten-free diet was less than one percent of total daily CO2e. This result can be explained by the choice of grains used in both diets, with the gluten-free diet relying heavily on wheat substitutes such as rice flour. The production of rice in Australia is acknowledged as being highly efficient and contributing positively to a climate cooling effect [17,43].
Previous studies have evaluated the impact of substituting meat for greater amounts of plant protein to reduce potential GHGEs [42]. Larger reductions in daily emissions were identified when additional measures, such as excluding meat consumption or selecting food products with low climate burdens, were adopted [38]. Harrison et al. describes the theory of nudges as subtle changes to the framing of information which can significantly influence behaviours of individuals without restricting choice [44]. Through modelling a variety of dietary substitutions, our findings demonstrated how simple strategies can be implemented to reduce the carbon footprint of therapeutic diets, without altering the therapeutic benefits. When implemented as nudges, these simple substitutions can allow diets to be individualised and increase the likelihood of individuals adopting lasting sustainable dietary patterns.
This was the first study to evaluate how specialised therapeutic diets for those with coeliac disease and type 2 diabetes in Australia may contribute to climate change. It was also the first to analyse these diets using the GWP* calculator. The evaluation was conducted using freely available, public-facing diet materials frequently used by members of the public and therefore provided relevant insight into these therapeutic diets. The use of the GWP* metric is a strength in that it is currently the most accurate and context-specific tool to evaluate daily CO2e [9]. Given the infancy of the GWP* metric, direct comparisons to the current literature and the widely used GWP100 metric are limited. The GWP* calculator does not estimate CO2e produced from packaging or waste. Therefore, the reported emissions must be viewed as the minimum amount of potential CO2e. The GWP* calculator is also limited in that it is not a comprehensive list of all foods, and several substitutions were applied to the therapeutic diets for analysis, particularly with the gluten-free diet; the full list of substitutions can be found in Supplementary Table S5. Additionally, the LCA used in this study [9] is specific and relevant to the current Australian food system. It is therefore not valid or generalisable to any other food systems, countries, or regions. Similarly, an elderly male reference person was used to generate dietary data; therefore, the results are not generalisable to other populations.
The results from this study reduce knowledge gaps and provide valuable insights into the climate footprint of two therapeutic diets commonly used in Australia. These insights can facilitate dietetic practice to support and educate patients to reduce their climate footprint, without jeopardising nutritional quality. Further research using the GWP* calculator is required. This includes expansion of the GQP* calculator in the Australian context to include additional food items, and consideration of components of the wider food system, such as food packaging, should be added to the calculator. The evaluation of other types of therapeutic diets and their climate footprints will aid dietitians in providing sustainable evidence-based nutrition interventions as required by current professional competencies [6].

5. Conclusions

This study demonstrated that the climate footprints of the gluten-free and diabetic diets were not neutral. Sustainability is therefore an important consideration when prescribing therapeutic diets. To reduce the climate footprint of these diets, simple substitutions to the food groups which contribute the largest amount of CO2e are necessary. As evidenced by the dietary modelling performed, the reduction in animal products including beef and milk by replacing them with items with a lower climate influence such as lamb and soy-based beverages will reduce emissions and result in a more sustainable dietary pattern for therapeutic diets in Australia. The continued dietary modelling of other therapeutic diets is needed which considers the nutritional adequacy and acceptability of food substitutions as well as the sustainability of food choices. Identifying therapeutic diets that enable individuals to prioritise health and environmental sustainability is the first step in developing strategies to shift consumer and practitioner behaviours to support a more sustainable future [42,44]. Ongoing advocacy by policy makers, dietitians, and researchers to support climate change reduction strategies also remains important.

Supplementary Materials

The following supporting information can be downloaded at https://www.mdpi.com/article/10.3390/dietetics4020012/s1. Table S1. List of substitutions and decision notes for calculations using GWP* calculator; Table S2. Food quantities for the Australian Adapted Planetary Health Diet per day; Table S3. Approximate amounts per day for the Current Australian Diet; Table S4. Type 2 Diabetes Diet: 7 day meal plan; Table S5. Gluten Free Diet: 7 day meal plan.

Author Contributions

Conceptualization, K.L. and R.O.; methodology, K.L.; formal analysis, R.O. and K.L. data curation, R.O. and K.L.; writing—original draft preparation, R.O. and K.L.; writing—review and editing, D.C. and K.L.; supervision, K.L. All authors have read and agreed to the published version of the manuscript.

Funding

This research received no external funding.

Institutional Review Board Statement

Ethical approval was not required for this study.

Informed Consent Statement

Not applicable.

Data Availability Statement

Data are available upon reasonable request from the authors.

Acknowledgments

Thank you to Bradley Wakefield, Biostatistician, University of Wollongong, for advice.

Conflicts of Interest

The authors declare no conflicts of interest.

References

  1. Intergovernmental Panel on Climate Change. Climate Change 2021 the Physical Science Basis; Intergovernmental Panel on Climate Change: Geneva, Switzerland, 2021. [Google Scholar]
  2. United Nations. Paris Agreement; United Nations: New York, NY, USA, 2015. [Google Scholar]
  3. United Nations. Transforming Our World: The 2030 Agenda for Sustainable Development; United Nations: New York, NY, USA, 2015. [Google Scholar]
  4. United Nations. The Sustainable Development Goals Report; United Nations: New York, NY, USA, 2022. [Google Scholar]
  5. Intergovernmental Panel on Climate Change. Climate Change and Land; Intergovernmental Panel on Climate Change: Geneva, Switzerland, 2020. [Google Scholar]
  6. Dietitians Australia. Healthy and Sustainable Diets; Dietitians Australia: Phillip, ACT, Australia, 2022. [Google Scholar]
  7. Tapsell, L.; Probst, Y.; Lawrence, M.; Friel, S.; Flood, V.; McMahon, A.T.; Butler, R. Food and Nutrition Security in the Australia-New Zealand Region: Impact of Climate Change. World Rev. Nutr. Diet. 2011, 102, 192–200. [Google Scholar] [PubMed]
  8. Bene, C.; Fanzo, J.; Prager, S.D.; Achicanoy, H.A.; Mapes, B.R.; Toro, P.A.; Cedrez, C.B. Global drivers of food system (un)sustainability: A multi-country correlation analysis. PLoS ONE 2020, 15, e0231071. [Google Scholar] [CrossRef]
  9. Ridoutt, B.; Baird, D.; Hendrie, G.A. Diets within Environmental Limits: The Climate Impact of Current and Recommended Australian Diets. Nutrients 2021, 13, 1122. [Google Scholar] [CrossRef] [PubMed]
  10. Willett, W.; Rockström, J.; Loken, B.; Springmann, M.; Lang, T.; Vermeulen, S.; Garnett, T.; Tilman, D.; DeClerck, F.; Wood, A.; et al. Food in the Anthropocene: The EAT–Lancet Commission on healthy diets from sustainable food systems. Lancet (Br. Ed.) 2019, 393, 447–492. [Google Scholar] [CrossRef]
  11. Hendrie, G.A.; Baird, D.; Ridoutt, B.; Hadjikakou, M.; Noakes, M. Overconsumption of Energy and Excessive Discretionary Food Intake Inflates Dietary Greenhouse Gas Emissions in Australia. Nutrients 2016, 8, 690. [Google Scholar] [CrossRef]
  12. National Health and Medical Research Council. Australian Dietary Guidelines Summary; National Health and Medical Research Council: Canberra, ACT, Australia, 2013.
  13. Hendrie, G.A.; Ridoutt, B.G.; Wiedmann, T.O.; Noakes, M. Greenhouse gas emissions and the Australian diet—Comparing dietary recommendations with average intakes. Nutrients 2014, 6, 289–303. [Google Scholar] [CrossRef]
  14. British Dietetic Association. Policy Statement Environmentally Sustainable Diets; British Dietetic Association: Birmingham, UK, 2021. [Google Scholar]
  15. Barbour, L.; Bicknell, E.; Brimblecombe, J.; Carino, S.; Fairweather, M.; Lawrence, M.; Slattery, J.; Woods, J.; World, E. Dietitians Australia position statement on healthy and sustainable diets. Nutr. Diet. 2022, 79, 6–27. [Google Scholar] [CrossRef]
  16. Hendrie, G.A.; Rebuli, M.A.; James-Martin, G.; Baird, D.L.; Bogard, J.R.; Lawrence, A.S.; Ridoutt, B. Towards healthier and more sustainable diets in the Australian context: Comparison of current diets with the Australian Dietary Guidelines and the EAT-Lancet Planetary Health Diet. BMC Public Health 2022, 22, 1939. [Google Scholar] [CrossRef]
  17. Clay, N.; Charlton, K.; Stefoska-Needham, A.; Heffernan, E.; Hassan, H.I.C.; Jiang, X.; Stanford, J.; Lambert, K. What is the climate footprint of therapeutic diets for people with chronic kidney disease? Results from an Australian analysis. J. Hum. Nutr. Diet. 2023, 36, 2246–2255. [Google Scholar] [CrossRef]
  18. Australian Institute of Health and Welfare. Diabetes: Australian Facts; Australian Institute of Health and Welfare: Canberra, ACT, Australia, 2022.
  19. Webster, C.C.; Murphy, T.E.; Larmuth, K.M.; Noakes, T.D.O.; Smith, J.A.H. Diet, diabetes status, and personal experiences of individuals with type 2 diabetes who self-selected and followed a low carbohydrate high fat diet. Diabetes Metab. Syndr. Obes. 2019, 12, 2567–2582. [Google Scholar] [CrossRef]
  20. Coeliac Australia, Coeliac Disease. 2023. Available online: https://coeliac.org.au/learn/coeliac-disease/ (accessed on 21 March 2025).
  21. Goulding, T.; Lindberg, R.; Russell, C.G. The affordability of a healthy and sustainable diet: An Australian case study. Nutr. J. 2020, 19, 109. [Google Scholar] [CrossRef] [PubMed]
  22. Lee, A.J.; Kane, S.; Lewis, M.; Good, E.; Pollard, C.M.; Landrigan, T.J.; Dick, M. Healthy diets ASAP—Australian Standardised Affordability and Pricing methods protocol. Nutr. J. 2018, 17, 88. [Google Scholar] [CrossRef] [PubMed]
  23. Diabetes Australia. Diabetes Australia Basic Healthy Eating Guide; Diabetes Australia: Turner, ACT, Australia, 2006. [Google Scholar]
  24. Coeliac Australia. Sample Meal Plans; Coeliac Australia: Sydney, NSW, Australia, 2015; Available online: https://coeliac.org.au/wp-content/uploads/file-asset/AdultsMealGuide2.pdf (accessed on 21 March 2025).
  25. Nutrient Reference Values. 2018. Available online: https://www.eatforhealth.gov.au/nutrient-reference-values (accessed on 21 March 2025).
  26. Australian Bureau of Statistics. National Health Survey: First Results 2017–2018; Australian Bureau of Statistics: Canberra, Australia, 2018.
  27. Cain, M.; Lynch, J.; Allen, M.R.; Fuglestvedt, J.S.; Frame, D.J.; Macey, A.H. Improved calculation of warming-equivalent emissions for short-lived climate pollutants. Clim. Atmos. Sci. 2019, 2, 29. [Google Scholar] [CrossRef]
  28. Allen, M.R.; Shine, K.P.; Fuglestvedt, J.S.; Millar, R.J.; Cain, M.; Frame, D.J.; Macey, A.H. A solution to the misrepresentations of CO2-equivalent emissions of short-lived climate pollutants under ambitious mitigation. Clim. Atmos. Sci. 2018, 1, 16. [Google Scholar] [CrossRef]
  29. Nemecek, T.; Jungbluth, N.; Canals, L.M.; Schenck, R. Environmental impacts of food consumption and nutrition: Where are we and what is next? Int. J. Life Cycle Assess. 2016, 21, 607–620. [Google Scholar] [CrossRef]
  30. Sala, S.; Anton, A.; McLaren, S.J.; Notarnicola, B.; Saouter, E.; Sonesson, U. In quest of reducing the environmental impacts of food production and consumption. J. Clean. Prod. 2017, 140, 387–398. [Google Scholar] [CrossRef]
  31. Xyris Pty Ltd. FoodWorks, Version 10.V10.0; Xyris Pty Ltd.: Brisbane, QLD, Australia, 2019. [Google Scholar]
  32. IBM Corp. IBM SPSS Statistics for Windows, 28th ed.; iBM Corp: Armonk, NY, USA, 2023. [Google Scholar]
  33. Ridoutt, B.G.; Hendrie, G.A.; Noakes, M. Dietary Strategies to Reduce Environmental Impact: A Critical Review of the Evidence Base. Adv. Nutr. 2017, 8, 933–946. [Google Scholar] [CrossRef]
  34. Candy, S.; Turner, G.; Larsen, K.; Wingrove, K.; Steenkamp, J.; Friel, S.; Lawrence, M. Modelling the Food Availability and Environmental Impacts of a Shift Towards Consumption of Healthy Dietary Patterns in Australia. Sustainability 2019, 11, 7124. [Google Scholar] [CrossRef]
  35. Ridoutt, B.; Baird, D.; Hendrie, G.A. Diets with Higher Vegetable Intake and Lower Environmental Impact: Evidence from a Large Australian Population Health Survey. Nutrients 2022, 14, 1517. [Google Scholar] [CrossRef]
  36. Heller, M.C.; Willits-Smith, A.; Meyer, R.; Keoleian, G.A.; Rose, D. Greenhouse gas emissions and energy use associated with production of individual self-selected US diets. Environ. Res. Lett. 2018, 13, 044004. [Google Scholar] [CrossRef]
  37. Mehlig, K.; Blomqvist, I.; Klingberg, S.; Bianchi, M.; Sjons, J.; Hunsberger, M.; Lissner, L. Secular trends in diet-related greenhouse gas emission estimates since 2000—A shift towards sustainable diets in Sweden. Public Health Nutr. 2021, 24, 3916–3921. [Google Scholar] [CrossRef] [PubMed]
  38. Batlle-Bayer, L.; Bala, A.; García-Herrero, I.; Lemaire, E.; Song, G.; Aldaco, R.; Fullana-I-Palmer, P. The Spanish Dietary Guidelines: A potential tool to reduce greenhouse gas emissions of current dietary patterns. J. Clean. Prod. 2019, 213, 588–598. [Google Scholar] [CrossRef]
  39. Aleksandrowicz, L.; Green, R.; Joy, E.J.; Smith, P.; Haines, A. The Impacts of Dietary Change on Greenhouse Gas Emissions, Land Use, Water Use, and Health: A Systematic Review. PLoS ONE 2016, 11, e0165797. [Google Scholar] [CrossRef]
  40. Clune, S.; Crossin, E.; Verghese, K. Systematic review of greenhouse gas emissions for different fresh food categories. J. Clean. Prod. 2017, 140, 766–783. [Google Scholar] [CrossRef]
  41. Rippin, H.L.; Cade, J.E.; Berrang-Ford, L.; Benton, T.G.; Hancock, N.; Greenwood, D.C. Variations in greenhouse gas emissions of individual diets: Associations between the greenhouse gas emissions and nutrient intake in the United Kingdom. PLoS ONE 2021, 16, e0259418. [Google Scholar] [CrossRef]
  42. O’Malley, K.; Willits-Smith, A.; Rose, D. Popular diets as selected by adults in the United States show wide variation in carbon footprints and diet quality. Am. J. Clin. Nutr. 2023, 117, 701–708. [Google Scholar] [CrossRef]
  43. Department of Agriculture, Fisheries and Forestry. Rice. 2025. Available online: https://www.agriculture.gov.au/agriculture-land/farm-food-drought/crops/rice#:~:text=From%20paddock%20to%20plate%2C%20Australian,of%20worlds%20best%20management%20practices (accessed on 21 March 2025).
  44. Harrison, J.D.; Patel, M.S. Designing Nudges for Success in Health Care. AMA J. Ethics 2020, 22, E796–E801. [Google Scholar] [CrossRef]
Figure 1. Contribution (%) from each food group to the climate footprint in four different therapeutic diets.
Dietetics 04 00012 g001
Table 1. Estimated CO2e produced by each diet.
DietCO2e per Day
(kg CO2e/kg)
CO2e per Week
(kg CO2e/kg)
CO2e per Year
(kg CO2e/kg)
Gluten-free diet2.5117.57916.15
Type 2 diabetes diet1.359.45492.75
Current Australian diet2.3816.63864.87
Planetary Health Diet1.047.29379.09
Table 2. Estimated CO2e produced by each diet according to food group per day.
Food GroupCurrent Australian Diet
(Kg CO2e/Kg)
Planetary Health Diet
(Kg CO2e/Kg)
Gluten-Free Diet
(Kg CO2e/Kg)
Type 2 Diabetes (Kg CO2e/Kg)
Fruit0.130.080.080.18
Vegetable0.080.130.380.17
Grains0.120.01−0.010.12
Dairy and Alternatives0.450.290.920.54
Meat and Alternatives0.770.371.010.16
Discretionary Foods0.820.180.130.18
Total CO2e Per Day2.371.042.511.35
Table 3. Main foods contributing to the climate footprint of each diet.
Largest Contributors—Food ItemCurrent Australian Diet
(kg CO2e per Day) #
Planetary Health Diet
(kg CO2e per Day) #
Gluten-Free
Diet
(kg CO2e per Day)
Type 2 Diabetes Diet
(kg CO2e per Day)
FirstBeef (0.59)Whole milk (0.26)Beef (0.36)Whole milk (0.27)
SecondBeef sausages (0.32)Olive oil (0.12)Cheese (0.34)Yoghurt (no sugar, no fruit) (0.16)
ThirdCheese (0.15)Beef meat (0.10)Chicken (0.31)Fish (mixed species) (0.15)
FourthMeat pie (0.11)Fish (mixed species) (0.08)Whole milk (0.30)Custard (0.12)
FifthProcessed chicken (0.10)Chicken (0.07)Yoghurt (no sugar, no fruit) (0.21)Cheese (0.11)
# Values derived from Clay et al. [17].
Table 4. Modelling of dietary scenarios to quantify changes in CO2e.
Food GroupGluten-Free Diet per Day (Kg CO2e/Kg)Revised Climate Footprint Version of Gluten-Free Diet per Day
(Kg CO2e/Kg)
Type 2 Diabetes
per Day
(Kg CO2e/Kg)
Revised Climate Footprint Version of Type 2 Diabetes Diet per Day
(Kg CO2e/Kg)
Fruit0.080.080.180.18
Vegetable0.380.380.170.17
Grains−0.01−0.010.120.12
Dairy and alternatives0.920.650.540.30
Meat and alternatives1.010.550.160.07
Discretionary foods0.130.130.180.18
Total per day2.511.781.351.02
Disclaimer/Publisher’s Note: The statements, opinions and data contained in all publications are solely those of the individual author(s) and contributor(s) and not of MDPI and/or the editor(s). MDPI and/or the editor(s) disclaim responsibility for any injury to people or property resulting from any ideas, methods, instructions or products referred to in the content.

