Article

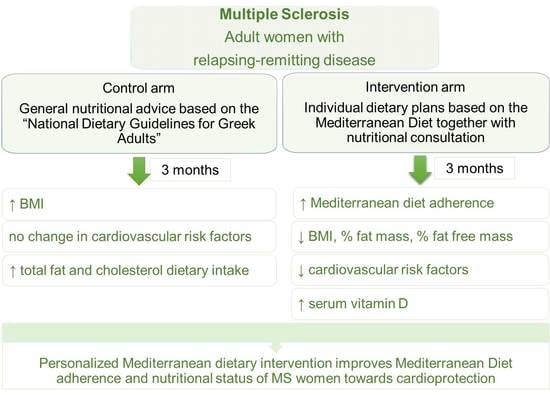
Personalized Nutritional Intervention to Improve Mediterranean Diet Adherence in Female Patients with Multiple Sclerosis: A Randomized Controlled Study

by
Panos Papandreou
1,†,
Aristea Gioxari
2,*,†,
Efstratia Daskalou
3,
Archontia Vasilopoulou
3 and
Maria Skouroliakou
4
1
Department of Nutrition, IASO Hospital, 37-39 Kifissias Ave., 15123 Maroussi, Greece
2
Department of Nutrition and Dietetics, School of Health Science, University of Peloponnese, 24100 Kalamata, Greece
3
Department of Nutrition, General Hospital of Thessaloniki “G. Gennimatas”, 41 E. Amynis Ave., 54635 Thessaloniki, Greece
4
Department of Dietetics and Nutritional Science, School of Health Science and Education, Harokopio University, 70 El. Venizelou Ave., 17671 Kallithea, Greece
*
Author to whom correspondence should be addressed.
These authors contributed equally to this work.
Dietetics 2022, 1(1), 25-38; https://doi.org/10.3390/dietetics1010004
Submission received: 2 January 2022 / Revised: 28 January 2022 / Accepted: 1 February 2022 / Published: 5 February 2022

Abstract

:
Background: Multiple sclerosis (MS) is a chronic immune-mediated central nervous system disorder that affects females twice as often as males. MS patients show increased susceptibility to obesity and related cardiometabolic disorders, while diet may influence disease course. In the present randomized controlled study, we aimed to increase Mediterranean Diet (MedDiet) adherence in MS women and improve their nutritional status. Methods: Adult women with relapsing-remitting MS (n = 40) were randomly allocated to intervention (n = 20) or control group (n = 20). Individual dietary plans based on MedDiet together with nutritional consultation were provided to the intervention group. Controls received general lifestyle advice according to “National Dietary Guidelines”. Medical history, anthropometry, dietary records, and blood withdrawal were performed at baseline and at 3 months. Results: Compared to controls, the intervention group demonstrated greater MedDiet adherence (p < 0.001), which was negatively associated with cholesterol intake levels (p < 0.05). At 3 months, women following MedDiet had ameliorated body weight and body composition compared to baseline (p < 0.001). Serum 1,25(OH)2D was significantly higher in both study groups at 3 months (p < 0.001), but in the intervention group, the mean increment was twofold compared to controls (p < 0.001). Conclusion: Personalized nutritional intervention in MS patients may improve MedDiet adherence and nutritional status towards cardioprotective health outcomes.

Graphical Abstract

1. Introduction

Multiple sclerosis (MS) is a chronic immune-mediated neurodegenerative disease that affects the central nervous system (CNS) [1]. Immune cells (i.e., T cells and macrophages) enter the CNS by breaking down the blood–brain barrier, and cause inflammatory lesions that in turn result in demyelination, reactive gliosis, sparing of axons, and finally, neurological disability [2]. It is suggested that the inflammatory state in MS persists under a genetic–epigenetic–environmental complex causing a variety of clinical symptoms depending on the site of MS lesions [3,4,5]. In addition to clinical and imaging examinations, routine blood test for the evaluation of inflammatory indices such as C-reactive protein (CRP) is usually applied [6]. Serum CRP levels have been shown to increase significantly in MS patients compared to healthy individuals [6].
The age of MS onset ranges between 20 and 40 years [1]. MS is usually initiated as a relapsing-remitting disease that affects females twice as often as males [1]. Over time, about 15−20 years after disease manifestation, most patients enter a second phase, experiencing gradual clinical deterioration [1,2]. Approximately 2.8 million individuals worldwide suffer from MS [7].
Patients with MS show increased susceptibility to cardiovascular diseases due to body weight increment and alterations in body composition towards a higher fat mass and a lower lean tissue mass [8]. At the same time, there is evidence that obesity is positively associated with the early onset of MS [9]. A suggested underlying mechanism is the potential crosstalk between low-grade chronic meta-inflammation of obesity and MS inflammation as determined by CRP [10].
Dietary factors may have an important impact on MS [11]. The majority of published data agree that a “Western” type of diet rich in animal fat increases MS susceptibility [12]. A high intake of saturated fatty acids (SFAs) or dietary cholesterol contributes to an atherogenic blood lipid profile, which in turn is associated with a high risk of MS relapse [13]. High animal fat intake may trigger the inflammatory cascade since they: (a) activate inflammatory toll-like receptors; (b) cause prostanoid release; (c) increase endotoxins; and (d) disrupt the blood-brain barrier integrity [11,12,13]. Additionally, increased consumption of animal fat may alter the fatty acid synthesis of the myelin sheaths leading to myelination defects [13]. Adhesion to a low SFA diet may be more beneficial for patients at early stages than late stages of the disease, while higher SFA consumption has been correlated with higher rates of disability [14].
During the last decade, the role of vitamin D (1,25-dihydroxy vitamin D) in MS has been extensively studied [5]. Low sun exposure and blood vitamin D levels are considered as significant factors that contribute to MS development and progression [5,15]. To this point, MS rates are higher in northern countries, where sunlight has a shorter duration [15]. The outcomes of a recent observational study showed that vitamin D hypovitaminosis correlates with both impaired cognition and disability in newly diagnosed MS patients [16]. It has been suggested that vitamin D is beneficial to CNS function as it soothes the pro-inflammatory process, promotes neuronal viability, and enhances neuronal growth factors [17,18,19].
The Mediterranean dietary (MedDiet) pattern is hypothesized to be beneficial to MS patients protecting against the development of cardiovascular diseases [20]. The MedDiet is mostly a plant-based diet that includes a variety of fruits, vegetables, whole grains, seeds, legumes, and olive oil, but is characterized by moderate intake of dairy products and low consumption of animal fats. However, little is known about the cardiovascular effects of the MedDiet on MS patients at the early stages.
Consequently, in the present randomized controlled study, we aimed to increase MedDiet adherence in women with relapsing-remitting MS and improve their nutritional status after a 3-month intervention period.

2. Materials and Methods

2.1. Ethics

Before the start of the trial, the Ethics Committee of Iaso Hospital (Athens, Greece) assessed and gave approval for the study protocol (Approval Code #E31052019). The trial was performed according to the principles of the Helsinki Declaration (1964) and terms of Good Clinical Practice. ClinicalTrials.gov protocol registration code: NCT05175378.

2.2. Participants

Adult women with MS who were outpatients of Iaso Hospital (Athens, Greece), were enrolled in the present study. Detailed information was provided using a leaflet, in which aims and methodology were described before recruitment. All participants fulfilled informed consent and kept a signed copy. The study took place during the winter season. All patients were recruited at the first week of December 2020 and the intervention lasted 3 months. Inclusion criteria: Adult women (≥18 years of age) with relapsing-remitting MS were enrolled. Diagnosis was based on the McDonald criteria [21], and patients should follow a standardized immunomodulatory therapy or other disease-modifying therapy for at least 6 months. The patient should be able to walk without aid or work a full day in a position of average difficulty, as indicated by scores of the Expanded Disability Status Scale (EDSS) < 4.5 [22]. Patients were included if at least one lesion on brain MRI and/or at least one relapse occurred in the past two years. Exclusion criteria: Women with concomitant illness, e.g., malignancy, infections, heart-, liver- or renal failure, congenital metabolic diseases, malabsorption, or cognitive disorders, were not eligible for this study. Patients who changed treatment during or ≤6 months before the start of the trial were also excluded. Psychiatric conditions, alcoholism, drug addiction, using vitamin or mineral supplements during or ≤6 months prior to screening, following a vegan diet ≤5 years prior to screening or using weight loss medications were additional exclusion criteria. Pregnant or lactating women were also not accepted.

2.3. Study Design

A 3-month single centered, randomized controlled study was performed. All patients were randomly assigned to either the control or the intervention group. An independent statistician applied simple randomization using a computer software, and provided the randomization sequence to the principal investigator of the study. The latter completed the participant form for each patient, including the type of treatment and the patient trial code, and put it in a sealed box. Blind-to-treatment allocation was maintained to the appointed physicians, nurses, and data analyst, in order to avoid bias.
At baseline, before the implementation of the trial, a personal interview was conducted with all participants.
In the intervention group, each MS patient received a personalized daily eating program that included specific meals, recipes, and food portions based on the principles of the Mediterranean diet (MedDiet). The dietary plan and all essential aspects for its design, e.g., body mass index (BMI), daily energy expenditure, classification of physical activity based on the concept of the metabolic equivalent of task (MET), caloric adjustment according to nutritional status, and macronutrient distribution were created for each individual using a Clinical Decision Support System (CDSS) database as previously described [23]. In brief, the CDSS database was firstly introduced at the Medical Nutrition Department of IASO, Athens Hospital, in 2016 by a team of scientists for clinical practice purposes. The software has been primarily used to assist clinical dieticians in (a) the nutritional assessment process, (b) designing dietary programs according to patients’ needs, and (c) monitoring patient progress. In the present study, the output of CDSS consisted of a daily eating program renewed every 15 days accompanied by general nutritional recommendations that were in line with the “National Dietary Guidelines for Adults”, also including physical activity advice from international organizations, e.g., WHO. These guidelines are addressed to the Greek adult population in the context of a communication campaign launched by the Public Health Organization “Prolepsis” in collaboration with the Greek Ministry of Health [24]. This guide is freely available online and aims to promote nutritional health awareness of the public towards a healthy body weight and lifestyle, based on the principles of the Mediterranean dietary pattern. An example of a CDSS eating plan is presented in Supplementary Materials (Table S1).
In the present study, the daily eating plan and guidelines created by CDSS were available to patients of the intervention group upon logging into their personal CDSS account, which in turn allowed them to track their progress regarding body weight, healthy food choices, and physical activity. Emphasis was also given on vitamin D dietary intake with moderate consumption (one portion per week) of fatty fish like salmon, mackerel, and daily intake of vitamin D-fortified foods, i.e., milk, cereals. Individual phone sessions with the appointed dietician were scheduled every 15 days to assist nutritional consultation.
On the other hand, patients of the control group received general nutritional and physical activity advice based on the “National Dietary Guidelines for Adults” [24] by individual phone sessions with the appointed dietician on a 15-day basis.
Throughout the 3-month intervention, all patients were instructed to keep (a) weekly food diaries consisting of two weekdays and one weekend day and (b) 24 h dietary records, which all were assessed remotely by emails and unexpected phone interviews. In all cases, two personal sessions were conducted with each patient of both groups at baseline and at 3 months.

2.4. Study Assessments

Medical history: The attending physician recorded all aspects of medical history, including MS stage, EDSS, symptomatology, treatment, cardiometabolic risk factors, and family history of cardiovascular disease.
Questionnaires: We applied a semi-quantitative Food Frequency Questionnaire (FFQ) to evaluate dietary intake [25]. Food replicas and pictures were demonstrated to help patients with the estimation of portion size. The MedDietScore was used to estimate MedDiet adherence from each FFQ; higher MedDiet scores corresponded to greater adherence [26]. All nutritional questionnaires and self-reported dietary records were processed by the Diet Analysis Plus software (version 6.1, Wadsworth 2003) for nutrient composition analysis. In the case of unlisted foods in the software, food labels were entered into the database. We also assessed levels of physical activity (expressed as METs-min per week) by implementing the “International Physical Activity Questionnaire” [27]. Psychological distress was evaluated using the self-reported Hospital Anxiety and Depression Scale (HADS) [28]. HADS score greater than 7 indicates a risk of having anxiety or depressive disorders [28].
Anthropometrics: Body weight (BW) in kilograms, fat mass (FM), and fat-free mass (FFM) percentages were measured at the beginning and at 3 months by air displacement plethysmography (BOD POD® Body Composition Tracking Systems, Life Measurement, Inc., Rome, Italy). Patients were instructed to abstain from exercise and any food or drink at least 2 h before measurement. Height was measured with a calibrated stadiometer to the nearest 0.1 cm (Seca 217, Seca, Hamburg, Germany). Body mass index (BMI) was calculated as the ratio of weight (kg) to the square of height (m2). BMI cut-offs for underweight, overweight, and obesity were <18.5, 25.0−29.9, and ≥30 kg/ m2, respectively [29].
Blood sample collection and measurements: Serum and plasma were isolated from 20 mL of whole blood that was withdrawn from each patient after overnight fasting at baseline and 3 months. Plasma was isolated in ethylenediamine tetraacetic acid (EDTA) containing tubes following centrifugation at 3000 rpm for 10 min at 4 °C. The same conditions were used to separate serum in blank tubes after allowing whole blood samples to clot at room temperature for 20 min. Freshly collected plasma and serum were used for all analyses. We used an automatic biochemical analyzer (Cobas 8000 modular analyzer, Roche Diagnostics GmbH, Mannheim, Germany) to measure biochemical indices, namely serum glucose (Glu), triacylglycerols (TG), high-density lipoprotein (HDL), low-density lipoprotein (LDL), total cholesterol (CHOL), and C-Reactive protein (CRP). Serum 1,25-dihydroxy vitamin D (1,25(OH)2D) analysis was performed with an automated chemiluminescence system (Cobas e 801 analytical module, Roche Diagnostics GmbH, Mannheim, Germany). Blood levels of 1,25(OH)2D lower than 18 pg/mL were considered as vitamin D deficiency [30].

2.5. Primary Outcome and Sample Size Calculation

The primary outcome of the present study was a significant rise in MedDiet adherence of patients belonging to the intervention group compared to controls at 3 months. Based on the outcomes of our previous work in early-stage breast cancer [31], when conducting a two-tailed t-test with 80% power and a 5% level of significance, a minimum 16 patients per group should be attained to achieve a clinically important MedDietScore difference of 3.0 with a standard deviation of mean (SD) equal to 3. Significant changes in dietary intake (e.g., total fat, monounsaturated fatty acids (MUFAs), SFAs, cholesterol, dietary fibers), cardiometabolic risk factors (such as BMI, FM, serum GLU, total CHOL, HDL, LDL, and TG), and psychological distress were set as secondary outcomes.

2.6. Statistical Analysis

All analyses were carried out with the SPSS statistical software (version 21.0, SPSS, Inc, ΙΒΜ, Chicago, IL, USA). The normality of data distribution was checked with the Kolmogorov–Smirnov test. For all variables, descriptive statistics was computed; continuous variables were expressed as mean ± standard deviation (SD), while dichotomous variables were expressed as counts. To assess the differences between two independent groups, the Student’s t-test was applied for normally distributed data. For not normally distributed data, the Mann–Whitney U-test was performed. To investigate differences within groups between the two time points, the paired samples t-test or the Wilcoxon test was performed for normally distributed and not normally distributed variables, respectively. Correlations between MedDietScore and dietary, anthropometric, and biochemical parameters were tested using the Pearson’s or the Spearman correlation coefficients for normally distributed and not normally distributed variables, respectively. Logistic regression analysis was carried out to ascertain the effects of age, body composition, dietary intake, MedDiet adherence, and blood markers on the likelihood that participants were in the intervention group. Statistical significance was set at p-value < 0.05.

3. Results

3.1. Participants

A total of 40 MS women met the inclusion criteria and gave their consent to participate in the study. As shown in the study’s flowchart (Figure 1), all patients completed the trial and were included in the final analysis.
All participants were residents of Attica, Greece, and had a Greek nationality. None of the participants was underweight, as shown in Table 1. Proportions of overweight and obesity were 25 and 10%, respectively. There were no statistically significant differences between the intervention and control groups at baseline, regarding anthropometrics, body composition, dietary intake, blood markers, physical activity metabolic equivalents, MedDietScore, as well as anxiety and depression scores (Table 1). All women were non-smokers and reported rare alcohol consumption.

3.2. Dietary Intake and Mediterranean Diet Adherence

In the intervention group, dietary intakes of total fat, cholesterol, and SFAs were significantly lower at 3 months compared to baseline, while intakes of MUFAs and fiber were significantly higher at the same study point (Table 2). Additionally, the control group had higher total fat intake (p < 0.001) and dietary cholesterol (p < 0.001), as well as lower MUFA intake compared to the intervention group at 3 months. The intervention group showed a significant change of the MedDietScore; more specifically, it increased by 3.35 units, indicating a high adherence to the Mediterranean diet compared to controls (p < 0.001) (Table 2). In fact, the MedDietScore was positively correlated with MUFA intake (r = 0.642, p = 0.045) and negatively correlated with total fat intake (r = −0.337, p = 0.001). In the control group, MedDietScore did not change at 3 months.
Dietary intake of sugars (g/day), vitamin C (mg/day), alpha-tocopherol (mg/day), and beta-carotene (μg/day), as well as consumption of fish, full-fat dairy products, red meat, whole grains, and nuts (expressed as portions per week) are presented in Supplementary Table S1.

3.3. Anthropometrics and Physical Activity

As shown in Table 2, patients following a personalized Mediterranean dietary plan showed significant decreases of BW, BMI, FM%, and FFM% at 3 months compared to baseline (p < 0.001). In regards to body weight, 2 out of 20 MS patients of the control group moved from normal weight to overweight at 3 months, whereas patients of the intervention group did not demonstrate any change. Last but not least, physical activity levels of MS women in the intervention group were higher at 3 months than at baseline (p = 0.013) and remained unchanged in controls, without reaching a statistical significance between the two groups at 3 months.

3.4. Blood Markers

Serum vitamin D concentrations were significantly higher in both study groups at 3 months (p < 0.001) (Table 2), but in the intervention group, the mean increment was twofold compared to controls (p < 0.001). Negative correlations were found between serum vitamin D with dietary total fat (r = −0.426, p = 0.008) and dietary cholesterol (r = −0.535, p = 0.000) at 3 months. In the intervention group, serum glucose significantly decreased at 3 months compared to baseline (p < 0.001), while the difference between the two groups tended to be statistically significant (p = 0.05). Blood levels of total cholesterol, LDL, HDL, TG, and CRP did not change significantly at 3 months in either study group.

3.5. Psychological Distress and Anxiety

As presented in Table 2, significant reductions in HADS depression scale (p < 0.001) and HADS-anxiety scale (p < 0.001) of the intervention group were recorded, and changes were statistically different from those in the control group (p = 0.014 and p = 0.020, respectively).

3.6. Regression Analysis

A binary logistic regression model was performed to ascertain the effects of age, FM, BMI, SFA intake, cholesterol intake, MedDiet score, and serum TG, HDL, and CRP on the likelihood that participants were in the intervention group (Table 3). The model was statistically significant (p < 0.001), and total predictors explained 77.5% of the variability of the dependent variable and correctly classified 94.7% of the enrolled cases. Dietary cholesterol and MedDietScore were found to be significant predictors in the model (p < 0.05). The odds ratio (OR) for MedDietScore was 3.134 (95% CI 1.042–9.424) and for dietary cholesterol was 0.942 (95% CI: 0.896–0.990). Thus each additional point of MedDietScore elevation was associated with an increased likelihood by 3.134 of patients with MS being allocated in the intervention group. Furthermore, the increment of dietary cholesterol intake was associated with a decreased likelihood for MS patients being in the intervention group (Table 3).

4. Discussion

The present study aimed to assess the effects of personalized lifestyle modifications on MedDiet adherence of female outpatients with relapsing-remitting MS in Greece. After the implementation of a 3-month intervention, MS patients that received a personalized nutritional program together with consultation demonstrated a greater MedDiet adherence compared to controls and ameliorated body composition and blood markers profiles.
It is well documented that MS is found to be more prevalent in females than males [1,32], therefore, the nutritional intervention in the present study involved women patients. The Mediterranean diet has been extensively studied as a protective factor for diseases that involve chronic inflammation, such as MS [33]. In a recent case-control study, MS patients were found to be less likely to follow a MedDiet type diet compared to healthy controls [34]. Black et al. (2019) assessed two dietary patterns, a healthy and a Western type. They found that one-standard deviation increment of the healthy pattern score was associated with a 25% reduced risk of a first clinical diagnosis of central nervous system demyelination [35]. Thus, adherence to a healthy diet such as the MedDiet is an important aspect for MS patients. In the present study, patients of the intervention group moved towards a higher MedDiet adherence at 3 months since the mean MedDiet score was significantly improved compared to the control group by about 3 units. Similar results were observed in a previously published randomized-controlled study of our research team in which amelioration of the MedDiet score by about 3 units was related to the improved nutritional status of women with breast cancer at stages I-IIIA [23]. In 2015, Hadgkiss et al. reported significant associations of healthy dietary habits with a lower level of disability in MS patients [36]. In the intervention group of the present study, dietary intake of MUFAs and fiber was significantly higher, and that of total fat was significantly lower than the control group, reflecting the principles of MedDiet. Intake of SFAs in the intervention group significantly declined compared to baseline, although no significant difference has evident between the two groups (intervention and control group) at 3 months. Saturated fat and dietary fiber are two dietary parameters that have been appointed by researchers for their role in MS. Saturated fat is linked to inflammation as well as to the cardiovascular risk, and mechanisms include the increment of LDL cholesterol and activation of pro-inflammatory receptors [11,37]. Dietary fibers are beneficial in several ways in MS as they contribute to the reduction of cholesterol levels—a risk factor for nervous system demyelination and cardiovascular risk, and improve blood glucose levels. High glucose levels raise insulin production, which in turn up-regulates arachidonic acid and its pro-inflammatory derivatives [38]. High fiber foods are fermented by the gut microbiota to produce short-chain fatty acids (SCFAs), which favor immunomodulation and decline the release of pro-inflammatory cytokines [11].
The MedDietScore, a tool that estimates adherence to MedDiet and has been linked to cardiovascular health [27], was used in the present study. Besides the significant increment of overall MedDiet score in the intervention group, cardiovascular blood biomarkers, i.e., total cholesterol, LDL, and HDL remained unchanged, except for TG, which tended to increase (p = 0.060). Additionally, in the intervention group, fasting glucose decreased significantly at the 3 months.
Another molecule with a pivotal role in chronic inflammatory diseases, including MS, is vitamin D. It is well documented that serum vitamin D levels are inversely correlated with MS disease activity and progression [39]. A potential underlying mechanism is the implication of vitamin D in the regulation of the immune response; immune cells, i.e., dendritic cells, macrophages, and T and B cells express the vitamin D receptor and the key enzyme in vitamin D metabolism, 1 α-hydroxylase [40]. For instance, it is suggested that vitamin D suppresses the maturation of dendritic cells and inhibits the production of T-cell-derived inflammatory cytokines like interferon-γ (IFNγ) and tumor necrosis factor-α (TNF-α) [40]. According to a recent study that involved patients with relapsing-remitting MS, vitamin D may exert immunoregulatory effects by favorably changing the expression of DNA repair genes [41]. The main source of vitamin D is sun exposure, as well as diet and vitamin D supplementation [39]. Our study took place during the winter months, a period in which exposure to sunlight is usually insufficient. Furthermore, none of the patients took vitamin D supplementation. In contrast to controls who received general advice on vitamin D intake, patients of the intervention group followed a personalized eating plan that emphasized vitamin D intake, i.e., moderate consumption of fatty fish and daily intake of vitamin D-fortified foods, i.e., milk and cereals. Results showed that vitamin D concentration was significantly higher at 3 months compared to baseline for both study groups, but the mean increment in the intervention group was twofold than controls. Therefore, we concluded that the personalized diet had an additional impact on the endpoint vitamin D concentration of the intervention group.
Inflammation has been extensively studied for its relation to cardiovascular disease, which may have similar pathophysiology to multiple sclerosis. The so-called “healthy diets” such as the MedDiet are negatively associated with blood levels of inflammatory markers, compared to Western-type diets, which are considered to promote inflammation [42]. No significant alteration was observed for CRP levels between groups.
Nutrition-related health conditions such as obesity and cardiovascular disease may play a role in MS pathogenesis and disease progression [43,44]. In the present study, overall proportions of overweight and obesity were 25 and 10%, respectively. At 3 months, there was no change in weight status of intervention participants, nevertheless, two out of twenty controls moved from healthy weight range to overweight, as expressed by BMI. Obesity is positively associated with inflammation and is recognized as an important risk factor for MS onset, also influencing disease prognosis [45].
The wellness of MS patients implies a holistic approach that combines a healthy diet, optimal nutrition status, exercise and psychological health. In the present study, personalized consultation resulted in the improved well-being of MS patients, as they had a better nutritional status, a higher MedDiet adherence, and physical activity levels, as well as less presence of anxiety and depressive states, as assessed by the HADS scale. Lifestyle factors such as inadequate nutrition and physical activity have been associated with increased HADS scores in MS [46], while the MedDiet has been shown to improve depression, anxiety, and psychological distress [47]. The potential link of MedDiet with psychological disorders might be attributed to its nutrient content. MedDiet is rich in fibers, MUFA, and omega 3 fatty acids, as well as magnesium, vitamins B1, B2, B6, B12, and folate, which have been shown to exert favorable effects on psychological distress. The low glycemic index of MedDiet could also be beneficial, as it contributes to decreased risk of insulin resistance, which in turn is protective against psychological distress. Furthermore, the anti-inflammatory properties of MedDiet have been negatively associated with psychological disorders [46,47].
Multiple sclerosis implies an enormous economic burden on healthcare systems as well as non-medical costs affecting the patient [48]. To this point, adherence to MedDiet is characterized by a low cost-effectiveness ratio. It has been reported that MedDiet improves life expectancy and health status and reduces total lifetime costs [49]. In the present study, the intervention group received lifestyle guidelines with an emphasis on MedDiet.
Study limitations: We recognize that the sample size of the present randomized controlled study is small. Nevertheless, patients were enrolled with precise inclusion and exclusion criteria applying a randomization protocol. We are also aware that the administration of self-reported tools that assess nutritional or lifestyle factors could be a source of bias. To avoid this, all questionnaires used in the present trial were already validated for Greek populations. Despite no evidence of a significant difference in METs-min/week between groups at 3 months, the observed amelioration of nutritional status in the intervention group could be attributed to the rise of physical activity levels compared to baseline, placing a bias in the study outcomes. Another limitation that should not be neglected is the contamination of the intervention protocol in the control group that is usually observed in nutritional intervention studies [50]. To address this, all appointed researchers were well experienced, being able to identify and resolve possible disparities throughout the intervention process.

5. Conclusions

In the present randomized controlled study, provision of personalized nutritional intervention based on the principles of MedDiet together with consultation for 3 months, improved MedDiet adherence in women with relapsing-remitting MS. Patients following MedDiet ameliorated body weight towards a favorable body composition, and improved serum 1,25(OH)2D, a vitamin with a central role in CNS function and cardiovascular health. Therefore, increased adherence to MedDiet may exert beneficial effects against cardiometabolic disorders in women with MS. However, larger randomized controlled clinical trials are needed to confirm the cardioprotective properties of MedDiet in MS patients.

Supplementary Materials

The following supporting information can be downloaded at: https://www.mdpi.com/article/10.3390/dietetics1010004/s1, Table S1: Standard diet 1800 KCAL (Hypocaloricdiet) for weight loss, Table S2: Additional dietary factors assessed at baseline and 3 months in both the intervention and the control group.

Author Contributions

Conceptualization, M.S.; methodology, P.P. and A.G.; software, A.G. and E.D.; validation, M.S., A.G., E.D., P.P. and A.V.; formal analysis, A.G. and E.D.; investigation, P.P.; resources, M.S.; data curation, A.G. and E.D.; writing—original draft preparation, P.P., A.G., E.D. and A.V.; writing—review and editing, P.P., A.G., E.D. and A.V.; visualization, M.S.; supervision, M.S.; project administration, P.P. All authors have read and agreed to the published version of the manuscript.

Funding

This research received no external funding.

Institutional Review Board Statement

The study was conducted in accordance with the Declaration of Helsinki and approved by the Ethics Committee of Iaso Hospital (Approval Code #E31052019). ClinicalTrials.gov protocol registration code: NCT05175378.

Informed Consent Statement

Informed consent was obtained from all subjects involved in the study. Written informed consent has been obtained from patients to publish this paper.

Data Availability Statement

The data that support the findings of this study are included within the article and in its Supplemental Materials. Raw data are available from the corresponding author, [A.G.], upon reasonable request.

Acknowledgments

All authors express their gratitude to all patients who volunteered to take part in the study.

Conflicts of Interest

The authors declare no conflict of interest.

References

  1. Huang, W.-J.; Chen, W.-W.; Zhang, X. Multiple sclerosis: Pathology, Diagnosis and Treatments. Exp. Ther. Med. 2017, 13, 3163–3166. [Google Scholar] [CrossRef] [PubMed] [Green Version]
  2. Faissner, S.; Plemel, J.R.; Gold, R.; Yong, V.W. Progressive Multiple Sclerosis: From Pathophysiology to Therapeutic Strategies. Nat. Rev. Drug Discov. 2019, 8, 905–922. [Google Scholar] [CrossRef] [PubMed]
  3. Axisa, P.P.; Hafler, D.A. Multiple sclerosis: Genetics, Biomarkers, Treatments. Curr. Opin. Neurol. 2016, 29, 345–353. [Google Scholar] [CrossRef]
  4. Iridoy Zulet, M.; Pulido Fontes, L.; Ayuso Blanco, T.; Lacruz Bescos, F.; Mendioroz Iriarte, M. Epigenetic Changes in Neurology: DNA Methylation in Multiple Sclerosis. Neurologia 2017, 32, 463–468. [Google Scholar] [CrossRef] [PubMed]
  5. Belbasis, L.; Bellou, V.; Evangelou, E.; Tzoulaki, I. Environmental Factors and Risk of Multiple Sclerosis: Findings from Meta-Analyses and Mendelian Randomization Studies. Mult. Scler. 2019, 26, 397–404. [Google Scholar] [CrossRef]
  6. Soilu-Hänninen, M.; Koskinen, J.O.; Laaksonen, M.; Hänninen, A.; Lilius, E.M.; Waris, M. High sensitivity measurement of CRP and disease progression in multiple sclerosis. Neurology 2005, 65, 153–155. [Google Scholar] [CrossRef]
  7. MS International Federation. Atlas of MS 3D Edition. PART 1: Mapping Multiple Sclerosis around the World Key Epidemiology Findings. Available online: https://www.msif.org/wp-content/uploads/2020/10/Atlas-3rd-Edition-Epidemiology-report-EN-updated-30-9-20.pdf (accessed on 3 September 2020).
  8. Wingo, B.C.; Young, H.-J.; Motl, R.W. Body composition differences between adults with multiple sclerosis and BMI-matched controls without MS. Disabil. Health J. 2018, 11, 243–248. [Google Scholar] [CrossRef]
  9. Gianfrancesco, M.A.; Barcellos, L.F. Obesity and Multiple Sclerosis Susceptibility: A Review. J. Neurol. Neuromed. 2016, 1, 1–5. [Google Scholar] [CrossRef]
  10. Baynard, T.; Hilgenkamp, T.I.M.; Schroeder, E.C.; Motl, R.W.; Fernhall, B. Measures of Adiposity Differentially Correlate with C-reactive Protein Among Persons with Multiple Sclerosis. Mult. Scler. Relat. Disord. 2018, 25, 1–4. [Google Scholar] [CrossRef]
  11. Katz Sand, I. The Role of Diet in Multiple Sclerosis: Mechanistic Connections and Current Evidence. Curr. Nutr. Rep. 2018, 7, 150–160. [Google Scholar] [CrossRef] [Green Version]
  12. Matveeva, O.; Bogie, J.F.J.; Hendriks, J.J.A.; Linker, R.A.; Haghikia, A.; Kleinewietfeld, M. Western lifestyle and immunopathology of multiple sclerosis. Ann. N. Y. Acad. Sci. 2018, 1417, 71–86. [Google Scholar] [CrossRef] [PubMed] [Green Version]
  13. Zhang, S.M.; Willett, W.C.; Hernán, M.A.; Olek, M.J.; Ascherio, A. Dietary Fat in Relation to Risk of Multiple Sclerosis among Two Large Cohorts of Women. Am. J. Epidemiol. 2000, 152, 1056–1064. [Google Scholar] [CrossRef] [PubMed] [Green Version]
  14. Swank, R.L.; Dugan, B.B. Effect of low saturated fat diet in early and late cases of multiple sclerosis. Lancet 1990, 336, 37–39. [Google Scholar] [CrossRef]
  15. Ascherio, A.; Munger, K.L. Epidemiology of Multiple Sclerosis: From Risk Factors to Prevention—An Update. Semin. Neurol. 2016, 36, 103–114. [Google Scholar] [CrossRef] [PubMed]
  16. Virgilio, E.; Vecchio, D.; Crespi, I.; Barbero, P.; Caloni, B.; Naldi, P.; Cantello, R.; Dianzani, U.; Comi, C. Vitamin D as a Marker of Impaired Information Processing Speed and Early Disability in Multiple Sclerosis Patients. Brain Sci. 2021, 11, 1521. [Google Scholar] [CrossRef]
  17. Martens, P.J.; Gysemans, C.; Verstuyf, A.; Mathieu, A.C. Vitamin D’s Effect on Immune Function. Nutrients 2020, 12, 1248. [Google Scholar] [CrossRef]
  18. Miclea, A.; Bagnoud, M.; Chan, A.; Hoepner, R. A Brief Review of the Effects of Vitamin D on Multiple Sclerosis. Front. Immunol. 2020, 11, 781. [Google Scholar] [CrossRef]
  19. Bivona, G.; Gambino, C.M.; Iacolino, G.; Ciaccio, M. Vitamin D and the Nervous System. Neurol. Res. 2019, 41, 827–835. [Google Scholar] [CrossRef]
  20. Martínez-González, M.A.; Gea, A.; Ruiz-Canela, M. The Mediterranean Diet and Cardiovascular Health. Circ. Res. 2019, 124, 779–798. [Google Scholar] [CrossRef]
  21. Thompson, A.J.; Banwell, B.L.; Barkhof, F.; Carroll, W.M.; Coetzee, T.; Comi, G.; Correale, J.; Fazekas, F.; Filippi, M.; Freedman, M.S.; et al. Diagnosis of Multiple Sclerosis: 2017 Revisions of the Mcdonald Criteria. Lancet Neurol. 2018, 17, 162–173. [Google Scholar] [CrossRef]
  22. Kurtzke, J.F. Rating neurologic impairment in multiple sclerosis: An Expanded Disability Status Scale (EDSS). Neurology 1983, 33, 1444–1452. [Google Scholar] [CrossRef] [PubMed] [Green Version]
  23. Papandreou, P.; Gioxari, A.; Nimee, F.; Skouroliakou, M. Application of Clinical Decision Support System to Assist Breast Cancer Patients with Lifestyle Modifications during the COVID-19 Pandemic: A Randomised Controlled Trial. Nutrients 2021, 13, 2115. [Google Scholar] [CrossRef] [PubMed]
  24. National Dietary Guidelines for Adults: Ten steps to healthy eating. Available online: http://www.diatrofikoiodigoi.gr/default.aspx?page=home. (accessed on 13 December 2021).
  25. Trichopoulou, A.; Bamia, C.; Trichopoulos, D. Mediterranean Diet and Survival Among Patients with Coronary Heart Disease in Greece. Arch. Intern. Med. 2005, 165, 929–935. [Google Scholar] [CrossRef] [PubMed] [Green Version]
  26. Panagiotakos, D.B.; Pitsavos, C.; Stefanadis, C. Dietary patterns: A Mediterranean Diet Score and its Relation to Clinical and Biological Markers of Cardiovascular Disease Risk. Nutr. Metab. Cardiovasc. Dis. 2006, 16, 559–568. [Google Scholar] [CrossRef]
  27. Papathanasiou, G.; Georgoudis, G.; Papandreou, M.; Spyropoulos, P.; Georgakopoulos, D.; Kalfakakou, V.; Evangelou, A. Reliability Measures of the Short International Physical Activity Questionnaire (IPAQ) in Greek Young Adults. Hell. J. Cardiol. 2009, 50, 283–294. [Google Scholar]
  28. Zigmond, A.S.; Snaith, R.P. The Hospital Anxiety and Depression Scale. Acta Psychiatr. Scand. 1983, 67, 361–370. [Google Scholar] [CrossRef] [Green Version]
  29. World Health Organization (WHO). Obesity and Overweight: Fact Sheets. Available online: https://www.who.int/news-room/fact-sheets/detail/obesity-and-overweight. (accessed on 9 June 2021).
  30. Valentini, A.; Perrone, M.A.; Cianfarani, M.A.; Tarantino, U.; Massoud, R.; Merra, G.; Bernardini, S.; Morris, H.A.; Bertoli, A. Obesity, Vitamin D Status and Physical Activity: 1,25(OH)2D as a Potential Marker of Vitamin D Deficiency in Obese Subjects. Panminerva Med. 2020, 62, 83–92. [Google Scholar] [CrossRef]
  31. Skouroliakou, M.; Grosomanidis, D.; Massara, P.; Kostara, C.; Papandreou, P.; Ntountaniotis, D.; Xepapadakis, G. Serum Antioxidant Capacity, Biochemical Profile and Body Composition of Breast Cancer Survivors in a Randomized Mediterranean Dietary Intervention Study. Eur. J. Nutr. 2017, 57, 2133–2145. [Google Scholar] [CrossRef]
  32. Harbo, H.F.; Gold, R.; Tintoré, M. Sex and gender issues in multiple sclerosis. Ther. Adv. Neurol. Disord. 2013, 6, 237–248. [Google Scholar] [CrossRef] [Green Version]
  33. Gotsis, E.; Anagnostis, P.; Mariolis, A.; Vlachou, A.; Katsiki, N.; Karagiannis, A. Health Benefits of the Mediterranean Diet. Angiology 2014, 66, 304–318. [Google Scholar] [CrossRef]
  34. Sedaghat, F.; Jessri, M.; Behrooz, M.; Mirghotbi, M.; Rashidkhani, B. Mediterranean Diet Adherence and Risk of Multiple Sclerosis: A Case-Control Study. Asia Pac. J. Clin. Nutr. 2016, 25, 377–384. [Google Scholar] [CrossRef]
  35. Black, L.J.; Baker, K.; Ponsonby, A.-L.; van der Mei, I.; Lucas, R.M.; Pereira, G.; Ausimmune Investigator Group. A Higher Mediterranean Diet Score, Including Unprocessed Red Meat, is Associated with Reduced Risk of Central Nervous System Demyelination in a Case-Control Study of Australian Adults. J. Nutr. 2019, 149, 1385–1392. [Google Scholar] [CrossRef] [PubMed]
  36. Hadgkiss, E.J.; Jelinek, G.A.; Weiland, T.J.; Pereira, N.G.; Marck, C.H.; van der Meer, D.M. The Association of Diet with Quality of Life, Disability, and Relapse Rate in an International Sample of People with Multiple Sclerosis. Nutr. Neurosci. 2015, 18, 125–136. [Google Scholar] [CrossRef] [PubMed] [Green Version]
  37. Bagur, M.J.; Murcia, M.A.; Jiménez-Monreal, A.M.; Tur, J.A.; Bibiloni, M.M.; Alonso, G.L.; Martínez-Tomé, M. Influence of Diet in Multiple Sclerosis: A Systematic Review. Adv. Nutr. 2017, 8, 463–472. [Google Scholar] [CrossRef] [PubMed] [Green Version]
  38. Riccio, P.; Rossano, R. Nutrition Facts in Multiple Sclerosis. ASN Neuro. 2015, 7, 8185. [Google Scholar] [CrossRef] [Green Version]
  39. Sintzel, M.B.; Rametta, M.; Reder, A.T. Vitamin D and Multiple Sclerosis: A Comprehensive Review. Neurol. Ther. 2018, 7, 59–85. [Google Scholar] [CrossRef] [PubMed] [Green Version]
  40. Ao, T.; Kikuta, J.; Ishii, M. The Effects of Vitamin D on Immune System and Inflammatory Diseases. Biomolecules 2021, 11, 1624. [Google Scholar] [CrossRef] [PubMed]
  41. Amirinejad, R.; Shirvani-Farsani, Z.; Naghavi Gargari, B.; Sahraian, M.A.; Mohammad Soltani, B.; Behmanesh, M. Vitamin D changes expression of DNA repair genes in the patients with multiple sclerosis. Gene 2021, 781, 145488. [Google Scholar] [CrossRef]
  42. Esposito, S.; Sparaco, M.; Maniscalco, G.T.; Signoriello, E.; Lanzillo, R.; Russo, C.; Carmisciano, L.; Cepparulo, S.; Lavorgna, L.; Gallo, A.; et al. Lifestyle and Mediterranean Diet Adherence in a Cohort of Southern Italian Patients with Multiple Sclerosis. Mult. Scler. Related Disord. 2021, 47, 102636. [Google Scholar] [CrossRef]
  43. Parks, N.E.; Jackson-Tarlton, C.S.; Vacchi, L.; Merdad, R.; Johnston, B.C. Dietary interventions for multiple sclerosis-related outcomes. Cochrane Database Syst. Rev. 2020, 5, CD004192. [Google Scholar] [CrossRef]
  44. Munger, K.L.; Chitnis, T.; Ascherio, A. Body Size and Risk of MS in Two Cohorts of US Women. Neurology 2009, 73, 1543–1550. [Google Scholar] [CrossRef] [PubMed] [Green Version]
  45. Russell, R.D.; Langer-Gould, A.; Gonzales, E.G.; Smith, J.B.; Brennan, V.; Pereira, G.; Lucas, R.M.; Begley, A.; Black, L.J. Obesity, Dieting, and Multiple Sclerosis. Mult. Scler. Rel. Disord. 2019, 39, 101889. [Google Scholar] [CrossRef] [PubMed]
  46. Gascoyne, C.R.; Simpson, S.; Chen, J.; van der Mei, I.; Marck, C.H. Modifiable Factors Associated with Depression and Anxiety in Multiple Sclerosis. Acta Neurol. Scand. 2019, 40, 204–211. [Google Scholar] [CrossRef] [PubMed]
  47. Sadeghi, O.; Keshteli, A.H.; Afshar, H.; Esmaillzadeh, A.; Adibi, P. Adherence to Mediterranean dietary pattern is inversely associated with depression, anxiety and psychological distress. Nutr. Neurosci. 2019, 24, 248–259. [Google Scholar] [CrossRef]
  48. Paz-Zulueta, M.; Parás-Bravo, P.; Cantarero-Prieto, D.; Blázquez-Fernández, C.; Oterino-Durán, A. A Literature Review of Cost-Of-Illness Studies on the Economic Burden of Multiple Sclerosis. Mult. Scler. Rel. Disord. 2020, 43, 102162. [Google Scholar] [CrossRef]
  49. Saulle, R.; Semyonov, L.; La Torre, G. Cost and Cost-Effectiveness of the Mediterranean Diet: Results of a Systematic Review. Nutrients 2013, 5, 4566–4586. [Google Scholar] [CrossRef]
  50. Staudacher, H.M.; Irving, P.M.; Lomer, M.C.E.; Whelan, K. The Challenges of Control Groups, Placebos and Blinding in Clinical Trials of Dietary Interventions. Proc. Nutr. Soc. 2017, 76, 203–212. [Google Scholar] [CrossRef] [Green Version]
Figure 1. Trial flowchart.
Dietetics 01 00004 g001
Table 1. Characteristics of MS patients at baseline.
CharacteristicsEnrolled Patients
(n = 40)
Control Group
(n = 20)
Intervention Group
(n = 20)
p-Value
Females402020-
Age (years)29 ± 630 ± 829 ± 4NS
EDSS0.75 ± 1.161.0±1.30.75±1.16NS
Treatment
Fingolimod
402020-
BW (kg)71.7 ± 17.772.0 ± 19.471.4 ± 16.3NS
BMI (kg/m2)
<18.5
18.5–24.9
25–29.9
>30
24.4 ± 4.9
0
26
10
4
24.71 ± 5.6
0
14
4
2
24.0 ± 4.3
0
10
8
2
NS
FM%19.2 ± 11.0 19.7 ± 11.418.8 ± 10.8NS
FFM%52.4 ± 10.8 52.3 ± 12.152.6 ± 9.7NS
Glucose (mg/dL)98.5 ± 15.8100.6 ± 6.796.3 ± 21.6NS
Total cholesterol (mg/dL)193.8 ± 45.6190.2 ± 48.2197.5 ± 43.7NS
HDL (mg/dL)63.0 ± 19.265.3 ± 16.060.8 ± 22.2NS
LDL (mg/dL)117.5 ± 38.5118.2 ± 41.7116.7 ± 36.0NS
TG (mg/dL)104.1 ± 62.5103.1 ± 70.6105.2 ± 55.0NS
CRP (mg/dL)0.7 ± 0.10.7 ± 0.10.7 ± 0.1NS
Vitamin 1,25(OH)2D (ng/L)31.5 ± 3.932.2 ± 3.830.8 ± 4.0NS
METs-min/week578.1 ± 275.0518.6 ± 288.7637.6 ± 253.8NS
MedDietScore34.2 ± 2.934.3 ± 3.134.1 ± 2.7NS
Total fat (g)61.1 ± 8.459.2 ± 5.863.0 ± 10.1NS
Cholesterol dietary (mg)177.9 ± 40.6168.7 ± 52.2187.0 ± 22.1NS
Fiber (g/day)19.0 ± 4.318.0 ± 4.220.0 ± 4.3NS
SFAs (g/day)17.0 ± 3.317.7 ± 1.916.2 ± 4.1NS
MUFAs (g/day)25.8 ± 6.027.8 ± 4.923.8 ± 6.4NS
Anxiety score8.8 ± 4.98.7 ± 4.98.9 ± 5.1NS
Depression score6.3 ± 3.86.15 ± 4.16.5 ± 3.6NS
Data are presented as mean ± standard deviation of mean (SD) or counts. p-Value: comparisons between the control and the intervention group at baseline using the independent sample t-test or the Mann–Whitney test, if appropriate; the difference was considered significant at p < 0.05. NS, not statistically significant; MS, multiple sclerosis; MedDiet, Mediterranean diet; EDSS, expanded disability status scale; BMI, body mass index; FM, fat mass; FFM, fat-free mass; METs, metabolic equivalent of task; HDL, high-density lipoprotein; LDL, low-density lipoprotein; TG, triacylglycerols; CRP, C-reactive protein; SFAs, saturated fatty acids; MUFAs, monounsaturated fatty acids.
Table 2. Anthropometrics, blood indices and dietary intake at baseline and 3 months in both the intervention and the control group.
CharacteristicsGroupBaseline (n= 20)3 Months (n = 20)p-Value* p-Value
Mean ± SDMean ± SD
BW (kg)Control71.4 ± 16.373.3 ± 16.7<0.001NS
Intervention72.0 ± 19.470.1 ± 18.9<0.001
BMI (kg/m2)
<18.5
18.5–24.99
25–30
>30
Control24.0 ± 4.3
0
12
6
2
24.6 ± 4.3
0
10
8
2
<0.001NS
Intervention24.7 ± 5.6
0
14
4
2
24.0 ± 5.3
0
14
4
2
<0.001
FM%control18.8 ± 10.820.1 ± 11.00.002NS
intervention19.7 ± 11.418.5 ± 11.0<0.001
FFM%control52.6 ± 9.752.5 ± 10.1NSNS
intervention52.3 ± 12.151.5 ± 12.1<0.001
Glu (mg/dL)control96.3 ± 21.695.2 ± 20.5NS0.05
intervention100.6 ± 6.795.3 ± 4.8<0.001
Total Chol (mg/dL)control197.5 ± 43.7206.8 ± 48.8NSNS
intervention195.4 ± 33.4193.1 ± 35.8NS
HDL (mg/dL)control60.8 ± 22.267.5 ± 25.2NSNS
intervention65.3 ± 16.063.4 ± 17.5NS
LDL (mg/dL)control116.7 ± 36.0119.8 ± 42.3NSNS
intervention118.2 ± 41.7115.0 ± 47.3NS
TG (mg/dL)control105.2 ± 55.0114.9 ± 6.0NSNS
intervention103.1 ± 70.690.7 ± 51.4NS
CRP (mg/dL)control0.7 ± 0.10.7 ± 0.1NSNS
intervention0.7 ± 0.10.7 ± 0.1NS
Vitamin 1,25(OH)2D (ng/L)control30.8 ± 4.038.9 ± 5.9<0.001<0.001
intervention32.2 ± 3.849.1 ± 11.3<0.001
METs-min/weekcontrol637.6 ± 253.8611.5 ± 224.2NSNS
intervention518.6 ± 288.7550.6 ± 282.10.013
MedDietScorecontrol34.1 ± 2.734.3 ± 2.5NS<0.001
intervention34.3 ± 3.137.6 ± 2.2<0.001
Total fat (g)Control63.0 ± 10.165.6 ± 10.3<0.001<0.001
intervention59.2 ± 5.853.6 ± 5.6<0.001
Cholesterol dietary (mg)Control187.0 ± 22.1200.5 ± 25.3<0.001<0.001
intervention168.7 ± 52.2151.1 ± 44.9<0.001
Fiber (g/d)control20.0 ± 4.321.2 ± 3.80.068NS
intervention18.0 ± 4.223.3 ± 4.5<0.001
SFAs (g/d)control16.2 ± 4.116.5 ± 4.3NSNS
intervention17.7 ± 1.914.9 ± 2.80.004
MUFAs (g/d)control23.8 ± 6.423.3 ± 6.4NS<0.001
intervention27.8 ± 4.933.0 ± 5.2<0.001
Anxiety scorecontrol8.9 ± 5.17.1 ± 3.60.0500.014
intervention8.6 ± 4.94.2 ± 3.6<0.001
Depression scorecontrol6.5 ± 3.66.4 ± 4.2NS0.020
intervention6.2 ± 4.13.6 ± 3.0<0.001
Data are presented as mean ± standard deviation of mean (SD) or counts. p-Value: differences within group between baseline and 3 months using the paired samples t test or the Wilcoxon test, if appropriate; difference was considered significant at p < 0.05. * p-Value: comparisons between the control and the intervention group for significant changes at 3 months using the independent samples t-test or the Mann–Whitney test, if appropriate; difference was considered significant at p < 0.05. NS, not statistically significant; MedDiet, Mediterranean diet; BMI, body mass index; FM, fat mass; FFM, fat free mass; METs, metabolic equivalent of task; HDL, high density lipoprotein; LDL, low density lipoprotein; TG, triacylglycerols; CRP, C-reactive protein; SFAs, saturated fatty acids; MUFAs, monounsaturated fatty acids.
Table 3. Logistic regression analysis model, odds ratio, and 95% confidence intervals, exploring the relationship between age, body composition, cardiovascular and dietary variables, and the intervention group.
Independent VariablesBS.E.WaldSig.Exp(B)95% C.I. for Exp(B)
LowerUpper
Age0.4320.3441.5810.2091.5400.7863.021
BMI 0.1120.3330.1140.7361.1190.5822.151
FM0.0390.151−0.0680.7941.0400.7741.397
HDL−0.0350.0440.6490.4210.9660.8871.052
TG −0.0190.0122.5760.1080.9820.9601.004
CRP1.748 8.9020.0390.4210.9660.8871.052
MedDietScore1.142 0.5624.1360.0423.1341.0429.424
Cholesterol intake −0.0600.0255.4890.0190.9420.8960.990
SFAs−0.3400.2661.6260.2020.7120.4221.200
BMI, body mass index; FM, fat mass; FFM, fat-free mass; METs, metabolic equivalents; HDL, high-density lipoprotein; LDL, low-density lipoprotein; TG, triacylglycerols, CRP; C-reactive protein, MedDiet, Mediterranean diet; SFAs, saturated fatty acids.
Publisher’s Note: MDPI stays neutral with regard to jurisdictional claims in published maps and institutional affiliations.

