Proceeding Paper

Multi-Objective Optimization of the Nanocavities Diffusion in Irradiated Metals †

by
Andrée De Backer
1,2,3,*,
Abdelkader Souidi
4,
Etienne A. Hodille
5,
Emmanuel Autissier
6,
Cécile Genevois
6,
Farah Haddad
6,
Antonin Della Noce
7,
Christophe Domain
2,8,
Charlotte S. Becquart
1,2 and
Marie France Barthe
6
1
UMET-Unité Matériaux et Transformations, UMR 8207, Centrale Lille, INRAE, CNRS, Lille University, 59000 Lille, France
2
EM2VM, Joint Laboratory Study and Modelling of the Microstructure for Ageing of Materials, 76800 Saint Etienne du Rouvray, France
3
PIIM-Physics of the Interactions of Ions and Molecules, CNRS, Aix Marseille University, 13013 Marseille, France
4
Département de physique, Faculté des Sciences, Université Dr. Tahar Moulay de Saida, Saida 20000, Algeria
5
IRFM-Institute for Magnetic Fusion Research, French Alternative Energies and Atomic Energy Commission (CEA), 13108 Saint Paul lez Durance, France
6
CEMHTI-Conditions Extrêmes et Matériaux: Haute Température et Irradiation, CNRS, 45071 Orléans, France
7
Unité INSERM 981, Institut de Cancérologie Gustave Roussy, 94805 Villejuif, France
8
Département MMC, EDF-R&D Les Renardières, 77250 Moret sur Loing, France
*
Author to whom correspondence should be addressed.
Presented at the 41st International Workshop on Bayesian Inference and Maximum Entropy Methods in Science and Engineering, Paris, France, 18–22 July 2022.
Phys. Sci. Forum 2022, 5(1), 41; https://doi.org/10.3390/psf2022005041
Published: 6 January 2023

Abstract

:
Materials in fission reactors or fusion tokamaks are exposed to neutron irradiation, which creates defects in the microstructure. With time, depending on the temperature, defects diffuse and form, among others, nanocavities, altering the material performance. The goal of this work is to determine the diffusion properties of the nanocavities in tungsten. We combine (i) a systematic experimental study in irradiated samples annealed at different temperatures up to 1800 K (the created nanocavities diffuse, and their coalescence is studied by transmission electron microscopy); (ii) our object kinetic Monte Carlo model of the microstructure evolution fed by a large collection of atomistic data; and (iii) a multi-objective optimization method (using model inversion) to obtain the diffusion of nanocavities, input parameters of our model, from the comparison with the experimental observations. We simplify the multi-objective function, proposing a projection into the parameter space. Non-dominated solutions are revealed: two “valleys” of minima corresponding to the nanocavities density and size objectives, respectively, which delimit the Pareto optimal solution. These “valleys” are found to be the upper and lower uncertainties on the diffusion beyond the uncertainties on the experimental and simulated results. The nanocavity diffusion can be split in three domains: the mono vacancy and small vacancy clusters, for which atomistic models are affordable, the small nanocavities for which our approach is decisive, and the nanocavities larger than 1.5 nm for which the classical surface diffusion theory is valid.

1. Introduction

Materials are exposed to severe damaging conditions in nuclear energy production devices: the fission reactors and the fusion tokamaks (as ITER). During nuclear reactions, neutrons are produced; they penetrate and stop in the facing materials, creating defects (vacancies and self interstitial atoms (SIA)) in the microstructure that can diffuse and agglomerate, deteriorating the material properties. In fusion tokamaks in particular, nanocavities increase the retention of tritium and reduce the thermal conductivity of the material. To guarantee the safety of the reactors, dedicated experimental campaigns and multiscale modeling projects have been performed for decades to understand and model the microstructure evolution. Still, few data exist on the diffusion properties of the nanocavities. The main reasons are, on the one hand, that a significant part of the defects are not visible with any microscope and on the other hand that the pertinent simulations have to handle a large range of temperature-dependent processes that drive to the microstructure evolution and recovery.
In the 1960s, the pores motion and coalescence in metals were intensively studied to understand the material microstructure damage in nuclear devices [1,2,3]. The investigations were limited by the computation capacities and the size resolution of the experimental techniques. For these reasons, the diffusion of small nanocavities is still poorly characterized. Apart from the classical surface diffusion model [3], in recent years, new theoretical data using atomic scale approaches have been reported. In 2017, Mason et al. calculated the migration energies of small vacancy clusters with density functional theory [4], Castin et al. characterized the diffusion properties of vacancy clusters using machine learning with the drawback of relying on an empirical potential [5] and D. Perez et al. investigated the diffusion properties of very small vacancy-helium complexes with accelerated methods and thanks to a supercomputer [6] but also using empirical potentials. We finally spot, in iron, the results of Jansson et al. [7] and Pannier et al. [8] where they show that increasing the cluster size by adding one point defect at a time, change the cluster symmetry for some specific size, modifying strongly the migration energy. This causes rapid fluctuations of the migration energy as a function of the cluster size. On the experimental side, nowadays, electron microscopes allow the analysis of nanometric defects.
We propose to bridge the gap between the smallest defects and the several nanometer size cavities by combining a series of new microscopy results detailed in [9], an improved object kinetic Monte Carlo (OKMC) model that simulates the nanocavities creation, diffusion and coalescence in irradiated tungsten [10] and a multiobjective optimization. In this paper, we describe the optimization method whose complexity comes from the large dimension of the inputs and outputs of the model, the computing time of a single simulation and the interdependencies of the data. Indeed, the optimized parameters are the diffusion temperature of the nanocavities which are expected to be set into motion one after the other by ascending size order, when the sample temperature is increased during the annealing stages. On the other hand, however, at the end of each temperature, we do not observe these diffusing nanocavities but the result of their interaction with the whole microstructure.
Section 2 of this paper describes the multiobjective optimization problem. Section 3, we describe briefly the experimental data and the numerical model. Section 4, we detail the result of the Pareto front search and our proposition of projection of the objectives in the space of parameters. This manuscript ends with the discussion and conclusion.

2. Problem Formulation

One subtlety of the problem is that two series of temperatures are considered. The first ones are the annealing temperatures, T j , the real temperatures at which the samples are put during the experiment. The others are the diffusion temperatures, θ i , inputs of the model and hypothetical temperatures at which nanocavities of various sizes start their diffusion. The link between these two series of temperatures is that if one diffusion temperature is close to one annealing temperature, it is likely that the related nanocavity family diffuses and modifies the sample microstructure. However, there is no established method to define the diffusion temperature.
The aim of this work is to determine the diffusion temperature by N = 30 values on a discretization of the size (diameter) range from 0.3 to 4 nm. We consider an increasing function,
θ 1 good theoretical estimate δ θ i distribution of unknown values in R + θ n = θ n 1 + δ θ n n = 2 : N .
Experimental data are described in [9]. We consider the m e a n size and t o t a l densities of nanocavities as a function of time and temperature,
( t i , T i , d e n s i t y i , s i z e i ) 1 i M
where t i , T i are time and temperature. t i and T i are related because the observations are realized at the end of the irradiation and annealing stages only. One has
t 1 end of the irradiation stage t i = t 1 + ( i 1 ) δ t for i = 2 : M end of each annealing stage T 1 irradiation temperature T i = T i 1 + δ T for i = 2 : M annealing temperatures with δ T > 0
Few experimental data are available, and the scattering is significantly larger that the fluctuations of the simulated results (Section 3.2). We design a likelihood for observed  d e n s i t y and s i z e , fitted by regression on the experimental data by minimizing the sum of squared differences
( d e n s i t y o b s , s i z e o b s ) | ( d e n s i t y , s i z e ) P l i k e l i h o o d ( . | ( t i , T i , d e n s i t y i , s i z e i ) ) .
The numerical OKMC model mimics the experiment. The temperature θ i of (1) is the input of the model (Section 3.3). The outputs give the simulated total nanocavity density and mean sizes
( d e n s i t y s i m ( t ) , s i z e s i m ( t ) ) O K M C ( t , θ 1 : N )
where t [ 0 ; t 1 + ( M 1 ) δ t ] OKMC ( t , θ 1 : N ) is the associated stochastic process and where the temperature function of time is fixed as for the experiment.
The components of the objective function are the functions of the distance between s i m and o b s values:
D d ( d e n s i t y o b s ( T j ) , d e n s i t y s i m ( t j , T j ) ) = | log ( d e n s i t y o b s ) log ( d e n s i t y s i m ) | D s ( s i z e o b s ( T j ) , s i z e s i m ( t j , T j ) ) = | s i z e o b s s i z e s i m | .
Remember that the indexes are { ( i , j ) N 2 | 1 i N , 1 j M } , where N = 30 is the length of θ , and M = 9 is the number of pairs of o b s data. One has the density and size objectives, hence 2 M terms:
O d j ( θ 1 : N ) = E 1 exp S D d ( d e n s i t y o b s ( T j ) , d e n s i t y s i m ( t j , T j ) ) , d e n s i t y s i m ( t j ) OKMC d ( t j , θ 1 : N ) O s j ( θ 1 : N ) = E 1 exp S D s ( s i z e o b s ( T j ) , s i z e s i m ( t j , T j ) ) , s i z e s i m ( t j ) OKMC s ( t j , θ 1 : N )
where E represents the mean on OKMC simulations for one θ 1 : N and where a density of probability of the error is assumed to be proportional to exp D ( d e n s i t y , d e n s i t y s i m ( t i ) ) 
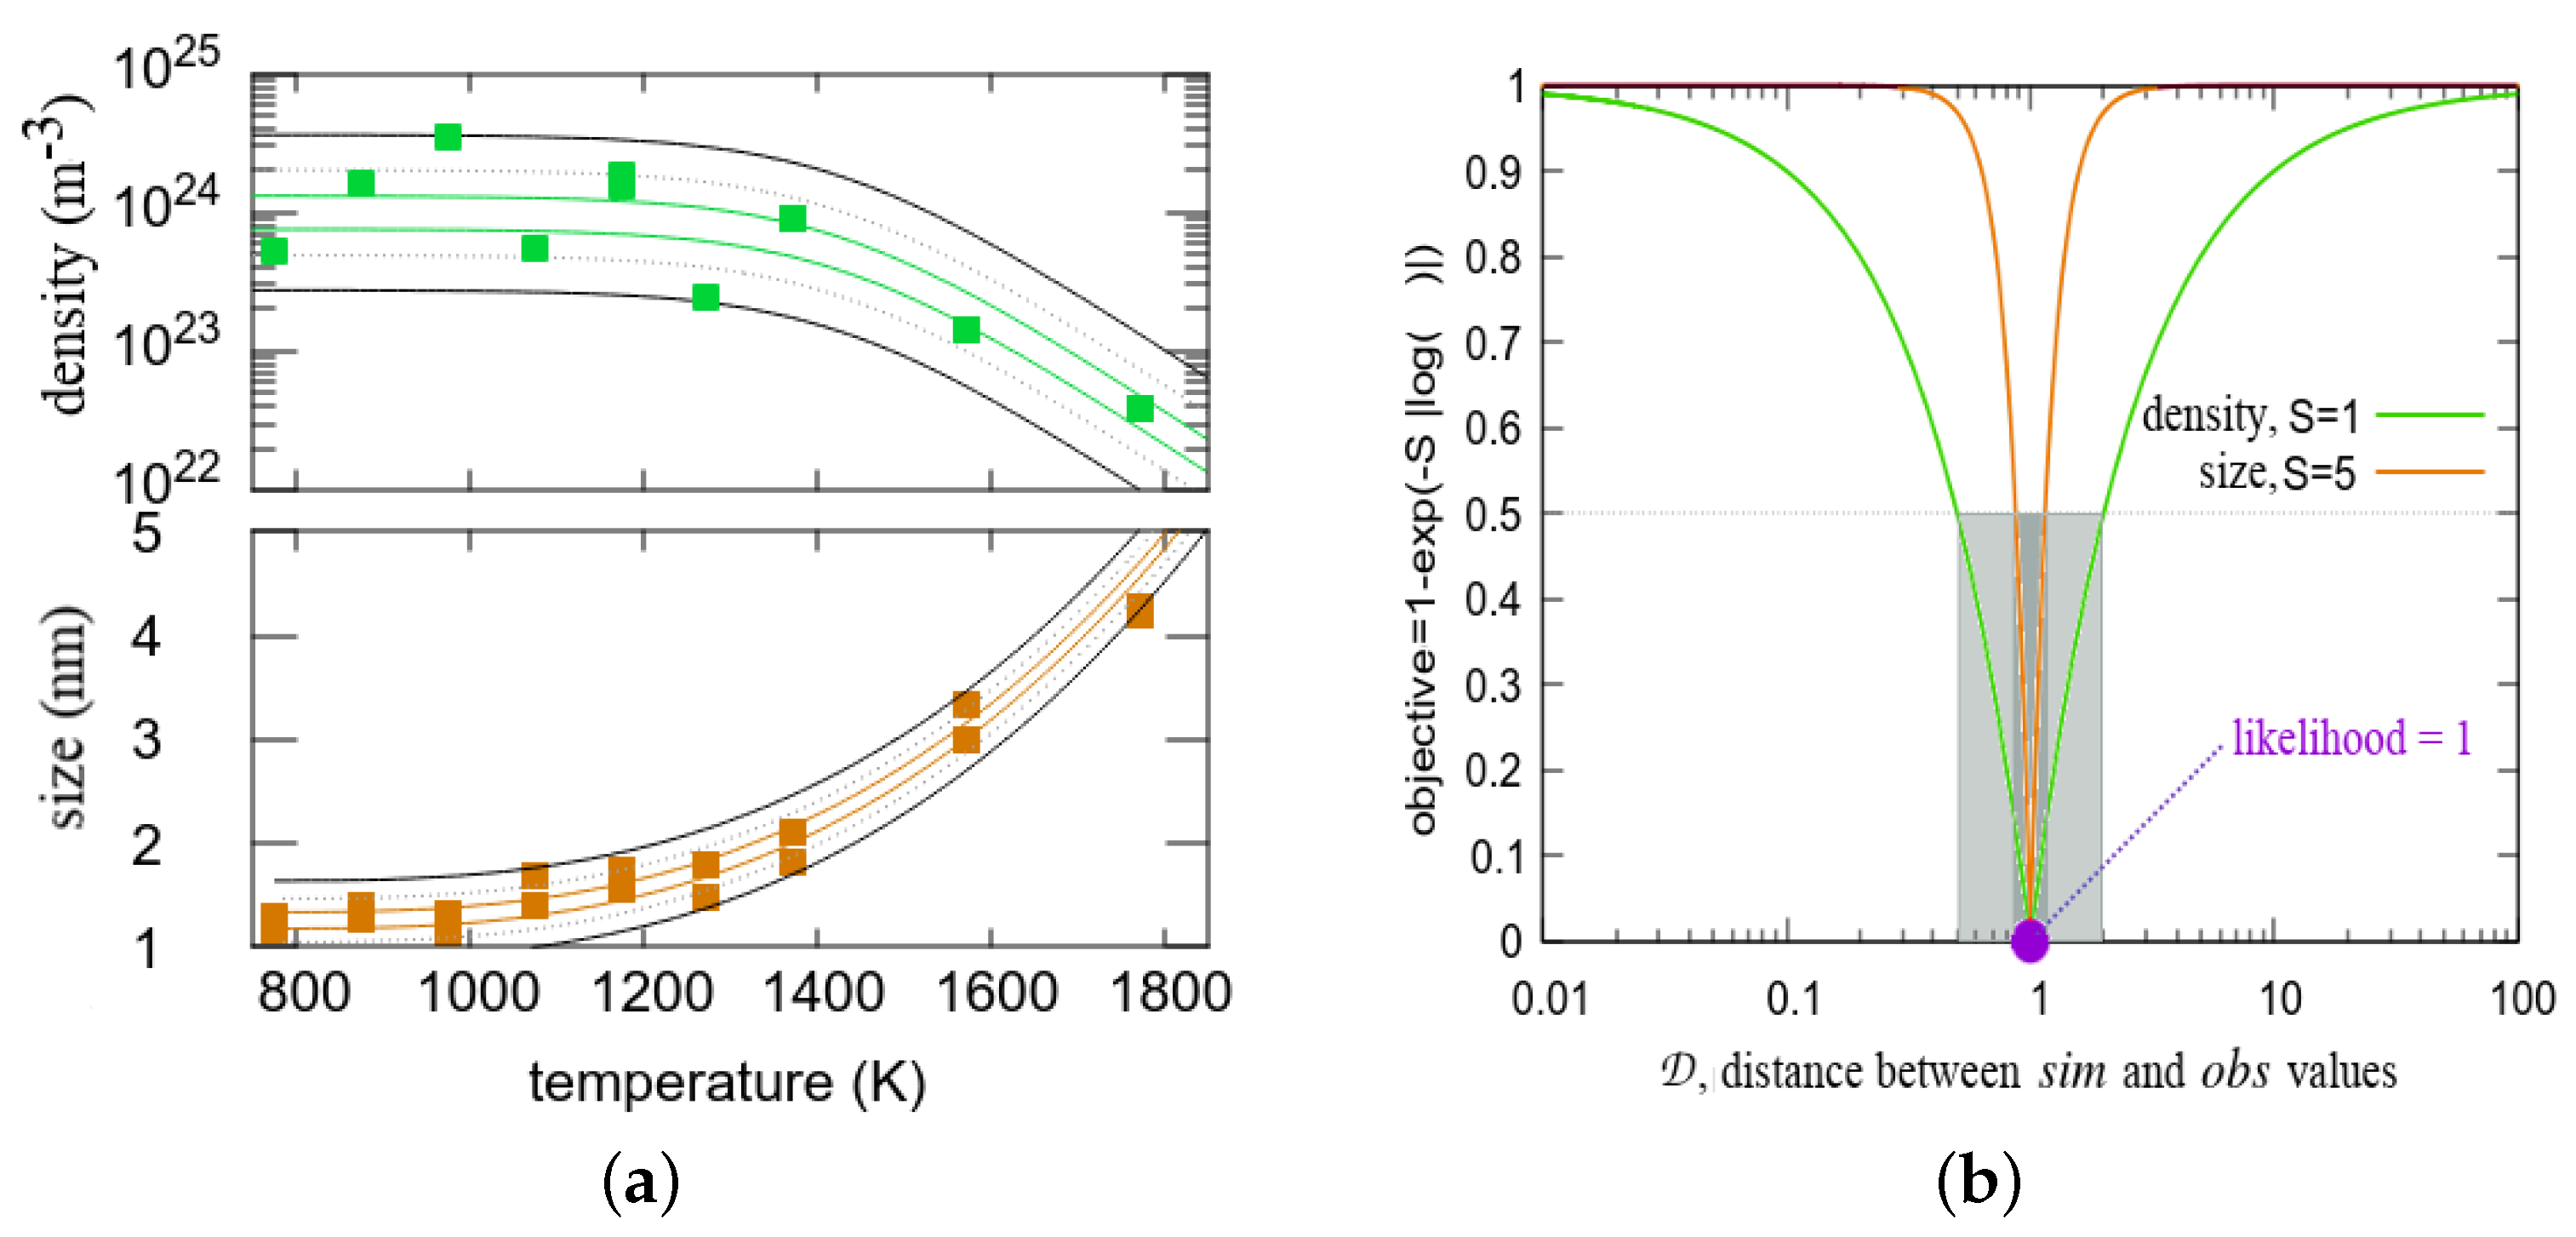
. Notice the logarithm introduced in Equation (6) and S equal to 1 (respectively, 5) for d e n s i t y (respectively, s i z e ) in Equation (7), to strengthen the attachment to the data s i z e compared to d e n s i t y (see also Figure 1b).
A weighted loss function and the steepest descent methods were particularly unsatisfying because of the following:
  • The dependence of the objectives from one temperature to the next one: O d , s j depends on O d , s j 1 . If the simulation is far from the observation at T j , there is little chance to get it correct at T j + δ T .
  • An unexpected interdependence of d e n s i t y and s i z e objectives. At each temperature stage, we observed that the optimization of d e n s i t y , O d j tends to disfavor s i z e , O s j .
The search of the Pareto front in the 2 M dimensions appeared to be meaningful as we will describe in Section 4. Finally, to determine the optimum parameters, we tested a p r o j e c t i o n of the objectives in the space of parameters based on the physics of the OKMC. The N × M matrix is the function of the parameter θ 1 : N :
W i j ( θ 1 : N ) = 1 n i I θ i > T j 1 and θ i < = T j with n i = j = 1 M I θ i > T j 1 and θ i < = T j
where j are the objective indexes, i are the parameter indexes and I ( t e s t ) is a function which is equal to 1 if t e s t is true and 0 on the contrary case. Projected objectives are
O p r o j e c t e d d ( θ 1 : N ) = W ( θ 1 : N ) O d ( θ 1 : N ) O p r o j e c t e d s ( θ 1 : N ) = W ( θ 1 : N ) O s ( θ 1 : N )
With this projection, the performance given by the objective j is associated to the class sizes i which did not diffuse at temperature T j 1 but h y p o t h e t i c a l l y will start to diffuse at temperature T j . n i is to make an average if necessary.

3. Experimental Data and Numerical Model

A detailed description of the experimental results and the improved numerical model are given resp. in [9,10]. We will describe the aspects related to the optimization problem, starting with a short description of the irradiation process at the atomistic scale named collision cascade.

3.1. Collision Cascade

Irradiation of the sample is obtained by bombardment with high energy ions. We know that the ions lose their kinetic energy in the crystal by a series of collisions with the metal atoms which, when the energy they received is high enough, are kicked out of their position in the crystal lattice and initiate a chain reaction named collision cascade. The expansion stage of the collision cascades is shorter than 0.5 ps and is followed by a quick process of defect recombination during a few ps. At the end, defect debris remain and form what is named the primary damage, made of self-interstitial atoms (SIAs) and vacancies. After the collision cascade cooling, the crystal lattice recovery continues more slowly, provided that the defects diffuse, which is the case, for example, at 773 K for SIA, single vacancy and small vacancy clusters.
In this work, the cumulative level of damage is 0.02 dpa, which means that, on average, 2% of the atoms were kicked out of their lattice site during the expansion of the collision cascades. The real fraction of defect is clearly smaller, thanks to the crystal lattice recovery, driven by thermodynamic forces. However, the kinetic of this process is mainly controlled by the defect diffusion. Defects can recomb ine but also agglomerate, forming larger and larger clusters, mainly dislocation loops and nanocavities.

3.2. Experimental Data

The experiment requires the preparation, irradiation and annealing of tungsten samples and the defect characterization. The preparation consists mainly in cutting and polishing 99.95% pure commercialized polycrystalline tungsten samples and preliminary annealing (heating) at 1873 K to remove native defects. Thin zones are obtained with a twin-jet electropolisher with a thickness as small as 33 nm. This makes the sample locally transparent as required by the transmission electron microscope (TEM). The second step is the irradiation stage: bombardment of the sample surface to a fluence of 1.8 × 10 16 m 2 high energy ions (1.2 MeV W + ) at 773 K. The third step is a succession of annealings made of plateaus of 1 h each, at increasing setpoint temperature.
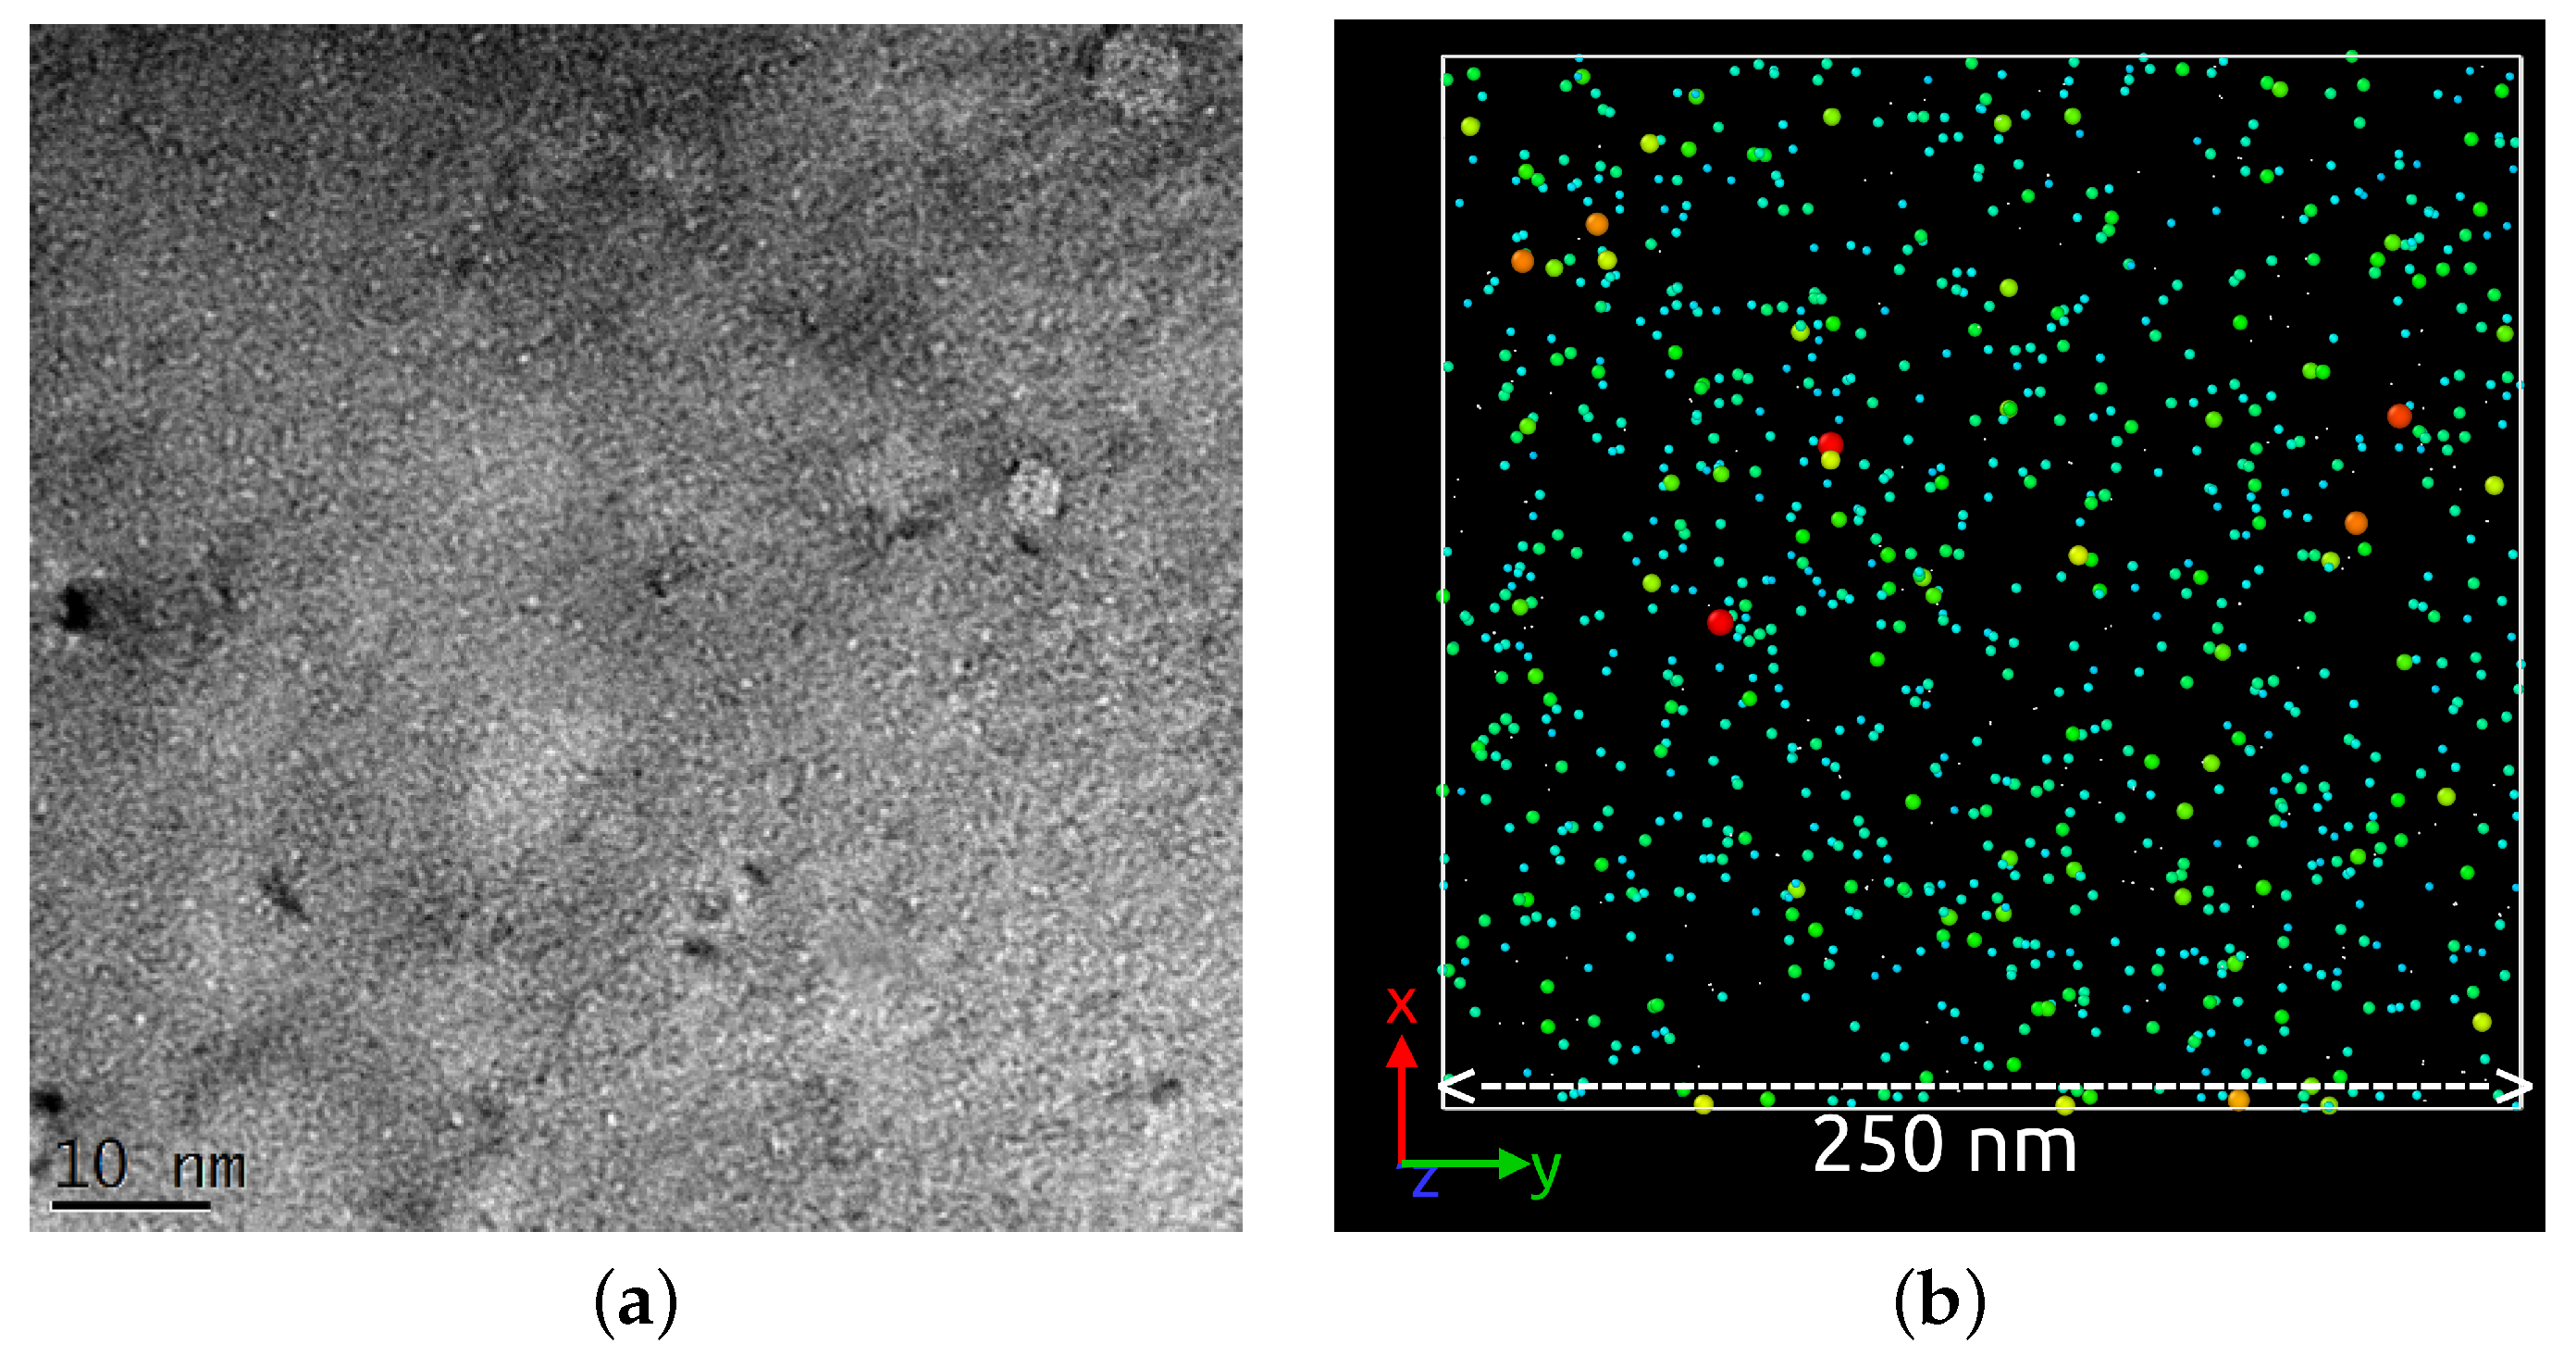
At the end of the irradiation and each annealing stage, the sample microstructure is observed by TEM, and several micrographs are saved. Figure 2a shows, for example, the large concentration of very small nanocavities visible at the end of the irradiation stage.
The nanocavity total density and their mean size as a function of temperature are plotted in Figure 1a. The large scattering is mainly due to the small number of samples (and micrographs per temperature), local composition variations, variation of the transparency (variation of the sample thickness) and differences in the counting methods (human or automatic) [11,12]. On the same figure, lines represent a likelihood function introduced by Equation (4) and adjusted on experimental points. This function has eight parameters to be equal to 1 for:
( d e n s i t y o b s , s i z e o b s ) = p 0 d + p 1 d 1 + exp T p 2 d p 3 d , p 0 s + p 1 s 1 + T p 2 s p 3 s
with p d = [ 0 , 10 24 , 1428 , 105 ] and p s = [ 1.26 , 773 , 643 , 2.8 ] . Figure 1 illustrate the data attach function of the objectives of Equation (7). The 0–0.5 objective range corresponds roughly to the 1–0.5 area of the likelihood.
We can see in Figure 1a that when the temperature increases, the d e n s i t y decreases and the s i z e increases. This is due to the progressive setting into motion of the nanocavities by ascending size order. Some are eliminated at the sample surface or by recombination with SIA defects. Others agglomerate and form larger nanocavities participating in the coalescence process.

3.3. Numerical Model

The OKMC simulates the creation, diffusion and reactions of defects in a 3D box (∼250 nm). Two types of defects exist: SIA and vacancy. Because of their diffusion, they can find each other and annihilate (defects of opposite type) or form clusters (defects of the same type). The diffusion is function of the jump probability that depends on the defect type and size as well as temperature, using an Arrhenius formula. For vacancy defects, the jump probability is usually
f ( s , T ) = f 0 ( s ) exp ( E m ( s ) k T )
where f 0 ( s ) is the attempt frequency, E m ( s ) is the migration energy, and k is the Boltzmann constant. For this work, we simplify the diffusion parameters and use the diffusion temperatures, θ i , introduced in (1). The relation with the probability of jump is obtained using [3] to fix f 0 ( s ) ,
E m ( s ) = k log ( f 0 ( s ) ) θ ( s ) .
During the simulation of the irradiation stage, defects are introduced as pockets of vacancy and SIA clusters, randomly picked in a database of displacement cascade debris described in [13]. The microstructure evolution in an OKMC consists in applying events picked randomly according to their probabilities, for instance, one defect jump (diffusion). Reactions such as defect recombinations or agglomerations are realized by checking the vicinity of all the defects. An illustration of the defects present in the simulation box at the end of the irradiation stage is given in Figure 2b, next to the experimental TEM picture.

4. Results

4.1. Pareto Front in the Objective Space

As a starting point, OKMC runs have been accumulated, building different θ in order to roughly visit the parameter space. This first round of simulations rapidly showed that the parameters optimizing d e n s i t y objectives do not optimize s i z e objectives and vice versa. This is clearly visible in Figure 3, where the s i z e objective, O s ( 1 ) , is plotted as a function of the density objective, O d ( 1 ) at the end of the irradiation. Three branches are visible that can be associated to three sets of parameters, named A, B and C. In set B, the diffusion temperature of small nanocavities ( θ 1 : 3 for size 0.75 nm) is too low, which produces too few and too large nanocavities and the opposite behavior takes place for branch C. With set A, one obtains compromises of the optimization of d e n s i t y and s i z e , browsing the Pareto front in the first dimension of the objective space. The same behavior is obtained for all annealing temperatures, drawing the Pareto surface in the 2 M dimension objective space.
Visual inspection was enough to be convinced that only the first three components of θ i control the Pareto front in the first dimension O s ( 1 ) versus O d ( 1 ) , but it was not simple for the other dimensions. The physics of our model indicates that the optimization of the annealing at temperature T j is sensitive to the size class, which starts to diffuse. As a second step, we then consider the projection of the objective function in the parameter space using Equation (9).

4.2. Projection or Mapping of the Objective Function

Figure 4 show the projected objectives of the Pareto optimal solutions in the space of parameters. The objective vector is split in d e n s i t y and s i z e objectives component, then projected to the size classes which diffused during the considered temperature stage, because they are more likely to be the cause of the good or poor objective than the other size classes. We observed that the diffusion temperature, which increases with the nanocavity size, has to increase more rapidly to optimize d e n s i t y than to optimize s i z e objectives.
After these first observations, additional simulations were performed to improve the resolution of the objective function near the d e n s i t y and s i z e optimum in the space of parameters, with various parametric functional forms for θ i . More than five hundreds simulations correspond to as many computing hours.
The final projected objectives are plotted in Figure 5a, where the green-grey scale and the point size show the objective value. One sees the two minima v a l l e y s in green, corresponding to d e n s i t y and s i z e . These points are used to adjust an interpolating radial Bayesian function and finally search the minima of this interpolation for each class size.

5. Discussion

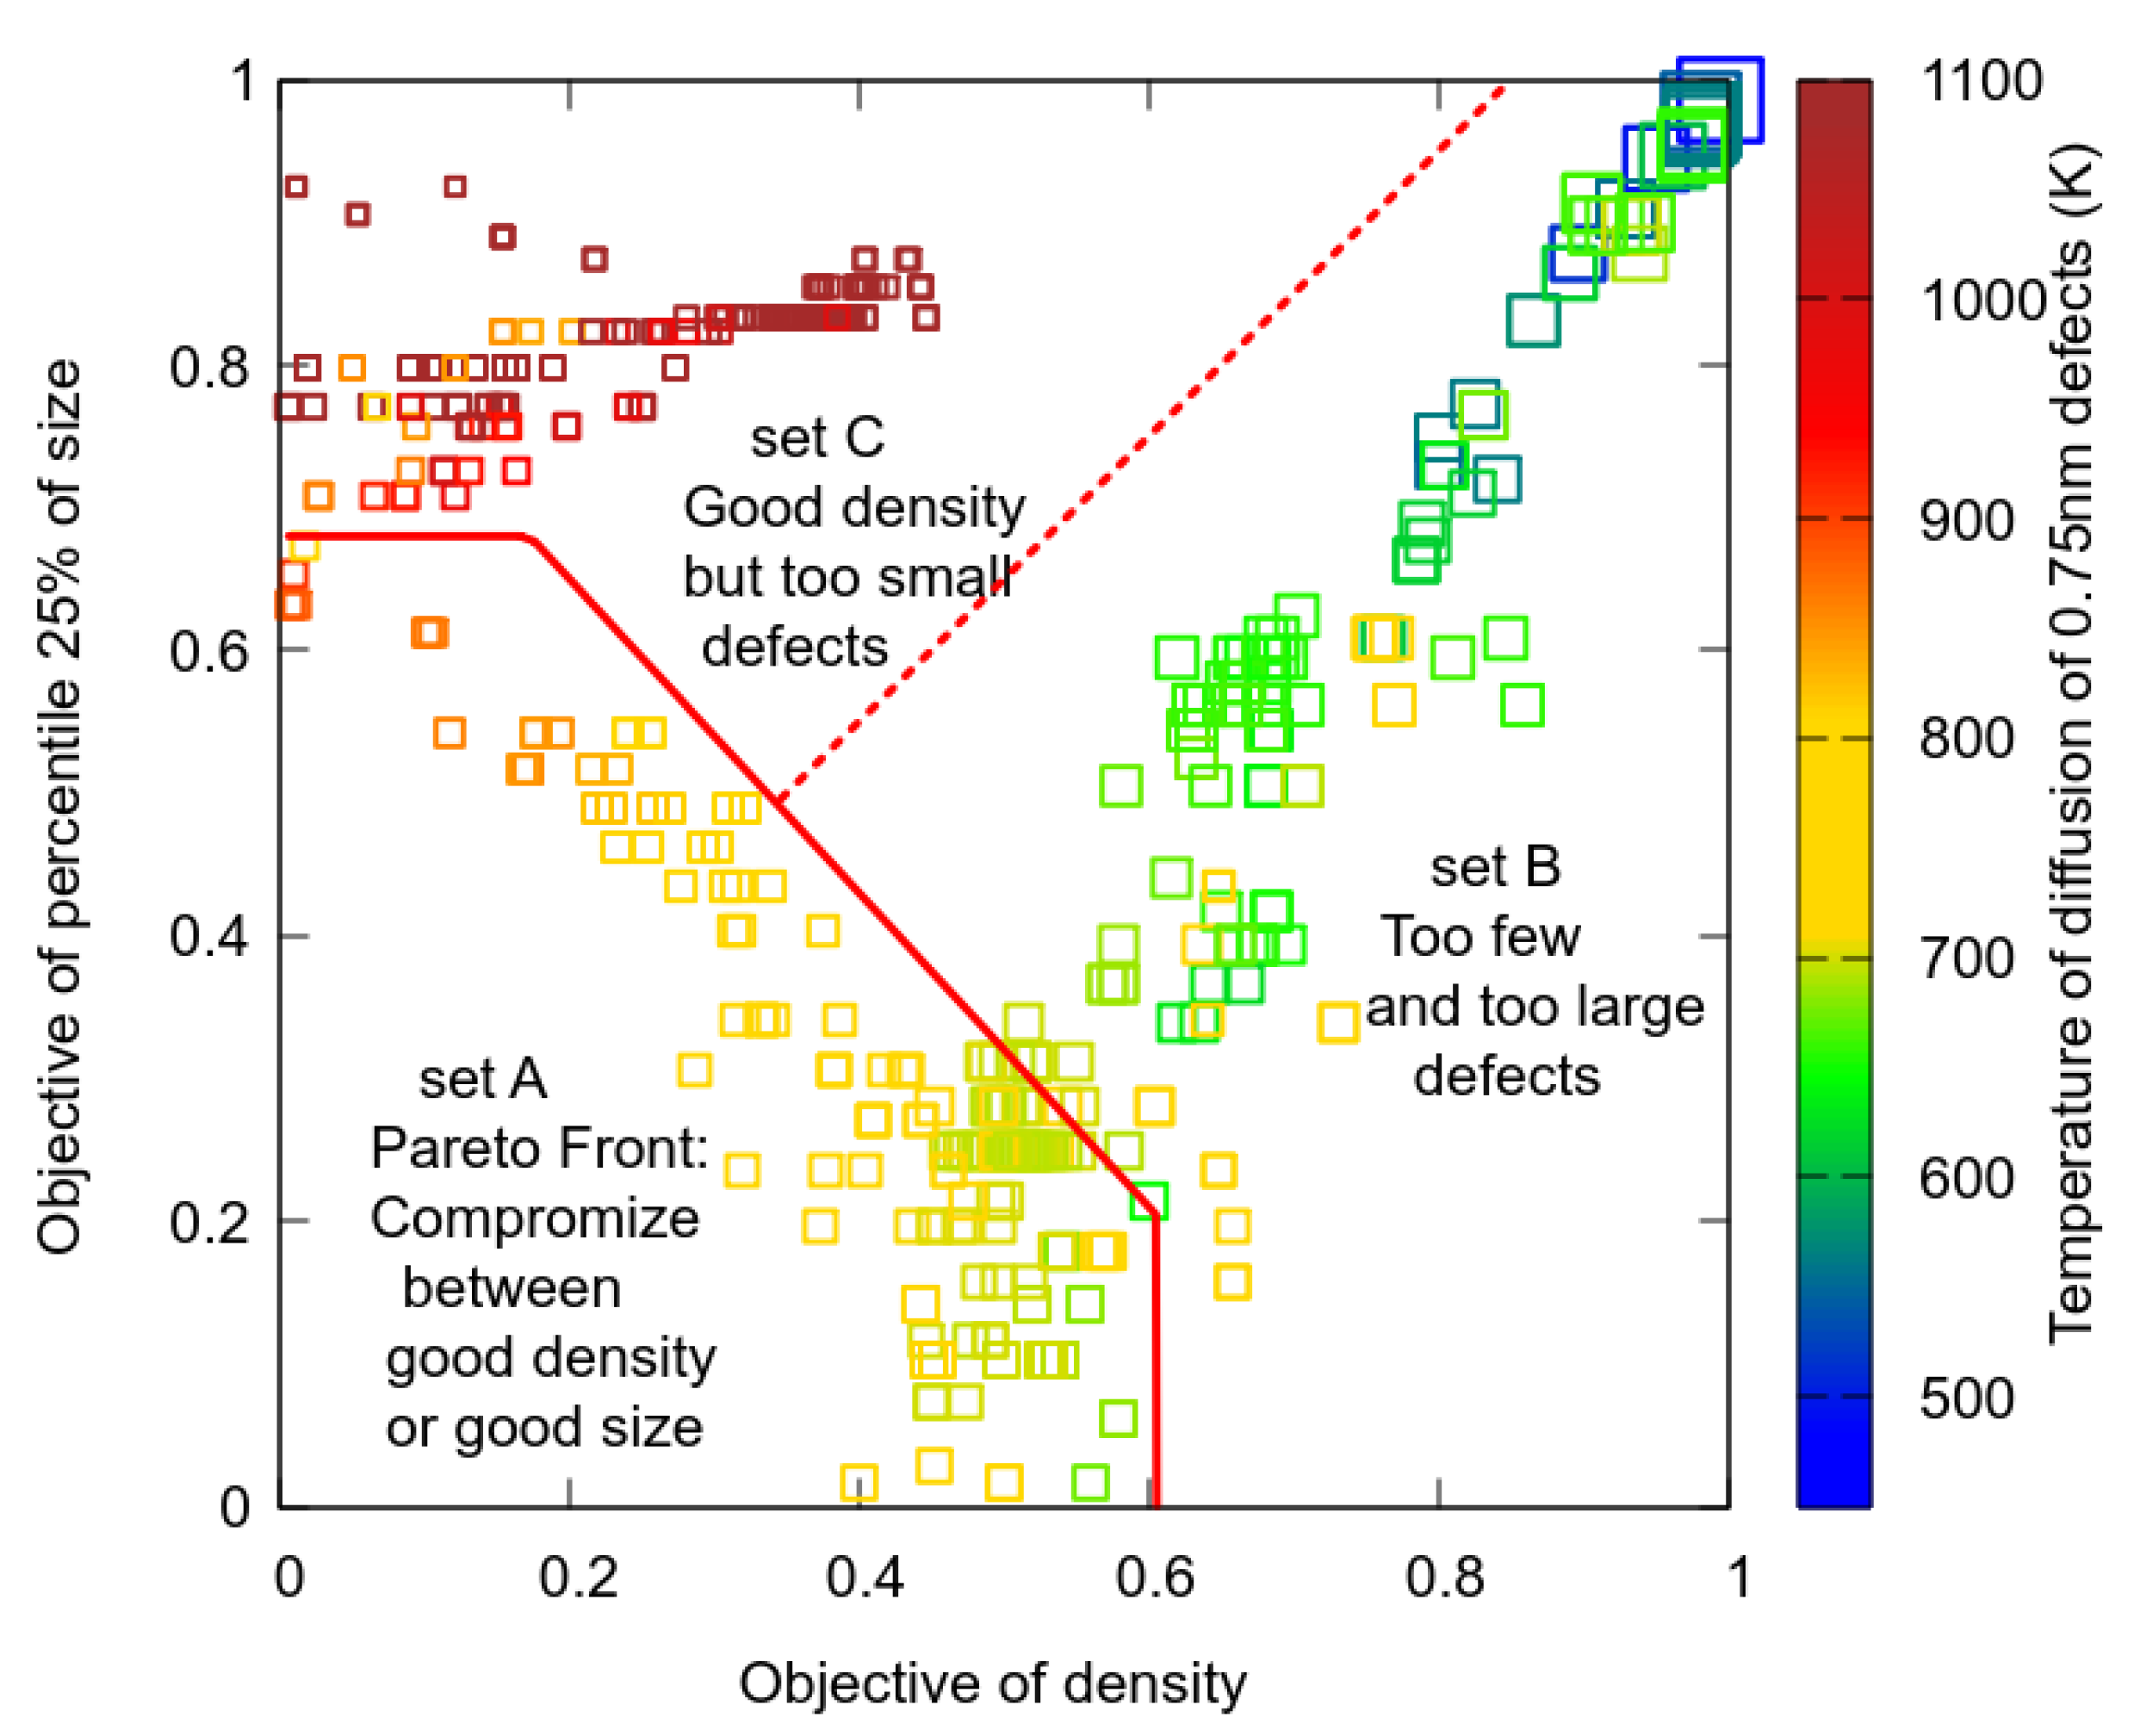
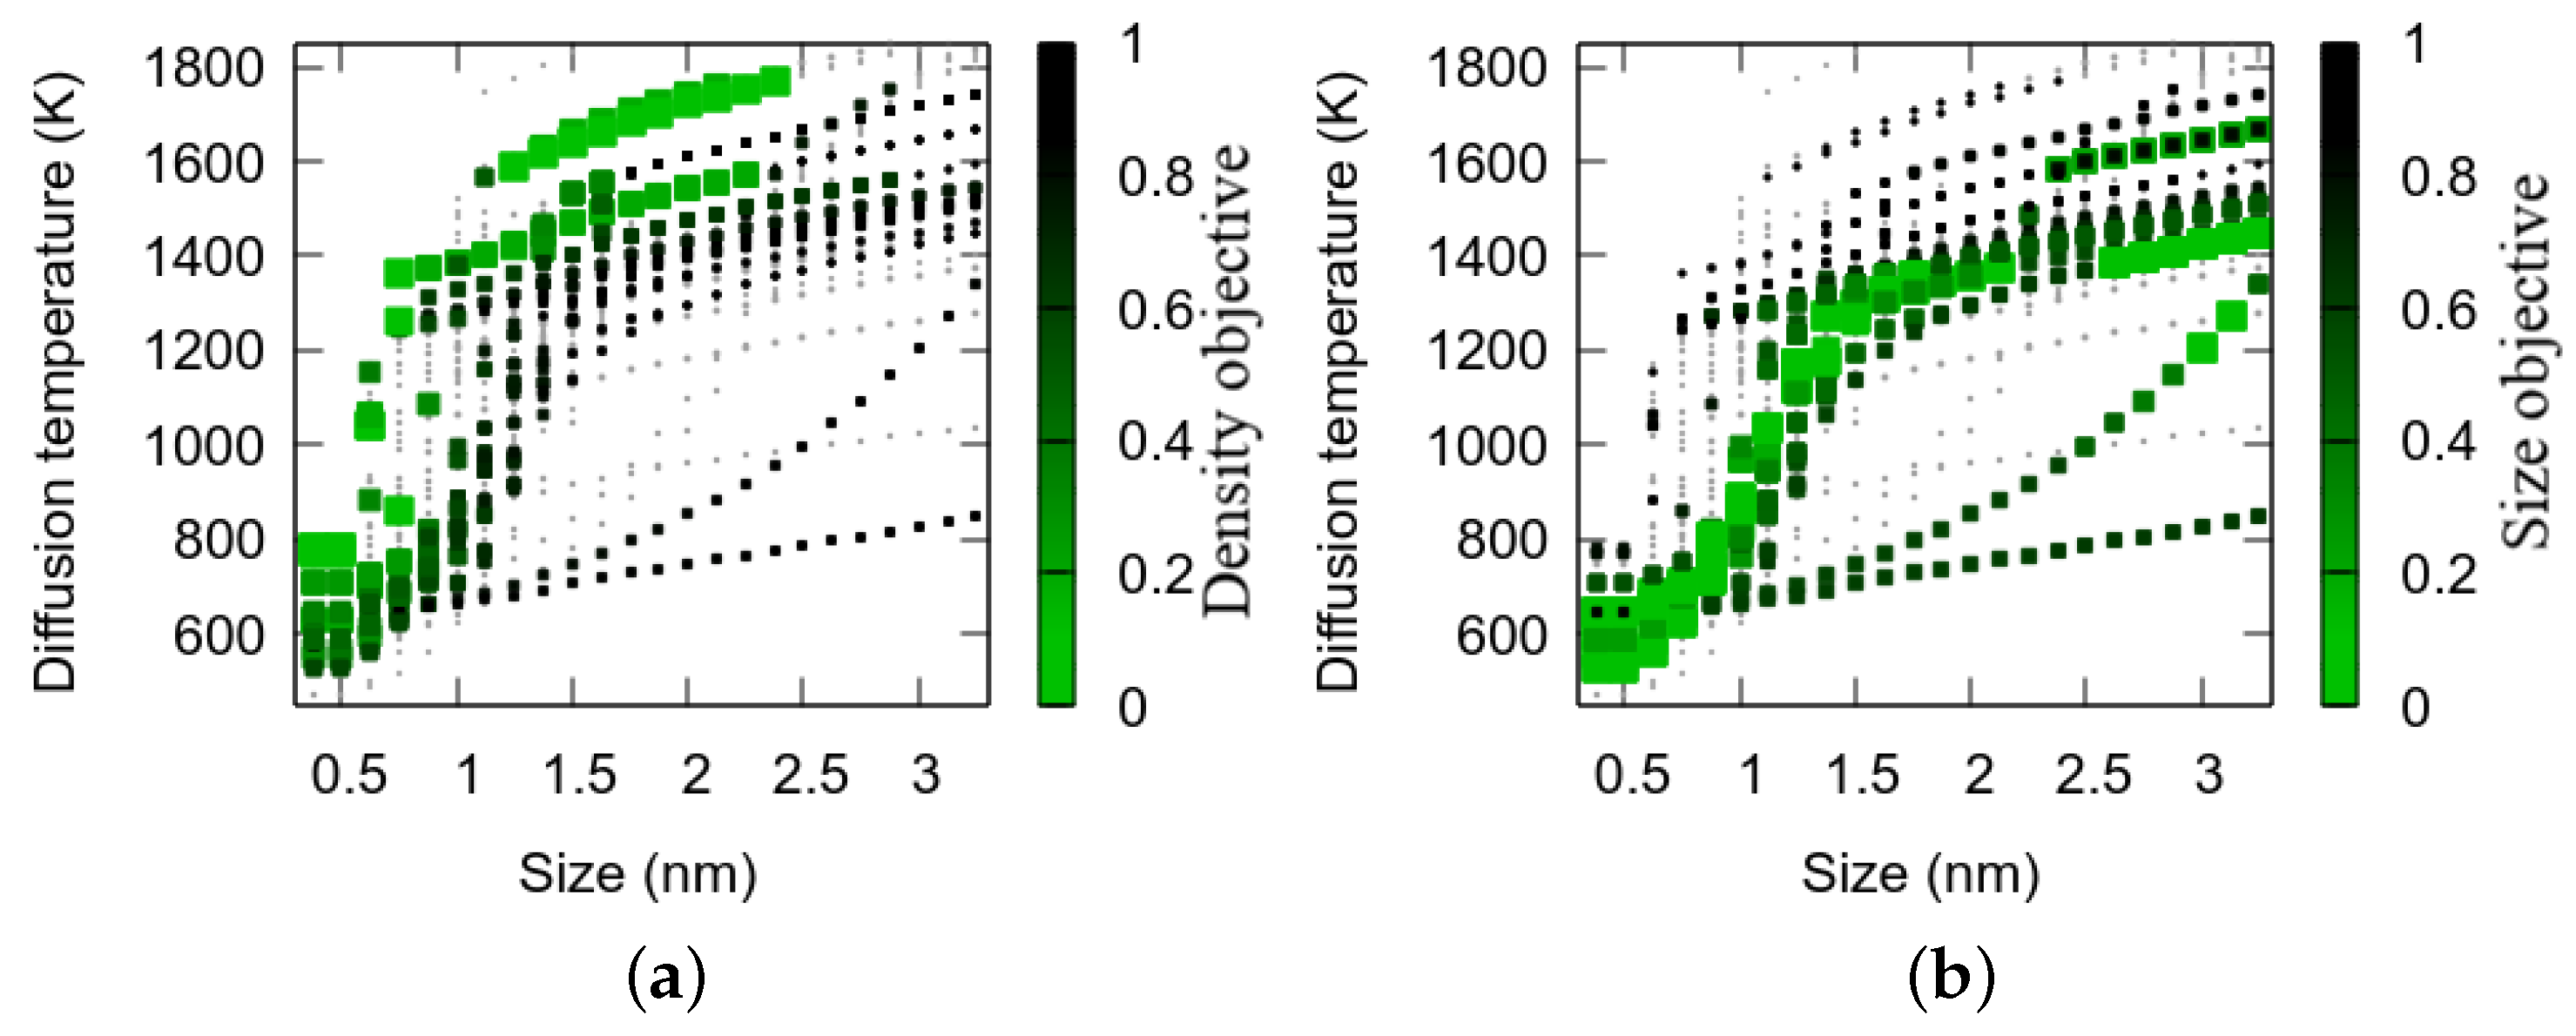
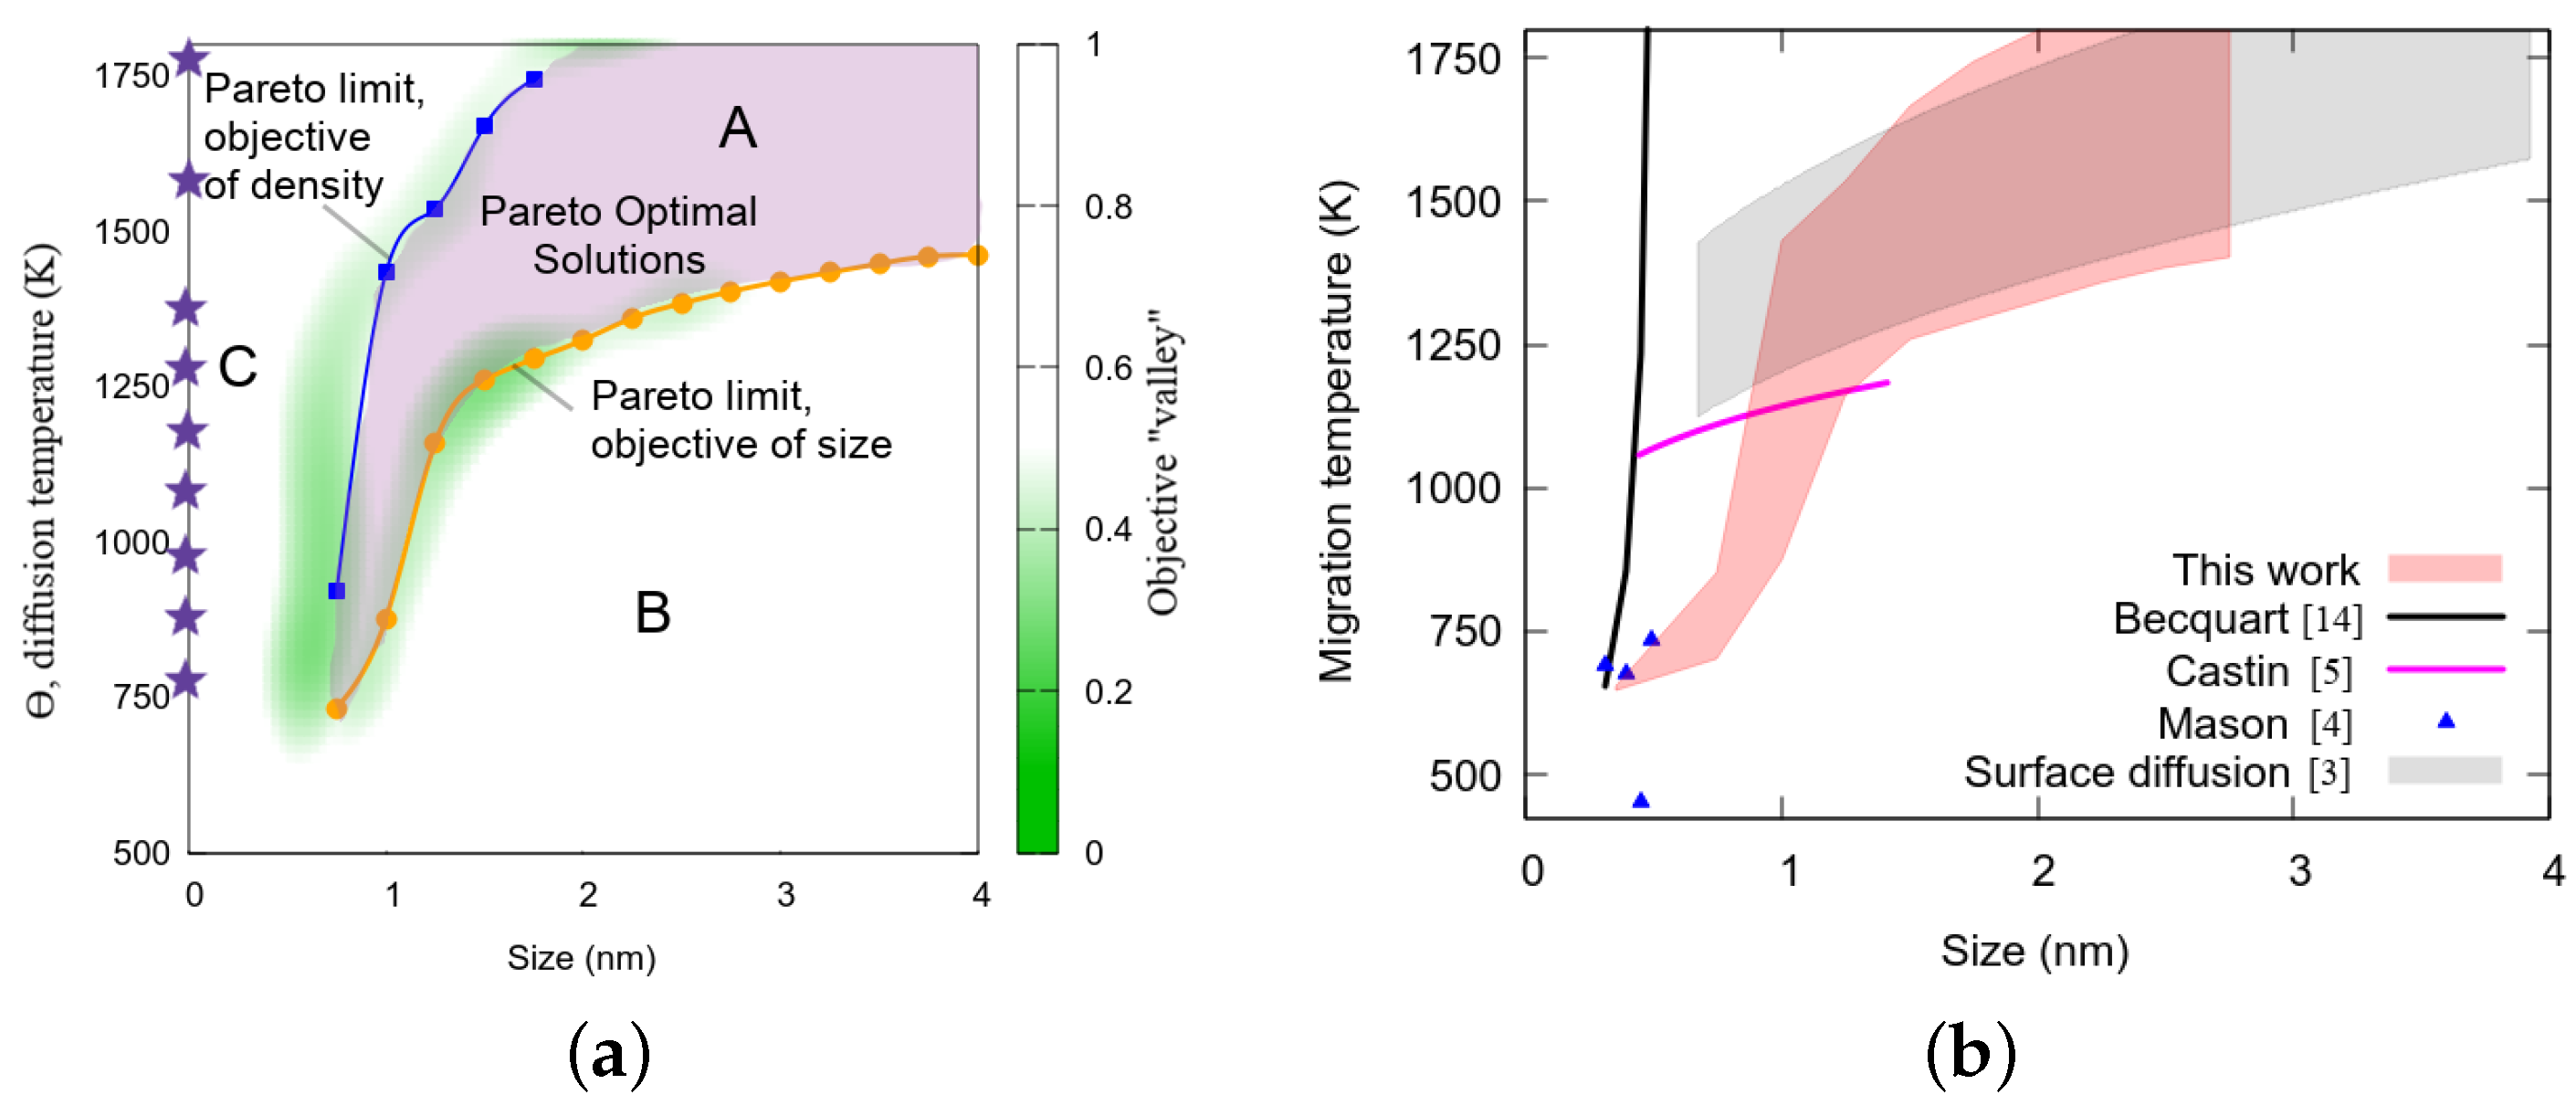
The Pareto optimal solution is the ensemble of parameters where no improvement of the objective can be achieved without losing on another one. Thanks to the projection, we can visualize the objective function in the parameter space, and there remain only two objective components which correspond to the two curves plotted in Figure 5a. They limit three domains, labeled A, B and C as in Section 4.1 for the implantation. In set B, the nanocavities are set into motion too rapidly when the temperature increases, then d e n s i t y drops too quickly and s i z e grows too quickly, and vice versa for set C. Set A, the region between those “valleys”, corresponds to compromises between d e n s i t y and s i z e objectives. It contains the Pareto optimal solutions, as moving closer to the d e n s i t y optimum means going further away from the s i z e optimum and vice versa.
For each size class, drawing a vertical line from the lower limit to the higher limit can be seen as an uncertainty on the diffusion temperature, i.e., the limit of knowledge that can be extracted from our experimental data and our model in their current form. In Figure 5b, our results are compared with literature. They agree with Mason’s calculations of very small vacancy clusters as well as with the classical surface diffusion model for large nanocavities. In the intermediate range, we improve the formula we proposed in [14] and Castin’s calculations.
A detailed discussion of the limitation of our OKMC model is in [10] and of the experimental results in [9]. The discussion remains opened about an automatic optimization algorithm and the projection method. One puzzling question raised by the optimization is the origin of the two branches of the Pareto front in the space parameter. It points that it is not possible to reproduce simultaneously d e n s i t y and s i z e objectives. One explanation is a source of vacancies during the annealing that is considered neither in the experimental interpretation nor in our model, so far.

6. Conclusions

We combined the results of an experimental campaign focusing on the nanocavity evolution with temperature and an OKMC model. We obtain the diffusion properties of nanocavities using a multi-objective optimization scheme. Simple optimization methods failed to converge mainly because of the large dimension of the objective function, the existence of a Pareto front and the interdependence of the objectives and the input data. A rewarding point is that the sophisticated optimization brings out an estimation of the uncertainty on the diffusion temperature and raises a question never considered: the physical cause of the double branch Pareto front. Finally, our results agree with the literature on small vacancy clusters and large nanocavities, bridging the gap of small nanocavities for which no information exists to our knowledge.

Author Contributions

Conceptualization, A.D.B., C.S.B., C.D., A.D.N. and M.F.B.; mathematical methodology, A.D.N.; experimental investigation, E.A., C.G., F.H. and M.F.B.; numerical investigation A.D.B., A.S., E.A.H., C.D. and C.S.B.; funding acquisition, C.S.B. and M.F.B. All authors have substantially contributed to the formal analysis. All authors have read and agreed to the published version of the manuscript.

Funding

This work was carried out within the framework of the EUROfusion Consortium and has received funding from the Euratom research and training programme 2014–2018 and 2019–2020 under grant agreement No. 633053. The views and opinions expressed herein do not necessarily reflect those of the European Commission. This work was also partly supported within the European project SOTERIA (661913 and contributed to the Joint Programme on Nuclear Materials (JPNM) of the European Energy Research Alliance (EERA). The project leading to this publication has received funding from Excellence Initiative of Aix-Marseille University—A*MIDEX, a French Investissements d’Avenir programme as well as from the French National Research Agency (Grant No. ANR-18-CE05-0012).

Institutional Review Board Statement

Not applicable.

Informed Consent Statement

Not applicable.

Data Availability Statement

The datasets generated and/or analysed during the current study are available from the corresponding author on reasonable request.

Acknowledgments

Centre de Calcul Intensif d’Aix-Marseille is acknowledged for granting access to its high performance computing resources. The ICMN laboratory (Orléans, France) is acknowledged for access to the CM20 microscope. Images and some analyses were performed using OVITO [15].

Conflicts of Interest

The authors declare no conflict of interest.

References

  1. Nichols, F. Kinetics of diffusional motion of pores in solids: A review. J. Nucl. Mater. 1969, 30, 143–165. [Google Scholar] [CrossRef]
  2. Goodhew, P.J.; Tyler, S.K. Helium bubble behaviour in b. c. c. metals below 0.65Tm. Proc. R. Soc. Lond. A 1981, 377, 151–184. [Google Scholar]
  3. Zell, V.; Trinkaus, H.; Schroeder, H. A simulation study of the migration and coalescence of gas bubbles in metals. J. Nucl. Mater. 1994, 212–215, 320–324. [Google Scholar] [CrossRef]
  4. Mason, D.R.; Nguyen-Manh, D.; Becquart, C.S. An empirical potential for simulating vacancy clusters in tungsten. J. Phys. Condens. Matter 2017, 29, 505501. [Google Scholar] [CrossRef] [PubMed]
  5. Castin, N.; Bakaev, A.; Bonny, G.; Sand, A.; Malerba, L.; Terentyev, D. On the onset of void swelling in pure tungsten under neutron irradiation: An object kinetic Monte Carlo approach. J. Nucl. Mater. 2017, 493, 280–293. [Google Scholar] [CrossRef] [Green Version]
  6. Perez, D.; Sandoval, L.; Blondel, S.; Wirth, B.D.; Uberuaga, B.P.; Voter, A.F. The mobility of small vacancy/helium complexes in tungsten and its impact on retention in fusion-relevant conditions. Sci. Rep. 2017, 7, 2522. [Google Scholar] [CrossRef] [PubMed] [Green Version]
  7. Jansson, V.; Chiapetto, M.; Malerba, L. The nanostructure evolution in Fe–C systems under irradiation at 560K. J. Nucl. Mater. 2013, 442, 341–349. [Google Scholar] [CrossRef] [Green Version]
  8. Pannier, B. Towards the Prediction of Microstructure Evolution under Irradiation of Model Ferritic Alloys with an Hybrid AKMC-OKMC Approach. Ph.D. Thesis, University of Lille, Lille, France, 2017. [Google Scholar]
  9. Autissier, E.; Farah, F.; Mazellier, C.G.; Decamps, B.; Schäublin, R.; Barthe, M.F. Cavity Evolution as a Function of Temperature in Self Irradiated Tungsten. 2022; to be submitted. [Google Scholar]
  10. De Backer, A.; Souidi, A.; Hodille, E.A.; Autissier, E.; Genevois, C.; Haddad, F.; Della Noce, A.; Domain, C.; Becquart, C.S.; Barthe, M.F. Nanocavity diffusion in tungsten. 2022; to be submitted. [Google Scholar]
  11. Hasanzadeh, S.; Schäublin, R.; Décamps, B.; Rousson, V.; Autissier, E.; Barthe, M.F.; Hébert, C. Three-dimensional scanning transmission electron microscopy of dislocation loops in tungsten. Micron 2018, 113, 24–33. [Google Scholar] [CrossRef] [PubMed]
  12. Hu, Z.; Desgardin, P.; Genevois, C.; Joseph, J.; Décamps, B.; Schäublin, R.; Barthe, M.F. Effect of purity on the vacancy defects induced in self–irradiated tungsten: A combination of PAS and TEM. J. Nucl. Mater. 2021, 556, 153175. [Google Scholar] [CrossRef]
  13. Domain, C.; De Backer, A.; Becquart, C. Statistical Analysis of Database of Molecular Dynamics Collision Cascades. 2022; to be submitted. [Google Scholar]
  14. Becquart, C.; Domain, C.; Sarkar, U.; Backer, A.D.; Hou, M. Microstructural evolution of irradiated tungsten: Ab initio parameterisation of an OKMC model. J. Nucl. Mater. 2010, 403, 75–88. [Google Scholar] [CrossRef]
  15. Stukowski, A. Visualization and analysis of atomistic simulation data with OVITO—The Open Visualization Tool. Model. Simul. Mater. Sci. Eng. 2009, 18, 015012. [Google Scholar] [CrossRef]
Figure 1. (a) Experimental data: measured nanocavity total densities and mean sizes as a function of temperature, i.e., at the end of the irradiation stages and each of the 8 annealing stages. The lines indicate the 0.9, 0.5 and 0.1 contours of our designed likelihood function. (b) Data attach function which describes how strongly the optimization should converge close to the likelihood maximum.
Psf 05 00041 g001
Figure 2. (a) High density of small nanocavities visible in the TEM micrographs in under-focused beam conditions of tungsten samples after irradiation. (b) Visualization of the defects (SIAs clusters and nanocavities) in the simulation box at the end of the irradiation.
Psf 05 00041 g002
Figure 3. Pareto front of the first objectives (i.e., the ones corresponding to the irradiation stage) of size and density at T 1 , the irradiation temperature. The point colors correspond to the temperature of diffusion of the smallest nanocavities, θ 1 , and the point sizes correspond to the nanocavity mean sizes at the end of the irradiation, s 1 .
Psf 05 00041 g003
Figure 4. Projection of the Pareto optimal solutions in the space of parameters θ ( s ) (a) d e n s i t y objective, (b) s i z e objective.
Psf 05 00041 g004
Figure 5. (a) Pareto front and Pareto optimal solution projected in the parameter space, diffusion temperature, θ i , as a function of the nanocavity size. Stars on the y axis indicate the annealing temperatures, T j . (b) Comparison of our results with literature.
Psf 05 00041 g005
Disclaimer/Publisher’s Note: The statements, opinions and data contained in all publications are solely those of the individual author(s) and contributor(s) and not of MDPI and/or the editor(s). MDPI and/or the editor(s) disclaim responsibility for any injury to people or property resulting from any ideas, methods, instructions or products referred to in the content.

