Proceeding Paper

Bulk and Point Defect Properties in α-Zr: Uncertainty Quantification on a Semi-Empirical Potential

by
Alessandra Del Masto
1,2,†
1
Centre Interdisciplinaire de Nanosciences de Marseille, CINaM, CNRS-Aix-Marseille Université, 13009 Marseille, France
2
Institut de Radioprotection et de Sûreté Nucléaire, IRSN, 13115 Saint Paul-Lez-Durance, France
Presented at the 41st International Workshop on Bayesian Inference and Maximum Entropy Methods in Science and Engineering, Paris, France, 18–22 July 2022.
Phys. Sci. Forum 2022, 5(1), 3; https://doi.org/10.3390/psf2022005003
Published: 31 October 2022

Abstract

:
Modelling studies of irradiation defects in α -Zr, such as point defects and their multiple clusters, often use semi-empirical potentials because of their higher computational efficiency as compared to ab initio approaches. Such potentials rely on a fixed number of parameters that need to be fitted to a reference dataset (ab initio and/or experimental), and their reliability is closely related to the uncertainty associated with their parameters, coming from both data inconsistency and model approximations. In this work, parametric uncertainties are quantified on a Second Moment Approximation (SMA) potential, focusing on bulk and point defect properties in α -Zr. A surrogate model, based on polynomial chaos expansion, is first built for properties of interest computed from atomistics, and simultaneously allows us to analytically compute the sensitivity indices of the observed properties to the potential parameters. This additional information is then used to select a limited number of material properties for the Bayesian inference. The posterior probability distributions of the parameters are estimated through two Markov Chain Monte Carlo (MCMC) sampling algorithms. The estimated posteriors of the model parameters are finally used to estimate materials properties (not used for the inference): in any case, most of the properties are closer to the reference ab initio and experimental data than those obtained from the original potential.

1. Introduction

Zirconium-based alloys are used as a nuclear cladding material since zirconium (Zr) has a low neutron absorption cross-section combined with satisfactory thermo-mechanical properties and good corrosion resistance. Neutron irradiation triggers the creation of a large number of point defects—both of vacancy and self-interstitial type—that subsequently diffuse and cluster within the crystalline hcp (hexagonal close-packed) Zr matrix. This directly affects the structural and mechanical properties of the cladding material, up to the macroscopic scale [1]. Accurately computing the properties of the multiple possible configurations of point defects and their clusters is a first necessary step towards understanding irradiation effects in α -Zr [2,3,4].
The atomic scale is relevant for the study of small defects, with ab initio approaches, like the Density Functional Theory (DFT), being the most popular, as they account for the electronic structure of the materials. Unfortunately, their high computational cost complicates their systematic use. Alternatively, interatomic potentials offer efficient numerical evaluations of energies and forces [5], which then would enable systematic sampling of defect configurations. These potentials are defined by a fixed number of parameters, that are typically identified by a fitting on a user-defined set of target properties. However, they carry a certain amount of uncertainties of quite diverse origins: details of the fitting procedure (cost function, weights of the cost function, etc....), choice of the reference database (experimental error, various DFT values with different exchange-correlation functionals, etc.), and model inadequacy of the interatomic potential itself. Therefore, the accuracy of the physical data predicted using these approaches directly depends on the uncertainties associated with the parameters. As pointed out by Cailliez et al. [6] very few studies quantify the uncertainties associated with the use of such potentials [7,8,9,10,11], and the used potentials are generally simply fitted on a number of properties with no assumed inherent uncertainties (see e.g., [12]).
In this work, we quantify the parametric uncertainties of a Tight-Binding Second Moment Approximation (SMA) potential [13]. We purposefully select a potential that was not adjusted on α -Zr properties [14], and that inaccurately predicts vacancy and self-interstitial formation energies. Our methodology combines molecular static simulations, sensitivity analysis, and Bayesian inference. We first build a polynomial chaos-based surrogate model of bulk and point defect properties, which provide analytical expressions for the sensitivity indices of the observed properties to the potential parameters. Then, we identify a limited number of quantities of interest to be used for Bayesian inference, through a careful examination of indices. We calculate the posterior probability distributions of the parameters, using both ab initio and experimental data, and examine the influence of the chosen property for Bayesian inference and of the sampling algorithm. Finally, we use the obtained posteriors to propagate uncertainties from the parameters of the potential up to α -Zr bulk and point defect properties and achieve more accurate predictions.

2. Methods & Material

2.1. Second Moment Approximation (SMA) Potential

In the Second Moment Approximation of the tight-binding scheme [13,15], the energy of an atomic site i, with i = 1 N at for a system of N at atoms, can be written as the sum of a band term E i b and a repulsive term E i rep , as
E i tot = E i b + E i rep = ξ j i r cut e 2 q r i j r 0 1 + A j i r cut e p r i j r 0 1 ,
where r 0 represents a distance close to the first nearest neighbor distance, and r i j is the distance between atoms i and j. ξ > 0 is an effective hopping integral, and q describes its dependence on the relative interatomic distance. A > 0 provides the repulsive energy scale, and p accounts for the atomic distance dependence of the repulsive term. The potential is thus based on a set of four adjustable parameters θ = { p , q , A , ξ } . The summation in Equation (1) is truncated at a cutoff distance r cut , chosen to include a suitable number of interacting atoms. Its practical implementation involves a fifth-order polynomial, smoothly linking the SMA functional to zero in an interval whose extremities must lie between two successive neighbor shells. The SMA potential described here is part of the ‘smatb’ package of the Lammps molecular dynamics software [16,17].
The set of SMA potential parameters proposed by Dufresne et al. [14] is selected. They were calibrated by fitting some bulk properties of fcc Zr quoted in Refs. [18,19,20], and their values are θ 0 = { p , q , A , ξ } = { 7.376 , 2.492 , 0.269 , 2.693 } , with r 0 = 3.17 . For this potential, the r c u t interval lies between the second and third neighbors. The nominal potential is not perfect in reproducing small defects properties, as established in Ref. [21].

2.2. Quantities of Interest (QOIs)

We choose a subset of (observed) properties that are relevant for irradiation effects in α -Zr. More precisely, we keep elastic constants C i j of the hcp matrix ( B u l k modulus, C 11 , C 12 , C 44 , C 13 and C 33 ), and formation energies E f of single point defects (vacancy V and self-interstitial SIA), that are basic blocks for point defect clusters. Four configurations of SIAs are considered: octahedral (O), basal octahedral (BO), crowdions out of the basal plane (BC’), and split dumbbells in the basal plane (BS), as described in Refs. [22,23,24]. All these are T = 0 K quantities, and simulation boxes in molecular static (MS) simulations include ∼1500 atoms, which ensures well-converged formation energy values.

2.3. Uncertainty Quantification (UQ)

A previous study [21] showed that for any given set of parameters θ , the specific choice of the cutoff interval can generate large artifacts when computing the observed properties. Those r cut -induced biases can be corrected by refining—for each random draw of the parameters set—the cutoff interval until elastic properties are stable (see Ref. [21] for details). This procedure requires an additional amount of computational time. To speed up the whole process of UQ/inference, a polynomial chaos expansion-based surrogate model of the corrected QOIs is thus developed, i.e., for the elastic constants C i j and the formation energies of point defects E f . The mathematical background of such an expansion is well described in Ref. [25], and as explained in Ref. [26], the Sobol’s sensitivity indices—that quantify the effect of the potential parameters on the QOIs—are an additional outcome of this expansion.
The uncertainty quantification is carried out using the Bayesian methodology presented in [27]. Using similar notations, we denote Y true as the true value of a given property Y, which deviates from the experimental or ab initio observation value Y obs through the following relation:
Y obs = Y true + ϵ obs .
Similarly, the output of the metamodel Y M M ( θ ) is linked to the true value via the surrogate model error ϵ M M , as
Y M M = Y true + ϵ M M .
Our goal is to find the posterior distribution of the parameter set θ given the observed quantity Y obs , which is obtained by Bayes’ theorem through the equation:
P ( θ | Y obs ) P ( θ ) × P ( Y obs | θ )
with P ( θ ) the prior distribution. To align Y M M closer to Y obs , the error terms ϵ obs and ϵ M M are combined into a single error term ϵ = ϵ obs + ϵ M M . Assuming the error ϵ is distributed as a Gaussian (Histograms of residuals support this assumption (not shown here).) with zero mean and variance σ ϵ 2 , the likelihood has the following form:
P ( Y o b s | θ , σ ϵ 2 ) exp 1 σ ϵ 2 [ Y obs Y M M ( θ ) ] 2 .
The variance σ ϵ 2 is treated here as another parameter whose posterior probability must be determined. It is assigned a prior half-normal distribution zero-centered and with σ ϵ = ϵ obs + ϵ M M 3 .
To estimate the posterior distribution, a sampling using a Monte Carlo Markov Chain (MCMC) method is used, which allows us to perform random draws and thus generate drawn samples of the parameter posterior distributions (Equation (4)). Two MCMC algorithms are tested: Metropolis-Hastings (MH) [28] and Hamiltonian Monte Carlo (HMC) [29], both implemented in the Python module pymc3 [30].
The first one works by simulating a Markov Chain whose stationary distribution is the wanted posterior distribution π . Each element of the chain is randomly drawn from π and is accepted or rejected according to a so-called acceptance probability α , which is a function of a transition kernel Q, defining the conditional probability of moving to a new position in space given a current position. Many versions of this algorithm exist, depending on the choice of the transition kernel. For this work, we used the classical random walk type, in which Q is symmetrical. For this scheme, a normal proposal function, N ( 0 , 1 ) , and a single parameter update steps are used. The acceptance rate is close to 35% for the Metropolis-Hastings scheme. The second algorithm proceeds by random draw, for each new element of the chain, of both position and momentum. We then let the system evolve according to the Hamiltonian equations up to a new position, which is theoretically always accepted, as the acceptance probability is defined by m i n ( 1 , e Δ H ) and the dynamics conserve energy along the trajectory (i.e., Δ H = 0 ). Nonetheless, the actual rate of acceptance is close to 65%, since the hamiltonian equations are solved numerically: thus, the Δ H is not always equal to 0. The leapfrog integrator is used to solve such equations and the time step is automatically scaled through the Non-U-Turns Sampler [31]. The assigned velocity distribution for the HMC runs is N ( 0 , 1 ) . For both algorithms, the convergence is tested through the Gelman-Rubin index, which needs to be lower than 1.1 [32].

3. Results

3.1. Surrogate Model and Sensitivity Indices

To develop the above-mentioned surrogate model of the corrected QOIs, we build an experimental plan for the MS simulations by varying the four potential parameters θ = { p , q , A , ξ } in a maximum range of δ = ± 7 % around their nominal values. The plan is generated by randomly drawing 5000 sets of parameters, assuming a uniform probability distribution function (PDF) for all the parameters. Legendre polynomials are chosen for the polynomial expansion since they are well adapted for uniform PDFs [25]. The convergence of the surrogate model is assessed by testing the convergence of both statistical mean and variance for all QOIs. The resulting first order ( S 1 ) and total sensitivity indices ( S T ) [33], quantifying respectively the direct effect and the sum of direct and parameter interactions effect, are given in Figure 1 for the QOIs.
The gap between first order and total indices is small for all QOIs and all parameters, meaning that interaction between parameters in the studied cases is insignificant. Parameters affect the observed properties differently: E f O SIA is essentially impacted by p, while E f V is equally impacted by p, q and ξ , with almost no effect of A. Regarding the elastic constants, ξ is the leading sensitivity index, except for C 44 that shows a stronger influence of p. We also note that for all C i j , there is more than one significant influential parameter. As will be seen below, the sensitivity indices give valuable hints regarding which properties are relevant for performing the UQ study.

3.2. Posterior Distributions of Parameters and Uncertainty Quantification

We first evaluate the effect of the choice of properties included for Bayesian inference, and of the chosen MCMC sampling algorithm, on the estimated posterior PDFs of parameters. Then, uncertainty quantification is performed and commented on for all QOIs listed in Section 2.2.

3.2.1. Effect of Chosen QOIs and MCMC Algorithm

We first aim at choosing a subset of QOIs used to estimate the posterior PDFs of parameters. Not including all QOIs is meant to test the propagation of uncertainty for quantities that are not included in the inference, and that could, in a more general sense, be quantities for which there exist no observed values. Results of the sensitivity analysis show the selection of subsets containing three elastic constants ( B u l k modulus, C 13 and C 44 ) and E f V . Indeed, B u l k = ( 2 C 11 + C 33 + 4 C 12 + 2 C 13 ) / 9 in hcp structure, and thus encompass information regarding four QOIs at the same time. C 13 and C 44 have high p and q sensitivity indices, respectively, and the vacancy is fairly affected by all parameters but A. Input data Y obs for the inference come from both experiments [34] and ab initio calculations ([12,23,35,36]). Posterior PDFs of parameters are calculated using each chosen property alone (UQ B u l k , UQ C 13 , UQ C 44 and UQ E f V ), and altogether (UQ Tot). For all studied cases, non-informative uniform prior distributions are assigned to the parameters U ( 7 % , 7 % ) θ 0 , and the Metropolis-Hastings (MH) MCMC scheme is used.
Results are summarized in terms of the mean and standard deviation of the estimated posterior distributions of parameters in Table 1. For the case of posterior PDFs obtained using data of each property alone, mean values are very similar and are also fairly close to the nominal parameter values. Standard deviations are occasionally more affected (see e.g., the q parameter), but still rather similar. In contrast, the posterior distributions obtained using simultaneous data from B u l k modulus, C 13 , C 44 , and E f V are significantly different. Indeed, and as expected, when using data from multiple properties at the same time, more constraints have to be satisfied during the actualization of the posterior distributions. This leads to a shift of the mean and variance of the estimated posteriors against the nominal potential, especially because the QOIs used for this UQ study are different from the ones originally used to fit the nominal potential. As is well-known, the choice of observed properties is crucial for uncertainty quantification, and sensitivity analysis provides additional information about the more relevant QOIs to select. For the following, we thus chose the subset of B u l k modulus, C 44 , C 13 and E f V (i.e., UQ Tot), since this combination of QOIs allows for an overall rather balanced effect of parameters.
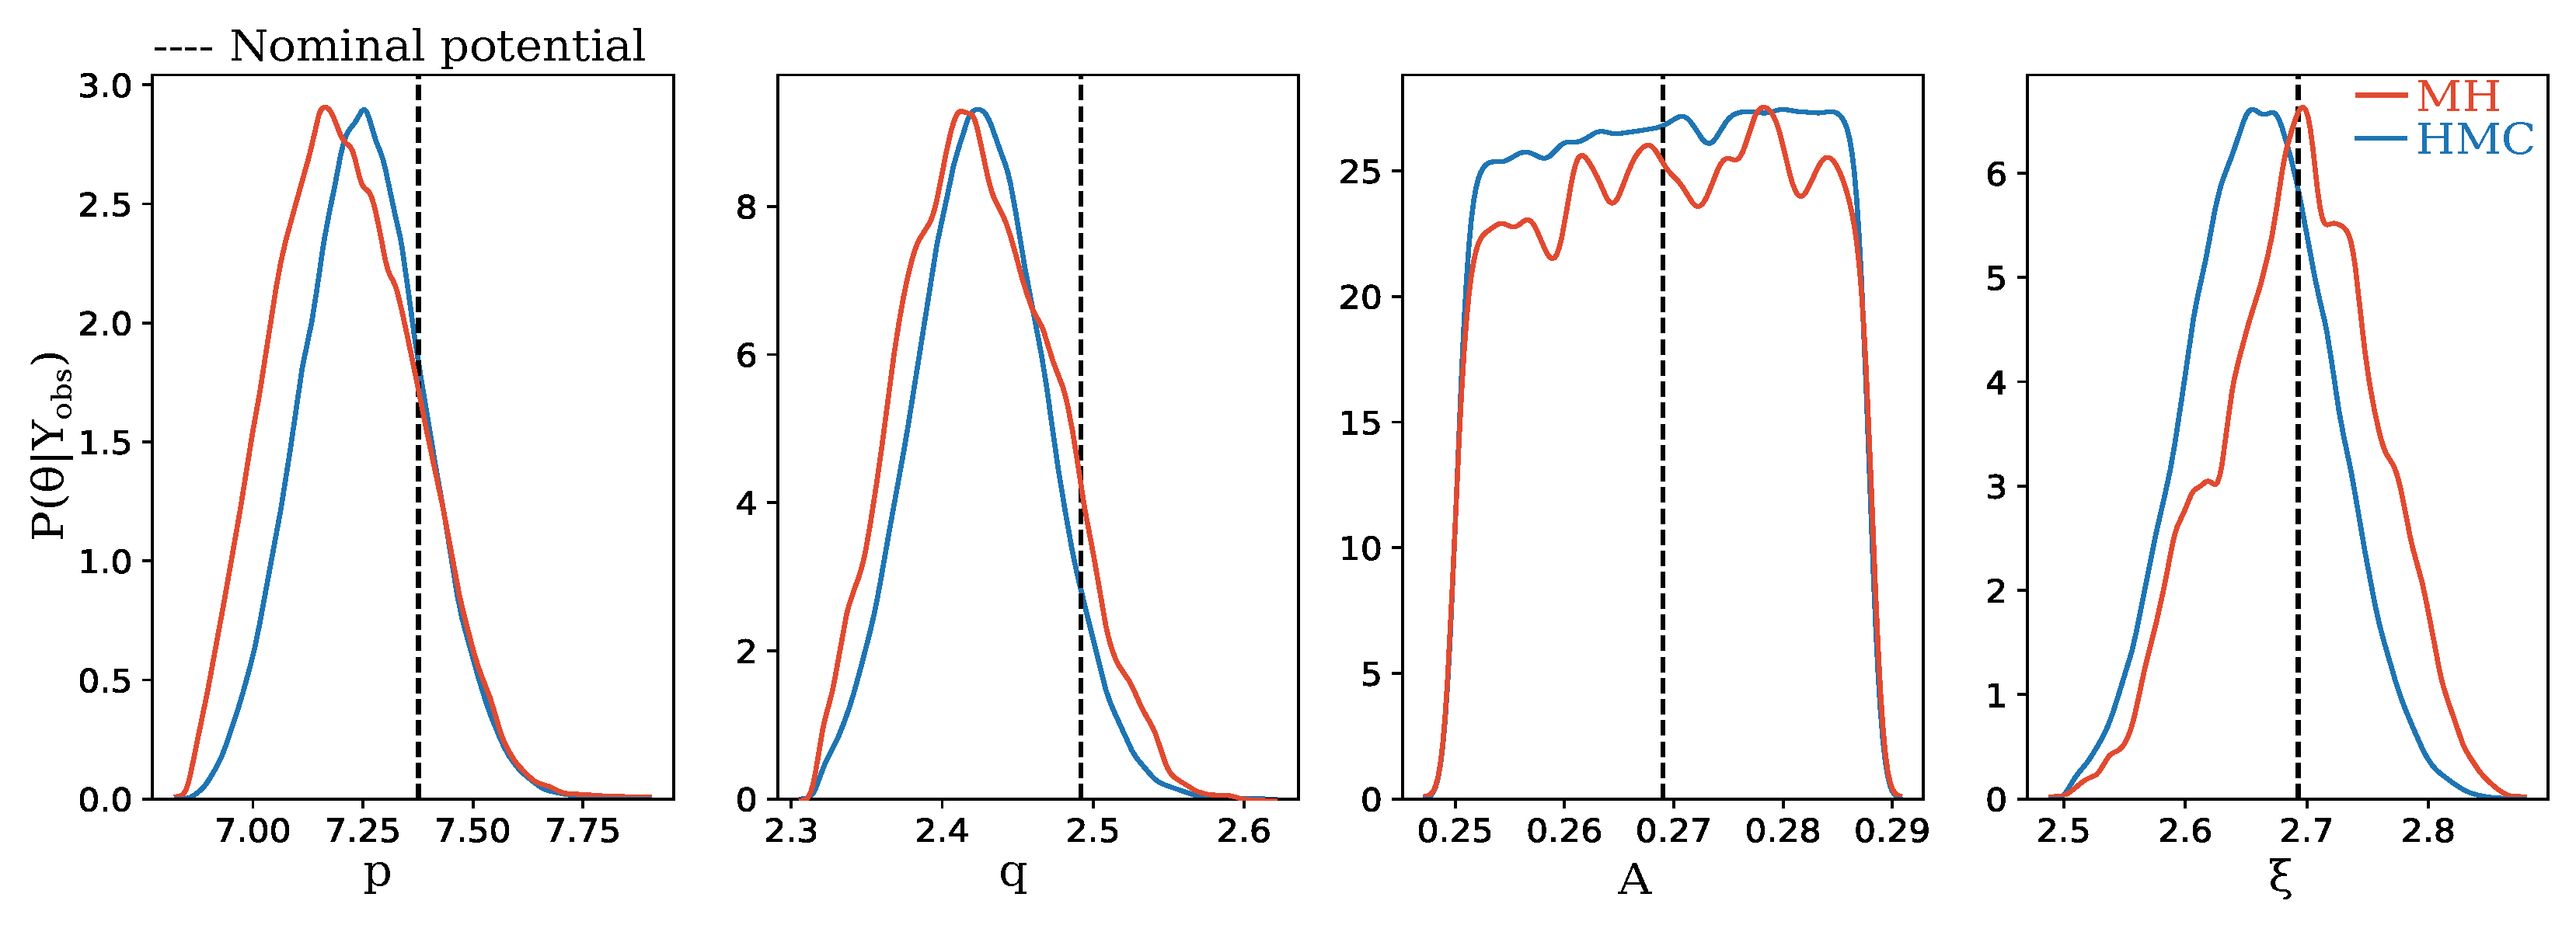
With this subset, we now examine the influence of the MCMC algorithm on the posterior PDFs. Converged results are shown in Figure 2 for θ = { p , q , A , ξ } . MH and HMC algorithms lead to similar results in terms of shape and standard deviations of the posteriors: p and q have slightly skewed PDFs, A has a close-to-uniform distribution, and ξ is a symmetrical distribution. However, we note a small shift of the mean of the distributions for p and ξ parameters when comparing, in more detail, the outcomes of the two algorithms. This will have consequences on the propagated uncertainty, as discussed below.

3.2.2. Uncertainty Quantification

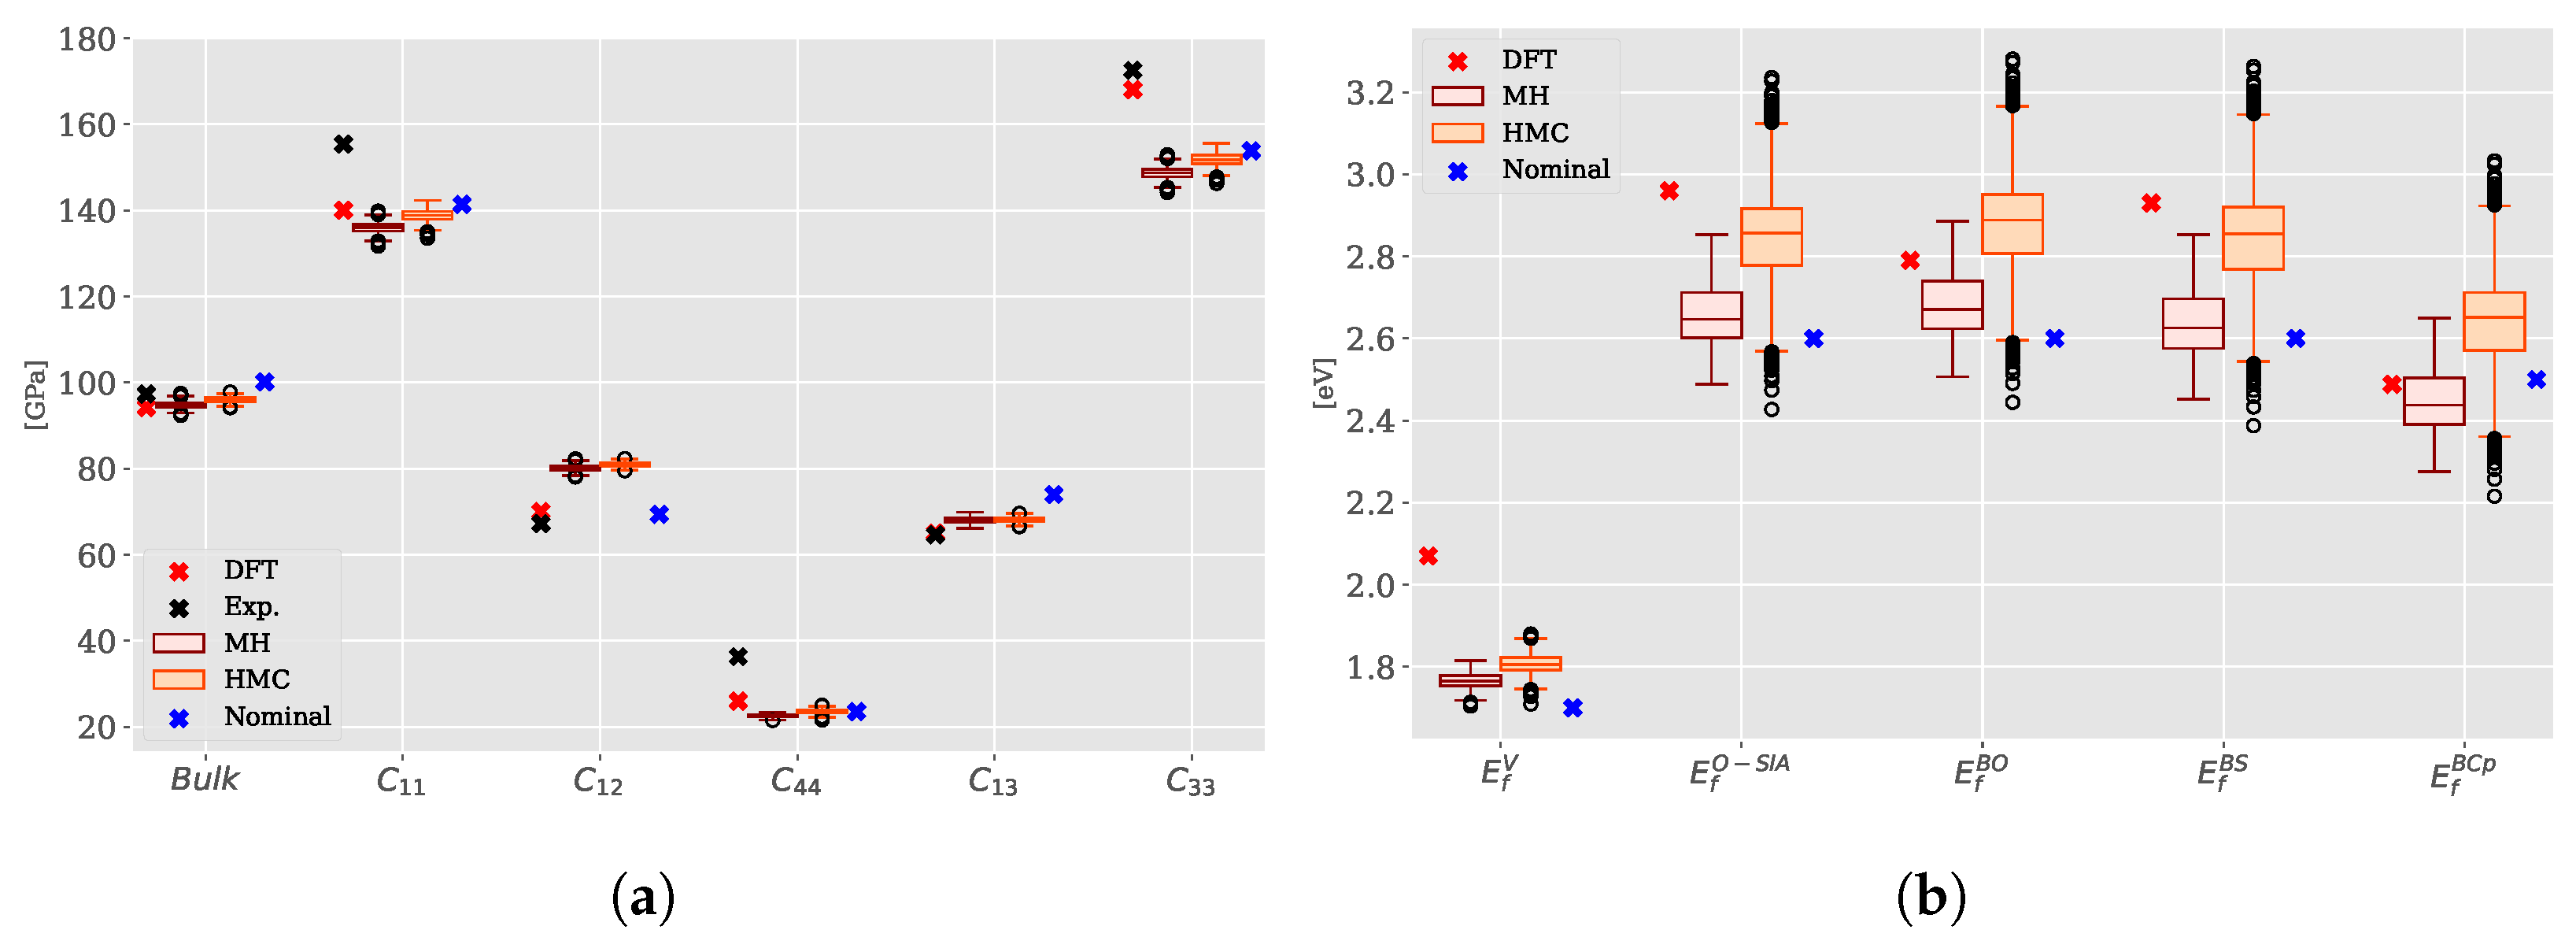
Distribution of C i j and point defect formation energies (vacancy and four configurations of SIAs) are shown in Figure 3a,b. Results of MH and HMC algorithms are displayed using boxplot representations. Nominal parameter values are indicated with blue crosses, and as visual references, we added some experimental and ab initio values (red and dark crosses, from Refs. [23,34,36]).
In the case of elastic properties and vacancy formation energy, the choice of the algorithm has a negligible impact on the property distributions. It is quite different for the SIAs formation energies: distributions are shifted, and the spreading with HMC is larger, with many outliers. Such differences are likely due to the fact that all SIAs have essentially one strongly influential parameter, p, whose PDF is slightly shifted when comparing MH and HMC. Comparing now both UQ results to the reference values, we find that mostly, median values are closer to the reference ab initio values than the nominal parameter values. In particular, SIA E f values, that were not included in the inference, have improved predictions. Nevertheless, actual E f values and their relative ordering are not fully recovered, and this might be related to the expressivity limit of the chosen potential, having difficulties correctly describing this type of defect [21]. Since the median values of the E f related to the HMC algorithm are closer to the more accurate ab initio input data, this scheme seems to be the most appropriate for the UQ, although it is also the most computationally costly (2 to 3 times longer than the MH algorithm).

4. Conclusions

In this work, we quantified the parametric uncertainties of an SMA potential used for the study of elastic constants and point defect energetics of α -Zr, through an approach combining molecular dynamics, polynomial chaos expansion, sensitivity analysis, and Bayesian inference. The main outcomes of this work are:
  • Sensitivity analysis gives insights on the relevant properties for performing the inference of posterior PDFs parameters, here a subset of C i j and E f V ,
  • Propagation of uncertainty provides more accurate results than the nominal potential—even if not perfect—as compared to the set of reference values. This is particularly visible for SIAs E f , for which predictions by the nominal potential were poor,
  • MH and HMC MCMC schemes give qualitatively similar results for the PDFs and property distributions. However, mean values of E f are closer to the ab initio values for the HMC scheme.
The proposed methodology could be applied to estimate properties of point defect clusters in α -Zr: multiple configurations having diverse energetics do exist, and are usually not perfectly captured by interatomic potentials. More generally speaking, the present UQ methodology should be applied systematically more often when using interatomic potentials (e.g., EAM, MEAM, etc.).The approach could also be used with more complex models, such as N-moment tight-binding electronic structure schemes. An application to Zr-H systems will be the topic of future work.

Funding

Support for this work was provided by the PEPS-ANCRE POTEMQUIN project.

Institutional Review Board Statement

Not applicable.

Informed Consent Statement

Not applicable.

Data Availability Statement

Not applicable.

Acknowledgments

The author thanks C. Varvenne and G. Tréglia at CINaM and J. Baccou and F. Ribeiro at IRSN for insightful discussions related to this work.

Conflicts of Interest

The author declares no conflict of interest.

References

  1. Onimus, F.; Béchade, J.L. 4.01-Radiation Effects in Zirconium Alloys. In Comprehensive Nuclear Materials; Rudy, J.M., Konings, E., Eds.; In Chief; Elsevier: Oxford, UK, 2012; pp. 1–31. [Google Scholar] [CrossRef]
  2. Varvenne, C.; Mackain, O.; Clouet, E. Vacancy clustering in zirconium: An atomic-scale study. Acta Mater. 2014, 78, 65–77. [Google Scholar] [CrossRef] [Green Version]
  3. Christiaen, B.; Domain, C.; Thuinet, L.; Ambard, A.; Legris, A. A new scenario for ‹c› vacancy loop formation in zirconium based on atomic-scale modeling. Acta Mater. 2019, 179, 93–106. [Google Scholar] [CrossRef]
  4. Dai, C.; Varvenne, C.; Saidi, P.; Yao, Z.; Daymond, M.R.; Béland, L.K. Stability of vacancy and interstitial dislocation loops in α-zirconium: Atomistic calculations and continuum modelling. J. Nucl. Mater. 2021, 554, 153059. [Google Scholar] [CrossRef]
  5. Mishin, Y. Machine-learning interatomic potentials for materials science. Acta Mater. 2021, 214, 1–48. [Google Scholar] [CrossRef]
  6. Cailliez, F.; Pernot, P. Statistical approaches to forcefield calibration and prediction uncertainty in molecular simulation. J. Chem. Phys. 2011, 134, 054124. [Google Scholar] [CrossRef] [Green Version]
  7. Dhaliwal, G.; Nair, P.B.; Singh, C.V. Uncertainty and sensitivity analysis of mechanical and thermal properties computed through Embedded Atom Method potential. Comput. Mater. Sci. 2019, 166, 30–41. [Google Scholar] [CrossRef]
  8. Kulakova, L.; Arampatzis, G.; Angelikopoulos, P.; Hadjidoukas, P.; Papadimitriou, C.; Koumoutsakos, P. Data driven inference for the repulsive exponent of the Lennard-Jones potential in molecular dynamics simulations. Sci. Rep. 2017, 7, 16576. [Google Scholar] [CrossRef] [Green Version]
  9. Rizzi, F.; Najm, H.N.; Debusschere, B.J.; Sargsyan, K.; Salloum, M.; Adalsteinsson, H.; Knio, O.M. Uncertainty quantification in MD simulations. Part I: Forward propagation. Multiscale Model. Simul. 2012, 10, 1428–1459. [Google Scholar] [CrossRef]
  10. Rizzi, F.; Najm, H.N.; Debusschere, B.J.; Sargsyan, K.; Salloum, M.; Adalsteinsson, H.; Knio, O.M. Uncertainty quantification in MD simulations. PART II: Bayesian inference of force-field parameters. Multiscale Model. Simul. 2012, 10, 1460–1492. [Google Scholar] [CrossRef]
  11. Sargsyan, K.; Huan, X.; Najm, H.N. Embedded model error representation for bayesian model calibration. Int. J. Uncertain. Quantif. 2019, 9, 365–394. [Google Scholar] [CrossRef] [Green Version]
  12. Mendelev, M.I.; Ackland, G.J. Development of an Interatomic Potential for the Simulation of Phase Transformations in Zirconium. Philos. Mag. Lett. 2007, 87, 349–359. [Google Scholar] [CrossRef]
  13. Rosato, V.; Guillopé, M.; Legrand, B. Thermodynamical and Structural Properties of FCC Transition Metals using a Simple Tight-Binding Model. Philos. Mag. A 1989, 59, 321–336. [Google Scholar] [CrossRef]
  14. Dufresne, A.; Ribeiro, F.; Tréglia, G. How to derive tight-binding spd potentials? Application to zirconium. J. Phys. Condens. Matter 2015, 27. [Google Scholar] [CrossRef] [PubMed]
  15. Gupta, R.P. Lattice relaxation at a metal surface. Phys. Rev. B 1981, 23, 6265–6270. [Google Scholar] [CrossRef]
  16. Plimpton, S. Fast Parallel Algorithms for Short-Range Molecular Dynamics. J. Comput. Phys. 1995, 117, 1–19. [Google Scholar] [CrossRef] [Green Version]
  17. Thompson, A.P.; Aktulga, H.M.; Berger, R.; Bolintineanu, D.S.; Brown, W.M.; Crozier, P.S.; in’t Veld, P.J.; Kohlmeyer, A.; Moore, S.G.; Nguyen, T.D.; et al. LAMMPS—A flexible simulation tool for particle-based materials modeling at the atomic, meso, and continuum scales. Comput. Phys. Commun. 2022, 271. [Google Scholar] [CrossRef]
  18. Kittel, C. Solid State Physics, 8th ed.; John Wiley & Sons: New York, NY, USA, 2005; Available online: https://metal.elte.hu/~groma/Anyagtudomany/kittel.pdf (accessed on 15 July 2022).
  19. Simmons, G.; Wang, H. Single Crystal Elastic Constants and Calculated Aggregate Properties. A Handbook; The MIT Press: Cambridge, MA, USA, 1971. [Google Scholar]
  20. Vinet, P.; Ferrante, J.; Smith, J.R.; Rose, J.H. A universal equation of state for solids. J. Phys. C Solid State Phys. 1986, 19, L467–L473. [Google Scholar] [CrossRef]
  21. Del Masto, A.; Varvenne, C.; Baccou, J.; Tréglia, G.; Ribeiro, F. Insights on the robustness, sensitivity and expressivity of simple many-body potentials: Application to α-Zr. Unpublished work. 2022. [Google Scholar]
  22. Vérité, G.; Domain, C.; Fu, C.C.; Gasca, P.; Legris, A.; Willaime, F. Self-interstitial defects in hexagonal close packed metals revisited: Evidence for low-symmetry configurations in Ti, Zr, and Hf. Phys. Rev. B 2013, 87, 134108. [Google Scholar] [CrossRef]
  23. Varvenne, C.; Bruneval, F.; Marinica, M.C.; Clouet, E. Point defect modeling in materials: Coupling ab initio and elasticity approaches. Phys. Rev. B 2013, 88, 134102. [Google Scholar] [CrossRef]
  24. Samolyuk, G.D.; Golubov, S.I.; Osetsky, Y.N.; Stoller, R. Self-interstitial configurations in hcp Zr: A first principles analysis. Phil. Mag. Lett. 2013, 93, 93–100. [Google Scholar] [CrossRef]
  25. Ghanem, R.; Spanos, P.D. Polynomial Chaos in Stochastic Finite Elements. J. Appl. Mech. 1990, 57, 197. [Google Scholar] [CrossRef]
  26. Sudret, B. Global sensitivity analysis using polynomial chaos expansions. Reliab. Eng. Syst. Saf. 2008, 93, 964–979. [Google Scholar] [CrossRef]
  27. Dhaliwal, G.; Nair, P.B.; Singh, C.V. Uncertainty analysis and estimation of robust AIREBO parameters for graphene. Carbon N. Y. 2019, 142, 300–310. [Google Scholar] [CrossRef]
  28. Metropolis, N.; Rosenbluth, A.W.; Rosenbluth, M.N.; Teller, A.H. Equation of State Calculations by Fast Computing Machines. J. Chem. Phys. 1953, 21, 1087–1092. [Google Scholar] [CrossRef] [Green Version]
  29. Betancourt, M. A Conceptual Introduction to Hamiltonian Monte Carlo. arXiv 2017, arXiv:1701.02434. [Google Scholar]
  30. Salvatier, J.; Wiecki, T.V.; Fonnesbeck, C. Probabilistic programming in Python using PyMC3. PeerJ Comput. Sci. 2016, 2016, 1–24. [Google Scholar] [CrossRef] [Green Version]
  31. Hoffman, M.D.; Gelman, A. The no-U-turn sampler: Adaptively setting path lengths in Hamiltonian Monte Carlo. J. Mach. Learn. Res. 2014, 15, 1593–1623. [Google Scholar]
  32. Gelman, A.; Rubin, D.B. Inference from iterative simulation using multiple sequences. Stat. Sci. 1992, 7, 457–472. [Google Scholar] [CrossRef]
  33. Sobol, I. Sensitivity estimates for non linear mathematical models. Math. Model. Comput. Exp. 1993, 1, 407–414. [Google Scholar] [CrossRef]
  34. Fisher, E.S.; Renken, C.J. Single-Crystal Moduli and the hcp → bcc Transformation in Ti, Zr and Hf. Phys. Rev. 1964, 135, 482–494. [Google Scholar] [CrossRef]
  35. Vérité, G.; Willaime, F.; Fu, C.C. Anisotropy of the Vacancy Migration in Ti, Zr and Hf Hexagonal Close-Packed Metals from First Principles. Solid State Phenom. 2007, 129, 75–81. [Google Scholar] [CrossRef]
  36. Clouet, E. Screw dislocation in zirconium: An ab initio study. Phys. Rev. B 2012, 86, 144104. [Google Scholar] [CrossRef]
Figure 1. (a) Sobol’s first order and total sensitivity indices, quantifying the effect of the parameters of the potential on the QOIs. In terms of formation energies of point defects, only indices for E f V and E f O SIA are shown, the others being substantially the same as the octahedral. (b) Projection in the basal plane of some observed point defects. White spheres represent the bulk Zr atoms at z = 0 , gray spheres the bulk Zr atoms at z = c 2 . The square represents the vacancy (V), and the blue spheres are self-interstitials (SIAs) at z = 0 (BO and BS configurations), and the yellow sphere the SIA at z = c 4 (O-SIA configuration).
Psf 05 00003 g001
Figure 2. Posterior distributions of the four parameters obtained through the Hamiltonian Monte Carlo (HMC) and Metropolis-Hastings (MH) algorithms. Dashed lines represent the values of the parameters in the nominal potential [14]. The showed posteriors are scaled through an is a probabilistic transformation from the original independent and identically distributed in [ 1 , 1 ] variables defining the polynomial chaos-based metamodel. The normalization is done considering the corresponding potentials parameters: θ = [ ( 1 δ ) θ 0 , ( 1 + δ ) θ 0 ] , with δ = 7 % .
Psf 05 00003 g002
Figure 3. Distributions of C i j (a) and E f (b) obtained from the posterior distributions of parameter estimated through the Metropolis-Hastings (MH) and Hamiltonian Monte Carlo (HMC) algorithm. DFT data come from ab initio calculations reported in [36] for the C i j and in [23] for the E f . Experimental points for C i j come from [34] and the nominal points correspond to the properties obtained using the original potential [14].
Psf 05 00003 g003
Table 1. Means and standard deviations of posterior distributions of the parameters obtained using data of only one QOI alone (UQ B u l k , UQ C 13 , UQ C 44 , and UQ E f V ) or all four QOIs together (UQ Tot.).
UQ Bulk UQ C 13 UQ C 44 UQ E f V UQ Tot.
Nominal μ σ μ σ μ σ μ σ μ σ
p7.3767.3790.2937.4290.2267.3900.2977.400.5587.6210.114
q2.4922.4880.9862.4850.10042.4940.09362.4860.1892.6070.0402
A0.2690.2690.01070.2690.01080.2680.01060.2690.02170.2730.009
ξ 2.6932.6900.08662.6900.1072.7000.09822.6710.2052.5960.057
Publisher’s Note: MDPI stays neutral with regard to jurisdictional claims in published maps and institutional affiliations.