Proceeding Paper

Combining Knowledge About Metabolic Networks and Single-Cell Data with Maximum Entropy †

by
Carola S. Heinzel
1,2,‡,
Johann F. Jadebeck
2,3,‡,
Elisabeth Zelle
2,
Johannes Seiffarth
2,3 and
Katharina Nöh
2,*
1
Department of Mathematical Stochastics, University of Freiburg, 79106 Freiburg, Germany
2
Institute of Bio- and Geosciences (IBG-1), Forschungszentrum Jülich GmbH, 52428 Jülich, Germany
3
Computational Systems Biotechnology (AVT.CSB), RWTH Aachen University, 52074 Aachen, Germany
*
Author to whom correspondence should be addressed.
Presented at the 43rd International Workshop on Bayesian Inference and Maximum Entropy Methods in Science and Engineering, Ghent, Belgium, 1–5 July 2024.
These authors contributed equally to this work.
Phys. Sci. Forum 2025, 12(1), 3; https://doi.org/10.3390/psf2025012003
Published: 24 September 2025

Abstract

Better understanding of the fitness and flexibility of microbial platform organisms is central to biotechnological process development. Live-cell experiments uncover the phenotypic heterogeneity of living cells, emerging even within isogenic cell populations. However, how this observed heterogeneity in growth relates to the variability of intracellular processes that drive cell growth and division is less understood. We here approach the question, how the observed phenotypic variability in single-cell growth rates links to metabolic processes, specifically intracellular reaction rates (fluxes). To approach this question, we employ the Maximum Entropy (MaxEnt) principle that allows us to bring together the phenotypic solution space, derived from metabolic network models, to single-cell growth rates observed in live-cell experiments. We apply the computational machinery to first-of-its-kind data of the microorganism Corynebacterium glutamicum, grown on different substrates under continuous medium supply. We compare the MaxEnt-based estimates of metabolic fluxes with estimates obtained by assuming that the average cell operates at its maximum growth rate, which is the current predominant practice in biotechnology.

1. Introduction

Biotechnology is concerned with exploiting living cells and optimizing their capacities to sustainably produce chemicals ranging from bulk products to proteins for detergents and pharmaceuticals. Recent developments are increasingly addressing circular economies, where monomers are produced from renewable feedstocks using automatically designed strains [1,2]. However, in industrial-scale bioprocesses, the phenotypic heterogeneity of cells is estimated to be responsible for losses of up to 30% [3], severely limiting profitability. Here, besides variability in gene expression, metabolic heterogeneity is supposed to play an important role [4].
Nowadays, single-cell technologies offer a more refined view and avenue to quantify phenotypic variability in terms of single-cell growth rates [5,6,7]. Yet, despite advances in single-cell analytical technologies [8], drawing actionable conclusions from single-cell data to help lead the way to design more efficient large-scale bioprocesses, is far from trivial. Several data- and model-driven approaches have been proposed that target phenomena at different cellular levels and granularities [9,10,11,12,13,14]. These approaches, however, have limitations in bridging the scales from a single-cell population to a large-scale one for various reasons, e.g., computations do not scale (individual-based models cannot be used to simulate bioreactor-scale experiments) or quantitative modeling paradigms do not account for stochastic single-cell behavior (e.g., 13C-metabolic flux analysis). Stoichiometric metabolic models mediate between the scales because they relate immeasurable intracellular metabolic reaction rates (fluxes) to observable growth rates in a linear fashion.
In this paper, we use genome-scale stoichiometric metabolic models to address the question of how growth rate distributions observed in microfluidic single-cell experiments performed under steady-state conditions inform our understanding of the variability of single-cell metabolic fluxes (cf. Figure 1). As devised by De Martino and De Martino [15], the maximum entropy (MaxEnt) principle acts as a guide to construct a probability distribution that encodes those metabolic flux constellations that are consistent with data (growth rate distributions) derived from single-cell experiments. This probability distribution of metabolic flux constellations is hitherto called metabolic flux map distribution, which is a complex multivariate non-normal probability distribution ensuing from stoichiometry-imposed mass balances as well as physiological flux boundaries. MaxEnt-derived metabolic flux map distributions therefore give insights into the possible spectrum of intracellular metabolic fluxes, representing the variability observed in microfluidic single-cell experiments. We compare these metabolic flux map distributions with the flux map derived using the prominent flux balance analysis (FBA) approach [16], which predicts the metabolic flux map of an “average cell” that is assumed to grow at maximum speed.
We use the MaxEnt framework to provide insight into the metabolism of C. glutamicum, an important biotechnological platform organism (cf. Figure 1). C. glutamicum is well-known for its ability to utilize a wide range of carbon substrates, making it an interesting case to reveal differences in metabolic flux variability between different substrate conditions. Therefore, microfluidic single-cell experiments are performed with media supplemented with three different carbon sources. Each carbon source fuels a different part of the central carbon metabolism of C. glutamicum, thereby requiring the core metabolic pathway fluxes to operate differently. We use the marginal MaxEnt flux map distributions to highlight those fluxes of the core metabolism that differ the most between the studied conditions. Our analysis unmasks not only the great flexibility of the central metabolism of C. glutamicum but also enables us to quantify this variability.
The flux map distributions obtained using the MaxEnt approach reveal that the single-cell data is compatible with a wide range of fluxes. This is an advantage of our approach over FBAs when seeking to better understand the heterogeneity of intracellular metabolic processes, as the latter make statements about a hypothetical “average cell”, assuming knowledge of its cellular objective.

2. Materials and Methods

DSMZ—German Collection of Microorganisms and Cell Cultures GmbH.

2.1. Microfluidic Live-Cell Experiments

Corynebacterium glutamicum wild-type ATCC 13032 was obtained from Leibniz Institute DMSZ (German Collection of Microorganisms and Cell Cultures GmbH, Braunschweig, Germany). CGXII was used as standard mineral medium without glucose (PCA), with 27 mM D-glucose (GLC), and CGXII with 27 mM D-citrate with 5 mM CaCl2 (CIT). Cultivation of C. glutamicum microcolonies was performed in a microfluidic device accommodating a few hundred cultivation chambers, ensuring monolayer growth [17] using standard procedures [18] with constant medium infusion. Microscopic imaging was performed using an inverted epifluorescence microscope (TI-Eclipse, Nikon GmbH, Düsseldorf, Germany) for phase-contrast time-lapse imaging (15 min intervals), a Nikon Plan Apo 100 Ph3 DM Oil objective, a Nikon fluorescence excitation light source (Intensilight), digital cameras (Clara DR-3041 and Neo sCMOS, Andor Technology Plc., Belfast, United Kingdom), and an LED light source (pE-100 white, CoolLed Ltd., Andover, UK).
Recorded time-lapse image stacks were analyzed using ObiWan-Microbi [19]. In short, segmentation was performed using the Omnipose bacterial phase-contrast model [20], followed by a filtering step that removed potential cell detection artifacts with an area, width, or length outside given lower and upper bounds. The bounds were derived from usual cell shapes observed in the time lapses. The growth rate of microcolonies per growth chamber was estimated based on the temporal development of the total single-cell area, assuming an exponential growth model, and a linear regression on the log-space of the total singe-cell area was performed. Before, potential biases by lag or stationary phases were excluded by truncating the image sequences, thereby only analyzing images with at least 8 cells and stopping when more than 80% of the region of interest was covered with cell mass, and limiting effects were expected. Multiple image stacks were evaluated for each substrate condition (11 for PCA, 42 for GLC, and 33 for CIT), from which the mean ( λ ¯ meas ) values were derived.

2.2. Genome-Scale Metabolic Model

The metabolic network of C. glutamicum used for the study is an updated version of the published genome-scale model iEZ475 [21]. The updated model was previously validated for standard CGXII media with glucose under aerobic conditions. The P/O ratio, a major source of uncertainty in the C. glutamicum model containing two terminal oxidases, was experimentally determined using 13C-metabolic flux analysis [22]. The network has 582 reactions and 413 metabolites. It covers central carbon metabolism, amino acid synthesis, oxidative phosphorylation, lipid metabolism, nucleotide salvage, cofactor biosynthesis, alternate carbon metabolism, and a comprehensive biomass formation. The studied cultivation conditions, represented by three different carbon sources supplemented to the CGXII media—PCA, GLC, and CIT—were implemented in the model by adjusting the respective uptake reactions.

2.3. Constraint-Based Modeling

Under the applied experimental conditions, i.e., continuous medium supply, cell metabolism is expected to be at steady state. Mass balancing for all biochemical reactions in the genome-scale metabolic network then gives a stoichiometric equation system for the fluxes v R n : N · v = 0  [23]. Additionally, physiologically reasonable upper and lower bounds were applied for all fluxes ( v i min < v i < v i max ) so that the achievable growth rates for each substrate condition match the observations. Together, this system of (in)equality constraints limits the feasible flux space to a bounded convex polytope P  [24]. Depending on the supplied carbon source, the flux polytopes have dimensions between 79 and 81. Using the model, FBA-based metabolic fluxes were obtained using the maximize growth objective [16], which assumes that the cells have evolved towards maximizing their biomass production. These calculations were performed with COBRApy version 0.29 [25].

Wasserstein Distance

To quantify the difference between flux map distributions between the applied substrate conditions, we used the Wasserstein distance [26]. Intuitively, the Wasserstein-1 distance can be seen as a way of transporting a hill of sand with distribution μ to another hill of sand with distribution ν . Here, the transport cost of one unit mass from x to y is described by | x y | . More precisely, for a set of densities Π ( μ , ν ) with marginal densities μ and ν , the Wasserstein-1 distance is defined by
W ( μ , ν ) : = inf π Π ( μ , ν ) | x y | d π ( x , y ) .

3. Results

3.1. Maximum Entropy-Based Metabolic Flux Analysis

Inferring unknown model parameters from data equates to determining a probability distribution compatible with the model formulation and data. More often than not, however, the given information is insufficient to uniquely determine a probability distribution. In contrast to side-stepping the lack of uniqueness by imposing additional assumptions, the statistical MaxEnt principle constructs the least-biased probability distribution that is compatible with available information [27]. The principle states that, among the compatible probability distributions, the distribution with the largest entropy, the so-called MaxEnt distribution, should be selected.
In our study, we aim to identify the MaxEnt-based metabolic flux map probability distribution p ( v ) out of all possible flux maps, compatible with a model-imposed convex polytope P , as well as a measured mean growth rate λ ¯ meas . Mathematically, these requirements are formalized as follows:
P p ( v ) d v = 1 and λ ¯ meas = E p ( λ ( v ) )
where E p ( λ ( v ) ) is the expected value of the growth rates obtained from the model λ ( v ) for v p ( v ) . Given the constraints in Equation (2), the Boltzmann distribution
p β ( v ) = exp β · λ ( v ) P exp β · λ ( v ) d v v P 0 otherwise
has maximum entropy [15]. Herein, the parameter β R is estimated for a given model and observed growth rate such that Equation (2) holds. Finding β therefore amounts to root-finding an integral equation [15]. Because the convex polytopes P arising from realistic metabolic networks are high-dimensional, the integral equation cannot be solved analytically but needs to be estimated numerically.

3.2. Numerical Results

We estimated β for each of the three growth conditions using Markov chain Monte Carlo (MCMC) integration. Specifically, we drew uniform samples from P using the convex polytope sampling software hopsy v.1.5.0 [28]. From the samples, we obtained a Monte Carlo estimate for E p ( λ ) as a function of β . Using scipy [29], we solved Equation (2) for β numerically. The numerical accuracy of the β estimates depends on the variance of the Monte Carlo estimate for E p ( λ ) . We repeatedly applied importance sampling as a variance reduction technique to refine the β estimates.
The estimated β values for each substrate are shown in Figure 2 along with the measured growth rate and uniform and Boltzmann distributions. As a result of adapting the model to the different substrate conditions (PCA, GLC, CIT), the convex polytopes are different for each condition, and the estimated β should therefore not be compared to each other directly. Instead, we compared the Boltzmann distributions to the uniform distributions (limit for β 0 ) [30]. We see that for PCA, the Boltzmann distribution is close to the uniform distribution, indicating that the measured growth rate is close to random. In the other two cases, GLC and CIT, the MaxEnt distribution has a mean that deviates distinctly from the means of the uniform distributions. Especially for CIT, the observed high mean growth rate “forces” the Boltzmann distribution away from the uniform distribution.
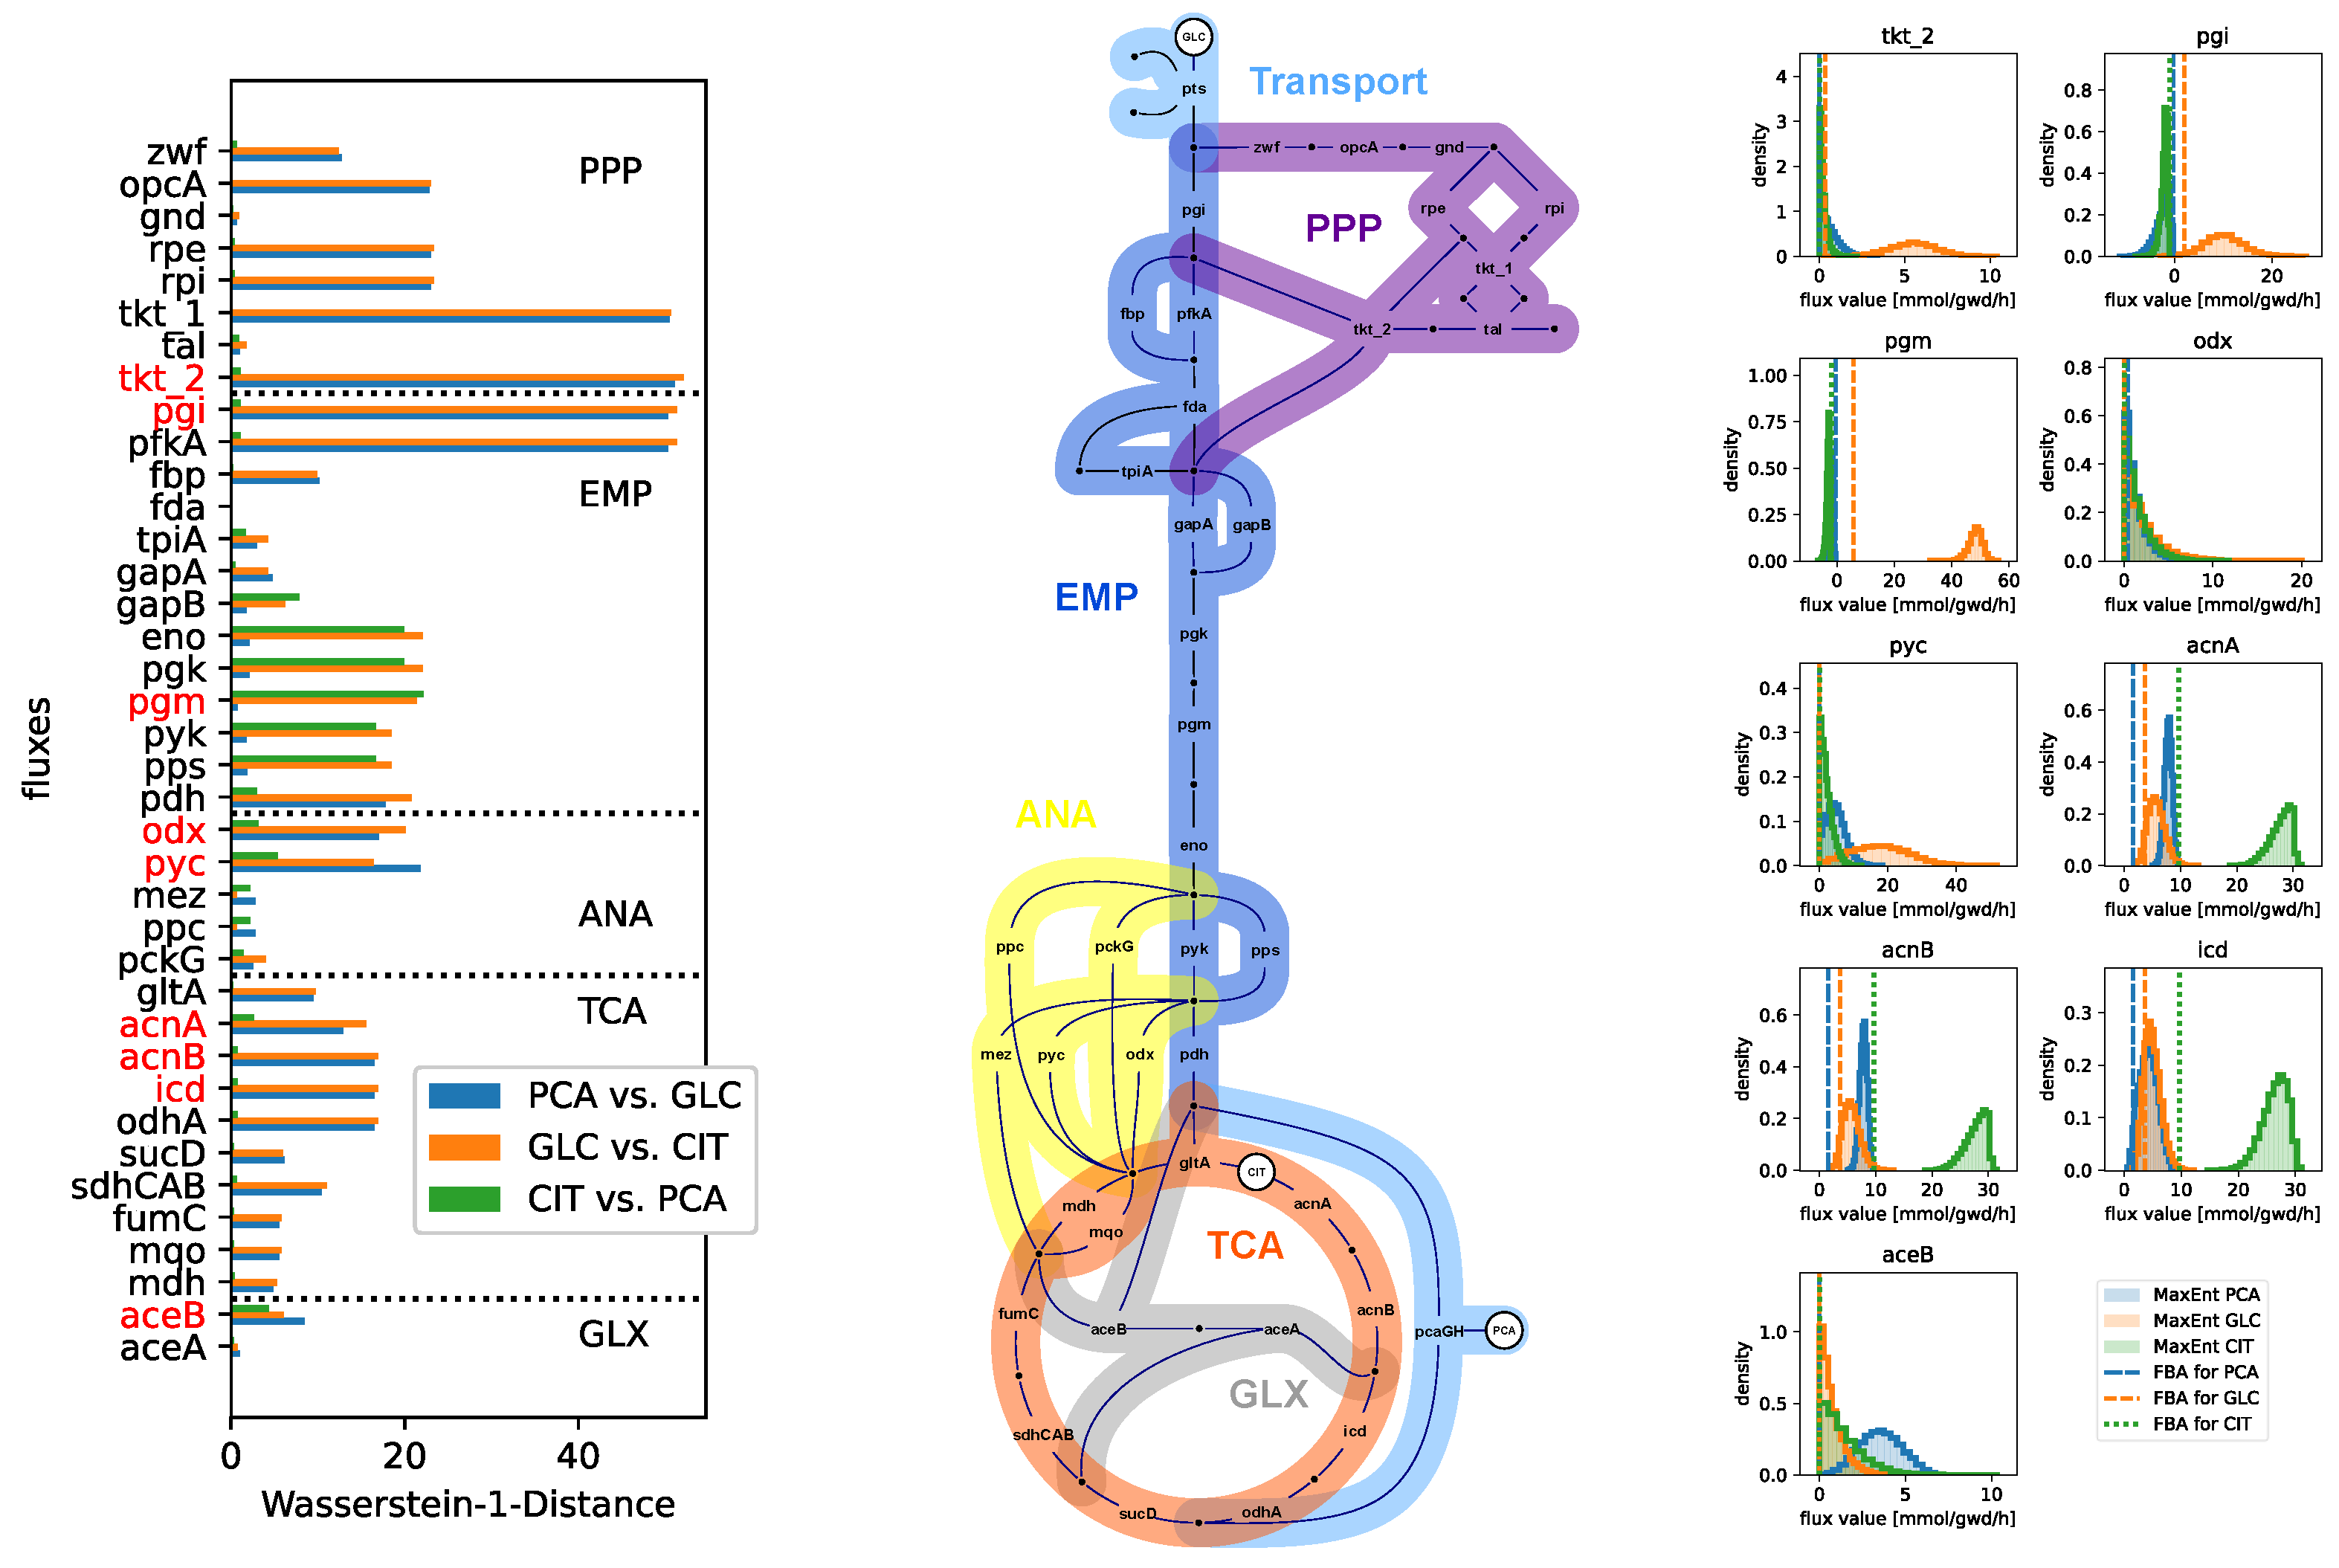
Using the estimated β values, we then computed the marginal Boltzmann distribution of the fluxes for each substrate condition. Despite the genome-scale model of C. glutamicum having over 500 reactions, to understand how the metabolism of C. glutamicum operates with different substrates, we focus our evaluation on the 40 fluxes of the central metabolism. To quantify how different MaxEnt-based metabolic flux map distributions are between two for the substrate conditions, we use the Wasserstein-1 metric [29] to compute the pairwise distances between their marginal distributions. For each flux, there are three Wasserstein-1 distances, one for each pairwise combination of the three conditions.
Figure 3 shows the Wasserstein-1 distances, along with an overview of the central metabolism of C. glutamicum. In addition, for each central pathway (Embden Meyerhof pathway—EMP, pentose phosphate pathway—PPP, Anaplerosis—ANA, tricarboxylic acid cycle—TCA, and glyoxylate shunt—GLX), the marginal flux map distributions that have the largest Wasserstein-1 distance for every pairwise substrate combination are shown. To highlight the benefits of the MaxEnt approach, we also compare the MaxEnt results to FBA, cf. Section 2.3. While FBA finds a flux map compatible with the data under the applied assumption, this flux map is only a single solution. The MaxEnt approach, on the other hand, guarantees covering all solutions that are compatible with the given information. For some fluxes, i.e., transketolase—tkt_2, malate synthase—aceB, and pyruvate carboxylase—pyc, the FBA solutions are identical, regardless of the substrate condition tested. Here, the MaxEnt approach uncovers that the set of fluxes compatible with the given datasets differ.

4. Conclusions

We evaluated a novel single-data set of C. glutamicum growing under three different substrate conditions using the MaxEnt approach. The MaxEnt principle guided us in constructing the metabolic flux map distributions that are compatible with growth rates observed from single-cell experiments. We highlighted that the MaxEnt-based metabolic flux map distributions reveal that all fluxes are consistent with the available biological information. We used the MaxEnt-based distributions to uncover the variability of the central metabolism of C. glutamicum within, as well as across, different substrate conditions. Comparing the outcome of an FBA (a single flux map) with that of the MaxEnt-based approach demonstrates the added value of the latter in providing insights into the relationship between phenotypic variability and the variability of intracellular metabolic fluxes.

Author Contributions

Conceptualization, J.F.J. and K.N.; methodology, C.S.H., J.F.J. and E.Z.; software, C.S.H., J.S. and J.F.J.; validation, J.F.J.; formal analysis, C.S.H., J.F.J. and E.Z.; investigation, J.S. and J.F.J.; resources, J.S., J.F.J. and K.N.; data curation, J.S. and J.F.J.; writing—original draft preparation, C.S.H., J.F.J. and K.N.; writing—review and editing, C.S.H., J.S., J.F.J., E.Z. and K.N.; visualization, E.Z. and J.F.J.; supervision, K.N.; project administration, J.F.J.; funding acquisition, K.N. All authors have read and agreed to the published version of the manuscript.

Funding

C.S.H. was funded by the Deutsche Forschungsgemeinschaft (DFG, German Research Foundation)—Project-ID 499552394—SFB Small Data. J.S. was supported by the President’s Initiative and Networking Funds of the Helmholtz Association of German Research Centres [EMSIG ZT-I-PF-04-44] and performed the work as part of the Helmholtz School for Data Science in Life, Earth and Energy (HDS-LEE) and received funding from the Helmholtz Association of German Research Centres. J.F.J. acknowledges financial support by the project ‘Integrated Early Warning System for Local Recognition, Prevention, and Control for Epidemic Outbreaks’ (LOKI), which is funded by the Initiative and Networking Fund of the Helmholtz Association (grant agreement number KA1-Co-08). C.S.H. thanks Peter Pfaffelhuber for his continuous and strong support. The authors thank Johanna Heinrich for performing live-cell experiments, Alexander Grünberger for supervision of the experiments and inspiring discussions, Martin Beyß for visualization advice, as well as Wolfgang Wiechert for continuous support.

Institutional Review Board Statement

Not applicable.

Informed Consent Statement

Not applicable.

Data Availability Statement

The SBML models files, a Jupyter notebook for configuring the studied media compositions, the Jupyter notebook for growth rate estimation from single-cell data, and Python3 code used for the MaxEnt workflow are publicly available at in the GitHub repository https://github.com/JuBiotech/Supplement_to_Heinzel_et_al._MaxEnt_2024.

Conflicts of Interest

The authors declare no conflicts of interest. The founders had no role in the design of the study; in the collection, analyses, or interpretation of data; in the writing of the manuscript; or in the decision to publish the results.

Abbreviations

The following abbreviations are used in this manuscript:
FBAFlux Balance Analysis
MaxEntMaximum Entropy

References

  1. Gurdo, N.; Volke, D.C.; McCloskey, D.; Nikel, P.I. Automating the design-build-test-learn cycle towards next-generation bacterial cell factories. New Biotechnol. 2023, 74, 1–15. [Google Scholar] [CrossRef]
  2. de Witt, J.; Luthe, T.; Wiechert, J.; Jensen, K.; Polen, T.; Wirtz, A.; Thies, S.; Frunzke, J.; Wynands, B.; Wierckx, N. Upcycling of polyamides through chemical hydrolysis and engineered Pseudomonas putida. Nat. Microbiol. 2025, 10, 667–680. [Google Scholar] [CrossRef] [PubMed]
  3. Takors, R. Scale-up of microbial processes: Impacts, tools and open questions. J. Biotechnol. 2012, 160, 3–9. [Google Scholar] [CrossRef] [PubMed]
  4. Delvigne, F.; Zune, Q.; Lara, A.R.; Al-Soud, W.; Sørensen, S.J. Metabolic variability in bioprocessing: Implications of microbial phenotypic heterogeneity. Trends Biotechnol. 2014, 32, 608–616. [Google Scholar] [CrossRef]
  5. Mustafi, N.; Grünberger, A.; Mahr, R.; Helfrich, S.; Nöh, K.; Blombach, B.; Kohlheyer, D.; Frunzke, J. Application of a genetically encoded biosensor for live cell imaging of L-valine production in pyruvate dehydrogenase complex-deficient Corynebacterium glutamicum strains. PLoS ONE 2014, 9, e85731. [Google Scholar] [CrossRef]
  6. Elowitz, M.B.; Levine, A.J.; Siggia, E.D.; Swain, P.S. Stochastic gene expression in a single cell. Science 2002, 297, 1183–1186. [Google Scholar] [CrossRef]
  7. Kiviet, D.J.; Nghe, P.; Walker, N.; Boulineau, S.; Sunderlikova, V.; Tans, S.J. Stochasticity of metabolism and growth at the single-cell level. Nature 2014, 514, 376–379. [Google Scholar] [CrossRef] [PubMed]
  8. Schirmer, M.; Dusny, C. Microbial single-cell mass spectrometry: Status, challenges, and prospects. Curr. Opin. Biotechnol. 2023, 83, 102977. [Google Scholar] [CrossRef]
  9. Thomas, P.; Terradot, G.; Danos, V.; Weiße, A.Y. Sources, propagation and consequences of stochasticity in cellular growth. Nat. Commun. 2018, 9, 4528. [Google Scholar] [CrossRef]
  10. Tonn, M.K.; Thomas, P.; Barahona, M.; Oyarzún, D.A. Stochastic modelling reveals mechanisms of metabolic heterogeneity. Commun. Biol. 2019, 2, 108. [Google Scholar] [CrossRef]
  11. Bijman, E.Y.; Kaltenbach, H.M.; Stelling, J. Experimental analysis and modeling of single-cell time-course data. Curr. Opin. Syst. Biol. 2021, 28, 100359. [Google Scholar] [CrossRef]
  12. Tourigny, D.S.; Goldberg, A.P.; Karr, J.R. Simulating single-cell metabolism using a stochastic flux-balance analysis algorithm. Biophys. J. 2021, 120, 5231–5242. [Google Scholar] [CrossRef] [PubMed]
  13. Pleyer, J.; Fleck, C. Agent-based models in cellular systems. Front. Phys. 2023, 10, 968409. [Google Scholar] [CrossRef]
  14. Narayanankutty, K.; Pereiro-Morejon, J.A.; Ferrero, A.; Onesto, V.; Forciniti, S.; del Mercato, L.L.; Mulet, R.; De Martino, A.; Tourigny, D.S.; De Martino, D. Metabolic coordination and phase transitions in spatially distributed multi-cellular systems. Commun. Phys. 2025, 8, 205. [Google Scholar] [CrossRef]
  15. De Martino, A.; De Martino, D. An introduction to the maximum entropy approach and its application to inference problems in biology. Heliyon 2018, 4, e00596. [Google Scholar] [CrossRef]
  16. Orth, J.D.; Thiele, I.; Palsson, B.Ø. What is flux balance analysis? Nat. Biotechnol. 2010, 28, 245–248. [Google Scholar] [CrossRef]
  17. Grünberger, A.; Paczia, N.; Probst, C.; Schendzielorz, G.; Eggeling, L.; Noack, S.; Wiechert, W.; Kohlheyer, D. A disposable picolitre bioreactor for cultivation and investigation of industrially relevant bacteria on the single cell level. Lab Chip 2012, 12, 2060–2068. [Google Scholar] [CrossRef]
  18. Grünberger, A.; Probst, C.; Helfrich, S.; Nanda, A.; Stute, B.; Wiechert, W.; von Lieres, E.; Nöh, K.; Frunzke, J.; Kohlheyer, D. Spatiotemporal microbial single-cell analysis using a high-throughput microfluidics cultivation platform. Cytom. Part A 2015, 87, 1101–1115. [Google Scholar] [CrossRef]
  19. Seiffarth, J.; Scherr, T.; Wollenhaupt, B.; Neumann, O.; Scharr, H.; Kohlheyer, D.; Mikut, R.; Nöh, K. ObiWan-Microbi: OMERO-based integrated workflow for annotating microbes in the cloud. SoftwareX 2024, 26, 101638. [Google Scholar] [CrossRef]
  20. Cutler, K.J.; Stringer, C.; Lo, T.W.; Rappez, L.; Stroustrup, N.; Brook Peterson, S.; Wiggins, P.A.; Mougous, J.D. Omnipose: A high-precision morphology-independent solution for bacterial cell segmentation. Nat. Methods 2022, 19, 1438–1448. [Google Scholar] [CrossRef] [PubMed]
  21. Zelle, E.; Nöh, K.; Wiechert, W. Growth and production capabilities of Corynebacterium glutamicum: Interrogating a genome-scale metabolic network model. In Corynebacterium glutamicum: From Systems Biology to Biotechnological Applications; Burkovski, A., Ed.; Caister Academic Press: Poole, UK, 2015; Chapter 4; p. 190. [Google Scholar] [CrossRef]
  22. Zelle, E.; Pfelzer, N.; Oldiges, M.; Koch-Koerfges, A.; Bott, M.; Nöh, K.; Wiechert, W. An energetic profile of Corynebacterium glutamicum underpinned by measured biomass yield on ATP. Metab. Eng. 2021, 65, 66–78. [Google Scholar] [CrossRef]
  23. Maarleveld, T.R.; Khandelwal, R.A.; Olivier, B.G.; Teusink, B.; Bruggeman, F.J. Basic concepts and principles of stoichiometric modeling of metabolic networks. Biotechnol. J. 2013, 8, 997–1008. [Google Scholar] [CrossRef]
  24. Jadebeck, J.; Wiechert, W.; Nöh, K. Practical sampling of constraint-based models: Optimized thinning boosts CHRR performance. PLoS Comput. Biol. 2023, 19, e1011378. [Google Scholar] [CrossRef]
  25. Ebrahim, A.; Lerman, J.; Palsson, B.Ø.; Hyduke, D. COBRApy: COnstraints-Based Reconstruction and Analysis for Python. BMC Syst. Biol. 2013, 7, 74. [Google Scholar] [CrossRef]
  26. Villani, C. Optimal Transport: Old and New; Springer: Berlin/Heidelberg, Germany, 2009; Volume 338. [Google Scholar]
  27. Jaynes, E.T. Information Theory and Statistical Mechanics. Phys. Rev. 1957, 106, 620–630. [Google Scholar] [CrossRef]
  28. Paul, R.; Jadebeck, J.; Stratmann, A.; Wiechert, W.; Nöh, K. hopsy—A methods marketplace for convex polytope sampling in Python. Bioinformatics 2024, 40, btae430. [Google Scholar] [CrossRef] [PubMed]
  29. Virtanen, P.; Gommers, R.; Oliphant, T.E.; Haberland, M.; Reddy, T.; Cournapeau, D.; Burovski, E.; Peterson, P.; Weckesser, W.; Bright, J.; et al. SciPy 1.0: Fundamental Algorithms for scientific computing in Python. Nat. Methods 2020, 17, 261–272. [Google Scholar] [CrossRef] [PubMed]
  30. De Martino, D.; Mc Andersson, A.; Bergmiller, T.; Guet, C.C.; Tkačik, G. Statistical mechanics for metabolic networks during steady state growth. Nat. Commun. 2018, 9, 2988. [Google Scholar] [CrossRef]
  31. Vehtari, A.; Gelman, A.; Simpson, D.; Carpenter, B.; Bürkner, P.C. Rank-Normalization, folding, and localization: An improved R ^ for assessing convergence of MCMC. Bayesian Anal. 2021, 16, 667–718. [Google Scholar] [CrossRef]
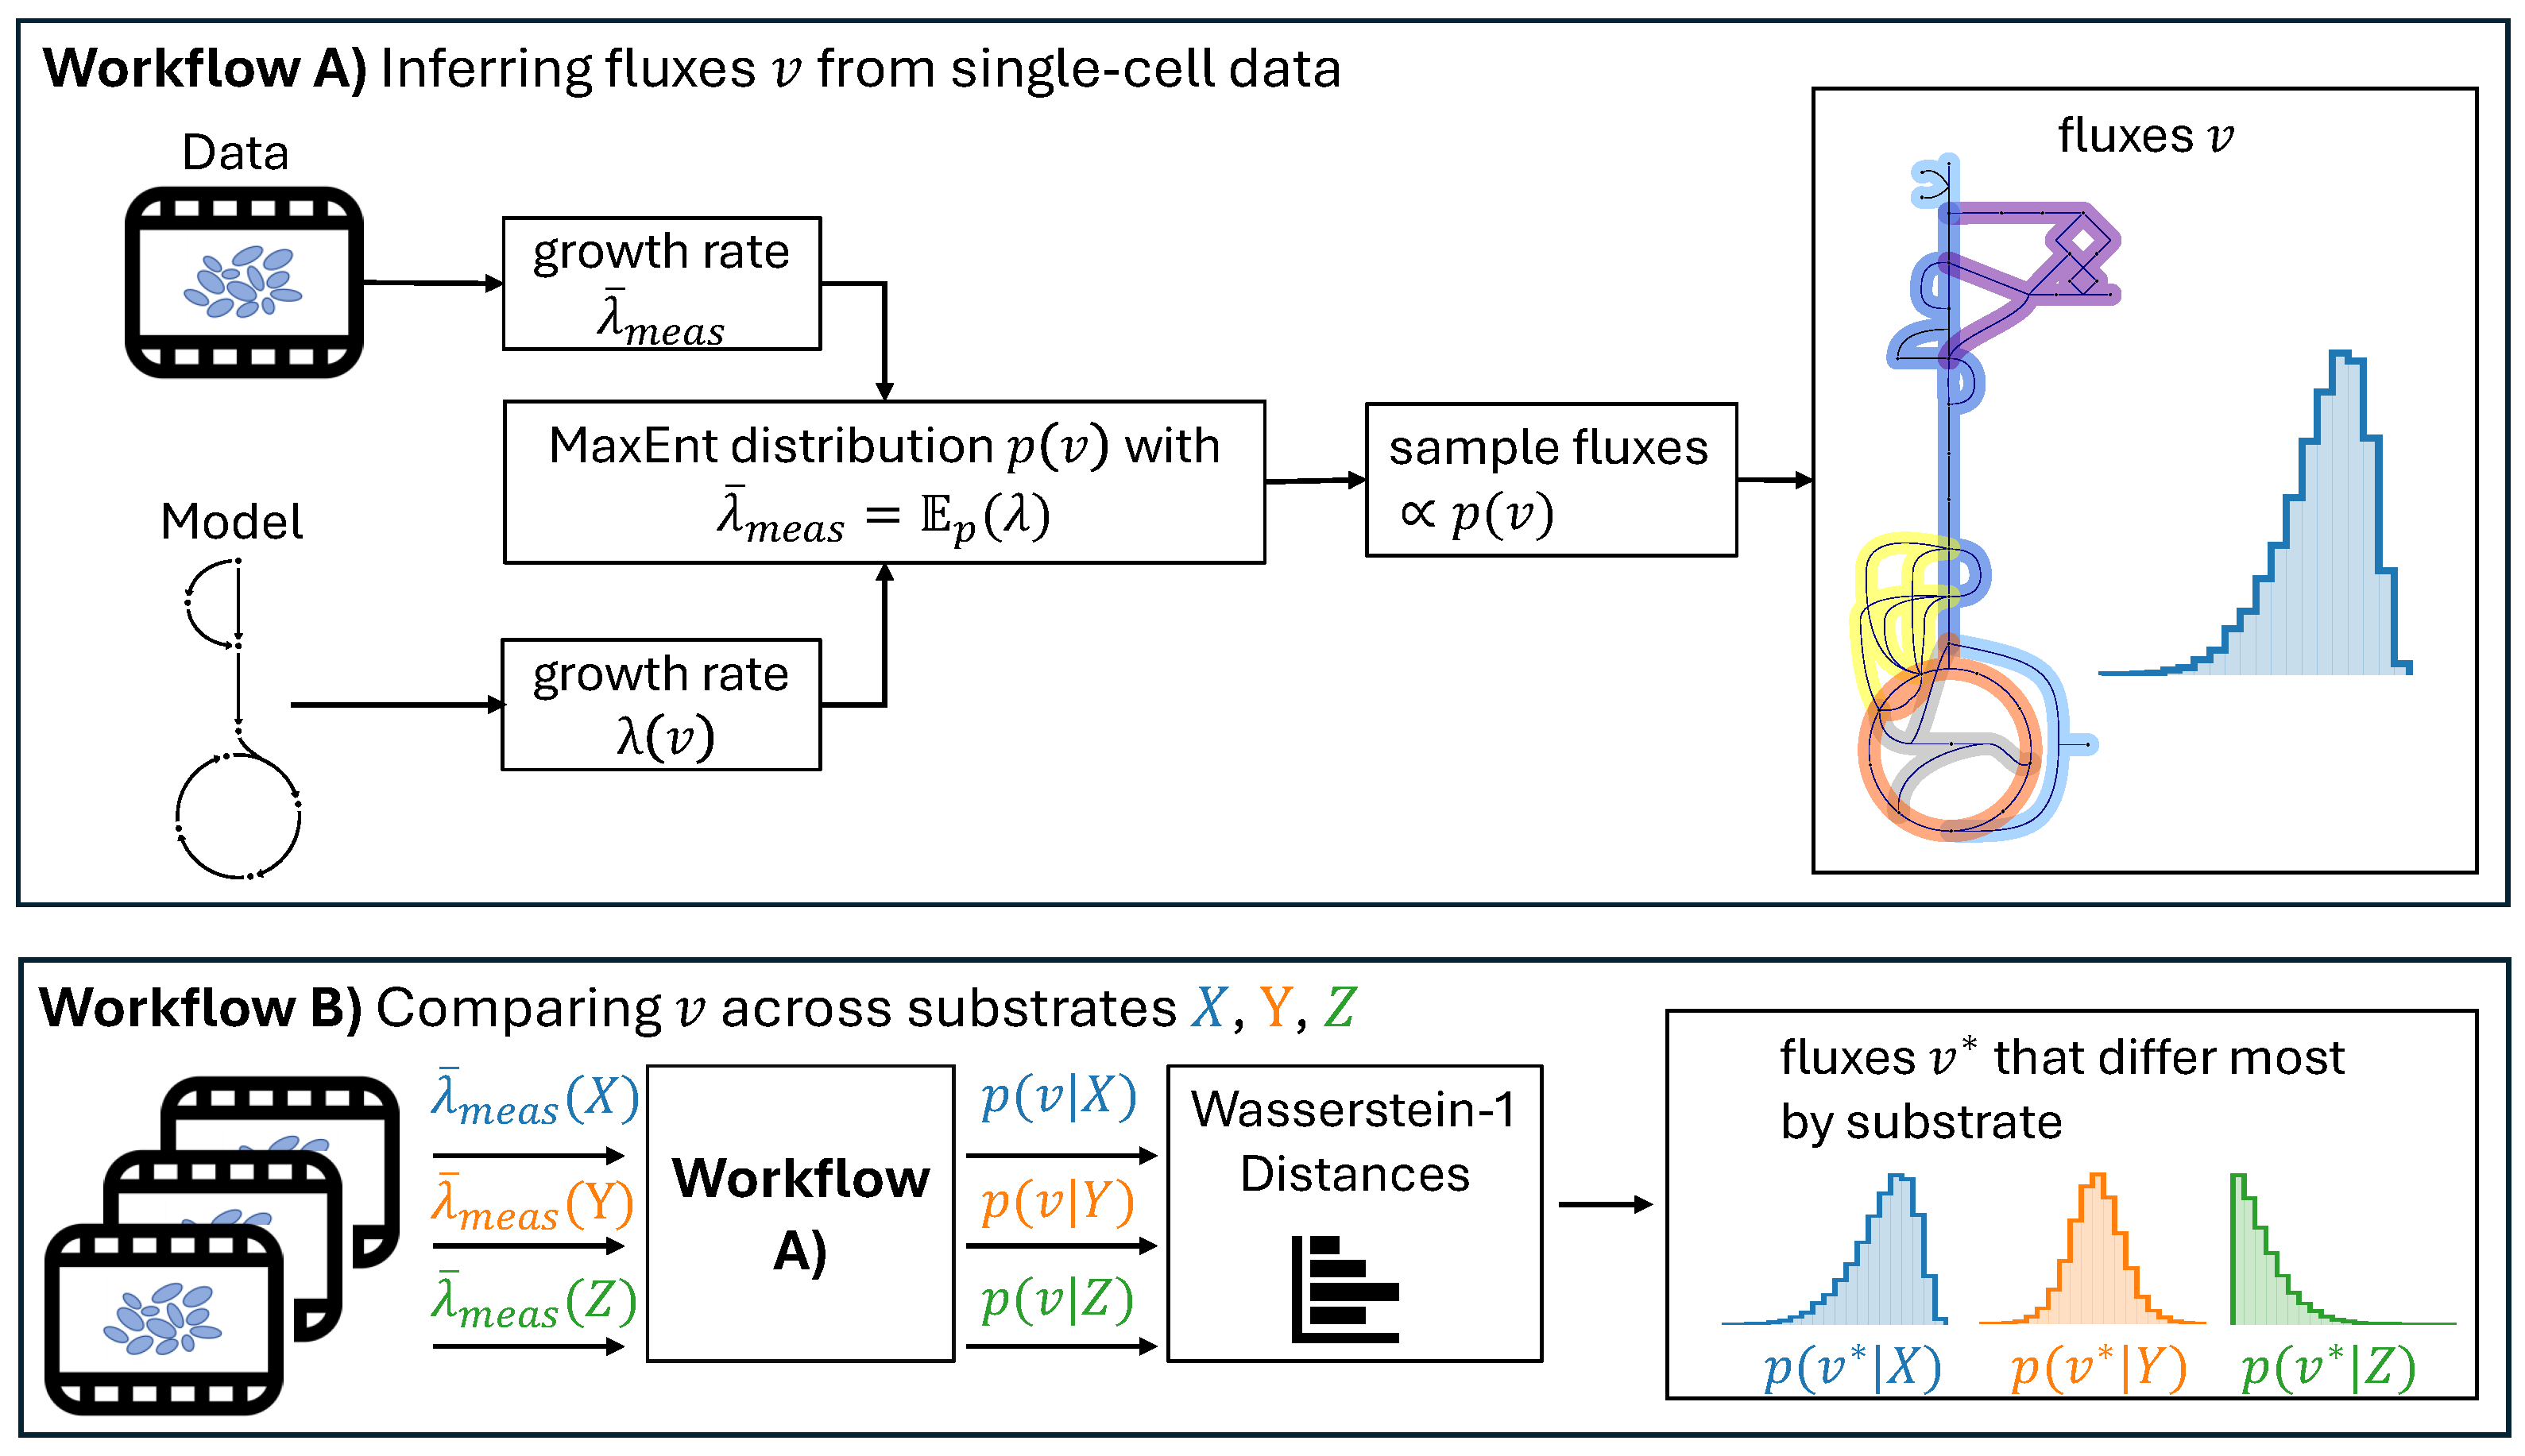
Figure 1. Overview of the MaxEnt workflow for analyzing single-cell data of C. glutamicum. (A) MaxEnt-based flux map distribution for one substrate condition. (B) Comparison of flux map distributions for different substrate conditions.
Psf 12 00003 g001
Figure 2. Marginal Boltzmann distributions fitted to the measured growth rates λ ¯ meas (blue). The measured (green) and marginal uniform (orange) distributions, as well as the estimated β and means of each distribution, are shown. Four parallel Markov chains were used to generate 1.4 × 10 6 samples for each of the Boltzmann distributions. The effective sample sizes were over 500, and all rank-normalized r ^ values were below 1.01 in each case [31].
Psf 12 00003 g002
Figure 3. Selection of metabolic fluxes from the central metabolism of C. glutamicum. We use the Wasserstein-1 metric to compute the distances between marginal MaxEnt-based flux map distributions for each pairwise combination of substrate condition tested. For every pair of substrate conditions, the highest Wasserstein-1 distance in each pathway is used as a selection criterion for which fluxes are shown (red reactions). We show the marginal MaxEnt-based metabolic flux map distributions along with the FBA point estimates. In some cases, e.g., isocitrate dehydrogenase—icd, the FBA solution for citrate (CIT) is located in a low-density region of the marginal MaxEnt distribution.
Psf 12 00003 g003
Disclaimer/Publisher’s Note: The statements, opinions and data contained in all publications are solely those of the individual author(s) and contributor(s) and not of MDPI and/or the editor(s). MDPI and/or the editor(s) disclaim responsibility for any injury to people or property resulting from any ideas, methods, instructions or products referred to in the content.