Abstract
Chronic pain changes brain connectivity, brainwaves, and volume, often resulting in disability, anxiety, and depression. Opioid pain relievers impair function, with risk of addiction. Music analgesia research suggests that music for long-term analgesia includes slow tempo, pleasantness, and self-choice. Hypothesis: individuals listening to self-chosen music with embedded beats ½ h twice a day, could show brainwave entrainment (BWE) at healthy frequencies of healthy descending pain modulatory system. BWE may change brain activity, restoring organization in DPMS altered by chronic pain. Volunteers with chronic pain >1 year participated in a study of 4 weeks of listening to one half hour of music twice a day, and four weeks of non-listening, reporting pain and analgesic use bi-weekly using visual analog scale (VAS) and 0–10 numerical pain scores (NPS), medication types, and dosage. Volunteers selected from 27 half-hour pieces of music in several genres in a mobile app. Isochronic beats were embedded in the music with tempo, key, and isochronic theta frequencies proportional, to enhance the brain’s perception of rhythmic patterns and harmonics. Mean NPS showed a 26% reduction (p = 0.018). Significantly, mean medication dosage declined by over 60% (p = 0.008). Double-blind studies, larger populations are needed in future.
1. Introduction
In a World Health Organization study in 1998 in Asia, Africa, Europe, and the Americas [1], an average of 20% reported persistent pain of greater than 6 months duration showing chronic pain as a worldwide phenomenon, affecting at least tens of millions worldwide; some researchers estimate that 10% or more of Americans experience chronic pain [2].
Chronic pain has been shown to change the brain on many levels, from changing the connectivity of brain areas [3] to reducing the volume of the dorsolateral prefrontal cortex (dlPFC) and thalamus [4]. Chronic pain may result in disability; it directs thoughts toward anxiety and depression [5] at great cost to quality of life. Opioid pain relievers are often effective, but come with downsides of impaired function and the potential for addiction.
Music analgesia is a complex process engaging many areas of the brain. Christoph Ritter et al., 2014 [6] suggests that music’s analgesic effect takes place in the descending pain modulatory system (DPMS), which in addition to brainstem, insula, and thalamus, includes the medial prefrontal cortex (mPFC), anterior cingulate cortex (ACC), and the dorsolateral prefrontal cortex (dlPFC) [7], where pain signals are inhibited as they return to the tissues, bringing relief in varying degrees. Chronic pain is seen to disturb the inhibition of pain signals. This may be due to reduction in volume of the dlPFC [5] and the disorganization of its neural activity in chronic pain; deficits in brain function due to chronic pain are associated with a disturbance of the default mode network (DMN) by sustained pain [8].
In chronic pain, the mPFC, which is identified with decision response to heightened emotions and choices around risk and reward, including planning for painful episodes, shows more neuronal synchrony, and at higher peak power, than in normal conditions. At the same time, the dlPFC, a moderator of the DPMS, is less active, showing more asynchronous neural firing, which correlates with its theorized reduced ability to inhibit descending pain signals. In addition, the dlPFC’s activity is generally inversely proportional to that of the mPFC, suggesting that the mPFC and dlPFC may mutually regulate each other’s inhibition/disinhibition of activity [2].
1.1. Brainwave Entrainment
A feature of the present music design was to add brainwave frequencies in the form of isochronic tones pulsing in rhythms proportional to the frequencies of the musical key (see Table 1). Isochronic or isochronous tones are monaural, where the same tone-beat is presented to each ear, and are easier to embed in music than binaural beats. We hypothesized that music as a bed or matrix for beats could amplify brainwave entrainment (BWE) using the frequency-following response (FFR) to external rhythmic audio stimulation in the 6–7 Hz theta range. Frequencies of 6–7 Hz approximates a normal range for the mPFC, ACC, and dlPFC [9] (see Table 2). The ACC is a center of affective emotional response to pain [10]. The mPFC shows more neural activity and synchrony in chronic pain. BWE to theta frequencies may lower the peak power of brainwave oscillations toward a healthy frequency [6,11,12,13]. The dlPFC in chronic pain is less organized with more asynchronous neuronal activity, and entrainment to music may induce its activity to become more synchronized.

Table 1.
Keys of music, isochronic frequencies, and subharmonic ratios to the root.
Table 2.
Brain structures in DPMS and their responses in CBP and FM.
The mPFC [3,4,14,15], dlPFC [8], and ACC [3,15] show involvement in the processing of chronic back pain (CBP), fibromyalgia (FM), and rheumatoid arthritis (RA), as well as radicular neuropathy due to bone metastases in cancer [16], making these our areas of interest for BWE.
Rhythms and pulsed sounds create auditory-evoked potentials (AEP) in neurons, as well as a frequency-following response (FFR), showing changes to EEG patterns during the audio stimulus. The auditory cortex identifies beats and rhythms [17], and passes this to many areas of the brain, including the primary and secondary motor cortices [18], which entrain movement to the music, i.e., “grooving to the music.” The efficacy of music to stimulate many brain areas was the reason we chose to embed beats in music for long-term therapeutic effect.
1.2. Basis for Study Design
The present study was designed on these demonstrated phenomena:
- Entrainment of brainwaves (BWE) to external sounds is possible via AEP [11].
- Brainwaves, which are a result of brain activity, can be modified by external rhythmic stimulation to approximate the external rhythms [18].
- Brain activity may change with BWE [8].
- Adding low tones to music improves the brain’s ability to track beats [19].
- The brain can identify harmonics in brainwave activity where they are proportional to currently active brainwave frequencies [13,18].
- The brain can determine a root frequency from its harmonics [20].
- Self-chosen music shows greater efficacy in relieving pain [21,22] than researcher-selected music.
- Music is effective in providing relief from chronic pain [21,23].
While our music was designed for BWE, the absence of EEG recording in this study did not allow us to verify our BWE hypotheses.
2. Materials and Methods
2.1. Isochronic Beats
Binaural beats have been the subject of a great deal of research [25,26], but differences in outcomes using binaural beats and isochronic beats have been little studied. Research in frequency-following response to rhythmic stimuli often uses isochronic beats, as sounds or clicks [11,12,17], and their use in this realm indicates potential for effectiveness in BWE [27]. Rather than clicks, the music in this study uses smoother pulses, with more harmonic integration with the music than clicks, due to the continuous tone (Figure 1). Isochronous or isochronic tones are monaural, the same tone-beat presented to each ear. They are not only beats, but musical tones, as distinct from tones in binaural beats, which are selected only for their ability to generate binaural beats.
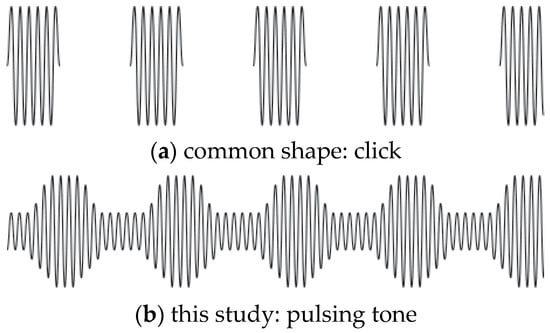
Figure 1.
Two isochronic tone shapes, both of the same note frequency. (a) is click-like, alternating tone and silence. (b) with a continuous tone at an octave of the root note (key) of the music, pulsing in amplitude at a given frequency, is less obtrusive, yet the pulse is clearly audible. The present study used pulses as in (b).
Entrainment response to tones or beats may include response to harmonics of the provided beat [18], and in the case of tones implying a portion of a musical pattern, the brain may provide a response at the missing fundamental or root tone [20]. In addition, the presence of low tones, as in the bass in dance music, has been shown to improve neural tracking of musical beats [19].
The efficacy of music to relieve pain, including chronic pain, has been well-demonstrated [21,22,23], but how long the analgesic effect can last beyond the cessation of the music is unclear.
2.2. Characteristics of Music for Chronic Pain
A review by Garza-Villarreal et al. [21] derived characteristics of the music that provided the best overall outcomes in the studies. Music that was pleasant, with few beats per minute, and was self-chosen, was preferred, with familiarity of music as a noticeable but non-statistically significant additional factor. Howlin and Rooney [22] showed chronic pain patients with unlimited choice (Spotify) selecting high-energy music with lyrics for dealing with chronic pain, but the conditions of such selection are not clear. The present study design investigates BWE beginning from relaxation in eyes-open default mode, for 30 min at a time, making high-energy music potentially impractical. However, this option should be investigated in future work. Music was shown to have a moderate to strong effect on anxiety and depression, which are common comorbidities with chronic pain. The authors concluded that listening to music as little as 20 min a day could be effective in pain relief. Others have reviewed literature [23] and concluded that familiarity of self-chosen music provides a sense of control that reduces anxiety and perception of pain.
While self-chosen music has been shown to have greater efficacy in relieving pain [21,22,23], conditions did not allow us to add brainwave beats to music pre-selected by volunteers. Instead, selected pieces comprised pleasant, non-dramatic music by well-known classical composers and popular artists, as well as New Age music. If 20 min a day could result in music analgesia, we hypothesized that developing a habit of longer listening times may have longer-term effects, as long as the listening was pleasant enough to engage subjects. We created a mobile app serving 28 half-hour pieces of music (range 25–32 min), with a menu with samples to aid choice. We considered that the quantity of choices may have preserved some of the sense of agency and control that self-chosen music provides, but a larger pool of music would be desirable in future studies.
Duration of pain relief beyond listening time is not addressed in any of the previous studies [21]. The present study was designed with four weeks of regular listening, followed by four weeks of not listening to music, to determine how long music analgesia would persist after cessation of listening. During the study, after four weeks, non-listening caused recurrence of pain after a few days, so listening was resumed for the final four weeks.
2.3. Subject Protocols
Due to the rural Maine region in which subjects were recruited, the number of accepted applicants to the study did not support controls, making this an observational study, which we see as a pilot for future research.
Recruitment: Calls for volunteers were made through posters in the local area, a radio interview, and non-profit newsletters; applications were taken online and on paper. A total of 13 adults between age 34 and 78 applied, of which nine online and four on paper at a public event describing the study plan. The study called for volunteers with chronic pain of greater than a year’s duration, with varying etiologies of back pain. Pain due to complex fractures and back pain due to lupus and Lyme disease were accepted. Disqualifying comorbidities for the study (epilepsy, current treatment for substance use, and diagnosed mental illness) were clearly stated in both paper and online applications and in the presentation. A total of 12 applicants were accepted. One male withdrew after the study began, one female provided insufficient data responses, and one male’s data was disqualified due to an injury during the study, leaving a pool of nine volunteers. After receiving an explanation of the requirements of the study, all volunteers provided written informed consent, and the study design was reviewed with the SongRest Advisory Board.
A web-based mobile-enabled app was developed for this study. The app screen view shown in Figure 2 shows a list of selections made by a volunteer. Providing music only through the app allowed dynamic delivery of music, and tracked the exact times and durations each volunteer spent streaming each piece of music. Two volunteers who lived off the grid received CDs of their chosen music, for which time-tracking was not available.
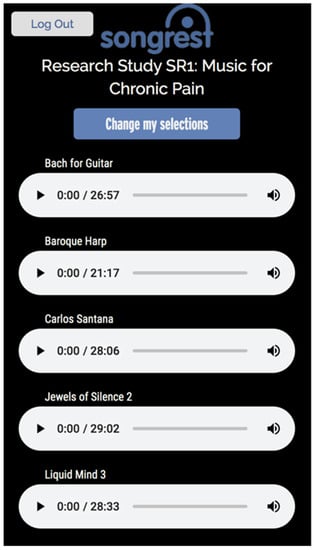
Figure 2.
App screen.
Research that involves self-directed music listening suffers from potential inaccuracies arising from self-reporting of duration of listening. The app made an important contribution to this research with the ability to track listening in real time, providing precise quantitative data.
Volunteers were not apprised of the time-tracking feature, as this knowledge might have interfered with individual motivations.
The protocol for volunteers was to stop all activities, sit or lie quietly, and listen to a music selection for 30 min, twice a day, during the 28-day listening period. Stopping activity and being quiet was intended to engage the default mode network as a baseline [8]. Volunteers selected from the menu of musical selections and saved their selections. They could change selections at any time, to preserve a sense of agency. No timer was needed: volunteers listened to a piece of music to the end. The app filtered music delivery based on whether volunteers indicated they would use headphones or speakers to listen to the music. Different mixes were provided for each condition, due to differences in the dynamic range between headphones and speakers.
Volunteers were provided with a series of pre-dated paper assessments to be mailed on dates given. Pre-addressed stamped envelopes assured that there were no barriers to reporting. Reports included current pain at time of report, using a 10 cm visual analog scale (VAS) and a 0–10 numerical pain score (NPS), estimated average pain over the previous week (NPS) and the highest pain level experienced in the previous week (NPS). Finally, volunteers reported the amount of pain medication (type, quantity, and frequency) used per day or per week. Opioids and anti-seizure medication have low absolute doses compared with extra-strength NSAIDs, requiring adjustment to compare dosages. All medications were recorded in their total milligram amounts to compute milligrams per week for each medication. For some volunteers, weekly milligrams were in the thousands, where opioids were in the tens. Scaling factors allowed adjusting the numbers into a comparable trend range while preserving the proportional values in use.
A comment section provided on each report allowed volunteers to apprise researchers of any issues or give a valuation of listening for the previous period. Many of these indicated enjoyment of the music, but difficulty in getting in the second session of listening each day. This will be considered in design of future studies.
2.4. Technical Design of Music
Because brainwave frequencies fall within ranges rather than being an absolute standard for every person, integer frequencies for isochronic tones were not required. This was helpful in designing isochronic beats that are exactly proportional to the key of the music, and where needed, its tempo. Isochronic beats were formed by a carrier tone in the key of the music pulsing at a frequency equal to an exact subharmonic of the key.
The target frequency range for isochronic pulses was 6–7 Hz, a range of frequencies corresponding to healthy function of our targeted areas of the DPMS. Because binaural beats masked in a bed of white noise have shown entrainment [27], the assumption for this study was that brainwave frequencies, while barely audible in the music, could entrain the brainwaves of the mPFC/ACC/dlPFC, though we could not verify that the brainwaves affected outcomes, as EEG was not available for this study. However, the study design may be a template for future trials with EEG readings taken while listening to the long-form music.
The brainwave target frequencies are derived from the division of an exact tonal frequency of a tone in a diatonic scale based on A = 440 Hz [28], by an integer corresponding to a harmonic or subharmonic. Since BWE has been shown in brief sound experiments of 5–7 min [11,17], we hypothesized that the length of the musical selections allowed ample time for BWE. Isochronic beats, their carrier tones, and additional low tones were set as proportional to the root note of the music’s predominant key. In practice, the isochronic frequencies ranged from 6.118 Hz to 6.867 Hz, depending on the key of the music. Table 1 shows keys and frequencies of subharmonics used to create isochronic beat-tones.
For the key of C, for example, we chose the second lowest C on the piano keyboard, at 65.406 Hz. The subharmonic in our preferred range is the one-10th of the root, or 6.45406 Hz. This can be stated as:
the general form is as follows:
ftarget = 65.406 Hz × 1/10 = 6.5406 Hz.
ftarget = Key Hz × harmonic ratio.
It is not an exact formula, but requires iteration to arrive at a useful frequency. Thus, one isochronic carrier tone C is 65.406 Hz; it pulses at 6.541 Hz, proportional to the key in the ratio of 1/10. The C tone an octave lower than the carrier tone, 32.7032 Hz, near the bottom of the audible range, is added as a steady low tone.
The target frequency range of 6–7 Hz is a guide to select subharmonics that correspond with, and are proportional to, the musical tone or key of a musical selection (as in our example of the subharmonic at 1/10 the root frequency of the note C above), usually in the lower octaves. We also related the target frequency to tempo in beats per minute where appropriate. Much music does not have a fixed tempo, such as classical music or New Age ambient music, and included only tones and beats.
Commercially produced music that could be used or modified to meet the requirements for tempo and/or key was the first choice. Using professional-quality software, we edited and modified the music to add tones, detailed below.
Several areas of the brain become more or less active in common types of chronic pain (see Table 2). The three identified areas are associated in a kind of group response to chronic pain [2,14,29]. In response to chronic pain, the mPFC shows increased activity [2] with reduced volume [4]. The anterior cingulate cortex (ACC) is functionally part of the prefrontal response network to CBP [14,29]. It exhibits oscillations at two separate frequencies in two bands: 6 Hz (theta), and 10 Hz (alpha). Theta amplitude increases in the ACC with memory of approach of future events (prospective memory), and in response to chronic pain, whereas alpha is suppressed in this type of cortical activity in the ACC [30]; thus, we focused on the theta frequency.
For brain areas that are more active in chronic pain (mPFC, ACC), brainwaves that may tend to change the frequency of peak power were selected, to entrain the oscillations of the activated brain areas toward frequencies of a normal, non-chronic-pain state. For brain areas that are less active and/or less synchronous in chronic pain (dlPFC), the inverse relationship of the mPFC to dlPFC [2], coupled with entrainment to the dlPFC’s non-pain frequency, may induce the dlPFC to return to its normal activity, including modulating descending pain signals, reducing the perception of pain.
Beats were layered or embedded in music so they were barely audible to most listeners, and therefore, should not interfere with enjoyment of the music.
Music was prepared on a MacBook Pro running Mac OS High Sierra 10.13.6. Software used in preparation of music included Audacity version 2.1.3, an open-source application for music editing, with the plugin Isochronic Modulator by Steve Daulton, for creating isochronic tones with control of pulse shape and low tones, both with high accuracy in frequency. Adobe Audition CC 2019 was used to mix tracks for the final mixes. Volume automation profiles for the isochronic tone-beats and low tones in Audition followed changes in volume of the music to keep the tone-beats barely audible (Figure 3).
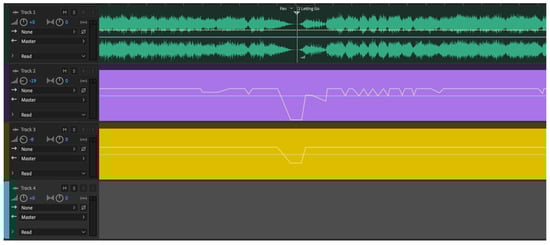
Figure 3.
Screen of Adobe Audition sound editing software.
The green sound waves are the stereo music tracks, showing the end of one section and the beginning of the next. Changes in amplitude (volume) are quite visible as the line gets wider (louder) and narrower (quieter). The purple stripe is the isochronic beat track, the height of the line following the general volume of the music. Gold shows a low tone track in the key of the music (its root), whose sound characteristics did not require it to follow the volume precisely. The colors are arbitrary in the software and have no significance.
3. Results
3.1. Pain Scores and Modification of Study Protocols
Volunteers provided pain scores in each assessment. Values reported were the current pain level at the time of report (VAS, NPS NOW), average pain over the last week (NPS Avg), and highest pain level over the last week (NPS High).
At the end of the listening period, music was no longer available. A total of 2–3 days after the end of the listening period, five volunteers communicated that their pain had returned. Four volunteers did not report pain after ceasing listening. Music availability was immediately restored for all volunteers. This may be the result of a reduction in pain medication due to music analgesia, and when music ceased, pain medication dosages were not restored to pre-study levels. This effect was not considered in study design, as no available data in previous research showed significant change in pain medication use in relation to music analgesia. Future study designs will incorporate awareness of pain medication effects in music analgesia.
3.2. Medication Use
Medication types varied widely, including benzodiazepines, anti-seizure medications for nerve pain, NSAIDs, cannabis, and herbs. Only medications measured in milligrams were considered, excluding cannabis and herbs.
3.3. Statistical Analysis
Statistical analyses were performed using IBM SPSS Statistics version 20 (SPSS Inc., Chicago, IL, USA). Different pain scores were presented as mean ± SD and median (min–max) and change over time were tested by repeated measure analysis of variation (ANOVA). Listening time and average listening sessions per day also presented as mean ± SD and median (min–max). For medication use, doses were adjusted to equivalents between 20–400 mg and Wilcoxon signed ranks test was used to compare the doses at the start and at the end of the study. In all statistical tests, a p-value < 0.05 was considered statistically significant.
Terms:
- VAS: visual analog scale score (0–10 cm) at the time of reporting.
- NPS NOW: numerical pain score (0–10) at the time of reporting.
- NPS Avg: volunteer’s approximation of average pain score over the previous week.
- NPS High: volunteer’s approximation of the highest pain score over the previous week.
- Listening times: volunteers were asked to listen for ½ h per day, twice a day.
- Medication dose: pain medication dosage and frequency reported by the volunteer.
In this pilot study, nine volunteers were included in analysis. The mean age of the volunteers was 65.6 ± 13.4; median = 69 (39–78). The following tables and figures demonstrate the main findings:
-
Table 3. Change of VAS over time.
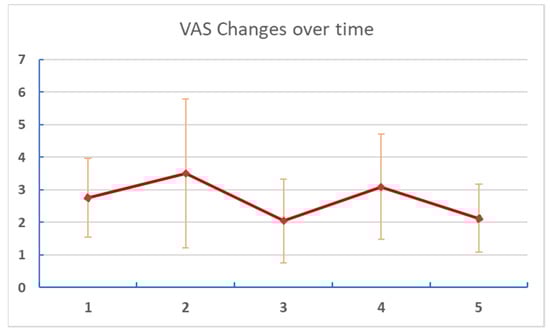 Figure 4. Changes of VAS over time. Numbers on the X axis are reports/assessments for each period in the listening and post-listening periods.
 -
Table 4. Change of NPS NOW over time.
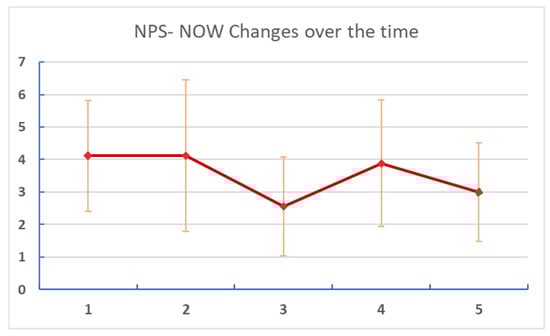 Figure 5. Changes of NPS NOW at different points of assessment. Numbers on the X axis are reports/assessments for each period in the listening and post-listening periods.
 - Table 5 and Figure 6: Changes in reported “NPS Avg” (estimated average pain score for each week of the study period).
Table 5. Change of NPS Avg over time.
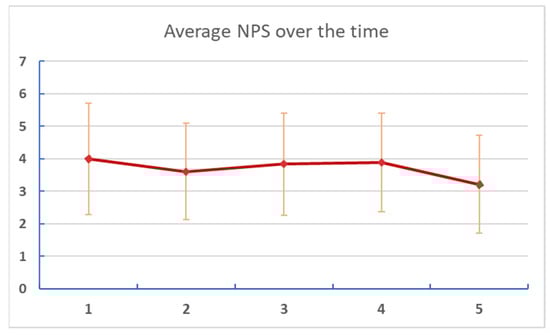 Figure 6. Changes of average NPS at different points of assessment. Numbers on the X axis are reports/assessments for each period in the listening and post-listening periods.
 - Table 6 and Figure 7: Changes in reported “NPS High” (highest pain experienced for each week of the study period).
Table 6. Change of NPS High over time.
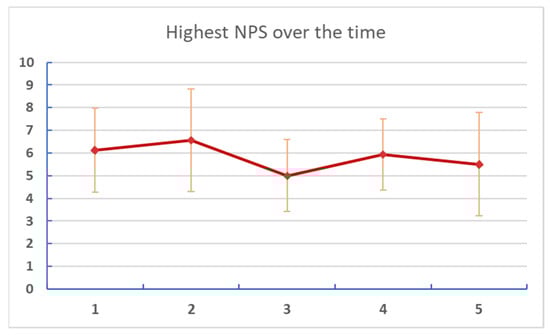 Figure 7. Changes of the highest NPS score at different points of assessment. Numbers on the X axis are reports/assessments for each period in the listening and post-listening periods.
 - Table 7: Listening time and average number of sessions per day.
Table 7. Listening data of participants.
- Table 8 and Figure 8: Changes in medication dose and percent reduction. Medication doses were adjusted to equivalent mg to allow the comparison of different medications.
Table 8. Total adjusted dose of medications at the beginning and after the end of the study (mg).
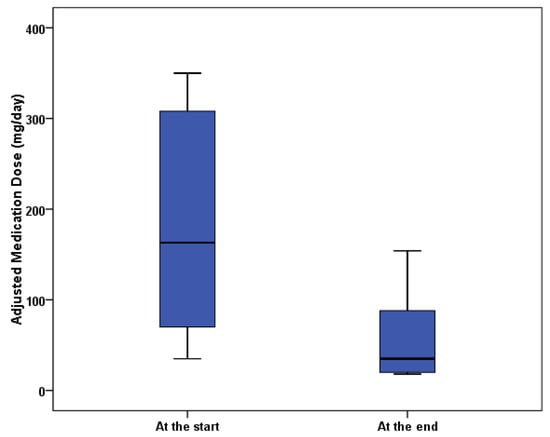 Figure 8. Boxplot of adjusted medication dosages.
4. Discussion
While the different pain scores volunteers were asked to report were explained to them in detail, some expressed confusion during the study, particularly regarding the average pain over the last week and the highest pain in the last week. In the final analysis, the kinds of pain scoring that required volunteers to imagine values in the past (average pain, highest pain in the last week) did not show significant trends over the entire study, perhaps reflecting this confusion.
VAS did not directly match the numerical pain scores (though it was a visual equivalent of the numerical pain score). Placing the VAS and NPS NOW scoring fields adjacent to each other may have confused some volunteers. Everyone understood NPS NOW, which reflected their pain level at time of reporting. Reporting pain in future studies more frequently will remove the need to ask volunteers to score remembered pain.
The disparity in the trend between pain scores and pain medication (pain score reduced by 27%, medication dose reduced by 67%) is reasonable, considering a common goal of the management of chronic pain is balancing a manageable level of pain with minimizing pain medication to avoid its side effects [30]. The pain medication dosage required to maintain a level of pain that does not interfere with daily activities may decline, while the subjective definition of manageable pain level remains constant. The net result is less medication, which is desirable by both healthcare practitioners and patients [30]. Interestingly, individual total music listening time did not correlate directly with individual pain reduction. However, volunteers logged 80% of expected listening time overall, indicating that on average, they listened for the full half-hour twice a day 80% of the time.
In the narrative section of the biweekly self-assessments and in emails, volunteers reported improvements in activity, range of motion, relaxation, sleep, and reduction in inflammation over the period of the study. No specific assessment of these factors was made in the study.
While technical details of the brainwave frequencies are given, lack of both a control group and EEG verification indicates that further study is needed to determine the contributions of the music alone versus music with brainwaves to analgesia scores recorded by the volunteers. The music app provided more reliable quantitative data than self-reported listening times alone. In illustration of this, one of the rejected datasets was from a volunteer who self-reported listening, but whose actual listening data were nearly non-existent. Had we relied on self-reporting, we would have included this volunteer’s data, which would have reduced the reliability of the entire study.
For five volunteers, music analgesia lasted for 2–3 days after the end of the designed listening period. Four volunteers did not report return of pain, indicating some longer-term analgesic effect of the music listening. As some volunteers experienced pain flare-ups, possibly due to reducing use of medication during the study, and not resuming pre-study medication use, music was made available to volunteers to continue listening for the entire four-week follow-up period. They continued to report during that time and continued to show reductions in pain scores and medication use.
5. Conclusions
A two-month study of music listening with isochronic theta beats embedded, with frequency and tone harmonically proportional with the music’s tempo and key, showed a significant effect in pain reduction. Mean change in NPS at time of report during the study was from 4.1 at the beginning, and 3 at the end of the study, a reduction of 27%.
More striking was the change in mean-adjusted medication dosages, from 176 mg to 57 mg, indicating that the music effectively replaced two-thirds of pain medication. This result calls for further research with a larger population and controls, over a longer period. Resumption of pain reported by some volunteers on stopping listening after 4 weeks suggests that a longer period may be needed to allow music analgesia, potentially involving BWE, to result in long-term changes. In addition, a larger study population and controls are needed to determine if these results can be extrapolated, and to determine if there could be a public-health benefit in listening to such music. A single listening session per day for a longer period of 3–4 months will avoid the difficulty some volunteers had of incorporating an hour of listening into a daily routine, and will give greater time for brainwave entrainment.
Author Contributions
Corresponding author R.M. was responsible for the study design, supervision of the research, and reporting. M.T.A. was responsible for the formal analysis, specifically conceptualization, R.M.; methodology, R.M.; software design, R.M.; validation, R.M. and M.T.A.; formal analysis, M.T.A.; investigation, R.M.; resources, R.M.; data curation, R.M.; writing—original draft preparation, R.M.; writing—review and editing, R.M.; visualization, R.M.; supervision, R.M.; project administration, R.M. All authors have read and agreed to the published version of the manuscript.
Funding
This research received no external funding.
Institutional Review Board Statement
The study was conducted according to the guidelines of the Declaration of Helsinki, and approved by the SongRest Scientific Advisory Board prior to the start of research on 7 October 2019.
Informed Consent Statement
Informed consent was obtained in writing from all subjects before participating in the study.
Data Availability Statement
Anonymized raw data for this study is available at https://www.researchgate.net/publication/357093240_Volunteer_Info_Anonymizedxlsx doi:10.13140/RG.2.2.12239.61606.
Acknowledgments
David Merrill of Clarient Solutions, Portland, Oregon, designed and implemented the database and the app programming that tracked listening time through the music players.
Conflicts of Interest
This study was designed and funded by Richard Merrill, presenting a potential conflict of interest, as conclusions may be swayed by a desire for a successful outcome. To mitigate this potential conflict, data analysis was carried out separately from the study, with no direction as to the results. Mariam Taher Amin declares no conflict of interest in the data analysis.
References
- Gureje, O.; Von Korff, M.; Simon, G.E.; Gater, R. Persistent pain and well-being: A World Health Organization Study in Primary Care. JAMA 1998, 280, 147–151, Erratum in JAMA 1998, 280, 1142. [Google Scholar] [CrossRef] [PubMed]
- Baliki, M.N.; Chialvo, D.R.; Geha, P.Y.; Levy, R.M.; Harden, R.L.; Parrish, T.B.; Apkarian, V.A. Chronic Pain and the Emotional Brain: Specific Brain Activity Associated with Spontaneous Fluctuations of Intensity of Chronic Back Pain. J. Neurosci. 2006, 26, 12165–12173. [Google Scholar] [CrossRef] [PubMed] [Green Version]
- Flodin, P.; Martinsen, S.; Altawil, R.; Waldheim, E.; Lampa, J.; Kosek, E.; Fransson, P. Intrinsic Brain Connectivity in Chronic Pain: A Resting-State fMRI Study in Patients with Rheumatoid Arthritis. Front. Hum. Neurosci. 2016, 10, 107. [Google Scholar] [CrossRef] [Green Version]
- Apkarian, A.V.; Sosa, Y.; Sonty, S.; Levy, R.M.; Harden, R.N.; Parrish, T.B.; Gitelman, D.R. Chronic back pain is associated with decreased prefrontal and thalamic gray matter density. J. Neurosci. 2004, 24, 10410–10415. [Google Scholar] [CrossRef] [PubMed]
- Apkarian, A.V.; Baliki, M.N.; Geha, P.Y. Towards a theory of chronic pain. Prog. Neurobiol. 2009, 87, 81–97. [Google Scholar] [CrossRef] [PubMed] [Green Version]
- Ritter, C.; Hebart, M.; Wolbers, T.; Bingel, U. Representation of Spatial Information in Key Areas of the Descending Pain Modulatory System. J. Neurosci. 2014, 34, 4634–4639. [Google Scholar] [CrossRef] [PubMed]
- Ossipov, M.H.; Morimura, K.; Porreca, F. Descending pain modulation and chronification of pain. Curr. Opin. Support. Palliat. Care 2014, 8, 143–151. [Google Scholar] [CrossRef] [Green Version]
- Baliki, M.N.; Geha, P.Y.; Apkarian, A.V.; Chialvo, D.R. Beyond Feeling: Chronic Pain Hurts the Brain, Disrupting the Default-Mode Network Dynamics. J. Neurosci. 2008, 28, 1398–1403. [Google Scholar] [CrossRef] [PubMed] [Green Version]
- Groppe, D.M.; Bickel, S.; Keller, C.J.; Jain, S.K.; Hwang, S.T.; Harden, C.; Mehta, A.D. Dominant frequencies of resting human brain activity as measured by the electrocorticogram. NeuroImage 2013, 79, 223–233. [Google Scholar] [CrossRef] [Green Version]
- Rainville, P.; Duncan, G.; Price, D.D.; Carrier, B.; Bushnell, M.C. Pain Affect Encoded in Human Anterior Cingulate But Not Somatosensory Cortex. Science 1997, 277, 968–971. [Google Scholar] [CrossRef] [Green Version]
- Doelling, K.B.; Poeppel, D. Cortical entrainment to music and its modulation by expertise. Proc. Natl. Acad. Sci. USA 2015, 112, E6233–E6242. [Google Scholar] [CrossRef] [Green Version]
- Manns, A.; Miralles, R.; Adrián, H. The application of audiostimulation and electromyographic biofeedback to bruxism and myofascial pain-dysfunction syndrome. Oral Surg. Oral Med. Oral Pathol. 1981, 52, 247–252. [Google Scholar] [CrossRef]
- Zhou, H.; Melloni, L.; Poeppel, D.; Ding, N. Interpretations of Frequency Domain Analyses of Neural Entrainment: Periodicity, Fundamental Frequency, and Harmonics. Front. Hum. Neurosci. 2016, 10, 274. [Google Scholar] [CrossRef] [Green Version]
- Costa, A.; Villalba, E. (Eds.) The Contribution of the Anterior Cingulate Cortex in Pain Processing. In Horizons in Neuroscience Research; Nova Biomedical: Waltham, MA, USA, 2017; Chapter Two; Volume 28, pp. 51–136. [Google Scholar]
- Burgmer, M.; Pogatzki-Zahn, E.; Gaubitz, M.; Wessoleck, E.; Heuft, G.; Pfeiderer, B. Altered brain activity during pain processing in fibromyalgia, September 2008. NeuroImage 2008, 44, 502–508. [Google Scholar] [CrossRef]
- Arunas, S. Cancer Pain; IntechOpen, Limited: London, UK, 2019. [Google Scholar] [CrossRef] [Green Version]
- Fujioka, T.; Trainor, L.; Large, E.; Ross, B. Internalized Timing of Isochronous Sounds Is Represented in Neuromagnetic Beta Oscillations. J. Neurosci. 2012, 32, 1791–1802. [Google Scholar] [CrossRef] [Green Version]
- Nozaradan, S. Exploring how musical rhythm entrains brain activity with electroencephalogram frequency-tagging. Philos. Trans. R. Soc. B Biol. Sci. 2014, 369, 20130393. [Google Scholar] [CrossRef] [Green Version]
- Lenc, T.; Peter EKeller, P.; Varlet, M.; Nozaradan, S. Neural tracking of the musical beat is enhanced by low-frequency sounds, July 2018. Proc. Natl. Acad. Sci. USA 2018, 115, 8221–8226. [Google Scholar] [CrossRef] [PubMed] [Green Version]
- Lacomba, C.D.; Lioyd, S.A.; Shanka, R.A. An Infrasonic Missing Fundamental Rises at 18.5 Hz; North Georgia College and State University: Oakwood, GA, USA, 2013. [Google Scholar]
- Garza-Villarreal, E.; Pando, V.; Vuust, P.; Parsons, C. Music-induced analgesia in chronic pain conditions: A systematic review and meta-analysis. BioRxiv 2017, 105148. [Google Scholar] [CrossRef] [Green Version]
- Howlin, C.; Rooney, B. Patients choose music with high energy, danceability and lyrics in analgesic music listening interventions. Psychol. Music 2020, 49, 1–14. [Google Scholar] [CrossRef]
- Mitchell, L.; MacDonald, R.; Knussen, C.; Serpell, M. A survey investigation of the effects of music listening on chronic pain. Psychol. Music 2007, 35, 37–57. [Google Scholar] [CrossRef]
- Cruz, G.; Burgos, P.; Kilborn, K.; Evans, J.J. Involvement of the anterior cingulate cortex in time-based prospective memory task monitoring: An EEG analysis of brain sources using Independent Component and Measure Projection Analysis. PLoS ONE 2017, 12, e0184037. [Google Scholar] [CrossRef] [Green Version]
- Oster, G. Auditory beats in the brain. Sci. Am. 1973, 229, 94–102. [Google Scholar] [CrossRef]
- Perez, H.O.; Dumas, G.; Lehmann, A. Binaural Beats through the Auditory Pathway: From Brainstem to Connectivity Patterns. eNeuro 2020, 7. [Google Scholar] [CrossRef] [Green Version]
- Garcia-Argibay, M.; Santed, M.A.; Reales, J.M. Efficacy of binaural auditory beats in cognition, anxiety, and pain perception: A meta-analysis. Psychol. Res. 2019, 83, 357–372. [Google Scholar] [CrossRef] [PubMed]
- Sengpiel, E. Available online: http://www.sengpielaudio.com/calculator-notenames.htm (accessed on 15 December 2021).
- Fuchs, P.N.; Peng, Y.B.; Boyette-Davis, J.A.; Uhelski, M.L. The anterior cingulate cortex and pain processing, in Frontiers in Integrative Neuroscience. Front. Integr. Neurosci. 2014, 8, 35. [Google Scholar] [CrossRef] [PubMed] [Green Version]
- Pembrook, L. Patients Define What Constitutes Manageable Day of Pain. Oncol. Times 2003, 25, 60. [Google Scholar] [CrossRef]
Publisher’s Note: MDPI stays neutral with regard to jurisdictional claims in published maps and institutional affiliations. |
© 2021 by the authors. Licensee MDPI, Basel, Switzerland. This article is an open access article distributed under the terms and conditions of the Creative Commons Attribution (CC BY) license (https://creativecommons.org/licenses/by/4.0/).