1. Introduction
Vitamin D is a fat-soluble vitamin, which is necessary for important vital processes. Vitamin D affects the proper functioning of the lungs and the immune system, which can be important in the development, severity and course of allergic diseases (asthma, eczema and food allergies). The COVID-19 pandemic has further increased interest in vitamin D, as studies have emerged that link the severity of the disease to vitamin D levels in the human body [
1]. Therefore, it is suggested that increasing the intake of vitamin D in different forms may reduce the risk and severity of COVID-19 infection [
2,
3].
The uniqueness of this vitamin is associated with the duality of its intake into the human body. The first path is associated with the synthesis of vitamin D by the human body under the influence of sunlight. Additionally, the second way is associated with the consumption of foods containing this vitamin. However, the diet of a modern person is characterized by the presence of highly processed food, as a rule, deficient in terms of vitamin D. Research data suggest that vitamin D insufficiency affects almost 50% of the worldwide population. An estimated one billion people worldwide, across all ethnicities and age groups, have a vitamin D deficiency [
4].
The duality of the vitamin D intake in the human body is a significant obstacle to the formulation of diets with an adequate intake of this vitamin. At the same time, the analysis of the diet of the population is a rather serious tool for determining the level of vitamin D intake and other aspects of nutritional status and nutritional behavior. There is experience in conducting such studies in Czech [
5] and German [
6] populations. Studies have shown that people do not reach the current recommended vitamin D intake level. In Ukraine, in recent years, there has been practically no reliable open scientific information regarding research in the field of the analysis of the diets of the population, including young people. In this regard, an attempt was undertaken to conduct a pilot study on a small sample of respondents for an assessment of the relationship between the presence of vitamin D-containing foods in the diet of young people and the development of allergic diseases. The original hypothesis assumed the existence of such a relationship.
2. Methods
2.1. Design of Questionnaire
Data collection was carried out by conducting two parallel questionnaires, using questionnaires A and B. Using questionnaire A, the frequency of consumption and food preferences were assessed for 22 vitamin D-containing foods (
Table 1).
The assessment of the taste preferences to the above-mentioned products was carried out on a 5-point rating scale: “very much” (4), “like” (3), “I have nothing against” (2), “rather not like than like” (1), “not at all like” (0). The evaluation of the frequency of consumption of food also occurred on a 5-point rating scale, with anchors “I eat very often” (4), “I eat, but not often” (3), “sometimes I eat” (2), “very rarely I eat” (1), “I don’t eat at all” (0). Using questionnaire B, the identity of allergic diseases was assessed according to method [
8], developed by the Ministry of Health of Ukraine.
2.2. Questionnaire Distribution and Data Collection
The study was a cross-sectional descriptive survey. The respondents included in the study were 223 students of the Kharkiv State University of Food Technology and Trade (Ukraine) aged 17 to 21, of which 30% were women and 70% were men. The assessment procedure was carried out in 2017–2021 among first-year students who voluntarily agreed to take part in the study. The overwhelming majority of participants in the study lived in the Kharkiv region prior to admission to university.
2.3. Data Analysis
Before analysis of data, the reliability was carried out. Reliability within the study was considered as the degree of consistency between two independently obtained series of indicators within the framework of a statistical approach using Pearson correlation coefficients. The assessment of reliability as a measure of the internal consistency of the results was carried out using the Cronbach alpha method [
9], within which the spread of each element was compared with the overall scale range. The obtained coefficients of 0.924 and 0.928 testify to the reliability of the data obtained on consumption frequency and preferences of vitamin D-containing foods.
The hierarchical cluster analysis (HCA) was performed to classify the food samples based on the similarities of their frequency of consumption and preferences. The linkage method, which was applied here, was Ward’s method. Clusters were calculated using the Euclidian distance. For this purpose, the data were centered and divided by their standard deviation to ensure that all the elements had equal weight in the results. Moreover, the statistical significance of the obtained clusters was tested by various formal and empirical statistical criteria: ratios of agglomeration and crosstabulation and adjusted R
2adj calculated by Expression (1) as in research [
10]:
where WSS is within the cluster the sum of squares of distances; TWSS is within sampling the total sum of the squares of distances; n is total samples; k is number of clusters. The HCA analysis was performed by using Minitab ver. 18 (Minitab LLC., State College, PA, USA) software.
3. Results and Discussions
3.1. Data Analysis of Frequency of Consumption and Preferences of Vitamin D-Containing Foods
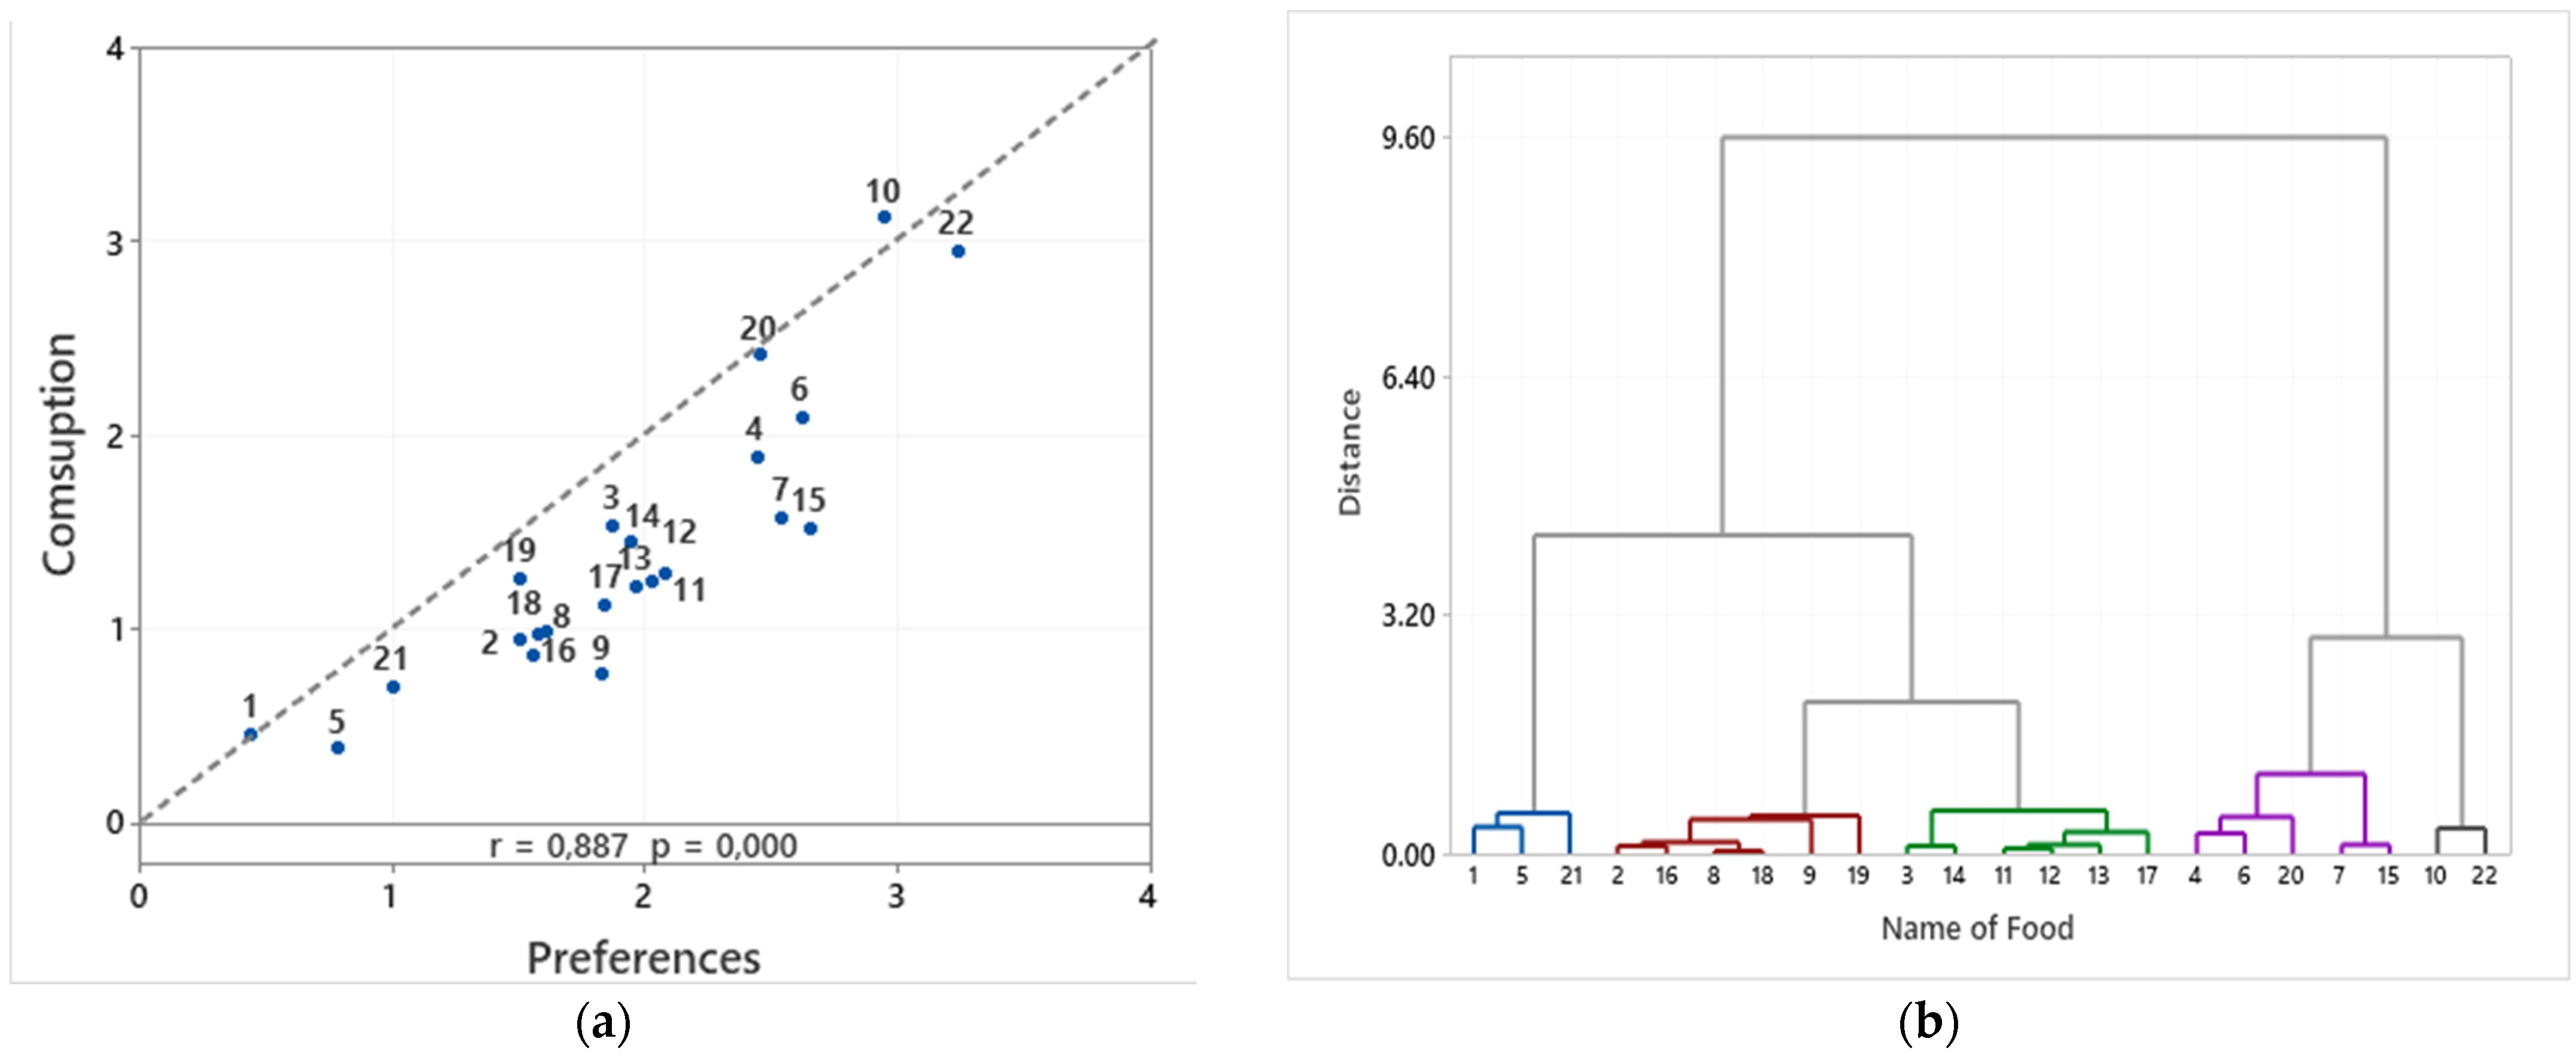
Based on the data from the questionnaires, the respondents’ average consumption and preferences were calculated for all these 22 vitamin D-containing foods (
Table 1). The obtained values of consumption and preferences correlated with each other with Pearson correlation r = 0.887 (
Figure 1a). The data analysis allowed us to trace several patterns:
The consumption of products containing vitamin D was below the possible level of consumption, which should arise based on the preference values of the respondents;
Only for three products, chicken eggs (10), fish oil (1) and butter (20), was there a correspondence between consumption and preferences;
Fish oil (1), dog salmon (5), humpback salmon (8), caviar black granular (9) and goat’s milk (21) had the lowest score according to both food preferences and frequency of consumption;
The leading product in terms of the frequency of consumption was chicken eggs (on average 3.13 points, which corresponded to the definition “I eat, but not often”.
The leading product in food preferences was cheese (3.1 points on average, which corresponded to the definition of “like”).
Products 4 (sprats in oil (canned)), 6 (mackerel), 7 (Atlantic salmon), 15 (caviar red granular), and 20 (butter) had the same high scores, both in the frequency of consumption category and in the food preferences category.
An HCA analysis was performed to classify samples based on the similarity of consumption frequency and food preferences for foods containing vitamin D (
Figure 1b). Based on this analysis, all 22 products were divided into clusters (
Table 1). The resulting clusters actually reflected the ratio of preferences and consumption of the studied foodstuffs containing vitamin D. A retrospective review of the obtained clustering allowed us to highlight some facts:
The distribution of 22 vitamin D-containing food by clusters was obtained as a ratio 2:5:6:6:3;
Foods containing the highest amount of vitamin D belonged to clusters four and five, i.e., less attractive to students and less consumed;
The most useful product, fish oil (1), was included in the cluster of the least consumed foods and with the least preference;
Cluster number one with the highest values of consumption and preference was composed of traditional products in the diets of the population of Ukraine, but with a low content of vitamin D;
Cluster number one was the only one in which the consumption met the preference, which partly reflected the specifics of the student’s diet.
3.2. Results of Processing the Data of Questionnaire B
Questionnaire B showed that, on average, about 70% of all respondents had signs of various types of allergic diseases caused by substances of different origins: natural allergens (for example, the seasonal flowering of plants that causes allergic reactions), the presence of food allergens in their diets, as well as allergens of anthropogenic origin (including household chemicals and pharmaceuticals). The average value for the time period 2017–2021 of the number of respondents using vitamins was 10.3% (
Table 2).
However, during this period, there was a positive trend regarding an increase in the percentage of young people using vitamin D supplements, which correlated with a decrease in the number of allergic manifestations. The increased consumption of vitamin D supplements may be related to information in the media about its positive effect on immunity and the severity of COVID-19, as interest in vitamin D has increased since 2019 among the population.
The analysis of the B survey data also showed that there was a certain relationship between the low frequency of consumption of foods containing high concentrations of vitamin D and the presence of allergic diseases in the respondents. The respondents who, as a result of the questionnaire, did not reveal signs of allergic diseases, had a higher average score for the frequency of consumption of foods rich in vitamin D (
Table 2). This was especially true in 2017 and 2018.
In general, the tendency revealed as a result of the study was quite alarming, since in the studied cohort of young people, on the one hand, there was a low level of consumption of foods rich in vitamin D, and on the other hand, a high percentage of respondents with allergic diseases. At the same time, the percentage of the consumption of food supplements with vitamin D was low. In addition, it was shown that in this sample of respondents, the frequency of consumption of foods rich in vitamin D in those with symptoms of allergic diseases was lower by 1.49 than in those who did not have these symptoms. The latter fact may speak of the beneficial effect of vitamin D on the scenario of the development of allergic diseases.
4. Conclusions
The survey suggests that foods rich in vitamin D are not among the preferences of young people, with the exception of foods such as eggs and cheese. Different types of fish and seafood containing the highest concentrations of vitamin D had rather low scores, both in terms of the frequency of consumption and food preferences. It should also be noted that, for butter, the scores were quite high both in relation to the frequency of consumption and in relation to food preferences. Despite the fact that Ukraine has a very poorly developed tendency to fortify products with vitamin D, this product could be very convenient for these purposes. Since, as studies have shown, this is well accepted by young people, it is traditional for Ukraine and is excellent for the fortification of fat-soluble vitamins, including vitamin D. In addition, when introducing vitamin D fortification technology in Ukraine, the rich world experience of oil fortification could use cheese and dairy products.
Undoubtedly, it is impossible to draw an unambiguous conclusion about the dependence of the presence or development of allergic diseases and the frequency of the consumption of foods rich in vitamin D on the basis of the above data. However, it should be recognized that a certain dependence exists. These studies require continuation and the questionnaires should be conducted on a wider scale. In addition, in our opinion, in future studies, in order to assess the correlation between the presence of allergic diseases and the consumption of foods rich in vitamin D, the analysis of diets should also be taken into account, indicating the exact amounts of food consumed. Additionally, in the same study, the questionnaires should include questions about the duration of exposure to the sun, depending on the season.
Author Contributions
Conceptualization, E.A., S.G.; methodology, E.A. and S.G.; software, D.T. and S.G.; validation, D.T.; formal analysis, E.A. and N.O.; writing—original draft preparation, E.A. and S.G.; writing—review and editing, E.A., N.O. and S.G. All authors have read and agreed to the published version of the manuscript.
Funding
This research received no external funding.
Institutional Review Board Statement
Not applicable.
Informed Consent Statement
Not applicable.
Data Availability Statement
Data presented in this study are available on request from the corresponding author.
Conflicts of Interest
The authors declare no conflict of interest.
References
- Cui, C.; Xu, P.; Li, G.; Qiao, Y.; Han, W.; Geng, C.; Liao, D.; Yang, M.; Chen, D.; Jiang, P. Vitamin D Receptor Activation Regulates Microglia Polarization and Oxidative Stress in Spontaneously Hypertensive Rats and Angiotensin II-Exposed Microglial Cells: Role of Renin-Angiotensin System. Redox Biol. 2019, 26, 101295. [Google Scholar] [CrossRef] [PubMed]
- Grant, W.; Lahore, H.; McDonnell, S.; Baggerly, C.; French, C.; Aliano, J.; Bhattoa, H. Evidence That Vitamin D Supplementation Could Reduce Risk of Influenza and COVID-19 Infections and Deaths. Nutrients 2020, 12, 988. [Google Scholar] [CrossRef] [PubMed] [Green Version]
- Mendy, A.; Apewokin, S.; Wells, A.A.; Morrow, A.L. Factors Associated with Hospitalization and Disease Severity in a Racially and Ethnically Diverse Population of COVID-19 Patients. MedRxiv Prepr. Serv. Health Sci. 2020. [Google Scholar] [CrossRef]
- Nair, R.; Maseeh, A. Vitamin D: The Sunshine Vitamin. J. Pharmacol. Pharmacother. 2012, 3, 118. [Google Scholar] [CrossRef] [PubMed]
- Bischofova, S.; Dofkova, M.; Blahova, J.; Kavrik, R.; Nevrla, J.; Rehurkova, I.; Ruprich, J. Dietary Intake of Vitamin D in the Czech Population: A Comparison with Dietary Reference Values, Main Food Sources Identified by a Total Diet Study. Nutrients 2018, 10, 1452. [Google Scholar] [CrossRef] [PubMed] [Green Version]
- Jungert, A.; Spinneker, A.; Nagel, A.; Neuhäuser-Berthold, M. Dietary Intake and Main Food Sources of Vitamin D as a Function of Age, Sex, Vitamin D Status, Body Composition, and Income in an Elderly German Cohort. Food Nutr. Res. 2014, 58, 23632. [Google Scholar] [CrossRef] [PubMed] [Green Version]
- Skurikhin, I.M.; Volgarev, M.N. (Eds.) Chemical Composition of Food Products. Book 2: Reference Tables of Amino Acids, Fatty Acids, Vitamins, Macro- and Micronutrients, Organic Acids and Carbohydrates; Agropromizdat: Moskow, Russia, 1987. [Google Scholar]
- About Organizational Measures for Introduction of Modern Technologies of Diagnostics and Treatment of Allergic Diseases; Order N 127/18; The Ministry of Health of Ukraine: Kiyv, Ukraine, 2002.
- Cronbach, L.J. A Case Study of the Split-Half Reliability Coefficient. J. Educ. Psychol. 1946, 37, 473–480. [Google Scholar] [CrossRef] [PubMed]
- Goralchuk, A.; Gubsky, S.; Omel’chenko, S.; Riabets, O.; Grinchenko, O.; Fedak, N.; Kotlyar, O.; Cheremska, T.; Skrynnik, V. Impact of Added Food Ingredients on Foaming and Texture of the Whipped Toppings: A Chemometric Analysis. Eur. Food Res. Technol. 2020, 246, 1955–1970. [Google Scholar] [CrossRef]
| Publisher’s Note: MDPI stays neutral with regard to jurisdictional claims in published maps and institutional affiliations. |
© 2021 by the authors. Licensee MDPI, Basel, Switzerland. This article is an open access article distributed under the terms and conditions of the Creative Commons Attribution (CC BY) license (https://creativecommons.org/licenses/by/4.0/).


