Abstract
The Argentine Patagonian region provides abundant plant-based materials for functional foods. This study evaluated the functional potential of tisanes made with black tea (BT) or rooibos (R) and Patagonian matrices (blueberry, rosehip, yacón), analyzing total phenols (TPs), flavonoids (Fvs), antioxidant activity (AA), sodium (Na), and potassium (K) content. Tisanes were prepared using 3 g/200 mL of water at 90 °C, with BT or R accounting for 40% of the dry mass and the remaining ingredients contributing 20% each. TPs (67 mg GAE/100 mL) and Fvs (35–42 mg/cup) contributed significantly to dietary intake. Sugar addition reduced bioactive compounds and AA, while sweeteners showed no significant impact. BT-based tisanes were low in sodium, while R-based tisanes had higher levels.
1. Introduction
Around the world, a wide variety of remedies based on medicinal herbs exist. The World Health Organization reports that 80% of the population in developing countries addresses their health issues through alternative medicine, particularly in China, where it forms the foundation of their pharmacotherapeutic practices. Other countries in Africa, Central and South America, India, Indonesia, and the Pacific Islands also have a long-standing tradition of its use [1].
Phytotherapy is the science that studies the use of plant-based products for therapeutic purposes, whether to prevent, alleviate, or cure a pathological condition [2]. This approach relies on the action of active compounds found in plants, which can be utilized in various forms, such as herbal teas, infusions, extracts, essential oils, and tablets. In recent years, phytotherapy has experienced significant growth due to the increasing interest in natural and sustainable therapies. This growth is accompanied by a rise in scientific research to validate the efficacy and safety of plant-derived active compounds [3].
An infusion is prepared by steeping parts of a plant (such as the leaves, flowers, stems, fruits, or roots) in hot water for medicinal or aromatic purposes, extracting their properties into a liquid medium—usually water—without boiling them together, as happens in decoction. An herbal tea (or tisane) is a beverage obtained after preparing an infusion once the plant material has been removed.
The selection of plants for preparing a tisane is highly varied and depends primarily on the benefits sought by the consumer. The selected ingredients are dried, processed individually, and blended [4].
Regions like Patagonia have gained attention for their unique biodiversity and the traditional use of native plants in folk medicine. This region offers a wealth of plant-based raw materials that are food sources or potential precursors to new foods. Additionally, Patagonia is recognized for its established culture of producing high-value, differentiated foods, often crafted by small commercial enterprises. These ventures create high-quality products and generate significant employment opportunities [5].
A key challenge for cherries and berries is the limited infrastructure for preserving and transporting fresh fruits, which restricts market access. Around 70% of production goes to processing due to difficulties maintaining quality over time [6].
Developing value-added products with less reliance on the cold chain is essential for sustainability. Options like dehydrated fruits, concentrated pulps, flavored beverages, and functional juices could enhance competitiveness, reduce post-harvest losses, and expand market opportunities without fresh product constraints.
The functional potential as an antioxidant of tisanes made with black tea (BT) or rooibos (R) and powdered Patagonian matrices (ground dehydrated blueberry and rosehip fruits and ground dehydrated yacón leaves) was evaluated through the Antioxidant Activity Index, as well as the impact on them of adding sucrose or a sweetener.
2. Materials and Methods
2.1. Raw Materials
The fruits blueberry (Vaccinium sect. Cyanococcus) and rosehip (Rosa canina) were harvested by local producers from the Andean Region of Parallel 42 at their optimal maturity point and immediately transported to Villa Regina. The fruits were stored in a refrigerator at 5 °C until use. A simple random sampling was conducted, discarding fruits showing advanced signs of ripeness. Blueberries of the Elliot variety and wild rosehip of the Rosa eglanteria variety were used. Yacon (Smallanthus sonchifolius) leaves, black tea (Camellia sinensis) leaves, and rooibos (Aspalathus linearis) were purchased from local retailers.
2.2. Dehydration
Dehydration was applied to fresh rosehip and blueberry fruits. For the rosehip, three equatorial punctures were made on each fruit as a physical pretreatment to induce mechanical damage to the skin. This treatment created cracks in the impermeable layer, facilitating moisture migration from the interior to the surface. This resulted in a total drying time of 4 h under the study conditions [7]. The fruits were placed in a pilot dryer with hot air circulation at a constant temperature of 70 °C and an air velocity of 3 m/s until reaching a final moisture content of 9% for rosehip and 12% for blueberry. Once dehydrated, the fruits were ground using a mill, and the resulting powder was homogenized using an 18-mesh sieve.
2.3. Preparation of Extracts
Extracts were prepared using tea preparation methods with a solid-to-liquid ratio of 3 g/200 mL of water held at 90 °C. The data are presented in Table 1.

Table 1.
Preparation of Extracts.
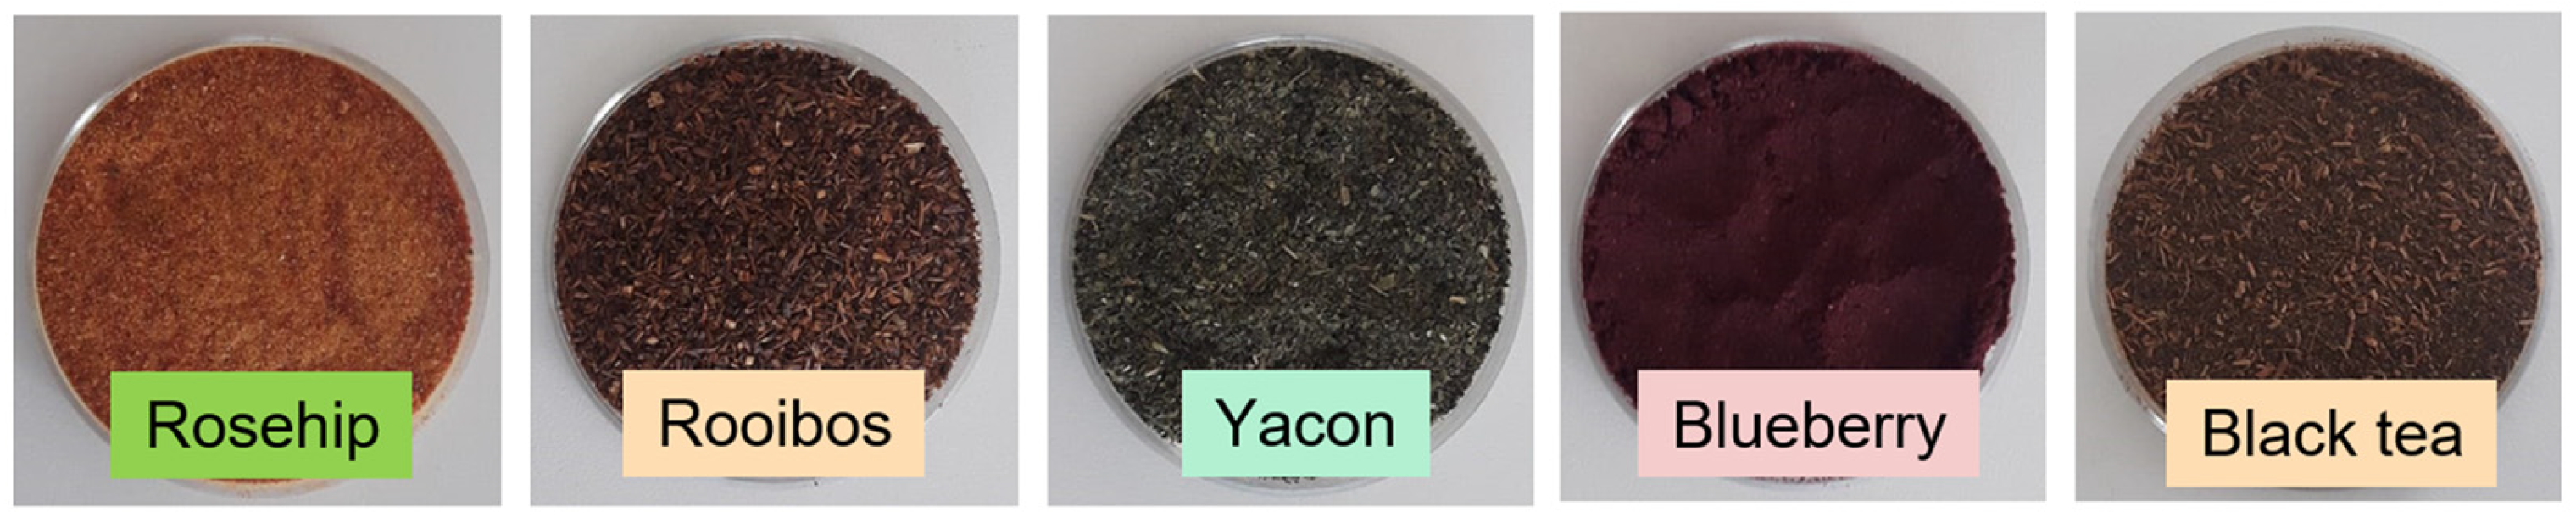
The solutions were maintained under constant agitation for 5 min, after which the solids were separated using Whatman No. 4 filter paper. All extracts were prepared in triplicate. Figure 1 shows the powders used for the preparation of the extracts.
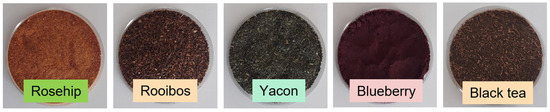
Figure 1.
Powders used for preparation of extracts.
2.4. Addition of Sugar or Sweetener
Commercial cane sugar or sweetener was added to the infusions prepared as described in the Preparation of Extracts Section. For sugar, 6.4 g was added to 200 mL of the infusion. For sweetener, 1.2 mL (24 drops) of the commercial Stevia product from Ecoop, which contains 3700 mg of stevioside glycosides per 100 mL, was added to 200 mL of the infusion. The determinations were performed in triplicate on the extracts.
2.5. Assessment of Total Phenols by Fast Blue (TPs)
The method described by Medina [8], with some modifications, was used. Two milliliters of the extract were transferred to a test tube, and the following reagents were added: 200 μL of 1% Fast Blue BB solution in methanol and 200 μL of 5% NaOH. After 60 min of incubation in the dark at room temperature, the absorbance was read at 420 nm using a Shimadzu UV-1800 spectrophotometer. Gallic acid from Biopack was used for the calibration curve. Final results were expressed as mg of Gallic Acid Equivalent (GAE) per 100 mL of extract or 100 g of powder, as appropriate.
2.6. Assessment of Flavonoid (Fv)
Total flavonoids were determined using the AlCl3 complex formation method, with catechin as an external standard (mg/L). An aliquot of the extract was mixed with 300 μL of 5% NaNO2. After 5 min, 300 μL of 10% AlCl3 was added, followed by 2 mL of 1 N NaOH solution after 6 more minutes. The mixture was brought to 10 mL with distilled water. Absorbance readings were taken with a Metrolab 1700 spectrophotometer at 510 nm. The final results were expressed as mg of catechin equivalent per 100 mL of extract or 100 g of powder, as appropriate [9].
2.7. Assessment of Antioxidant Activity Index (AAI)
The Antioxidant Activity Index was analyzed using the stable radical 1,1-diphenyl-2-picrylhydrazyl (DPPH) in methanolic solutions [10]. A typical experiment involved adding various aliquots of the extracts to a glass cell containing 3 mL of 100 μM methanolic DPPH solution, adjusted to consume between 30% and 70% of the radical. After 90 min of incubation at room temperature in the dark, the absorbance of the samples was measured at 515 nm, determining EC50 (ppm of the dry sample needed to reduce the initial 50 ppm DPPH concentration by 50%) and calculating the Antioxidant Activity Index (AAI) as a ratio of EC50 to the initial DPPH concentration. AAI scores were determined for the infusion extracts and the standards: gallic acid, ascorbic acid, catechin, ferulic acid, rutin, caffeic acid, and chlorogenic acid.
2.8. Assessment of Minerals
Sodium and potassium levels were determined using flame atomic absorption spectrometry [11]. Results were expressed as ppm of sodium or potassium in the extracts.
2.9. Assessment of Superficial Color
The colors were evaluated using the tristimulus parameters of the CIELAB color space with a Minolta CR-400 colorimeter (Konica Minolta Sensing Inc., Osaka, Japan) under illuminant C and a 2° observer angle. The instrument was standardized with a white ceramic plate (L* = 95.55; a* = −0.10; b* = +2.69). The obtained powders were placed on plates with a diameter of 3 cm and a height of 1 cm for color measurement, while for the beverages, the samples were placed in an opaque crucible for measurement. The CIELAB parameters L*, a*, and b* were recorded in all cases.
2.10. Statistical Analysis
A completely randomized design was applied. The results were analyzed using an analysis of variance (ANOVA) at a significance level of α = 0.05. The DGC (Di Rienzo, Guzmán, Casanoves) test was employed for mean comparisons. The statistical software Infostat v.2020 [12] was used.
3. Results and Discussion
The compositions of the final mixtures were determined based on the study of the bioactive compounds in the powders and an internal sensory analysis of the various infusions. The results of the characterization of the prepared tisanes are presented in Table 2.
Table 2.
Functional characterization of tisanes.
When comparing the total phenol concentration in tisanes with that of other beverages such as black tea (185 mg gallic acid/100 mL), green tea (152 mg gallic acid/100 mL), chamomile tea (12.5 mg gallic acid/100 mL), lemon tea (varied concentrations), orange juice (20 mg gallic acid/100 mL), or coffee (365 mg gallic acid/100 mL), it becomes evident that tisanes significantly contribute to a diet rich in phenols (exceeding 600 mg/day) [7]. No significant differences (p ≤ 0.05) in total phenol content were observed based on the base matrix used for tisane preparation.
The flavonoid concentration in the tisanes represents a meaningful dietary supplement, as one cup provides between 35 and 42 mg. A standard diet’s estimated daily intake of flavonoids ranges from 50 to 800 mg/day [13], with some reports indicating up to 1 g [14]. For comparison, a cup of black tea can provide up to 140 mg of total flavonoids, and a glass of wine up to 200 mg [15].
The antioxidant potential of tisanes, evaluated through the DPPH radical reduction assay, varies due to differences in testing conditions. However, the Antioxidant Activity Index (AAI) standardizes results by relating the initial DPPH concentration to the EC50 of the sample, yielding consistent values for standards and plant extracts tested under uniform conditions [10].
Taking into account the AAI of standards such as gallic acid (31.53), ascorbic acid (9.24), catechin (10.53), ferulic acid (6.48), rutin (7.77), caffeic acid (12.61), and chlorogenic acid (12.92), the tisanes exhibit high antioxidant activity comparable to compounds with proven radical-scavenging power. No significant differences (p ≤ 0.05) in AAI scores were observed among the samples.
The potassium content in the mixtures is notably high, particularly considering the FAO’s recommended daily intake of 3510 mg/day and the generally low potassium consumption in the population [16]. For reference, black tea provides 129 ppm, while commercial beverages range from 36 to 67 ppm [17].
The high sodium concentration in rooibos may limit its inclusion in the final solid mixture. To reduce the risks associated with excessive salt consumption, the World Health Organization (WHO) recommends a daily sodium intake of 2000 mg or 5 g for adults [16].
The sodium content in the black tea-based tisane is very low (4.42 ppm), qualifying it as “Low Sodium” according to Article 986 of the Argentine Food Code (values below 20 mg/L). In contrast, the high sodium content in the rooibos-based tisane derives from the initial sodium content in its base matrix. Compared to commercial beverages, the sodium levels in the tisanes are significantly lower (115–828 ppm) [17,18].
The concentrations of sweeteners were adjusted to simulate typical consumption. The effect of sugar or sweetener addition was evaluated concerning total phenols, flavonoids, and Antioxidant Activity Index.
Figure 2 shows the total phenol content in the two tisanes under three study conditions: original, added sugar, and added sweetener.
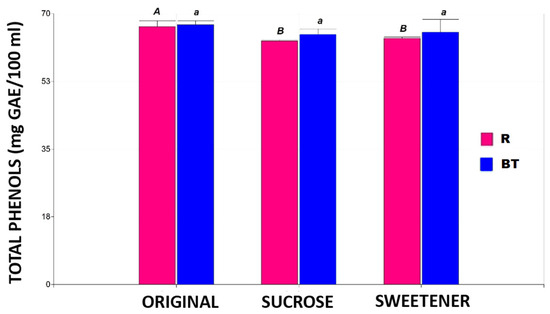
Figure 2.
The total phenol content in the different tisanes. Note: the bar heights indicate the mean values and the error bars represent the standard errors. Means with a shared letter of the same type are not significantly different (p ≤ 0.05).
No significant differences (p ≤ 0.05) were found in the three products of the black tea-based tisane in total phenol concentration. In contrast, the rooibos-based tisane showed a 6% decrease in total phenol content with added sugar or sweetener without significant differences (p ≤ 0.05) between the sweeteners. These findings align with those of other authors who reported reduced phenol content in black tea due to added sugar [19]. It has been described that ingredients such as sucrose and citric acid may accelerate the degradation of catechins present in tea infusions.
The negative effect of sugar addition is likely balanced by the protective effect of the high ascorbic acid concentration in the rosehip powder added to the tisanes. Furthermore, ascorbic acid (found in high concentrations in rosehip) has been reported to maintain stability against oxidative reactions for approximately one month, after which the effect reverses [20,21].
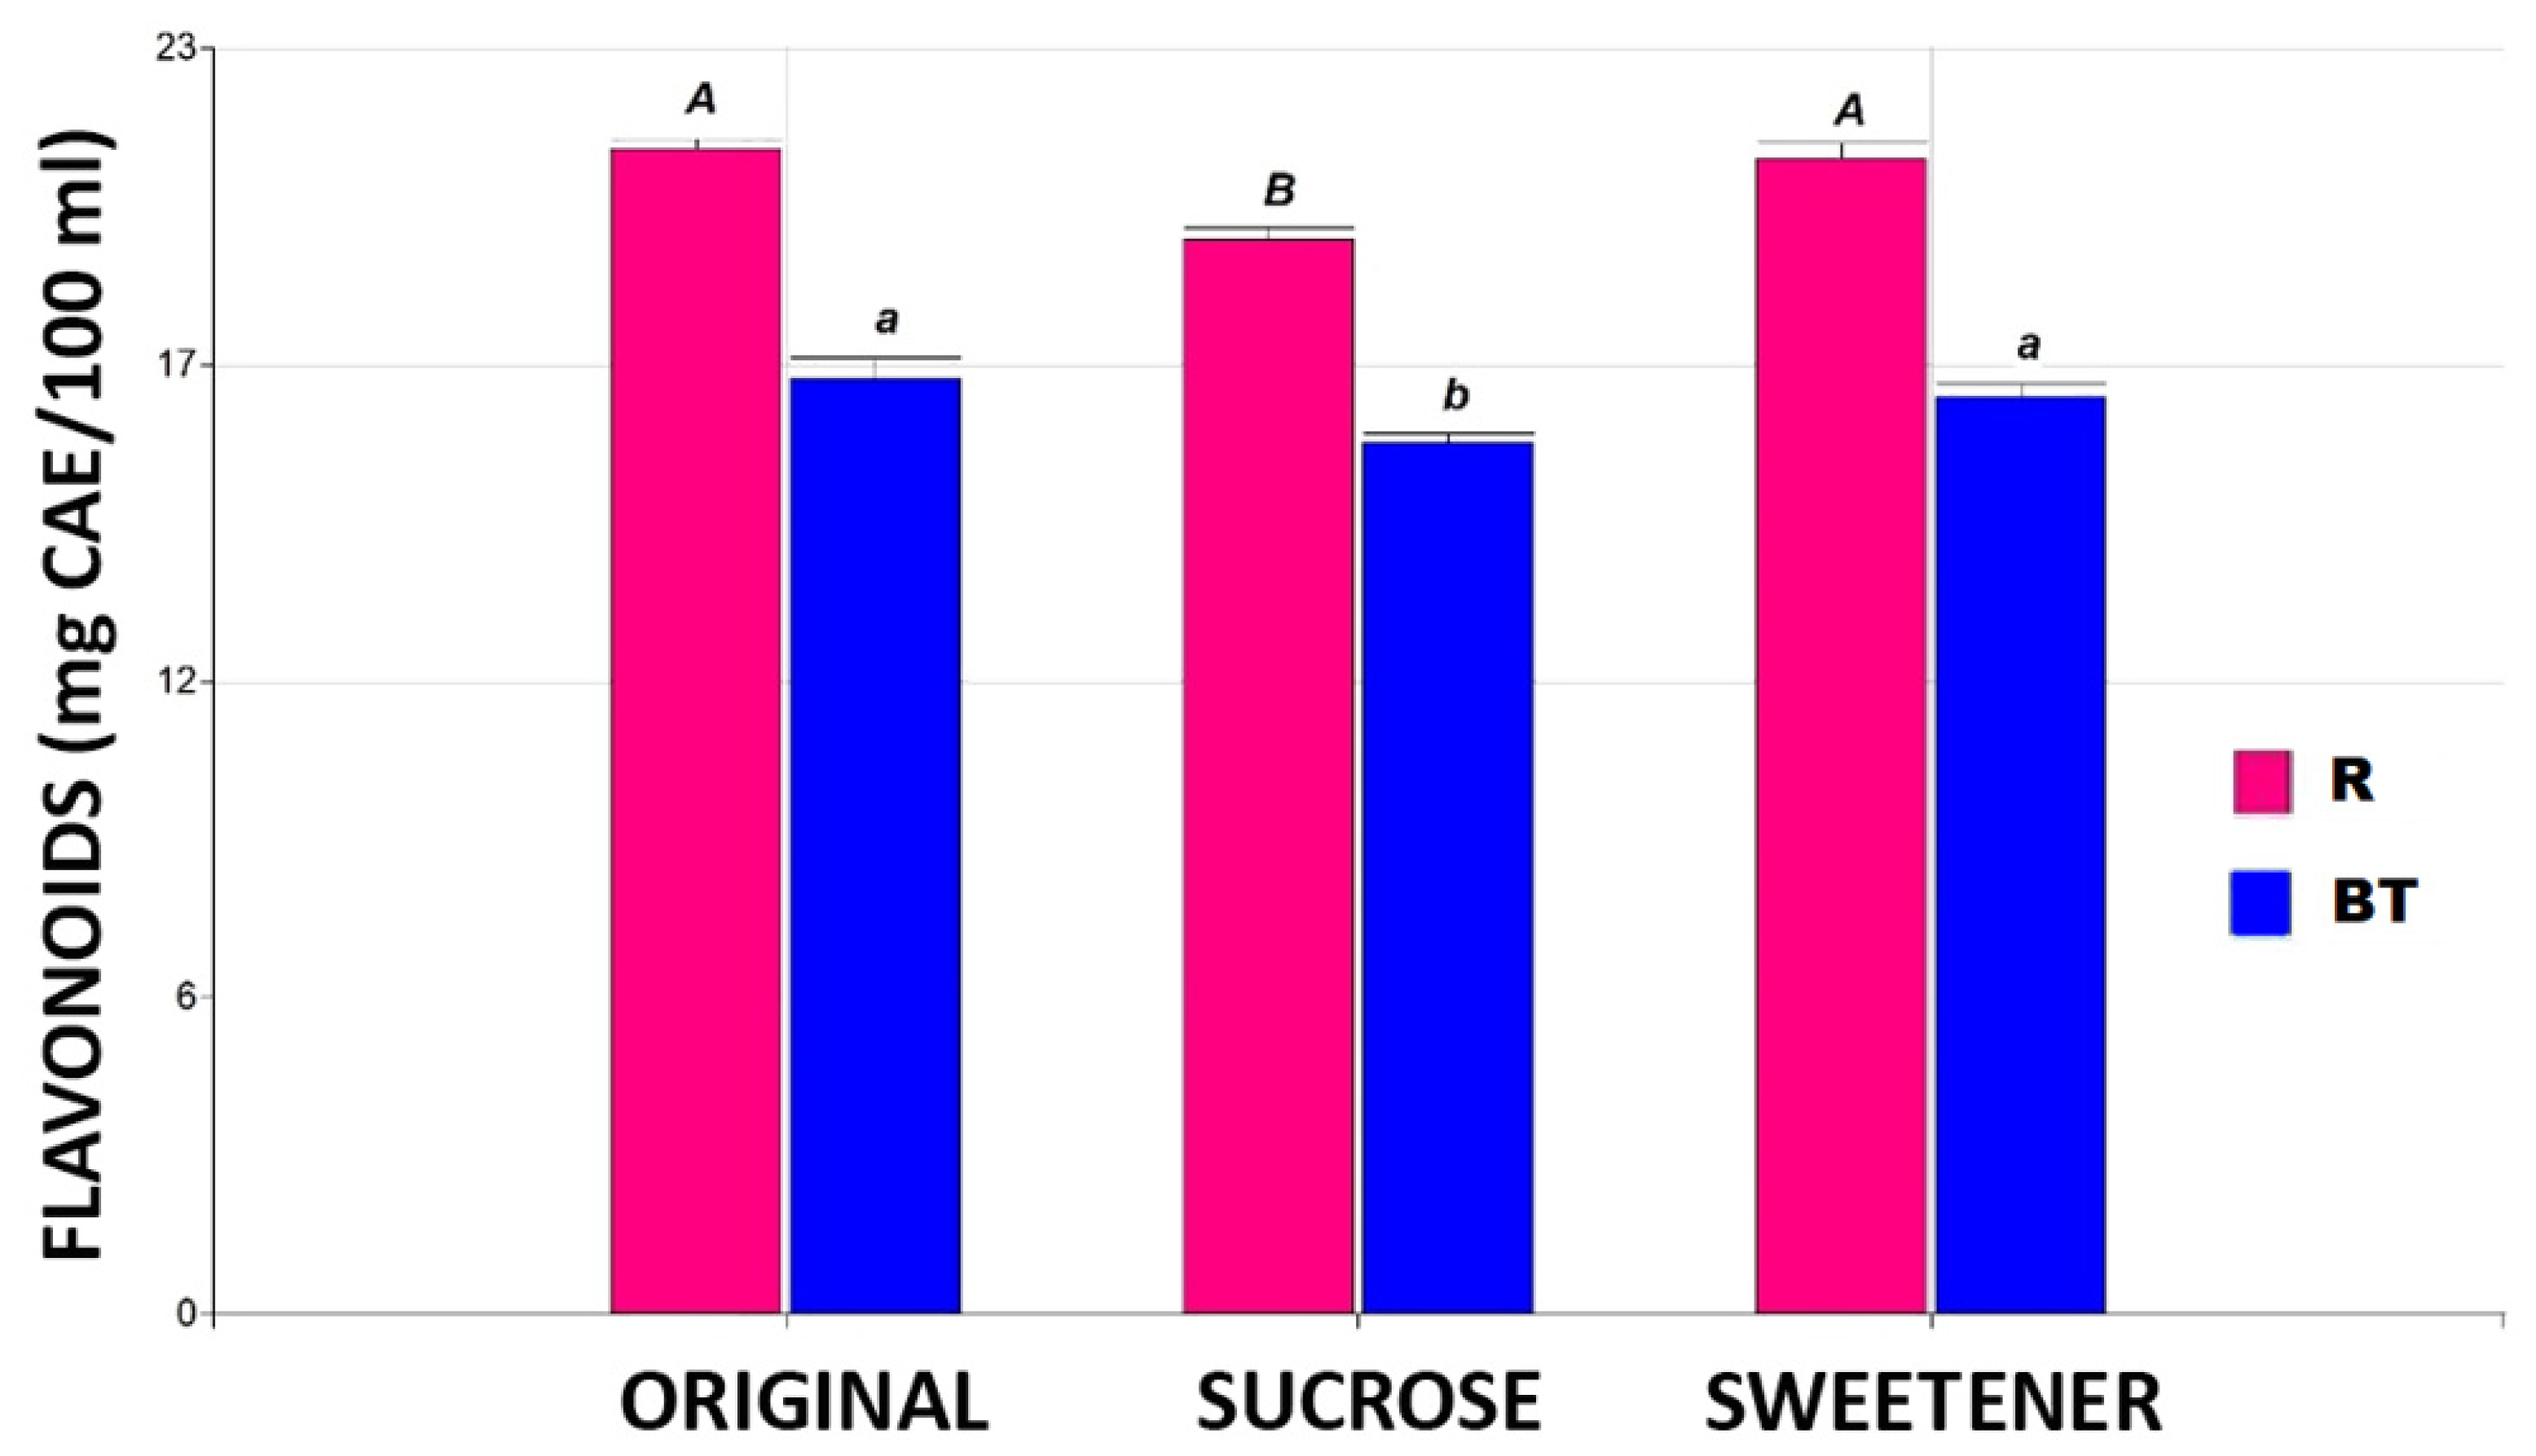
Figure 3 illustrates the flavonoid content for the studied conditions. For this parameter, no significant differences (p ≤ 0.05) were found between the originals and the tisanes tested with added sweetener in any of the proposed tisanes. Steviol glycosides, the main component of the commercial product Stevia Coop, are extracted from the plant Stevia rebaudiana Bertoni and are up to 300 times sweeter than sucrose [22]. Additionally, during the production process of the commercial product, bioactive compounds such as flavonoids present in the leaves can also be recovered [23]. The tisanes sweetened with sugar showed a 7% decrease in flavonoid concentration, regardless of the base matrix used.
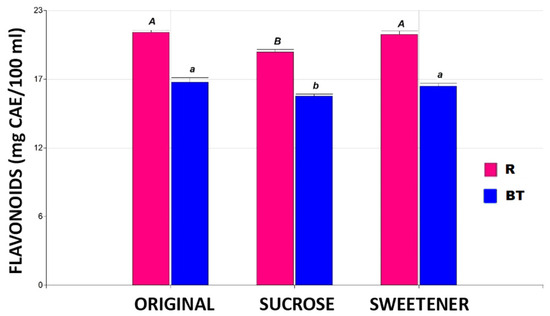
Figure 3.
The flavonoid content in the different tisanes. Note: the bar heights indicate the mean values and the error bars represent the standard errors. Means with a shared letter of the same type are not significantly different (p ≤ 0.05).
The data for the Antioxidant Activity Index (AAI) values obtained for the tisanes can be seen in Figure 4. For this parameter, significant differences are observed depending on the sweetener used, with a 4% loss in tisanes sweetened with sugar and a 5% increase in those sweetened with stevia. This behavior is independent of the base matrix used. Other authors report decreases of between 4% and 10% in the antioxidant activity of green tea when different concentrations of sucrose are added as a sweetener [24], as well as an increase in the antioxidant properties of various extracts with the addition of stevia [23,25,26,27].
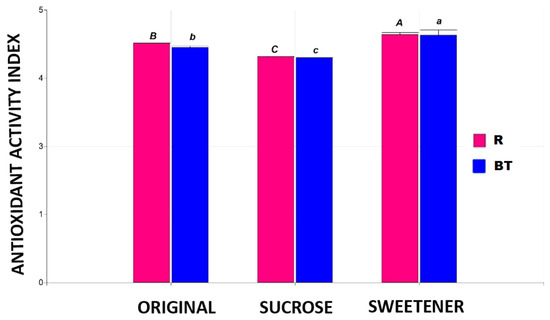
Figure 4.
The Antioxidant Activity Index in the different tisanes. Note: the bar heights indicate the mean values and the error bars represent the standard errors. Means with a shared letter of the same type are not significantly different (p ≤ 0.05).
Regarding superficial color, Table 3 presents the surface color values for the fresh fruits under study.
Table 3.
Surface color of raw materials (powders).
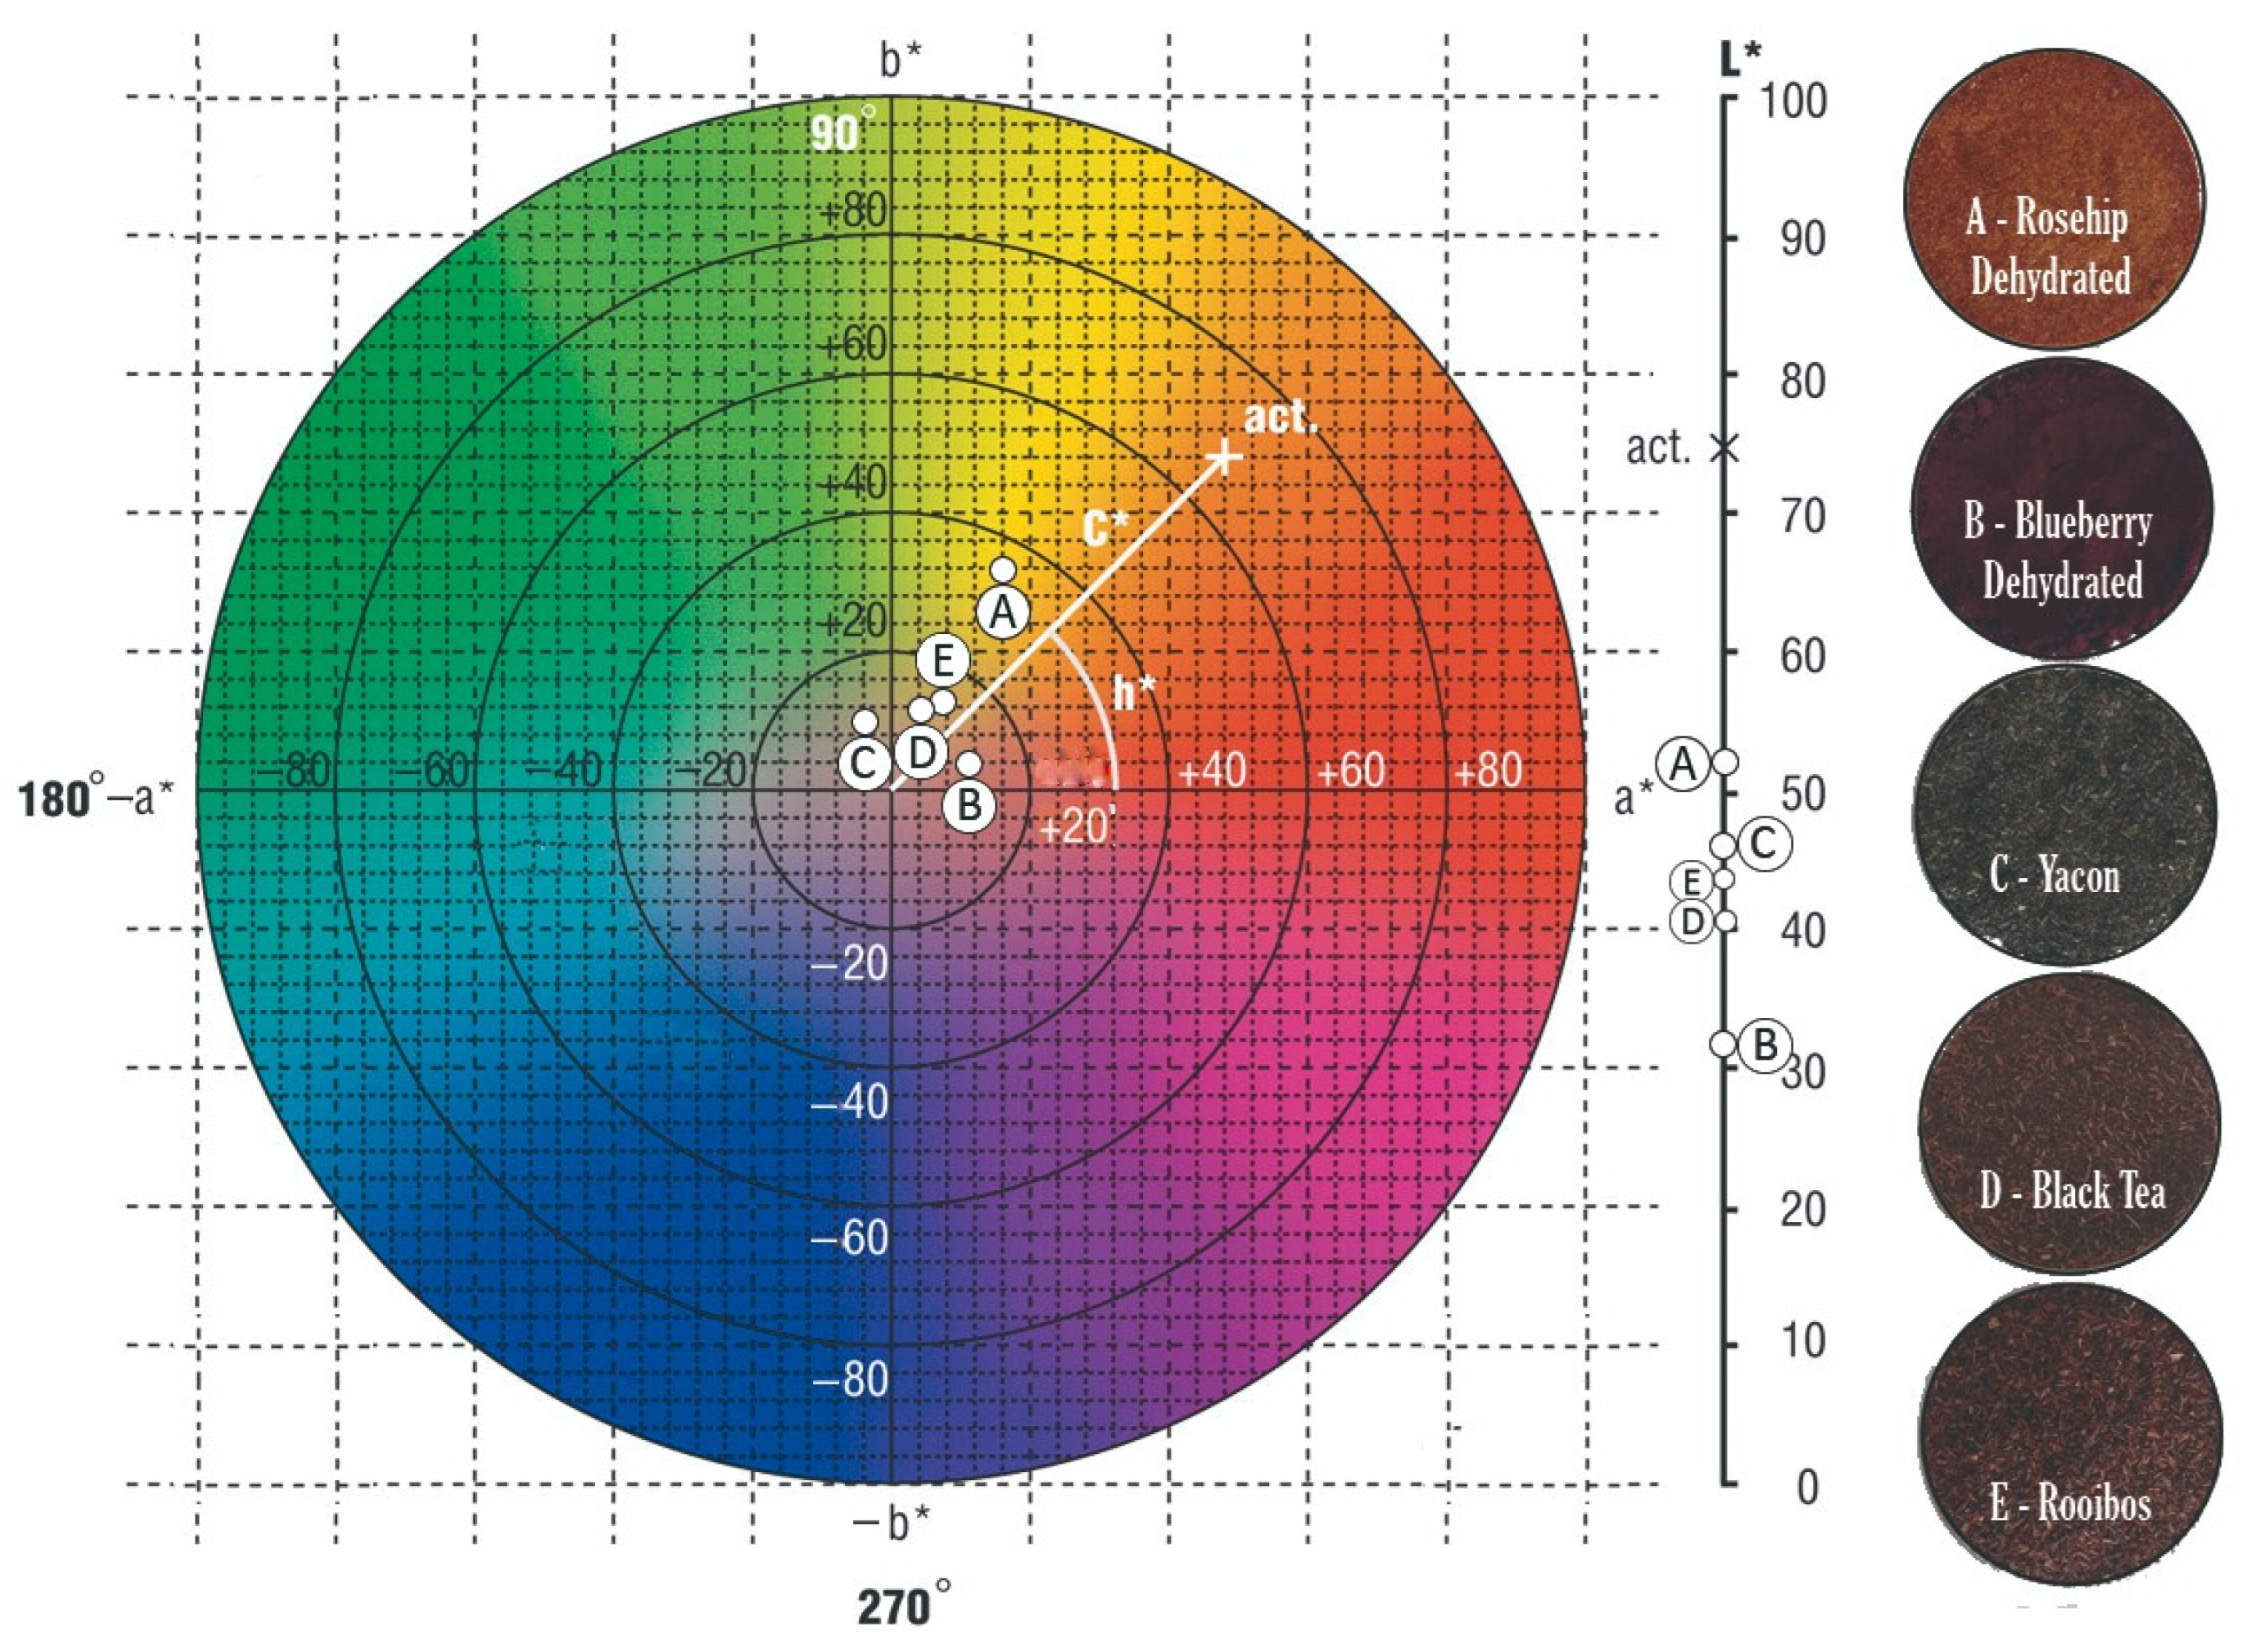
Dehydrated rosehip, blueberry, black tea, and rooibos have hues corresponding to the first quadrant. In black tea, this translates to yellowish-brown colors. But in the case of rooibos, although it is similar to the base color, it exhibits a more significant contribution from the a* component, imparting a reddish-copper hue to the infusion. Blueberry powder is darker, predominantly purplish. Rosehip powder presents a reddish-orange hue with the highest lightness, enhancing the final vibrancy of the orange shade in the matrix. Yacón, on the other hand, has a hue angle corresponding to the second quadrant, indicating greenish tones.
Figure 5 shows a color diagram based on the chromatic coordinates a* and b*, where saturation (C*) increases outward from the center (value 0). Lightness is indicated on the right scale, and hue (h*) represents the product’s tone. For example, the label “AD” in the diagram corresponds to the color parameters of dehydrated blueberry (a* = 11.60 ± 0.42; b* = 2.59 ± 0.15, hue = 12.61 ± 0.75, and Chroma = 11.89 ± 0.42).
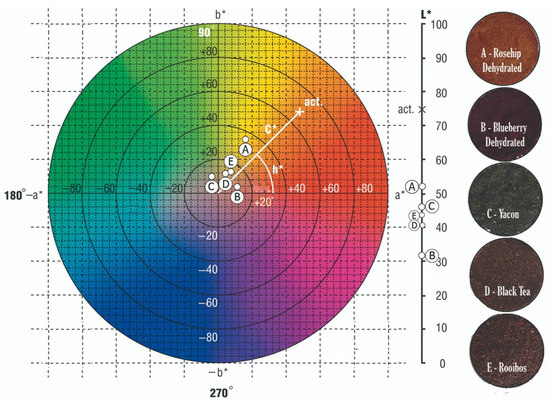
Figure 5.
Color diagram for raw materials (powders). Note: the central color disk corresponds to an L* = 50. Reference for letters A to E are referenced at the right side of the figure.
The color parameters for the blends are presented in Table 4.
Table 4.
The surface colors of the infusions.
The blends did not show significant lightness differences (p ≤ 0.05). However, their low values and low saturation resulted in very noticeable changes in surface color, which appeared “duller” than the original base matrix.
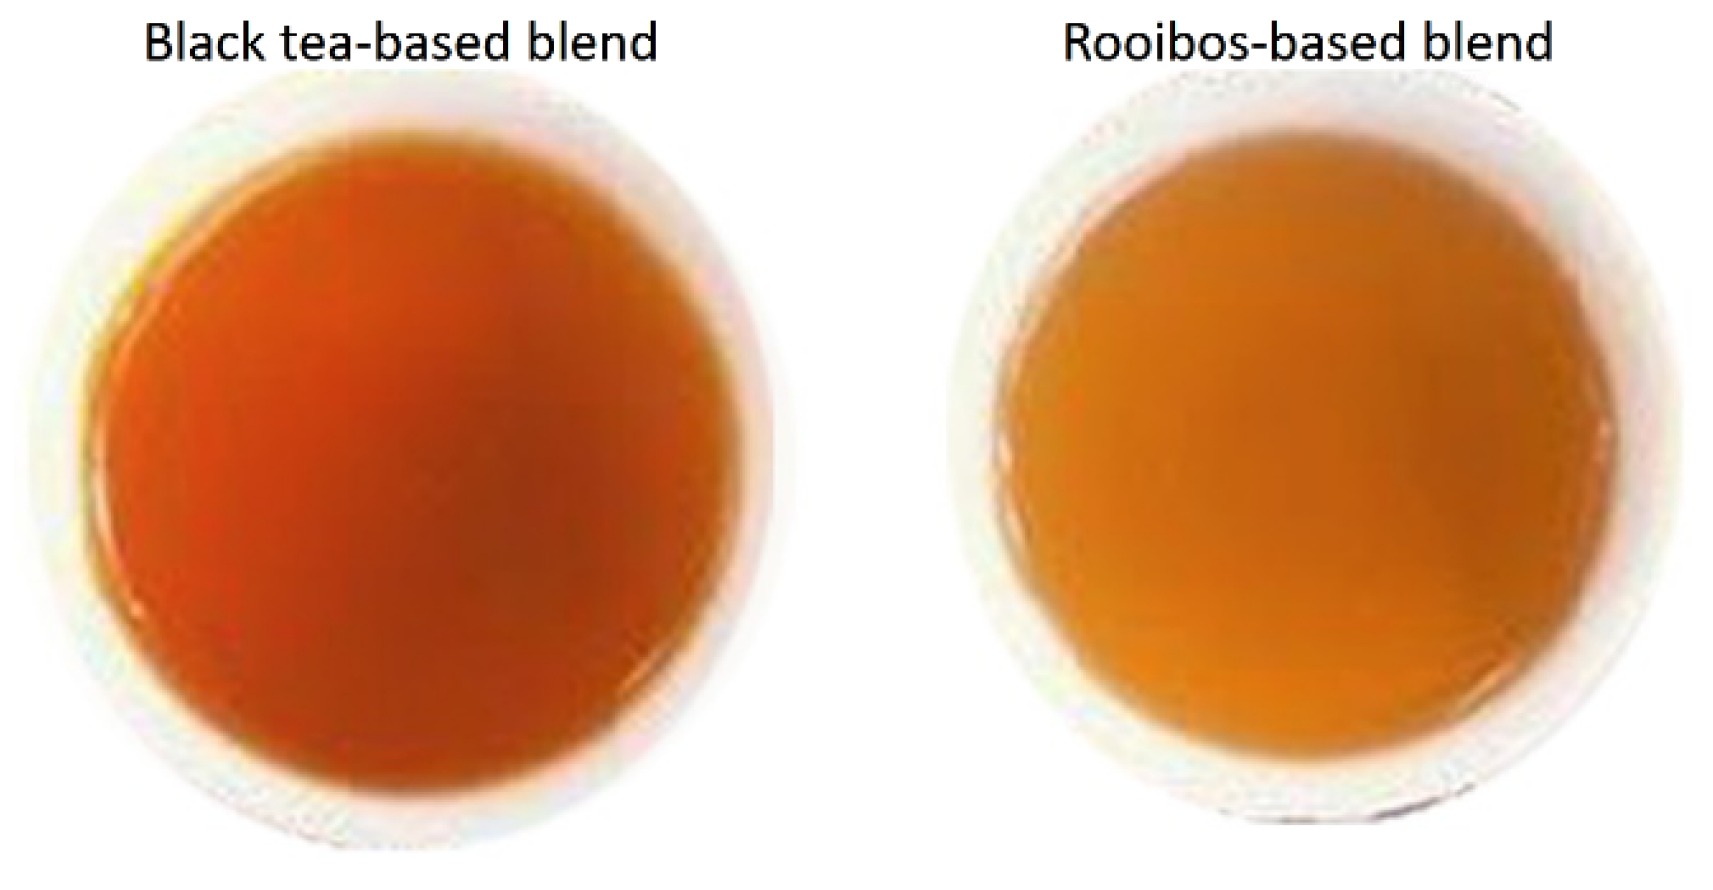
The black tea-based infusion exhibited an unattractive brownish-orange color (Picture 1). In contrast, the rooibos-based infusion retained the reddish hue characteristic of its base matrix, as reflected by its higher a* value (Graph 1).

Graph 1.
Obtained infusions.
The hue angle for both products ranged between 65° and 75°, visually presenting yellowish-orange tones.
4. Conclusions
The tisanes, whether with or without the addition of sucrose or the tested sweetener, maintain the properties of the raw materials, providing antioxidants, minerals, and vitamins from their components. The overall composition of the final product classifies it as a functional food that a wide range of people can consume.
Currently, similar products are unavailable in the Argentine market, presenting an opportunity to add value to local production (yacón, berries, rosehip) by developing functional foods that offer health benefits beyond traditional nutritional requirements.
Dehydrated rosehip and blueberry, black tea, and rooibos exhibit a hue corresponding to the first quadrant, with rooibos contributing the highest a* component, imparting a reddish-copper color to the infusion. In the case of yacón, it has a hue angle value corresponding to the second quadrant, meaning greenish tones. The surface color of the black tea-based infusion was found unattractive, whereas the rooibos-based infusion predominantly displayed the characteristic reddish hue of the base matrix.
Author Contributions
Conceptualization, C.A.P. and F.C.N.; methodology, C.A.P.; software, C.A.P.; validation, C.A.P. and F.C.N.; formal analysis, C.A.P.; investigation, C.A.P.; resources, C.A.P. and F.C.N.; data curation, C.A.P.; writing—original draft preparation, C.A.P.; writing—review and editing, C.A.P. and F.C.N.; visualization, C.A.P.; supervision, F.C.N.; project administration, C.A.P. and F.C.N.; funding acquisition, C.A.P. and F.C.N. All authors have read and agreed to the published version of the manuscript.
Funding
This research received no external funding.
Institutional Review Board Statement
Not applicable.
Informed Consent Statement
Not applicable.
Data Availability Statement
The original contributions presented in the study are included in the article, further inquiries can be directed to the corresponding author.
Conflicts of Interest
The authors declare no conflicts of interest.
References
- Romero-Cerecero, O.; Reyes-Morales, H.; Herrera-Arellano, A.; Lozoya-Legorreta, X.; Tortoriello, J. Acceptance of phytopharmaceuticals by doctors and patients in primary care clinics. Med. J. 2004, 42, 125–130. [Google Scholar]
- Cañigueral, S.; Vila, R. Principles of Phytotherapy. Medicinal Plants and Phytotherapy; General Council of Official Colleges of Pharmacists: Madrid, Spain, 2001; Volume 1, pp. 173–193. [Google Scholar]
- PubMed Central. Available online: https://www.ncbi.nlm.nih.gov/pubmed (accessed on 20 June 2024).
- Ballarín, M. Tea Time; Editorial LIBSA: Madrid, Spain, 2014. [Google Scholar]
- Bruzone, I. Fine Fruits in the Patagonian Mountain Valleys. Argent. Foods J. 2004, pp. 36–38. Available online: https://biblioteca.ucel.edu.ar/cgi-bin/koha/opac-detail.pl?biblionumber=48764 (accessed on 1 December 2024).
- Argentina Innovadora 2020; Ministerio de Ciencia, Tecnología e Innovación Productiva. Núcleo Socio-Productivo Estratégico. Procesamiento de Alimentos. Available online: https://www.argentina.gob.ar/sites/default/files/procesamiento-alimentos-doc.pdf (accessed on 19 February 2025).
- Ohaco Domínguez, E. Product Models to Optimize Convective Drying Equipment for Rosehip Fruits in Terms of Process Times and Final Product Quality. Ph.D. Thesis, National University of Bahía Blanca, Bahía Blanca, Argentina, 2012. [Google Scholar]
- Medina, M. Simple and rapid method for the analysis of phenolic compounds in beverages and grains. J. Agric. Food Chem. 2011, 59, 1565–1571. [Google Scholar] [CrossRef] [PubMed]
- Zhishen, J.; Mengcheng, T.; Jianming, W. The determination of flavonoid contents in mulberry and their scavenging effects on superoxide radicals. Food Chem. 1999, 64, 555–559. [Google Scholar] [CrossRef]
- Scherer, R.; Godoy, H. Antioxidant activity index (AAI) by the 2,2-diphenyl-1-picrylhydrazyl method. Food Chem. 2008, 112, 654–658. [Google Scholar] [CrossRef]
- American Public Health Association. Standard Methods for the Examination of Water and Wastewater, 18th ed.; APHA: Washington, DC, USA, 1992. [Google Scholar]
- Di Rienzo, J.A.; Casanoves, F.; Balzarini, M.G.; Gonzalez, L.; Tablada, M.; Robledo, C.W. InfoStat Versión 2020. Centro de Transferencia InfoStat, FCA, Universidad Nacional de Córdoba, Argentina. Available online: http://www.infostat.com.ar (accessed on 1 December 2024).
- Pietta, P. Flavonoids as antioxidants. J. Nat. Prod. 1999, 63, 1035–1042. [Google Scholar] [CrossRef] [PubMed]
- Middleton, E.; Kandaswami, C. The impact of plant flavonoids on mammalian biology: Implications for immunity, inflammation, and cancer. In The Flavonoids; Harborne, J.B., Ed.; Chapman and Hall: London, UK, 1994; pp. 619–652. [Google Scholar]
- Vera Tudela, R. Iced Infusions as Alternative Drinks in the National Market. Bachelor’s Thesis, University of Piura, Piura, Peru, 2003. [Google Scholar]
- World Health Organization (WHO). Guideline: Potassium Intake for Adults and Children; WHO: Geneva, Switzerland, 2012. [Google Scholar]
- Miñana, V. Oral rehydration with refreshing beverages: Risk of iatrogenic complications. Acta Pediatr. Esp. 2001, 60, 205–210. [Google Scholar]
- Argentine Food Code. Chapter XI. Article 888. Available online: https://www.argentina.gob.ar/sites/default/files/capitulo_xi_vegetales_actualiz_2024-8.pdf (accessed on 19 February 2025).
- Sharma, V.; Kumar, H.; Rao, L.J. Influence of milk and sugar on antioxidant potential of black tea. Food Res. Int. 2008, 41, 124–129. [Google Scholar] [CrossRef]
- Su, Y.; Leung, L.; Huang, Y.; Chen, Z. Stability of tea theaflavins and catechins. Food Chem. 2003, 83, 189–195. [Google Scholar]
- Chen, Z.; Zhou, B.; Yang, L.; Wu, L.; Liu, Z. Antioxidant activity of green tea polyphenols against lipid peroxidation initiated by lipid-soluble radicals in micelles. J. Chem. Soc. Perkin Trans. 2001, 2, 1835–1839. [Google Scholar] [CrossRef]
- Das, A.; Gantait, S.; Mandal, N. Micropropagation of an elite medicinal plant: Stevia rebaudiana Bert. Int. J. Agric. Res. 2011, 6, 40–48. [Google Scholar] [CrossRef]
- Santamaría, Á. Stevia and Other Healthy Sweeteners in the Formulation of Functional Candies: Technological and Quality Implications. Ph.D. Thesis, Polytechnic University of Valencia, Valencia, Spain, 2014. [Google Scholar]
- Shalaby, E.; Mahmoud, G.; Shanab, S.M. Suggested mechanism for the effect of sweeteners on radical scavenging activity of phenolic compounds in black and green tea. Front. Life Sci. 2016, 9, 241–251. [Google Scholar] [CrossRef]
- Goyal, S.; Samsher, G.; Goyal, R. Stevia (Stevia rebaudiana) a bio-sweetener: A review. Int. J. Food Sci. Nutr. 2010, 61, 1–10. [Google Scholar] [CrossRef] [PubMed]
- Criado, M.; Barba, F.; Frígola, A.; Rodrigo, D. Effect of Stevia rebaudiana on oxidative enzyme activity and its correlation with antioxidant capacity and bioactive compounds. Food Bioprocess Technol. 2014, 7, 1518–1525. [Google Scholar] [CrossRef]
- Morales Orjuela, L. Antioxidant and Antimicrobial Activity of the Plant Extract Obtained from a Commercial Cultivation of Stevia Rebaudiana Located in Olaya (Antioquia). Bachelor’s Thesis, University of Tolima, Ibagué, Colombia, 2017. [Google Scholar]


Disclaimer/Publisher’s Note: The statements, opinions and data contained in all publications are solely those of the individual author(s) and contributor(s) and not of MDPI and/or the editor(s). MDPI and/or the editor(s) disclaim responsibility for any injury to people or property resulting from any ideas, methods, instructions or products referred to in the content. |
© 2025 by the authors. Licensee MDPI, Basel, Switzerland. This article is an open access article distributed under the terms and conditions of the Creative Commons Attribution (CC BY) license (https://creativecommons.org/licenses/by/4.0/).