Abstract
Studies on the influence of latitudinal and elevation gradient on species diversity, richness, and evenness are significant. The present study attempts to document the elevational distribution of nymphalidae butterflies in the surrounding regions outside the jurisdiction of the protected areas of the Eastern Himalayas. Determination of diversity, evenness, richness, dominance, and Gini’s coefficient was undertaken across six elevational belts (≤1500 masl, 1501–2000 masl, 2001–2500 masl, 2501–3000 masl, 3001–3500 masl, ≥3501 masl). The highest values of diversity (H’ = 6.34) and species richness (R1 = 2.497; R2 = 12.01) were represented by a mid-elevation peak at 2501–3000 masl. However, evenness values (E = 1.424; EBG = 0.951; Eq = 0.987) were greatest at ≥3501 masl. Topographical uniqueness coupled with the formation of cloud cover at higher elevation may provide a habitat sustaining montane forest specialist species. Such differences in elevation could probably influence the diversity and distribution of nymphalidae, with immense ecological significance.
Keywords:
elevation; butterflies; dominance; distribution; diversity; evenness; nymphalidae; species richness 1. Introduction
Studies on the distribution patterns of species must include not only an understanding of their specific ecological requirements, but also of their geographical context, which shapes the structure and dynamics of species’ geographical range [1]. The Himalayan region’s varying elevational gradients create alterations in vegetation composition in response to climate change. This, in turn, harbors butterfly communities of varying diversity and species richness. Refs. [2,3,4] have stressed the distribution of butterflies across high-elevation forests of the Himalayas. Ref. [5] opined that butterfly density, diversity, and richness depend largely on the presence of their specific host plants. Interaction with larval host plants appears to be an important aspect of biological diversification, and such interactions are probably determined by nutrient content, plant phenology, and geographical distribution [6,7,8]. Ref. [9] has also found a significant correlation between butterfly species richness and vegetation richness under similar environmental conditions. The usage of several indices could prove beneficial in interpreting the distribution of species, which, in turn, influence biodiversity.
Studies on the occurrence of butterfly species across the Himalayan regions are plentiful [10,11,12,13,14]. Although [15] discussed the elevational distribution of butterfly species, such information with regard to the surroundings of the protected regions of the Eastern Himalayan landscape, West Bengal, is scarce. The present study was designed to investigate the diversity, evenness, dominance, and richness of butterfly species from forest fringes adjacent to the protected regions of West Bengal, India.
2. Materials and Methods
2.1. Study Area
The entire study was undertaken in the surroundings outside the jurisdiction of the protected areas of Singalika National Park (27°07′ N, 88°04′ E), Neora Valley National Park (27°04′ N, 88°42′ E), Gorumara National Park (26.7° N, 88.8° E), and Buxa Tiger Reserve (26°39′0″ N, 89°34′48″ E). The study was conducted between March 2023 and February 2024. The entire study site was divided into six elevational belts (≤1500 masl, 1501–2000 masl, 2001–2500 masl, 2501–3000 masl, 3001–3500 masl, ≥3501 masl) in the forest fringes adjacent to the protected areas across the Eastern Himalayan landscape, West Bengal, India.
2.2. Sampling Protocol
Within each elevational belt, transects (500–800 m) were established at suitable and accessible locations. Within each transect, 12 permanent points were established. At each point, butterfly species within a radius of 5 m were observed for 5 min. This sampling procedure was repeated three times every month during the entire period. Importantly, sampling was undertaken on sunny days between 10:00 h to 14:00 h to ensure the recording of optimal data. The restriction of sampling to sunny days (less than 30% cloud cover) as much as possible was due to the total absence or reduction in butterfly activity on windy or cloudy days [16]. Therefore, it was determined that the sampling of butterfly species only during sunny days would probably not interfere with data compilation and analytics.
Butterflies were identified in the field with the help of illustrated guidebooks [17,18]. However, butterflies that could not be identified in the field were photographed for subsequent identification by a taxonomist.
2.3. Data Analysis
Determination of species diversity (Shannon index “H’”), species evenness (Pielou index “E”, Buzas and Gibson index “EB”, equitability index “Eq”), species richness (Menhinick index “R1”, Margalef index “R2”), species dominance (Berger–Parker dominance “D”), and Gini’s coefficient was performed using the Biodiversity package in R version 2.5-6 software.
The Shannon diversity index (H’) of butterfly species across different elevational belts in the study site is calculated using the formula H’ =Σ pi(ln pi), where pi = ni/N. Here, “ni” is the number of individuals of the ith species, and N = Σ ni [19]. Pielou’s species evenness index (E) is determined using the formula H’/ln(S), where “H’” is the Shannon diversity index and “S” is the total number of species in a study area [19]. The Buzas and Gibson index (EB) is obtained using the formula: e − Σi(ni/Nln(ni/N))/S, where “ni” is the number of species of individuals of the ith species, “N” is the total number of individuals, and “S” is the total number of species in the study area [20]. The equitability index (Eq) is derived using formula −Σi(ni/N − ln(ni/N))/lnN, where “ni” is the number of species of individuals of the ith species and “N” is the total number of individuals in the study area [19]. The Menhinick index of species richness (R1) is ascertained using the formula S/√Σini, where “ni” is the number of species of individuals of the ith species and “S” is the total number of species in the study area. Margalef’s index of species richness (R2) is determined using the formula S − 1/lnN, where “S” is the total number of species and “N” is the total number of individuals across the study area [19]. Berger–Parker dominance index (D) is obtained using the formula Nmax/N, where “Nmax” is the number of individuals in the most abundant species and “N” is the total number of individuals in the study area [21]. The Gini coefficient (G) measures the extent of inequality in the distribution of species across the study site. It measures the level of inequality on a scale from 0 to 1, with higher values close to 1 indicating greater inequality in species distribution [22].
3. Results
A total of 88 species of nymphalidae butterflies were recorded across six elevational belts in the study area. Importantly, 2001–2500 masl harbored a maximum number of individuals (1462) and maximum number of species (87). In contrast, the minimum number of individuals (401) and minimum number of species (45) were encountered ≥3501 masl (Table 1).

Table 1.
Distribution of nymphalidae butterflies across elevational gradients.
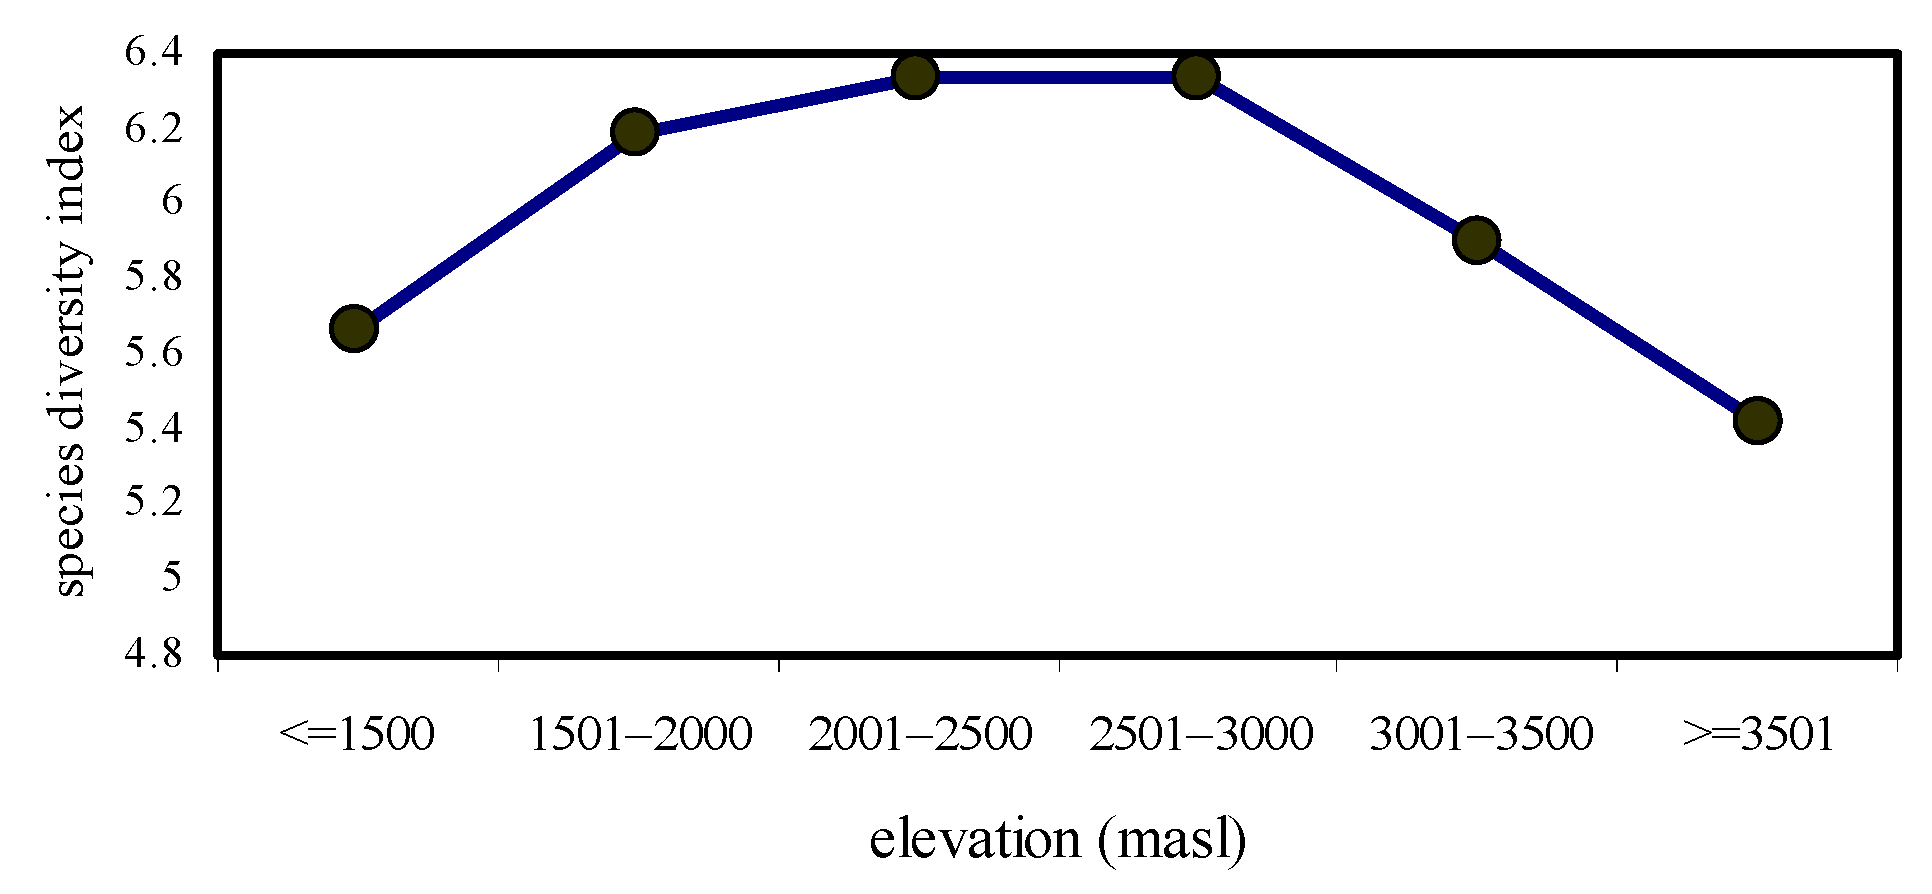
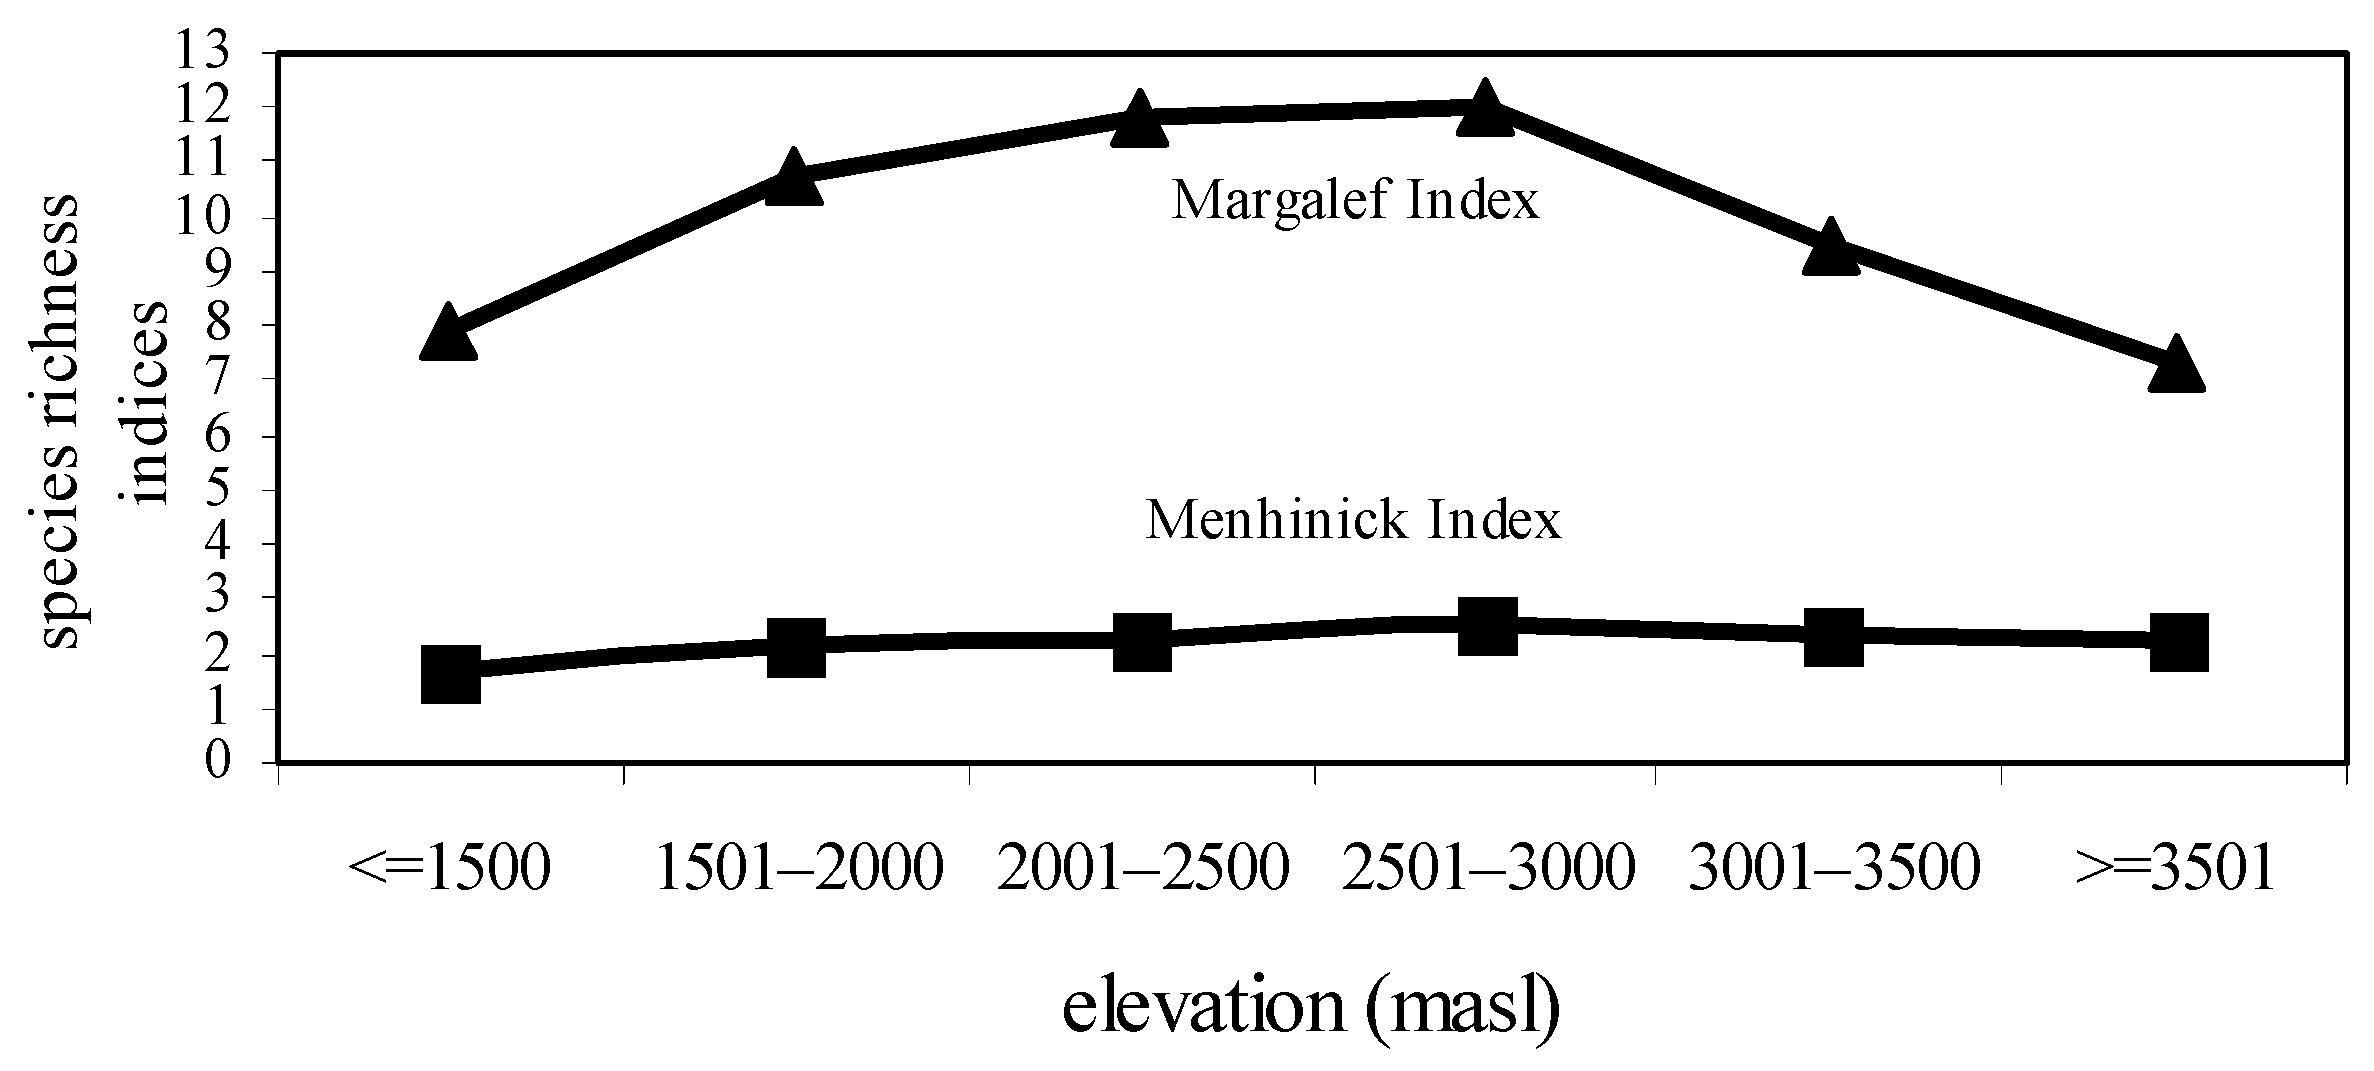
The highest species diversity (H’ = 6.34) and species richness values (R1 = 2.497; R2 = 12.01) were observed at 2501–2500 masl. However, the lowest species diversity (H’ = 5.42) and species richness values (R1 = 2.247; R2 = 7.341) were noted at ≥3501 masl. The formation of a mid-elevation peak in species diversity and species richness was the characteristic feature of this study (Figure 1 and Figure 2).
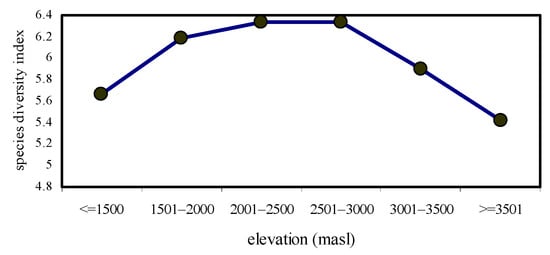
Figure 1.
Species diversity values of nymphalidae across elevational gradients.
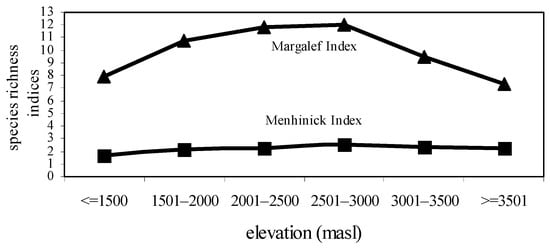
Figure 2.
Species richness values of nymphalidae across elevational gradients.
Evenness in species distribution was observed to be highest at ≥3501 masl (E = 1.424; EB = 0.952; Eq = 0.987). On the contrary, species evenness was reported to be lowest at ≤1500 masl (E = 1.402; EB = 0.892; Eq = 0.972) (Table 2).
Table 2.
Values of species evenness, species dominance, and Gini coefficient across elevational gradients.
Significantly, butterfly species were most dominant at ≤1500 masl (D = 0.047) (Table 2). Additionally, ≤1500 masl also represented the greatest inequality in species distribution (G = 0.264). However, ≥3501 masl had a highly homogenous species distribution, with the lowest “G” values (0.153) (Table 2).
4. Discussion
Heterogeneous environmental conditions with fluctuating floristic composition and structure influence the distribution of butterflies in a non-random manner. Significantly, in a world witnessing constant change, climatic variations can be studied rather effectively across elevational gradients as compared to latitude, thereby influencing the sustenance of montane communities [23]. Any elevational changes are known to positively or negatively alter the functioning of an insect system [24]. Significantly, investigation of the changing trends of species diversity, richness, evenness, and dominance across elevational gradients could prove beneficial for biodiversity studies.
Measurements of diversity, richness, evenness, and dominance are traditionally recognized as the four pillars determining community structure. The selection of a specific index is essential in assessing the habitat heterogeneity in a forest ecosystem. Further, in order to achieve sustainability in forest management during ongoing climate change, standardization of such indices would be helpful [22]. The most popular tool for quantifying species diversity, the Shannon index combines two aspects of diversity: the number of species and the abundance of species [25]. Although it is better suited for devising classical forest inventory [26], the Gini coefficient measures the degree of inequality in the distribution of species [22]. Species evenness reflects the distribution of species, with lesser values of species evenness denoting greater rarity in species distribution. Buzas and Gibson’s measure of evenness is used to demonstrate the concept of species dispersion in the log series [20]. Thus, with an increase in the number of individuals and the number of species, for a log series distribution, Pielou’s evenness (E) and Buzas–Gibson (EBG) values decrease [20]. Importantly, communities dominated by a single species possessing lower evenness yields reduced productivity, with less stability [27]. Thus, dominance can be considered to be property of individual species, with dominant species in a community possessing a greater dominance index against subordinate species assigned with lower (negative) values [28]. Dominance thereby highlights the effect of diversity on community stability and ecosystem function [29]. The Berger–Parker dominance index is probably the most effective tool recognized for monitoring biodiversity. In case of any linearly distributed population, the fraction of total sampled individuals denoted by the most abundant species is known as Berger–Parker index [21]. Widely studied indices of species richness (Menhinick index and Margalef index) show greater ability to differentiate between ecosystems [19].
The highest species dominance observed in this study at the lowest elevation belt (≤1500 masl) could probably be associated with the abundance of resources (both biotic and abiotic) for tropical species. Thermal energy is crucial for basic physiology, affecting feeding requirements by influencing water availability in dietary resources (i.e., nectar, mud puddles, and fruit juices) [18,30]. Greater availability of resources could be linked to larger inequality in the distribution of butterflies, leading to higher values of Gini’s coefficient at ≤1500 masl in this study. On the contrary, the lowest value of Gini’s coefficient at higher elevation (≥3501 masl) could probably be indicative of the least inequality or greater homogeneity in species distribution. This could probably be linked to the highest evenness indices (E, EBG, and Eq) at ≥3501 masl observed during the present investigation.
The Himalayan region creates an ecologically unique spectrum of environmental conditions, in turn supporting varied climatic gradients across elevational belts [31,32]. A unimodal pattern of species distribution (mid-elevation peak) along elevational gradients has been observed among differing insect groups [33,34,35,36]. A hump-shaped pattern of species representation across varying elevation bands has been discussed for lepidopterans [37,38,39].
The first ever attempt to examine the elevational-range-based distribution of butterflies in the Eastern Himalayas using Rapoport’s rule has been presented by [40]. The present study also shows a hump-shaped pattern in species diversity and richness, with a peak at 2501–3000 masl. Larger-range species were considered to overlap in the middle of the geographical domain, perhaps leading to the creation of the distinct mid-elevation peak in diversity and richness also observed by [41]. Refs. [42,43] have witnessed a similar pattern in the distribution of species on the basis of geographical constraints. Climate change is associated with an upward shift in the community elevation score in butterfly communities [44,45]. Loss of higher-elevation species in the lowland coupled with the range expansion of lowland species into mid-elevation bands perhaps contributed to the increase in species richness at intermediate elevation [46].
Climate has a significant impact on butterfly distribution. Temperature decreases with increasing elevation, whereas moisture availability shows a positive trend. These are the two important factors determining butterfly biology, as well as host plant growth and survival. However, these two factors could be considered to be highest at intermediate elevation, in turn leading to peak in-species diversity and richness at intermediate elevation, which has been shown in this study as well as previous studies [47]. Additionally, actual evapotranspiration (AET) strongly dictates butterfly distribution [48]. AET is reported to decline strongly at higher elevation [49], probably leading to the decrease in species richness at higher elevation seen in this study. Species belonging to such a stressful habitat are recognized for devising different life history strategies for survival. Ref. [50] reported a decline in diet breadth among temperate butterflies colonizing higher elevations. With the highest-elevation species sharing close affinity with temperate zone inhabitants in the study, the reduction in distribution, diversity, and richness in this zone (≥3501 masl) could be due to a lower diet breadth among nymphalidae. Decreased butterfly diversity at higher elevation might be associated with environmental factors such as reduced temperature and precipitation [32,48,51] and lower vegetation richness [9,52]. Harsh weather conditions, especially snow cover in the montane environment, also restrict the distribution of species [53,54]. Significantly, the occurrence of Ypthima nareda, Y. sakra, Aulocera swaha, and Callerebia scanda at the highest elevations (3001–3500 masl and ≥3501 masl), probably with their associates (i.e., Ergrostis pilosa, Imperata cylindrica, Poa annua, and Digitaria ciliata, respectively), illustrates strict monophagy. Extreme climatic conditions could perhaps affect the occurrence of plant species, in turn restricting their distribution or leading to their extinction. Arundinaria maling and A. aristata, with localized distribution at this elevation, could also interfere with the occurrence of Lethe verma, L. latiaris, L. scanda, L. serbonis, and L. insana. The highly specific relationship of Araschnia with Urtica probably justifies the restricted distribution of such species in montane environments.
Such interplay between rainfall patterns, temperature variation, and climatic conditions profoundly impact the vegetation types across the study area. Forest types ranging from lower-elevation tropical (moist to dry deciduous, semi-evergreen) to sub-tropical (broad-leaved hill-pine forest), leading to wet temperate forests along with the virgin forest tracts of Rhododendron, Magnolia, and Machilus at the highest elevation [55], help in shaping the community structure, contributing to the productivity and resilience of this vital ecosystem. Functionally, the Himalayan forest ecosystem shares more affinities with tropical than temperate forests. The Himalayas are characterized by trees reaching their peak physiological activities during autumn, when soil moisture is quite high owing to monsoonal precipitation, which is characterized by sunny days with milder temperature [56].
5. Conclusions
Designing similar studies for other areas adjoining the protected areas of the Himalayan landscape could probably be insightful. Importantly, the surrounding regions of protected areas represent disturbed or moderately disturbed habitats with higher levels of biodiversity [57]. In accordance with the intermediate disturbance hypothesis (IDH), which posits a unimodal relationship between distribution and diversity [58], future investigations need to be conducted regarding butterfly assemblages in such regions of ecological significance.
Funding
This research received no external funding.
Informed Consent Statement
Not applicable.
Data Availability Statement
Data are unavailable.
Acknowledgments
The author is highly grateful to Narayan Ghorai for his valuable suggestions and cooperation during the study. The constant support and encouragement of the faculty members of the Department of Zoology, West Bengal State University, is also acknowledged.
Conflicts of Interest
The author declares no conflicts of interest.
References
- Storch, D.; Konvicka, M.; Benes, J.; Martinková, J.; Gaston, K.J. Distribution patterns in butterflies and birds of the Czech Republic: Separating effects of habitat and geographical position. J. Biogeogr. 2003, 30, 1195–1205. [Google Scholar] [CrossRef]
- Arora, G.S. Lepidoptera: Rhopalocera. Fauna of Western Himalaya (UP). Zool. Surv. India. Ecol. Surv. 1995, 1, 61–73. [Google Scholar]
- Uniyal, V.P.; Mathur, P.K. Diversity of Butterflies in Great Himalayan National Park, Western Himalaya. Indian J. For. 1998, 21, 150–155. [Google Scholar]
- Joshi, P.C.; Kothari, K.; Badoni, V.P.; Arya, M.; Agarwal, A. Species composition and density of entomofauna vis a vis alti-tudinal variations and disturbances in Nanda Devi Biosphere Reserve, Uttaranchal, India. Asian J. Microbiol. Biotech-Nology Environ. Sci. 2004, 6, 301–308. [Google Scholar]
- Koh, L.P. Impacts of land use change on South-east Asian forest butterflies: A review. J. Appl. Ecol. 2007, 44, 703–713. [Google Scholar] [CrossRef]
- Basset, Y. The seasonality of arboreal arthropods foraging within an Australian rainforest tree. Ecol. Èntomol. 1991, 16, 265–278. [Google Scholar] [CrossRef]
- Basset, Y. Leaf production of an overstorey rainforest tree and its effects on the temporal distribution of associated insect herbivores. Oecologia 1991, 88, 211–219. [Google Scholar] [CrossRef]
- Slansky, F.J. Nutritional ecology: The fundamental quest for nutrients. In Caterpillars: Ecological and Evolutionary Constraints on Foraging; Stamp, N.E., Casey, T.M., Eds.; Chapman & Hall: New York, NY, USA, 1993; pp. 29–91. [Google Scholar]
- Hawkins, B.A.; Porter, E.E. Water–energy balance and the geographic pattern of species richness of western Palearctic butterflies. Ecol. Èntomol. 2003, 28, 678–686. [Google Scholar] [CrossRef]
- Devi, R.; Kumar, P.; Mattu, V.K. An assessment of diversity patterns of butterfly fauna (Lepidoptera: Papilionoidea) from subalpine zone of Western Himalaya. Orient. Insects 2023, 57, 1084–1101. [Google Scholar] [CrossRef]
- Bisht, M.; Goswami, D.; Uniyal, V.P.; Singh, V. Diversity of butterfly along different altitudinal gradient of Munsiyari, Western Himalayan, Uttarakhand, India. Asian J. Conserv. Biol. 2023, 12, 258–265. [Google Scholar]
- Sidhu, A. An assessment and distribution of butterflies (Lepidoptera: Papilionoidea) in Sangla Valley (District Kinnaur: Himachal Pradesh). J. Agric. Ecol. 2023, 15, 36–44. [Google Scholar] [CrossRef]
- Dewan, S.; Chettri, I.K.; Limboo, A.H.S.; Acharya, B.K. Butterflies of the Indian Himalaya along with Nepal and Bhutan. In Biodiversity Hotspot of the Himalaya Pullaiah; Apple Academic Press: Palm Bay, FL, USA, 2024; pp. 271–292. [Google Scholar]
- Sharma, N. Inventory of butterflies (Insecta: Lepidoptera: Papilionoidea) of Itanagar wildlife sanctuary, Arunachal Pradesh. Ann. Entomol. 2023, 41, 68. [Google Scholar]
- Shrestha, B.R.; Baral, S.; Budha-Magar, S.; Magar, K.T.; Gaudel, P.; Suwal, S.P.; Tamang, S.R.; Dewan, A.; Gurung, M.B.; Shrestha, P. Vegetation productivity determines the response of butterflies along elevation gradients in the trans-Himalayas, Nepal. Ecosphere 2024, 15, e70019. [Google Scholar] [CrossRef]
- Weiss, S.B.; Murphy, D.D.; White, R.R. Sun, slope, and butterflies: Topographic determinants of habitat quality for euphydryas editha. Ecology 1988, 69, 1486–1496. [Google Scholar] [CrossRef]
- Haribal, M. The Butterflies of Sikkim Himalaya and Their Natural History. Sikkim. Sikkim Natural Conservation Foundation; Gangtok: Sikkim, India, 1992; p. 217. [Google Scholar]
- Kehimkar, I. The Book of Indian Butterflies. Bombay Natural History Society; Oxford University Press: New Delhi, India, 2008. [Google Scholar]
- Magurran, A.E. Ecological Diversity and Its Measurement; Primceton University Press: Princeton, NJ, USA, 1988; p. 179. [Google Scholar]
- Buzas, M.A.; Hayek, L.-A.C. On richness and evenness within and between communities. Paleobiology 2005, 31, 199–220. [Google Scholar] [CrossRef]
- Caruso, T.; Pigino, G.; Bernini, F.; Bargagli, R.; Migliorini, M. The Berger–Parker index as an effective tool for monitoring the biodiversity of disturbed soils: A case study on Mediterranean oribatid (Acari: Oribatida) assemblages. Biodivers. Conserv. 2006, 16, 3277–3285. [Google Scholar] [CrossRef]
- Reich, K.F.; Kunz, M.; Bitter, A.W.; von Oheimb, G. Do different indices of forest structural heterogeneity yield consistent results? Ifor.-Biogeosci. For. 2022, 15, 424. [Google Scholar] [CrossRef]
- McDonald, K.A.; Brown, J.H. Using montane mammals to model extinctions due to global change. Conserv. Biol. 1992, 6, 409–415. [Google Scholar] [CrossRef]
- Hodkinson, I.D. Terrestrial insects along elevation gradients: Species and community responses to altitude. Biol. Rev. 2005, 80, 489–513. [Google Scholar] [CrossRef]
- Liang, J.; Buongiorno, J.; Monserud, R.A.; Kruger, E.L.; Zhou, M. Effects of diversity of tree species and size on forest basal area growth, recruitment, and mortality. For. Ecol. Manag. 2007, 243, 116–127. [Google Scholar] [CrossRef]
- Lexerød, N.L.; Eid, T. An evaluation of different diameter diversity indices based on criteria related to forest management planning. For. Ecol. Manag. 2005, 222, 17–28. [Google Scholar] [CrossRef]
- Rodriguez, S.; Martin, A.P.; Sousa-Pinto, I.; Arenas, F. Biodiversity effects on macroalgal productivity: Exploring the roles of richness, evenness and species traits. Mar. Ecol. Prog. Ser. 2016, 562, 79–91. [Google Scholar] [CrossRef]
- Crase, B.; Vesk, P.A.; Liedloff, A.; Wintle, B.A. Modelling both dominance and species distribution provides a more complete picture of changes to mangrove ecosystems under climate change. Glob. Chang. Biol. 2015, 21, 3005–3020. [Google Scholar] [CrossRef] [PubMed]
- Ma, Z.; Ellison, A.M. A unified concept of dominance applicable at both community and species scales. Ecosphere 2018, 9, e02477. [Google Scholar] [CrossRef]
- Fleishman, E.; Thomson, J.R.; Mac Nally, R.; Murphy, D.D.; Fay, J.P. Using indicator species to predict species richness of multiple taxonomic groups. Conserv. Biol. 2005, 19, 1125–1137. [Google Scholar] [CrossRef]
- Bhattacharjee, A.; Anadón, J.D.; Lohman, D.J.; Doleck, T.; Lakhankar, T.; Shrestha, B.B.; Thapa, P.; Devkota, D.; Tiwari, S.; Jha, A.; et al. The impact of climate change on biodiversity in Nepal: Current knowledge, lacunae, and opportunities. Climate 2017, 5, 80. [Google Scholar] [CrossRef]
- Ehl, S.; Böhm, N.; Wörner, M.; Rákosy, L.; Schmitt, T. Dispersal and adaptation strategies of the high mountain butterfly Boloria pales in the Romanian Carpathians. Front. Zool. 2019, 16, 1. [Google Scholar] [CrossRef]
- Betz, O.; Srisuka, W.; Puthz, V. Elevational gradients of species richness, community structure and niche occupation of tropical rove beetles (Coleoptera: Staphylinidae: Steninae) across mountain slopes in Northern Thailand. Evol. Ecol. 2020, 34, 193–216. [Google Scholar] [CrossRef]
- Longino, J.T.; Branstetter, M.G. The truncated bell: An enigmatic but pervasive elevational diversity pattern in middle American ants. Ecography 2018, 42, 272–283. [Google Scholar] [CrossRef]
- Maicher, V.; Sáfián, S.; Murkwe, M.; Delabye, S.; Przybyłowicz, Ł.; Potocký, P.; Kobe, I.N.; Janeček, Š.; Mertens, J.E.J.; Fokam, E.B.; et al. Seasonal shifts of biodiversity patterns and species’ elevation ranges of butterflies and moths along a complete rainforest elevational gradient on Mount Cameroon. J. Biogeogr. 2019, 47, 342–354. [Google Scholar] [CrossRef]
- Toko, P.S.; Koane, B.; Molem, K.; Miller, S.E.; Novotny, V. Ecological trends in moth communities (Geometridae, Lepi-doptera) along a complete rainforest elevation gradient in Papua New Guinea. Insect Conserv. Divers. 2023, 16, 649–657. [Google Scholar] [CrossRef]
- Fleishman, E.; Austin, G.T.; Weiss, A.D. An empirical test of Rapoport’s elevational rule: Elevational gradients in montane butterfly communities. Ecology 1998, 79, 2482–2493. [Google Scholar]
- Stefanescu, C.; Carnicer, J.; Peñuelas, J. Determinants of species richness in generalist and specialist Mediterranean butterflies: The negative synergistic forces of climate and habitat change. Ecography 2010, 34, 353–363. [Google Scholar] [CrossRef]
- Gutiérrez, D. Butterfly richness patterns and gradients. In Biology of Butterflies in Europe; Settele, J., Shreeve, T., Konvička, M., van Dyck, H., Eds.; Cambridge University Press: Cambridge, UK, 2009; pp. 281–295. [Google Scholar]
- Dewan, S.; Acharya, B.K. Rapoport’s rule explains the range size distribution of butterflies along the Eastern Himalayan elevation gradient. Biotropica 2024, 56, e13311. [Google Scholar] [CrossRef]
- Dewan, S.; Acharya, B.K.; Vetaas, O.R.; Ghatani, S. Do sub-groups of butterflies display different elevational distribution patterns in the Eastern Himalaya, India? Front. Biogeogr. 2021, 13, 1–19. [Google Scholar] [CrossRef]
- Jetz, W.; Rahbek, C. Geographic range size and determinants of avian species richness. Science 2002, 297, 1548–1551. [Google Scholar] [CrossRef] [PubMed]
- Colwell, R.K.; Rahbek, C.; Gotelli, N.J. The mid-domain effect and species richness patterns: What have we learnt so far? Am. Nat. 2004, 163, E1–E23. [Google Scholar] [CrossRef] [PubMed]
- Chen, S.; Mao, L.; Zhang, J.; Zhou, K.; Gao, J. Environmental determinants of geographic butterfly richness pattern in eastern China. Biodivers. Conserv. 2014, 23, 1453–1467. [Google Scholar] [CrossRef]
- Nieto-Sánchez, S.; Gutiérrez, D.; Wilson, R.J. Long-term change and spatial variation in butterfly communities over an elevational gradient: Driven by climate, buffered by habitat. Divers. Distrib. 2015, 21, 950–961. [Google Scholar] [CrossRef]
- Kerner, J.M.; Krauss, J.; Maihoff, F.; Bofinger, L.; Classen, A. Alpine butterflies want to fly high: Species and communities shift upwards faster than their host plants. Ecology 2022, 104, e3848. [Google Scholar] [CrossRef]
- Stefanescu, C.; Herrando, S.; Páramo, F. Butterfly species richness in the north-west Mediterranean Basin: The role of natural and human-induced factors. J. Biogeogr. 2004, 31, 905–915. [Google Scholar] [CrossRef]
- Acharya, B.K.; Vijayan, L. Butterfly diversity along the elevation gradient of Eastern Himalaya, India. Ecol. Res. 2015, 30, 909–919. [Google Scholar] [CrossRef]
- Trabucco, A.; Zomer, R.J. Global Soil Water Balance Geospatial Database. CGIAR Consortium for Spatial Information. 2010. Available online: https://doi.org/10.6084/m9.figshare.7707605.v3 (accessed on 12 December 2024).
- Pellissier, L.; Fiedler, K.; Ndribe, C.; Dubuis, A.; Pradervand, J.; Guisan, A.; Rasmann, S. Shifts in species richness, herbivore specialization, and plant resistance along elevation gradients. Ecol. Evol. 2012, 2, 1818–1825. [Google Scholar] [CrossRef]
- Pollard, E. Temperature, rainfall and butterfly numbers. J. Appl. Ecol. 1988, 25, 819–828. [Google Scholar] [CrossRef]
- Rahbek, C. The role of spatial scale and the perception of large-scale species-richness patterns. Ecol. Lett. 2004, 8, 224–239. [Google Scholar] [CrossRef]
- Rasmann, S.; Alvarez, N.; Pellissier, L. The altitudinal niche-breadth hypothesis in insect-plant interactions. Annu. Plant Rev. Insect Plant Interact. 2014, 47, 339–359. [Google Scholar]
- Chettri, N. Distribution of butterflies along a trekking corridor in the Khangchendzonga Biosphere Reserve, Sikkim, Eastern Himalayas. Conserv. Sci. 2015, 3, 1–10. [Google Scholar] [CrossRef]
- Champion, H.G.; Seth, S.K. A Revised Survey of the Forest Types of India; Government of India Press: New Delhi, India, 1968; p. 404. [Google Scholar]
- Singh, S.P. Attributes of Himalayan forest ecosystems: They are not temperate forests. Proc. Indian Natl. Sci. Acad. 2014, 80, 221. [Google Scholar] [CrossRef]
- Mercado-Gόmez, Y.L.; Mercado-Gόmez, J.D.; Giraldo-Sánchez, C.E. What do butterflies tell us about an intermediate dis-turbance in a dry tropical forest context? Diversity 2023, 15, 927. [Google Scholar] [CrossRef]
- Bendix, J.; Wiley, J.J.; Commons, M.G. Intermediate disturbance and patterns of species richness. Phys. Geogr. 2017, 38, 393–403. [Google Scholar] [CrossRef]
Disclaimer/Publisher’s Note: The statements, opinions and data contained in all publications are solely those of the individual author(s) and contributor(s) and not of MDPI and/or the editor(s). MDPI and/or the editor(s) disclaim responsibility for any injury to people or property resulting from any ideas, methods, instructions or products referred to in the content. |
© 2025 by the author. Licensee MDPI, Basel, Switzerland. This article is an open access article distributed under the terms and conditions of the Creative Commons Attribution (CC BY) license (https://creativecommons.org/licenses/by/4.0/).