Abstract
Studies on the toxicity of cyanobacterial products on plant cytoskeleton have so far focused on the effects of microcystins (MCs), cyanobacterial toxins that inhibit protein phosphatases 1 and 2A, enzymes which are involved in plant cytoskeleton (microtubules and F-actin) organization and cell cycle progression. In this study, we investigated the effects of extracts from two non-microcystin-producing (NMP) cyanobacterial strains, Microcystis viridis TAU-MAC 1810 and Planktothrix agardhii TAU-MAC 0514, on the cytoskeleton and cell cycle of Oryza sativa (rice) root cells. Rice seedling roots were exposed for various time periods (1, 12 and 24 h) to aqueous extracts of the aforementioned strains. Treated root tips underwent either immunostaining for α-tubulin or staining of F-actin with fluorescent phalloidin, and DAPI staining of DNA. Fluorescent specimens were observed by confocal laser scanning microscopy (CLSM). Corrected total cell fluorescence (CTCF) was measured to quantify F-actin disorder. To assess cell cycle alterations, cell cycle stage frequencies were calculated. In addition, Evans Blue staining was applied to determine dead cells. Treatment with the extracts affected microtubules and F-actin, as well as the cell cycle. These findings suggest that bioactive cyanobacterial compounds, apart from MCs, can disrupt the cytoskeleton and cell cycle progression in plant cells.
1. Introduction
Microcystins (MCs) are monocyclic heptapeptides, produced by several species of cyanobacteria [1]. They are potent hepatotoxins [2], but are also known to negatively affect plants [3,4]. In particular, the plant cytoskeleton (F-actin and microtubules) is an established target of MC variants [5,6], the toxicity of which lies in their ability to inhibit protein phosphatases 1 (PP1) and 2A (PP2A) [7], which participate in cytoskeleton organization [8] and cell cycle progression [9].
To date, extracts from cyanobacterial strains that produce MCs have been extensively used to study cytoskeletal and other physiological defects [3,5,10]. In this study, we investigated the effects of extracts from non-microcystin-producing (NMP) cyanobacterial strains on Oryza sativa (rice) meristematic root cells, focusing on the plant cytoskeleton and cell cycle.
2. Experiments
2.1. Culture of Cyanobacterial Strains and Biomass Extraction
Two NMP cyanobacterial strains of the TAU-MAC culture collection, Microcystis viridis TAU-MAC 1810 and Planktothrix aghardii TAU-MAC 0514 [11,12], were cultured using BG-11 medium in a 12:12 h light:dark cycle under white fluorescent lamps. Biomass was collected at the exponential growth phase, frozen and lyophilized. Dry biomass (150 mg for each strain) was dissolved in 75% (v/v) methanol, sonicated and eventually evaporated, according to [13]. The pellet was resuspended in 5 mL of double-distilled water (ddH2O). Extracts were filtered and stored at −20 °C.
2.2. Plant Material, Cyanobacterial Biomass Extraction and Treatments
Rice (Oryza sativa cv Axios) seeds were kindly provided by the National Cereal Institute (Thessaloniki, Greece) and were germinated on soaked filter paper at room temperature (24 ± 1 °C) in the dark. Four- to five-day-old seedlings were treated with aqueous cyanobacterial extracts for 1, 12 or 24 h, their roots being submerged in tubes containing the extract. For control, seedlings, similarly treated with ddH2O were used.
2.3. Tubulin Immunolabeling
Control and extract-treated root rips were fixed in 4% (w/v) paraformaldehyde (PFA) solution in PEM buffer (50 mM PIPES, 5 mM EGTA, 5 mM MgSO4, pH 6.8) +5% (v/v) dimethyl sulfoxide (DMSO) for 1 h. Cell wall digestion was performed with a 3% (w/v) Macerozyme R-10 + 3% (w/v) cellulase Onozuka R-10 solution in PEM buffer for 90 min. Root tips were squashed on coverslips coated with poly-l-lysine, and the squashes were left to dry. The adherent cells were extracted for 1 h with a 5% (v/v) DMSO + 1% (v/v) Triton X-100 solution in phosphate-buffered saline (PBS, pH 7.2). Rat anti-α-tubulin (YOL 1/34) as primary antibody (diluted 1:50 in PBS) and anti-rat IgG AlexaFluor 488 as secondary antibody (diluted 1:300 in PBS) were used. Specimens were incubated with each antibody overnight at room temperature. DNA was counterstained with 0.9 μM 4′, 6-diamidino-2-phenylindole (DAPI) for 5–10 min. Fluorescent specimens were mounted with anti-fade medium (PBS 1:2 glycerol (v/v) + 0.5% (w/v) p-phenylenediamine) and examined under a Zeiss Observer.Z1 microscope, equipped with the LSM780 confocal laser scanning (CLSM) module and the appropriate filters for each fluorophore. Imaging was achieved with ZEN2011 software, according to the manufacturer’s instructions.
2.4. F-Actin Labeling
F-actin of control and extract-treated root tips was pre-stabilized with 300 μM m-maleimidobenzoyl-N-hydroxysuccinimide ester (MBS) in PEM + 0.1% (v/v) Triton X-100 for 30 min in the dark. Fixation was performed with 4% (w/v) PFA in PEM + 5% (v/v) DMSO + 0.1% (v/v) Triton X-100 + DyLight 554-phalloidin 1:400, and fixed samples were washed with PEM buffer, extracted with 5% (v/v) DMSO + 1% (v/v) Triton X-100 in PBS for 1 h and incubated with DyLight 554-phalloidin (1:40 in PBS) at 37 °C for 2h. DAPI was used for DNA counterstaining. Samples were mounted with anti-fade medium and observed with the Zeiss Observer.Z1 microscope, equipped with the LSM780 confocal laser scanning module.
2.5. Fluorescence Intensity Measurements
Single cortical CLSM sections and maximum intensity projections of serial CLSM sections of control and extract-treated roots were measured for fluorescence intensity using ImageJ. The corrected total cell fluorescence (CTCF) was calculated using the equation:
CTCF = Integrated Density − (Area of Selected Cell × Mean Fluorescence of Background Readings)
Thirty individual cells from three different roots were measured for each treatment and data were statistically analyzed (ANOVA with Dunnett’s test).
2.6. Cell Cycle Analysis
Alterations in the cell cycle progression of extract-treated meristematic root cells were assessed with CLSM observations of whole-mount specimens, labelled for F-actin and stained with DAPI. Cell cycle stages (interphase, preprophase/prophase, metaphase/anaphase and cytokinesis) were recognized according to F-actin arrangement and/or chromatin state. At least 1000 meristematic cells from three different roots per treatment were counted. Statistical analysis of data (chi-squared test, df = 6) was performed, with a significance of P < 0.05.
2.7. Detection of Dead Cells
Control and extract-treated roots were stained with Evans Blue for the detection of dead cells, according to [14]. Roots were incubated in 0.25% (w/v) aqueous Evans Blue extract for 15 min, washed twice and incubated overnight in double-distilled water. Samples were then observed with a stereomicroscope.
3. Results
3.1. Cytoskeletal Alterations
3.1.1. Effects on F-Actin Organization
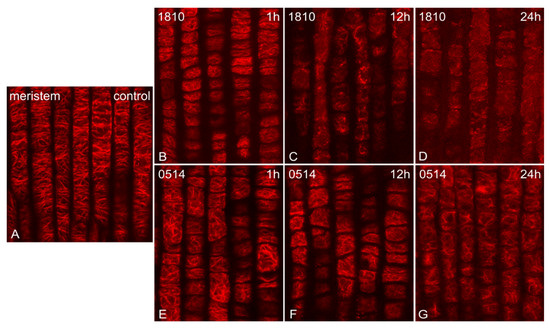
The extracts of both NMP strains induced time-dependent alterations on F-actin. The fine actin filaments observed in control root tips (Figure 1A) were significantly affected, starting from 1 h of treatment. Roots treated with the 1810 extract exhibited more severe alterations, ranging from bundling after 1 h of treatment (Figure 1B) to the formation of thick F-actin aggregates after 12 h (Figure 1C) and, eventually, the total collapse of F-actin network after 24 h (Figure 1D). Roots treated with the 0514 extract exhibited milder alterations, mainly disorientation, which was detectable at all time points and intensified progressively (Figure 1E–G).

Figure 1.
Single cortical CLSM sections of Oryza sativa root protodermal cells, stained for F-actin, either control (A) or treated with extracts from non-microcystin-producing (NMP) cyanobacterial strains: Microcystis viridis TAU-MAC 1810 (B–D) and Planktothrix aghardii TAU-MAC 0514 (E–G). Control meristematic cells exhibit a dense network of fine actin filaments, with a dominant transverse orientation (A). After 1 h of treatment, bundling (B) and disorientation of F-actin (E cf. A) are observed. After 12 h, roots treated with the 1810 extract exhibited actin aggregates and an overall actin network disorganization (C), while in roots treated with the 0514 extract, F-actin bundling intensified (F). After 24 h, the F-actin network either collapsed (D) or exhibited heavy bundling and disorientation (G).
3.1.2. Effects on F-Actin Fluorescence Intensity
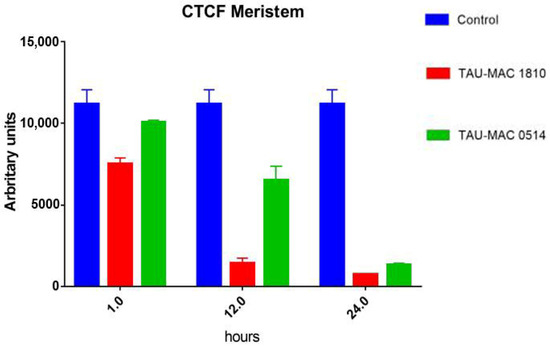
CTCF measurements (Figure 2) showed that fluorescence intensity in extract-treated meristematic root cells decreased progressively. Even after short treatments (1 h), the intensity was significantly lower compared to control cells. The lowest levels were recorded after 24 h.

Figure 2.
Graph exhibiting F-actin fluorescence intensity measurements in Oryza sativa root meristematic cells, stained for F-actin, either control (blue) or treated with extracts from NMP cyanobacterial strains: Microcystis viridis TAU-MAC 1810 (red) and Planktothrix aghardii TAU-MAC 0514 (green). Fluorescence intensity decreased significantly, in a time-dependent manner, in root cells treated with the extracts. Error bars represent standard error. All data show a statistical difference at P < 0.05. n = 30.
3.2. Effects on Microtubules and Chromatin
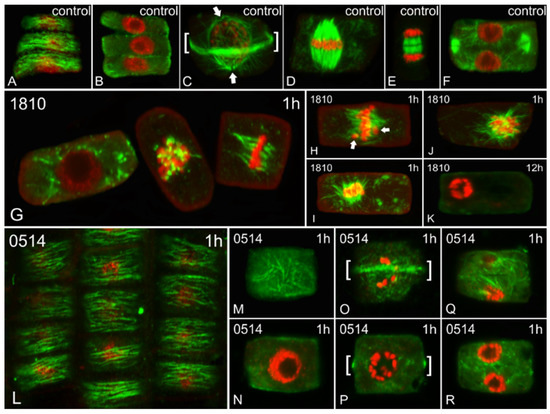
Both cyanobacterial extracts induced alterations in the microtubule network (Figure 3). Meristematic cells treated with the 1810 extract exhibited major defects after 1 h of treatment (Figure 3G–J), which eventually led to the disappearance of microtubules after 12 h, in parallel with abnormal chromatin condensation (Figure 3K). The effect of 0514 extract was not as acute, as only minor defects were observed after 1 h of treatment (L-R). No significant alterations were detected after longer treatments.

Figure 3.
Single cortical (A,L,M,O,Q), single central (B,F,G,N,P,R) and maximum intensity projections (C–E,H–K) of serial CLSM sections of Oryza sativa root meristematic cells, after α-tubulin immunostaining (green) and DNA staining with DAPI (pseudo-coloration in red). Cells depicted are either control (A–F) or treated for various time periods (indicated on each image) with extracts from non-microcystin-producing (NMP) cyanobacterial strains: Microcystis viridis TAU-MAC 1810 (G–K) and Plankothrix aghardii TAU-MAC 0514 (L–R). The images A and B, M and N, O and P, and Q and R depict the same cells at cortical and central sections. (A–F) Control cells at interphase exhibit dense, transverse cortical (A) and scarce endoplasmic (B) microtubules. Preprophase/prophase cells exhibit the typical preprophase band of microtubules (brackets in C), as well as perinuclear microtubules converging on two distinctive poles (arrows in C). Mitotic spindles with aligned chromosomes at the equator can be observed in control metaphase cells (D) and control cytokinetic cells exhibit typical phragmoplasts (early stage in E and later stage in F). (G–K) Cells treated with the 1810 for 1h exhibited numerous endoplasmic microtubules (left cell in G cf. B), abnormally short microtubules attached to chromosomes (middle cell in G) and malformed mitotic spindles (right cell in G cf. D). Misaligned chromosomes, outside the equator plate (arrows in H cf. D), can also be observed, as well as masses of chromosomes attached to aberrant spindle-like microtubules (I,J). After 12 h, no tubulin polymers could be detected, while chromatin was abnormally condensed (K). (L–R) Cells treated with the 0514 extract exhibited typical cortical microtubules at interphase after 1 h (L cf. A). Occasionally, interphase cells with disoriented cortical microtubules could be spotted (M cf. A), but they exhibited no endoplasmic microtubules (N). Certain affected preprophase cells exhibited almost typical preprophase bands of microtubules (brackets in O) but lacked perinuclear microtubules (P cf. C). Some cytokinetic cells exhibited abnormal phragmoplasts (Q, R cf. F).
3.3. Effects on Cell Cycle Progression
In root tips treated with the extracts, cell cycle stage frequencies were significantly altered, starting from 1h of treatment (Table 1). Treatment with the 1810 extract dramatically affected chromatin state after 12h, as no cell cycle stages could be distinguished. On the other hand, treatment with the 0514 extract hindered the cell cycle stage progression after 12 h and, after 24 h, almost all cells observed were halted at interphase.

Table 1.
Percentages (%) of occurrence of cell cycle stages in Oryza sativa root tips, either control or treated for various time periods (1, 2 and 24 h) with extracts from the NMP cyanobacterial strains, Microcystis viridis TAU-MAC 1810 and Planktothrix aghardii TAU-MAC. Kruskal−Wallis analysis of variance showed a significant time-dependent variation in the percentage of cells in different cell cycle phases (chi-squared; χ2: 15.8, n = 35, df = 6, P < 0.05).
3.4. Induction of Cell Death
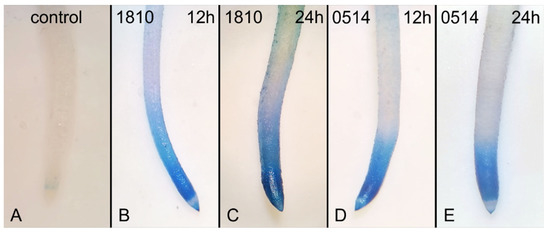
The occurrence of dead cells in extract-treated roots was confirmed by Evans Blue staining (Figure 4). Dead cells were detected at all time points and the effects were particularly harsh after 24 h of treatment with the 1810 extract (Figure 4B).

Figure 4.
Images of Oryza sativa roots, control (A) or treated with extracts from non-microcystin-producing (NMP) cyanobacterial strains, Microcystis viridis TAU-MAC 1810 (B,C) and Planktothirx aghardii TAU-MAC 0514 (D,E), after staining with Evans Blue for detection of dead cells. After 12 h, both extracts induced cell death in rice root tips (B, D cf. A). After 24 h, enhancement of the staining was visible in 1810-treated roots (C cf. B). No significant increase in staining was observed in roots treated with the 0514 extract for 24 h (E cf. D).
4. Discussion
In general, extracts from NMP cyanobacterial strains have been shown to negatively affect meristematic root cells of Oryza sativa [15]. Extracts from the aforementioned NMP strains (TAU-MAC 1810, 0514) affected both F-actin and microtubules in a time-dependent manner but in different ways, as the 1810 extract exhibited more adverse effects, leading to the eventual collapse of the plant cytoskeletal system after longer treatments (12 and 24 h). In plant cells, MCs are known to disrupt both microtubules [16] and F-actin [5]. Although Microcystis is a genus notorious for producing MCs, Microcystis viridis TAU-MAC 1810 strain was not found to produce any during LC-MS/MS analysis [12]. However, apart from MCs, Microcystis species have been found to produce a wide range of bioactive compounds, such as microginins, microviridins and cyanopeptolins [1]. Similarly, Plankothrix produces a variety of secondary metabolites, many of which are yet to be characterized [1]. Investigations on the toxicity of such compounds against the plant cytoskeleton could be a focal point of future research.
F-actin appeared to be more sensitive than microtubules. This is especially highlighted by treatment with the 0514 extract. These results imply a possible independent mechanism of toxicity for each cytoskeletal element in plant cells. The cytoskeletal alterations, along with the abnormal condensation of chromatin observed in treated cells (especially with the 1810 extract), justify the observed decrease in dividing cells. Interestingly, the vast majority of root meristematic cells treated with the 0514 extract for 24 h were arrested at interphase. MCs are able to not only cause cytoskeletal abnormalities in mitotic cells, but also to alter the mitotic index of treated plant tissues [16,17]. Our findings suggest that similar effects on plant cell division may be exerted by cyanobacterial bioactive compounds other than MCs.
These cytoskeletal alterations and the disruption of the cell cycle progression could be associated with the cell death effects observed in roots treated with the extracts [18]. Despite the fact that the exact nature of these cell death phenomena has not been determined yet, this is an important indication that the presence of certain NMP cyanobacterial strains in the aquatic environment could pose a threat to plant species exposed to their compounds, which are present in water and are often accessible to crop species (such as rice) through irrigation.
5. Conclusions
- Extracts from NMP cyanobacterial strains are able to negatively affect both F-actin and microtubules in root meristematic cells of Oryza sativa, as well as the cell cycle. Therefore, bioactive cyanobacterial compounds, other than MCs, could be able to disrupt the cytoskeleton and cell cycle progression in plant cells.
- Treatment with the extracts induced cell death in root tips.
- Not only strains that produce MCs, but also NMP strains may be toxic for plants.
Author Contributions
D.P., I.-D.S.A., S.G. and E.P. conceived and designed the experiments; D.P. performed the experiments; I.-D.S.A. and D.P. analyzed the data; S.G. and E.P. contributed reagents/materials/analysis tools; D.P., I.-D.S.A., S.G. and E.P. wrote the manuscript. All authors have read and agreed to the published version of the manuscript.
Acknowledgments
This research was co-financed by Greece and the European Union (European Social Fund- ESF) through the Operational Programme «Human Resources Development, Education and Lifelong Learning» in the context of the project “Strengthening Human Resources Research Potential via Doctorate Research” (MIS-5000432), implemented by the State Scholarships Foundation (ΙΚΥ). D.P. is a State Scholarships Foundation scholar. I.-D.S.A. was funded by the National and Kapodistrian University of Athens. E.P. was funded by the AUTh Research Committee, grant number 91913.
Conflicts of Interest
The authors declare no conflict of interest.
Abbreviations
The following abbreviations are used in this manuscript:
| CLSM | confocal laser scanning microscope |
| CTCF | corrected total cell fluorescence |
| DAPI | 4′, 6-diamidino-2-phenylindole |
| DMSO | dimethyl sulfoxide |
| LC-MS/MS | liquid chromatography with tandem mass spectrometry |
| MBS | m-maleimidobenzoyl-N-hydroxysuccinimide ester |
| MCs | microcystins |
| NMP | non-microcystin-producing |
| PBS | phosphate buffer saline |
| PEM | PIPES EGTA MgSO4 |
| PFA | paraformaldehyde |
| PP1 | protein phosphatase 1 |
| PP2A | protein phosphatase 2a |
References
- Meriluoto, J.; Spoof, L.; Codd, G.A. Handbook of Cyanobacterial Monitoring and Cyanotoxin Analysis; John Wiley & Sons: Chichester, West Sussex, UK, 2017. [Google Scholar]
- Runnegar, M.T.; Kong, S.; Berndt, N. Protein phosphatase inhibition hepatotoxicity of microcystins. Am. J. Physiol. 1993, 265, 224–230. [Google Scholar] [CrossRef] [PubMed]
- Pflugmacher, S.; Jung, K.; Lundvall, L.; Neumann, S.; Peuthert, A. Effects of cyanobacterial toxins and cyanobacterial cell-free crude extract on germination of alfalfa (Medicago sativa) and induction of oxidative stress. Environ. Toxicol. Chem. 2006, 25, 2381–2387. [Google Scholar] [CrossRef] [PubMed]
- Chen, J.; Han, F.X.; Wang, F.; Zhang, H.; Shi, Z. Accumulation and phytotoxicity of microcystin-LR in rice (Oryza sativa). Ecotoxicol. Environ. Saf. 2012, 76, 193–199. [Google Scholar] [CrossRef] [PubMed]
- Pappas, D.; Gkelis, S.; Panteris, E. The effects of microcystin-LR in Oryza sativa root cells: F-actin as a new target of cyanobacterial toxicity. Plant Biol. 2020, 22, 839–849. [Google Scholar] [CrossRef] [PubMed]
- Máthé, C.; M-Hamvas, M.; Vasas, G. Microcystin-LR and cylindrospermopsin induced alterations in chromatin organization of plant cells. Mar. Drugs 2013, 11, 3689–3717. [Google Scholar] [CrossRef] [PubMed] [Green Version]
- MacKintosh, C.; Beattie, K.A.; Klumpp, S.; Cohen, P.; Codd, G.A. Cyanobacterial microcystin-LR is a potent and specific inhibitor of protein phosphatases 1 and 2A from both mammals and higher plants. FEBS Lett. 1990, 264, 187–192. [Google Scholar] [CrossRef] [Green Version]
- Hoffman, A.; Taleski, G.; Sontag, E. The protein serine/threonine phosphatases PP2A, PP1 and calcineurin: A triple threat in the regulation of the neuronal cytoskeleton. Mol. Cell. Neurosci. 2017, 84, 119–131. [Google Scholar] [CrossRef] [PubMed]
- Brautigan, D.L.; Shenolikar, S. Protein Serine/Threonine Phosphatases: Keys to Unlocking Regulators and Substrates. Annu. Rev. Biochem. 2018, 87, 921–964. [Google Scholar] [CrossRef] [PubMed] [Green Version]
- Prieto, A.; Campos, A.; Cameán, A.; Vasconcelos, V. Effects on growth and oxidative stress status of rice plants (Oryza sativa) exposed to two extracts of toxin-producing cyanobacteria (Aphanizomenon ovalisporum and Microcystis aeruginosa). Ecotoxicol. Environ. Saf. 2011, 74, 1973–1980. [Google Scholar] [CrossRef] [PubMed]
- Gkelis, S.; Panou, M. Capturing biodiversity: Linking a cyanobacteria culture collection to the “scratchpads” virtual research environment enhances biodiversity knowledge. Biodivers. Data J. 2016, 4, e7965-1. [Google Scholar] [CrossRef] [PubMed] [Green Version]
- Gkelis, S.; Panou, M.; Konstantinou, D.; Apostolidis, P.; Kasampali, A.; Papadimitriou, S.; Kati, D.; Di Lorenzo, G.M.; Ioakeim, S.; Zervou, S.-K.; et al. Diversity, Cyanotoxin Production, and Bioactivities of Cyanobacteria Isolated from Freshwaters of Greece. Toxins 2019, 11, 436. [Google Scholar] [CrossRef] [PubMed] [Green Version]
- Gkelis, S.; Lanaras, T.; Sivonen, K. The presence of microcystins and other cyanobacterial bioactive peptides in aquatic fauna collected from Greek freshwaters. Aquat. Toxicol. 2006, 78, 32–41. [Google Scholar] [CrossRef] [PubMed]
- Eleftheriou, E.P.; Adamakis, I.D.S.; Panteris, E.; Fatsiou, M. Chromium-induced ultrastructural changes and oxidative stress in roots of Arabidopsis thaliana. Int. J. Mol. Sci. 2015, 16, 15852–15871. [Google Scholar] [CrossRef] [PubMed] [Green Version]
- Pappas, D.; Panou, M.; Adamakis, I.D.S.; Gkelis, S.; Panteris, E. Beyond microcystins: Cyanobacterial extracts induce cytoskeletal alterations in rice root cells. Int. J. Mol. Sci. 2020, 21, 9649. [Google Scholar] [CrossRef] [PubMed]
- Beyer, D.; Tándor, I.; Kónya, Z.; Bátori, R.; Roszik, J.; Vereb, G.; Erddi, F.; Vasas, G.; M-Hamvas, M.; Jambrovics, K.; et al. Microcystin-LR, a protein phosphatase inhibitor, induces alterations in mitotic chromatin and microtubule organization leading to the formation of micronuclei in Vicia faba. Ann. Bot. 2012, 110, 797–808. [Google Scholar] [CrossRef] [PubMed] [Green Version]
- Máthé, C.; Beyer, D.; Erdodi, F.; Serfozo, Z.; Székvölgyi, L.; Vasas, G.; M-Hamvas, M.; Jámbrik, K.; Gonda, S.; Kiss, A.; et al. Microcystin-LR induces abnormal root development by altering microtubule organization in tissue-cultured common reed (Phragmites australis) plantlets. Aquat. Toxicol. 2009, 92, 122–130. [Google Scholar] [CrossRef] [PubMed]
- Smertenko, A.; Franklin-Tong, V.E. Organisation and regulation of the cytoskeleton in plant programmed cell death. Cell Death Differ. 2011, 18, 1263–1270. [Google Scholar] [CrossRef] [PubMed]
Publisher’s Note: MDPI stays neutral with regard to jurisdictional claims in published maps and institutional affiliations. |
© 2020 by the authors. Licensee MDPI, Basel, Switzerland. This article is an open access article distributed under the terms and conditions of the Creative Commons Attribution (CC BY) license (https://creativecommons.org/licenses/by/4.0/).