Proceeding Paper

Plants Biodiversity in Olive Orchards and Surrounding Landscapes from a Conservation Biological Control Approach †

by
María Villa
1,
Sónia A. P. Santos
2,3,
Carlos Aguiar
1 and
José Alberto Pereira
1,*
1
Centro de Investigação de Montanha (CIMO), ESA, Instituto Politécnico de Bragança, Campus de Santa Apolónia, 5300-253 Bragança, Portugal
2
CIQuiBio, Barreiro School of Technology, Polytechnic Institute of Setúbal, Rua Américo da Silva Marinho, 2839-001 Lavradio, Portugal
3
Linking Landscape, Environment, Agriculture and Food (LEAF), Instituto Superior de Agronomia, Universidade de Lisboa, Tapada da Ajuda, 1349-017 Lisboa, Portugal
*
Author to whom correspondence should be addressed.
Presented at the 1st International Electronic Conference on Plant Science, 1–15 December 2020; Available online: https://iecps2020.sciforum.net/.
Biol. Life Sci. Forum 2021, 4(1), 66; https://doi.org/10.3390/IECPS2020-08604
Published: 30 November 2020
(This article belongs to the Proceedings of The 1st International Electronic Conference on Plant Science)

Abstract

:
Many natural control agents of olive pests need pollen and nectar from non-crop plants in order to complete their life cycles. However, a deep knowledge about the occurring plant species in the agroecosystem is necessary to select the plant species to be maintained or enhanced from a conservation biological control approach. Thus, in this study, the goal was to increase the understanding about the plants’ biodiversity in an important olive-producing region in the northeast of Portugal. For that, on a weekly basis during the spring and every other week in the summer and autumn, blooming plant inventories were accomplished in three olive orchards with spontaneous vegetation and its surroundings (woody and herbaceous vegetation areas) from April to December of 2012 and 2013. The percentage ground cover for each flowering plant species was recorded following the Daubenmire cover scale modified by Bailey. A total of 258 plant species belonging to 47 families were identified. The most abundant family was Asteraceae, followed by Poaceae, Fabaceae and Brassicaceae. Several species were specific to each land use and presented different flowering periods, representing a potential variety of food sources across the seasons. Additionally, some of the identified species are known for their implications as providers of the key requisites for natural control agents. These results provided us with valuable information for the implementation of conservation biological control measures.

1. Introduction

The conservation of beneficial arthropods can involve an important economic value through the provision of multiple ecosystem services (e.g., pollination, pest control, and decomposition) [1,2]. This involves a deep knowledge of the occurring natural resources required by natural enemies and pests, as well as the occurring resources in the agricultural landscape. Flowering plants are, in many cases, among the most important natural resources for arthropods, because many of them rely on flowering resources for survival and reproduction in some stages of the life cycle (e.g., [3]).
The olive orchard agroecosystem is one of the main crops in Mediterranean areas around the word. In the northeast of Portugal, one of the most important olive-producing regions in the country, the crop is attacked by several pests, such as the olive fly Bactrocera oleae (Rossi) (Diptera: Tephritidae) or the olive moth Prays oleae (Bern.) (Lepidoptera: Praydidae). These pests coexist with multiple beneficial arthropods, such as the predator Chrysoperla carnea s.l. (Neuroptera: Chrysopidae), several species of syrphids (Diptera) (predators and pollinators), or parasitoids. These arthropods may benefit from flower resources occurring in the agricultural landscape [4,5,6,7,8,9,10]. Vegetation within and/or around the olive orchard has been associated with an increase in natural enemies [7,11,12,13]; specific plants have been associated with the increase of predator abundance in olive ground covers [13], and in some cases, a pest reduction has been associated with an increase in natural enemies [7,14].
Additionally, a variation in the plant communities in different olive-producing regions is expected, according to multiple factors, such as the environmental conditions or management practices on the landscape or at the local scale. In this context, the knowledge of the plant community in different agricultural areas is necessary for determining which plant resources should be maintained, enhanced, or studied for conservation biological control. Thus, the goal of this work was to describe the flowering plant community in the spring, summer, and autumn in the ground cover of the olive orchards and adjacent herbaceous and scrubland seminatural areas in the northeast of Portugal in order to analyze its potential for enhancing the biological control conservation in olive orchards.

2. Experiments

2.1. Study Areas

The study areas were three olive orchards of approximately 2 ha in area (Cedães: 41°29′16″ N–7°07′34″ W, Paradela: 41°32′8″ N–7°07′29″ W, and Guribanes: 41°34′12″ N–7°09′59″ W) and two surrounding non-crop areas next to each olive grove, one herbaceous vegetation plot and one scrubland, both of approximately 1 ha. During the experimental years, the olive groves were not tilled and were not sprayed with pesticides.

2.2. Flowering Plant Inventories

Five flowering plant inventories were carried out every week from April to June and every other week from July to December in 2012 and 2013. The inventories were carried out in circular plots of 25 m2 (olive groves and herbaceous patches) and three plots of 100 m2 (scrubland patches). The plots were larger in the scrublands, because the larger sizes of the plant species (trees and shrubs) required the inventories to be conducted in larger plots to record the occurring plants. This resulted in a total of 39 samples of plant inventories per sampling date for characterizing the plant community of the olive grove agroecosystem. The percentage ground cover for each flowering plant species was recorded following the Daubenmire cover scale modified by Bailey [15].

2.3. Data Analysis

2.3.1. Alpha Diversity

The richness, the Pielou’s evenness index, the Shannon–Wiener diversity index and the Simpson diversity index were calculated to describe the plant communities in the spring, summer, and autumn in the olive orchards, herbaceous, and scrubland plots using the “vegan” package [16] in R software [17].

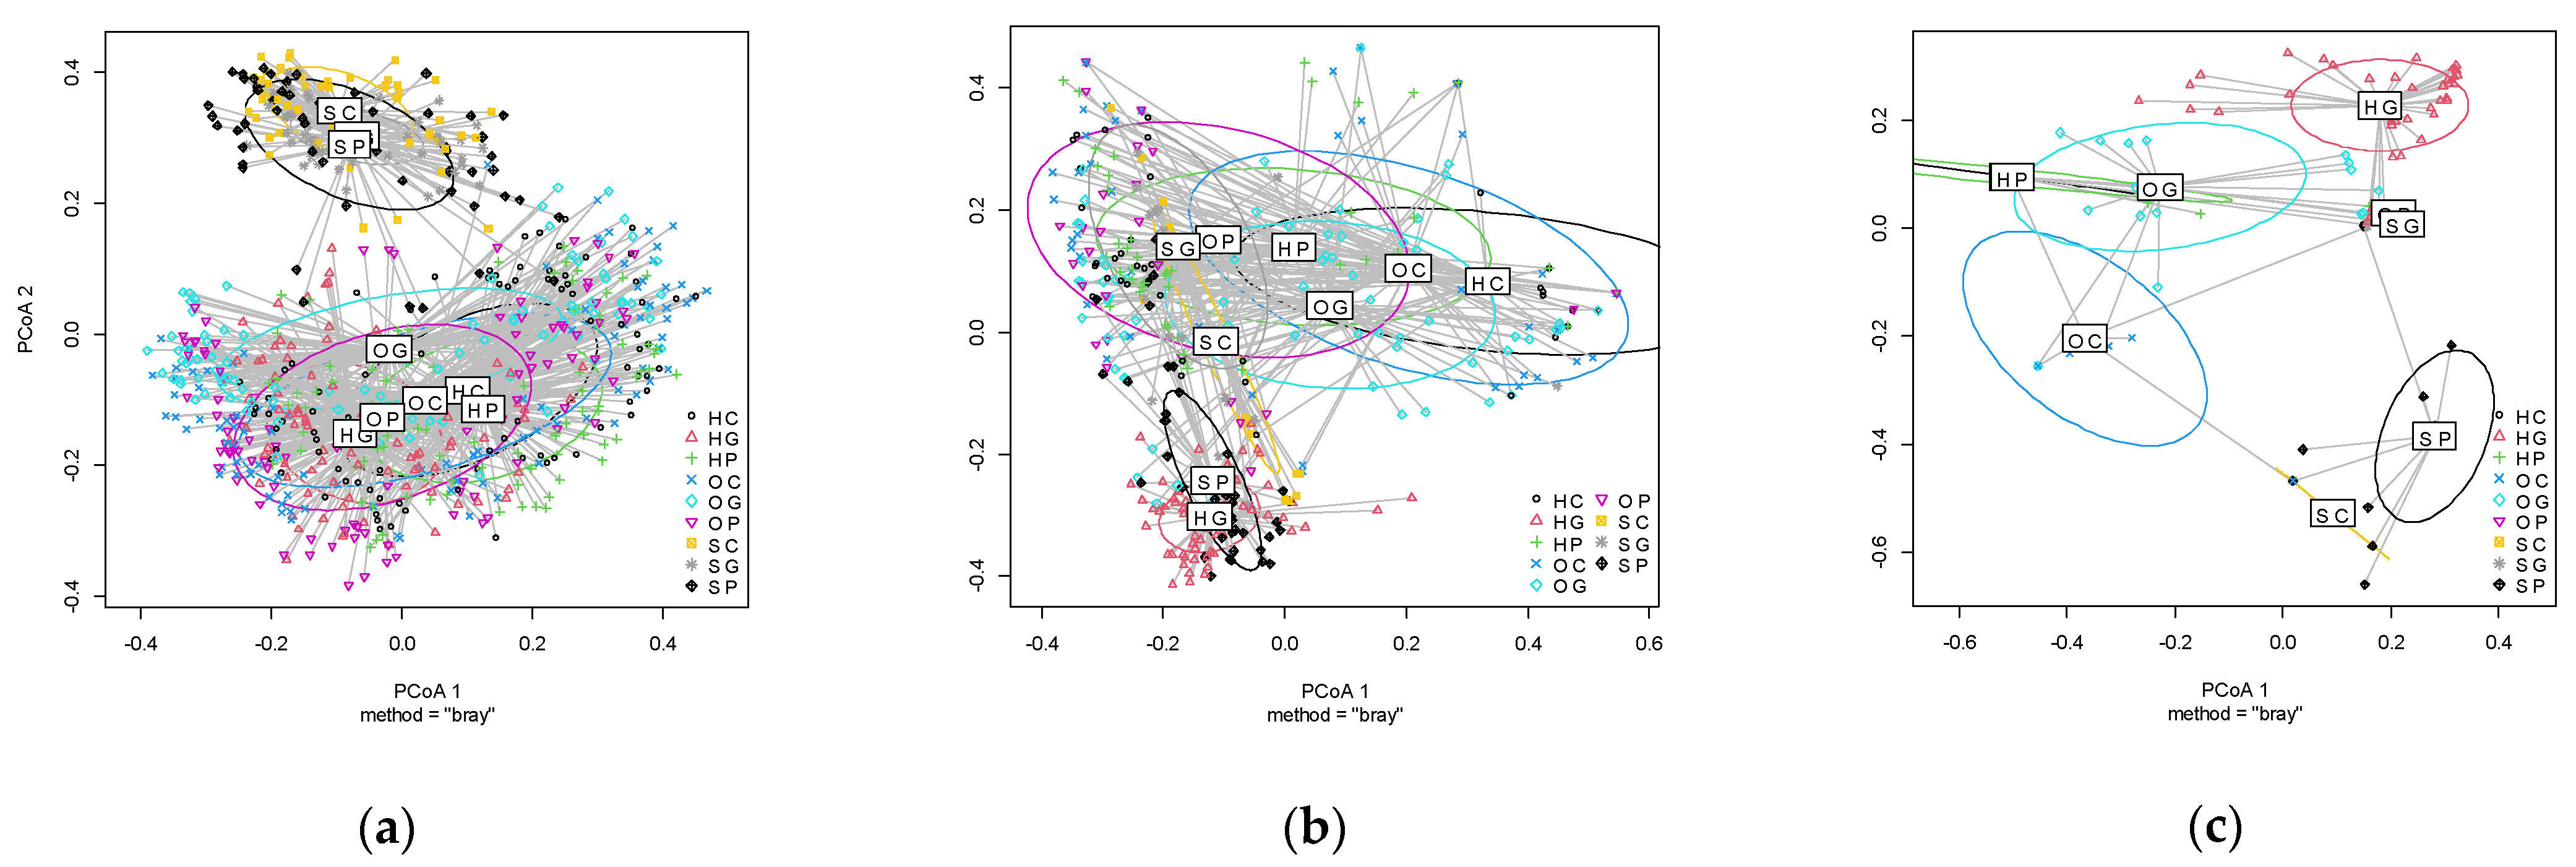
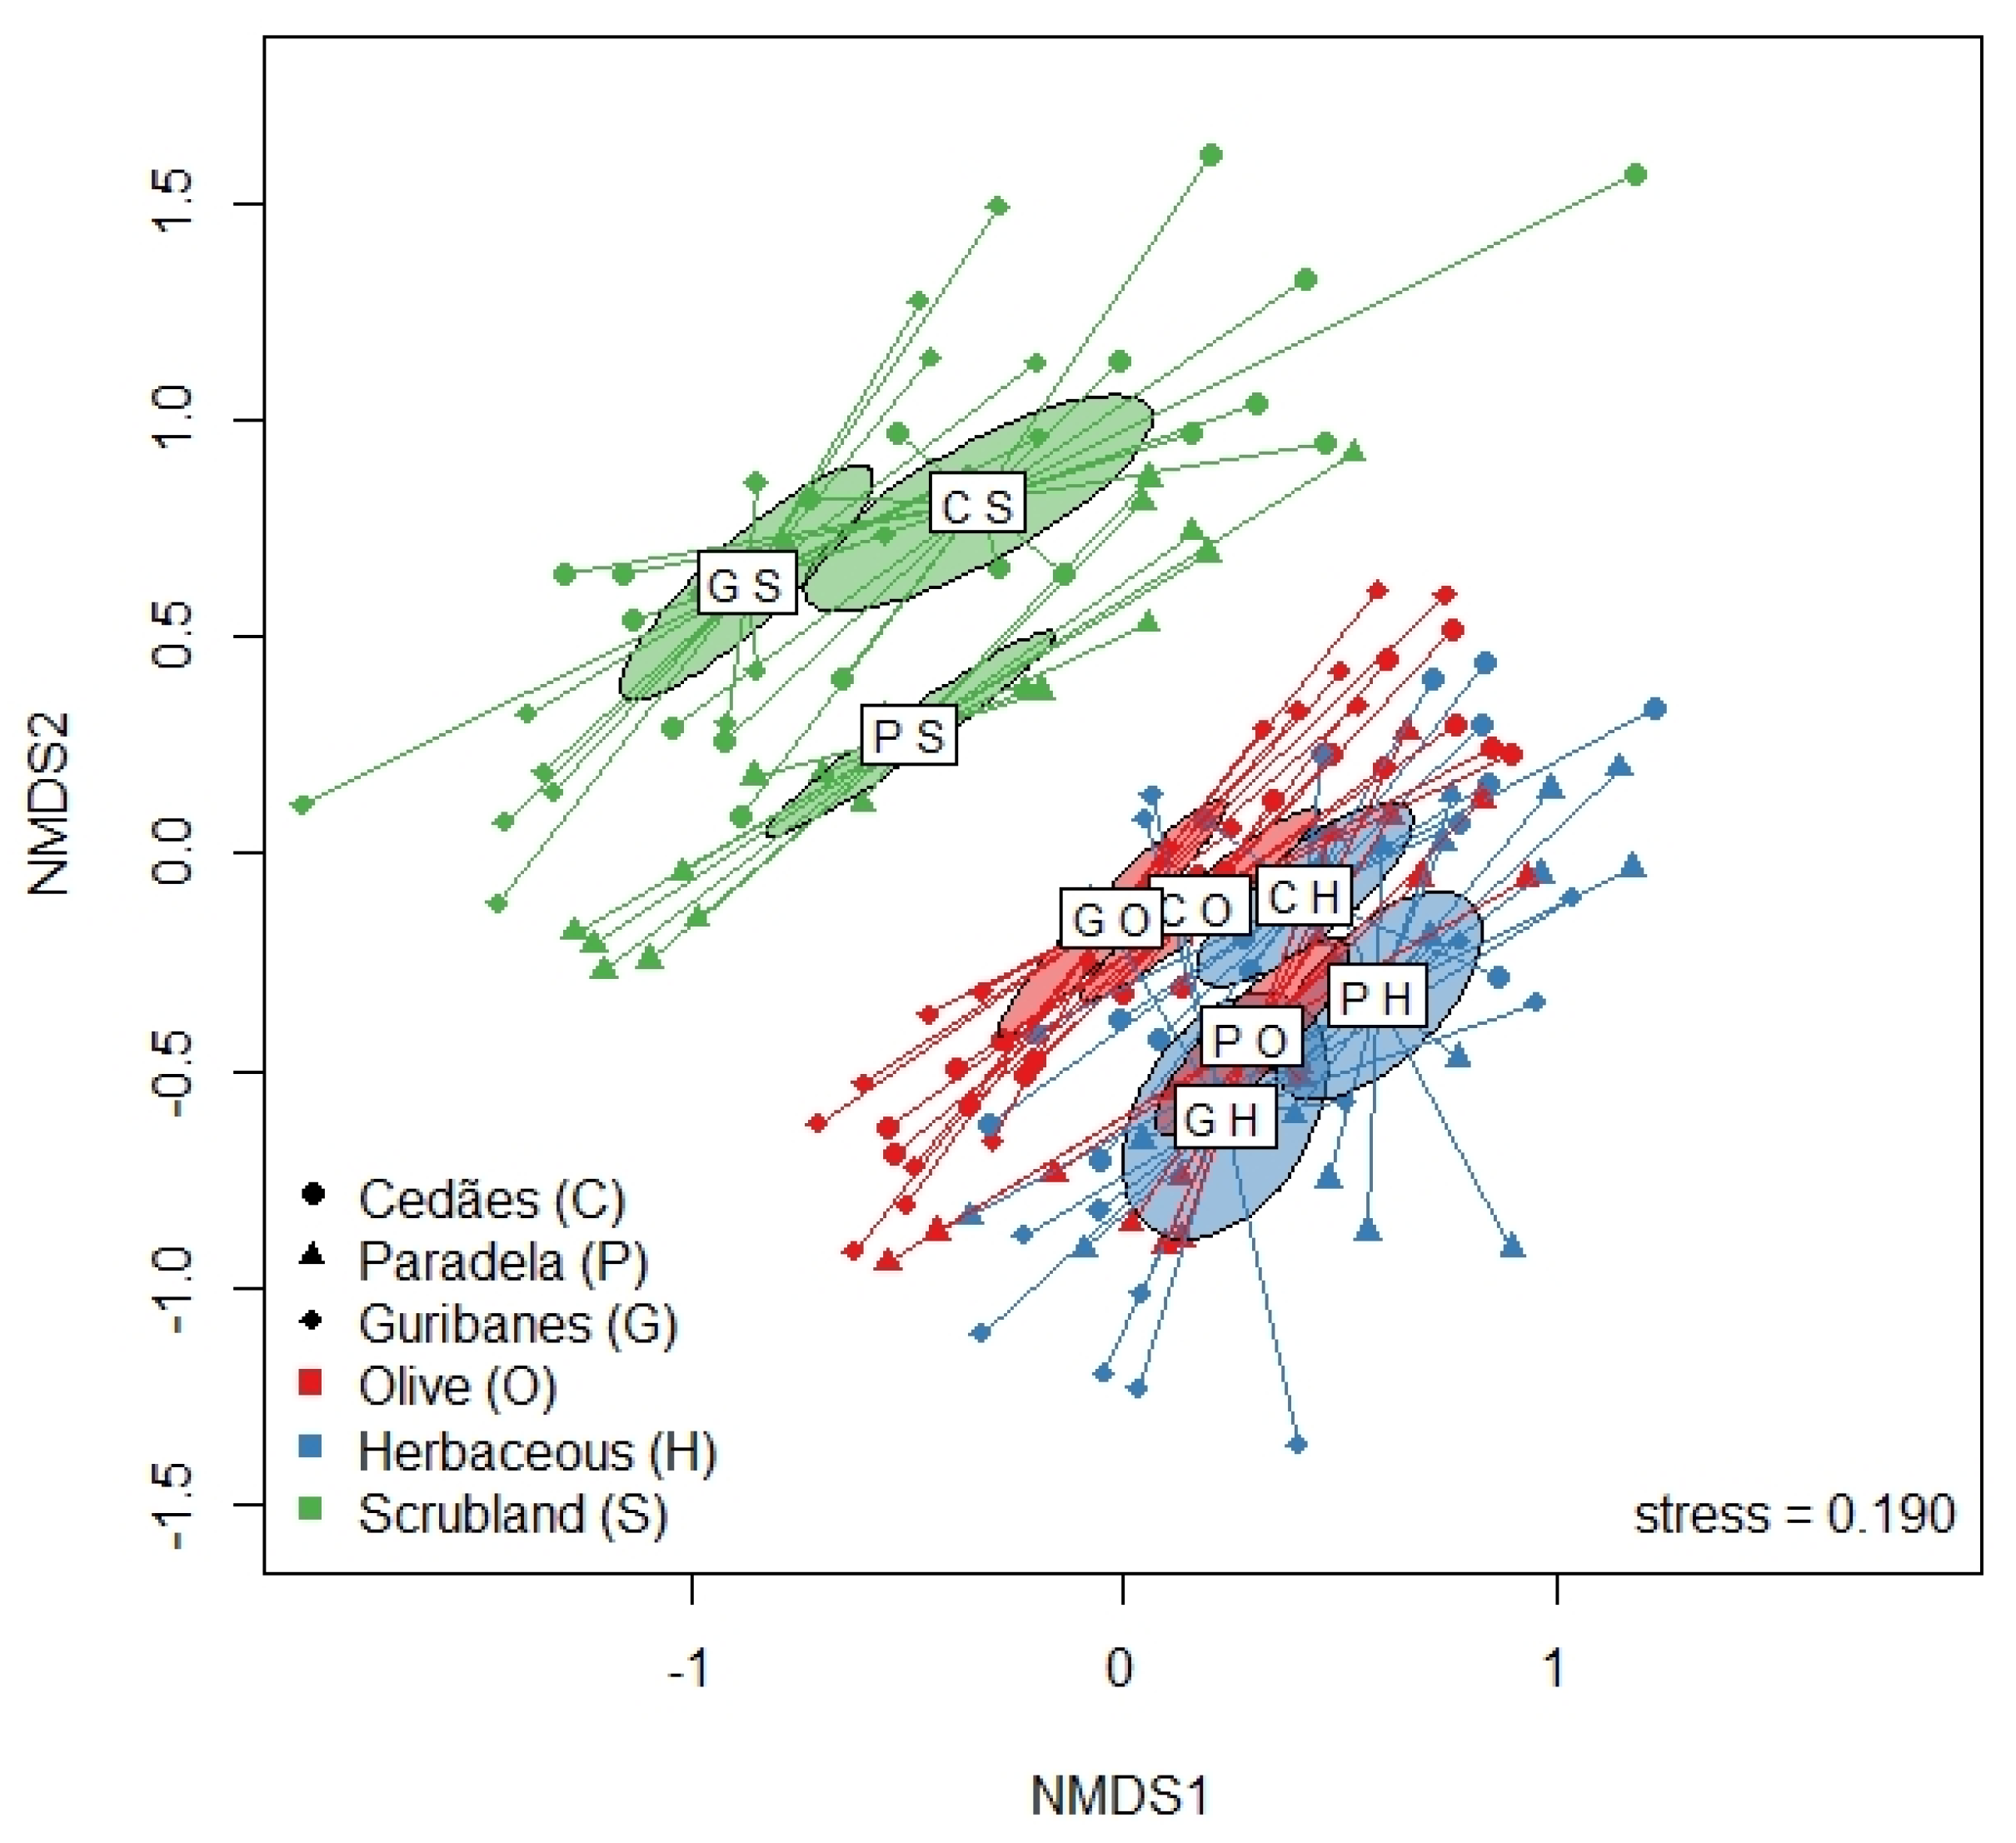
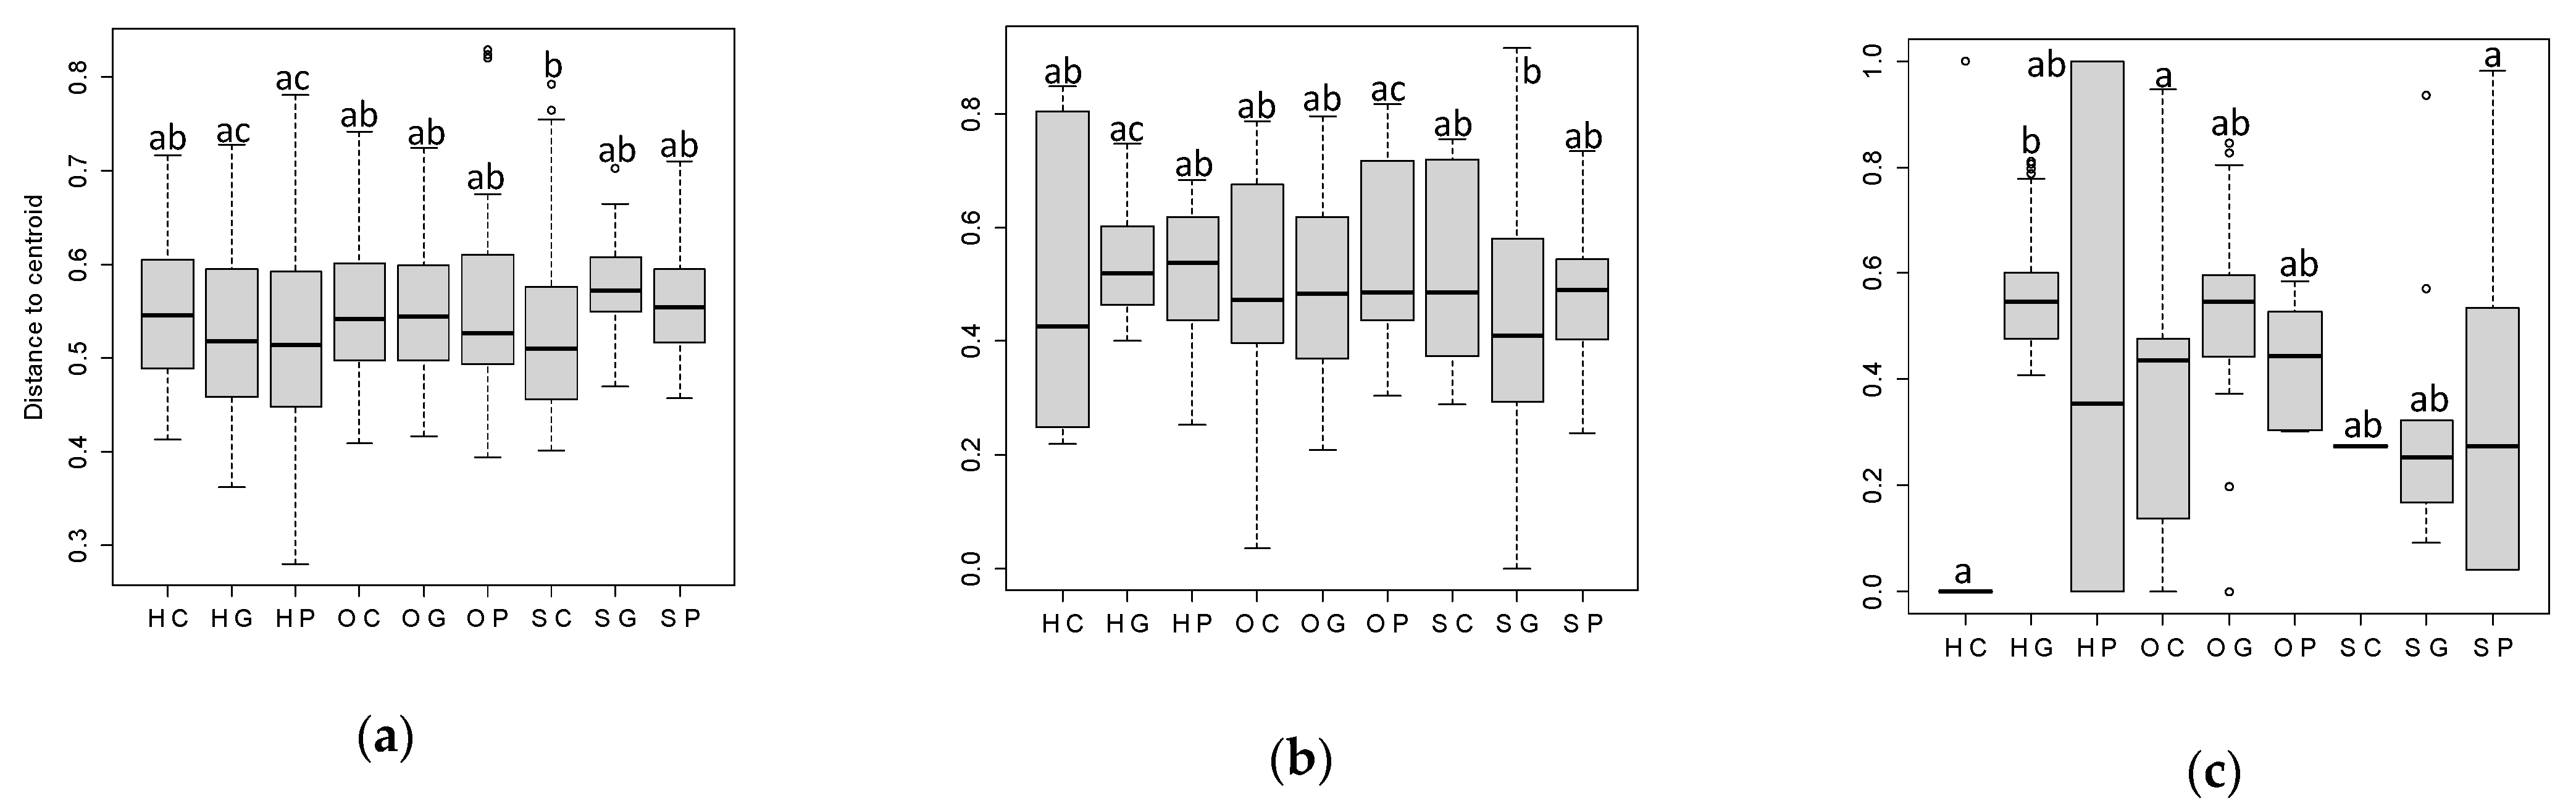
2.3.2. Beta Diversity

Venn graphics were drawn to visualize the number of shared and unshared species among the land uses by season. The plant communities by land use and location were visualized using nonmetric multidimensional scaling (NMDS) (999 permutations) plots (bray distance and k = 2) after grouping the data by the mean of the percentage observed in the samples for each date (metaMDS function from the “vegan” package).
A Permutational Multivariate Analysis of Variance (PERMANOVA) for each season was used to analyze the differences among the plants communities from the different land uses (olive orchards and herbaceous and scrubland patches) and locations (Cedães, Paradela, and Guribanes) using the function adonis2 from the same package. The square root of the abundance matrix was used for minimizing the influence of the most-abundant groups. Then, the Bray–Curtis dissimilarity matrix was used as the response and the land use and location as the explanatory variables. The main effects and the interactions were analyzed. The permutations were constrained by the samples, and 999 permutations were used. In order to analyze which levels of the significant explanatory variables and/or interactions were significantly different, a pairwise comparison for each group level with Bonferroni’s correction for multiple testing was performed using pairwise permutational MANOVA with the function pairwise.perm.manova from the “RVAideMemoire” package [18]. Following the “marginality principle” when the non-null-interactions stood out, the main effects were not analyzed [19]. The plant species driving the differences were analyzed with a similarity percentage analysis (SIMPER) of the square rooted abundance matrix using the simper function in the “vegan” package. The variances among the communities grouped by land use locations were tested using the betadisper function in the same package, followed by a permutation test for the homogeneity of multivariate dispersions using the permutes function in the same package. When the differences were found, pairwise differences between the groups were checked with a Tukey’s HSD test by using the TukeyHSD function.

3. Results

3.1. Alpha Diversity: Diversity Incides

Table 1 shows the values of the richness, the Pielou’s evenness index, the Shannon–Wiener diversity index, and the Simpson diversity index of the plant communities blooming in the spring, summer, and autumn in the olive orchards and herbaceous and scrubland plots.

3.2. Plants Communities in the Spring, Summer, and Autumn by Land Use and Location

The Venn graphics showed that, in all the seasons, several species were exclusive from each land use (Figure 1).
The low number of shared species in the summer and autumn did not allow us to draw NMDS plot for those seasons. The NMDS plot for visualizing the plant community blooming in the spring by season and location is shown in Figure 2.
The PERMANOVA in the spring, summer, and autumn showed that the plant communities varied with the environment and location (Table 2). Tukey’s HSD test indicated that: (i) in the spring, all the plots presented different plant communities (p < 0.05 in all cases); (ii) in the summer, the herbaceous plot in Cedães and the herbaceous plot in Paradela did not present differences in their community compositions (p = 0.108), and all the other plots presented different community compositions (p < 0.05 in all cases); and (iii) in the autumn, we did not find any differences among the plant community in the scrubland from Cedães and any of the plots, among the plant community in the herbaceous plot from Cedães and the herbaceous plot in Paradela, the olive orchards of Cedães and Guribanes and the scrubland from Cedães and Guribanes, and among the herbaceous plot in Paradela and the olive orchards of Cedães and Guribanes and the scrubland in Cedães (p > 0.108 in all cases). Tukey’s HSD test indicated that the communities among all the other plots in autumn differed (p < 0.05 in all cases).
According to the permutation test for homogeneity, the variance of the plant communities by land use and location in the spring, summer, and autumn were heterogeneous (spring: F = 3.236, df = 8, p = 0.002; summer: F = 2.357, df = 8, p = 0.026; autumn: F = 3.626, df = 8, p = 0.003). Tukey’s HSD test showed that: (i) in the spring, the differences were due to the lower data dispersion around the centroid in the scrubland from Guribanes compared to the herbaceous patches from Guribanes and Paradela (Figure A1a and Figure A2a); (ii) in the summer, the differences were due to the higher data dispersion around the centroid in the scrubland from Guribanes than in the herbaceous patches of Guribanes (p = 0.033) and the olive orchard of Paradela (p = 0.009) (Figure A1b and Figure A2b); (iii) and in the autumn, Tukey’s HSD test found differences in the data dispersion of the herbaceous plot in Guribanes with the olive orchard (p = 0.030) and herbaceous plot in Cedães (p = 0.011) and the scrubland plot in Paradela (p = 0.035) (Figure A1c and Figure A2c). This was probably due to the fact that the herbaceous plot in Guribanes coped with most of the plant diversity in the autumn. In the cases in which the variance of the plant communities was different, the differences found by the PERMANOVA could be due to the heterogeneity of the data and not to a difference in the community composition.

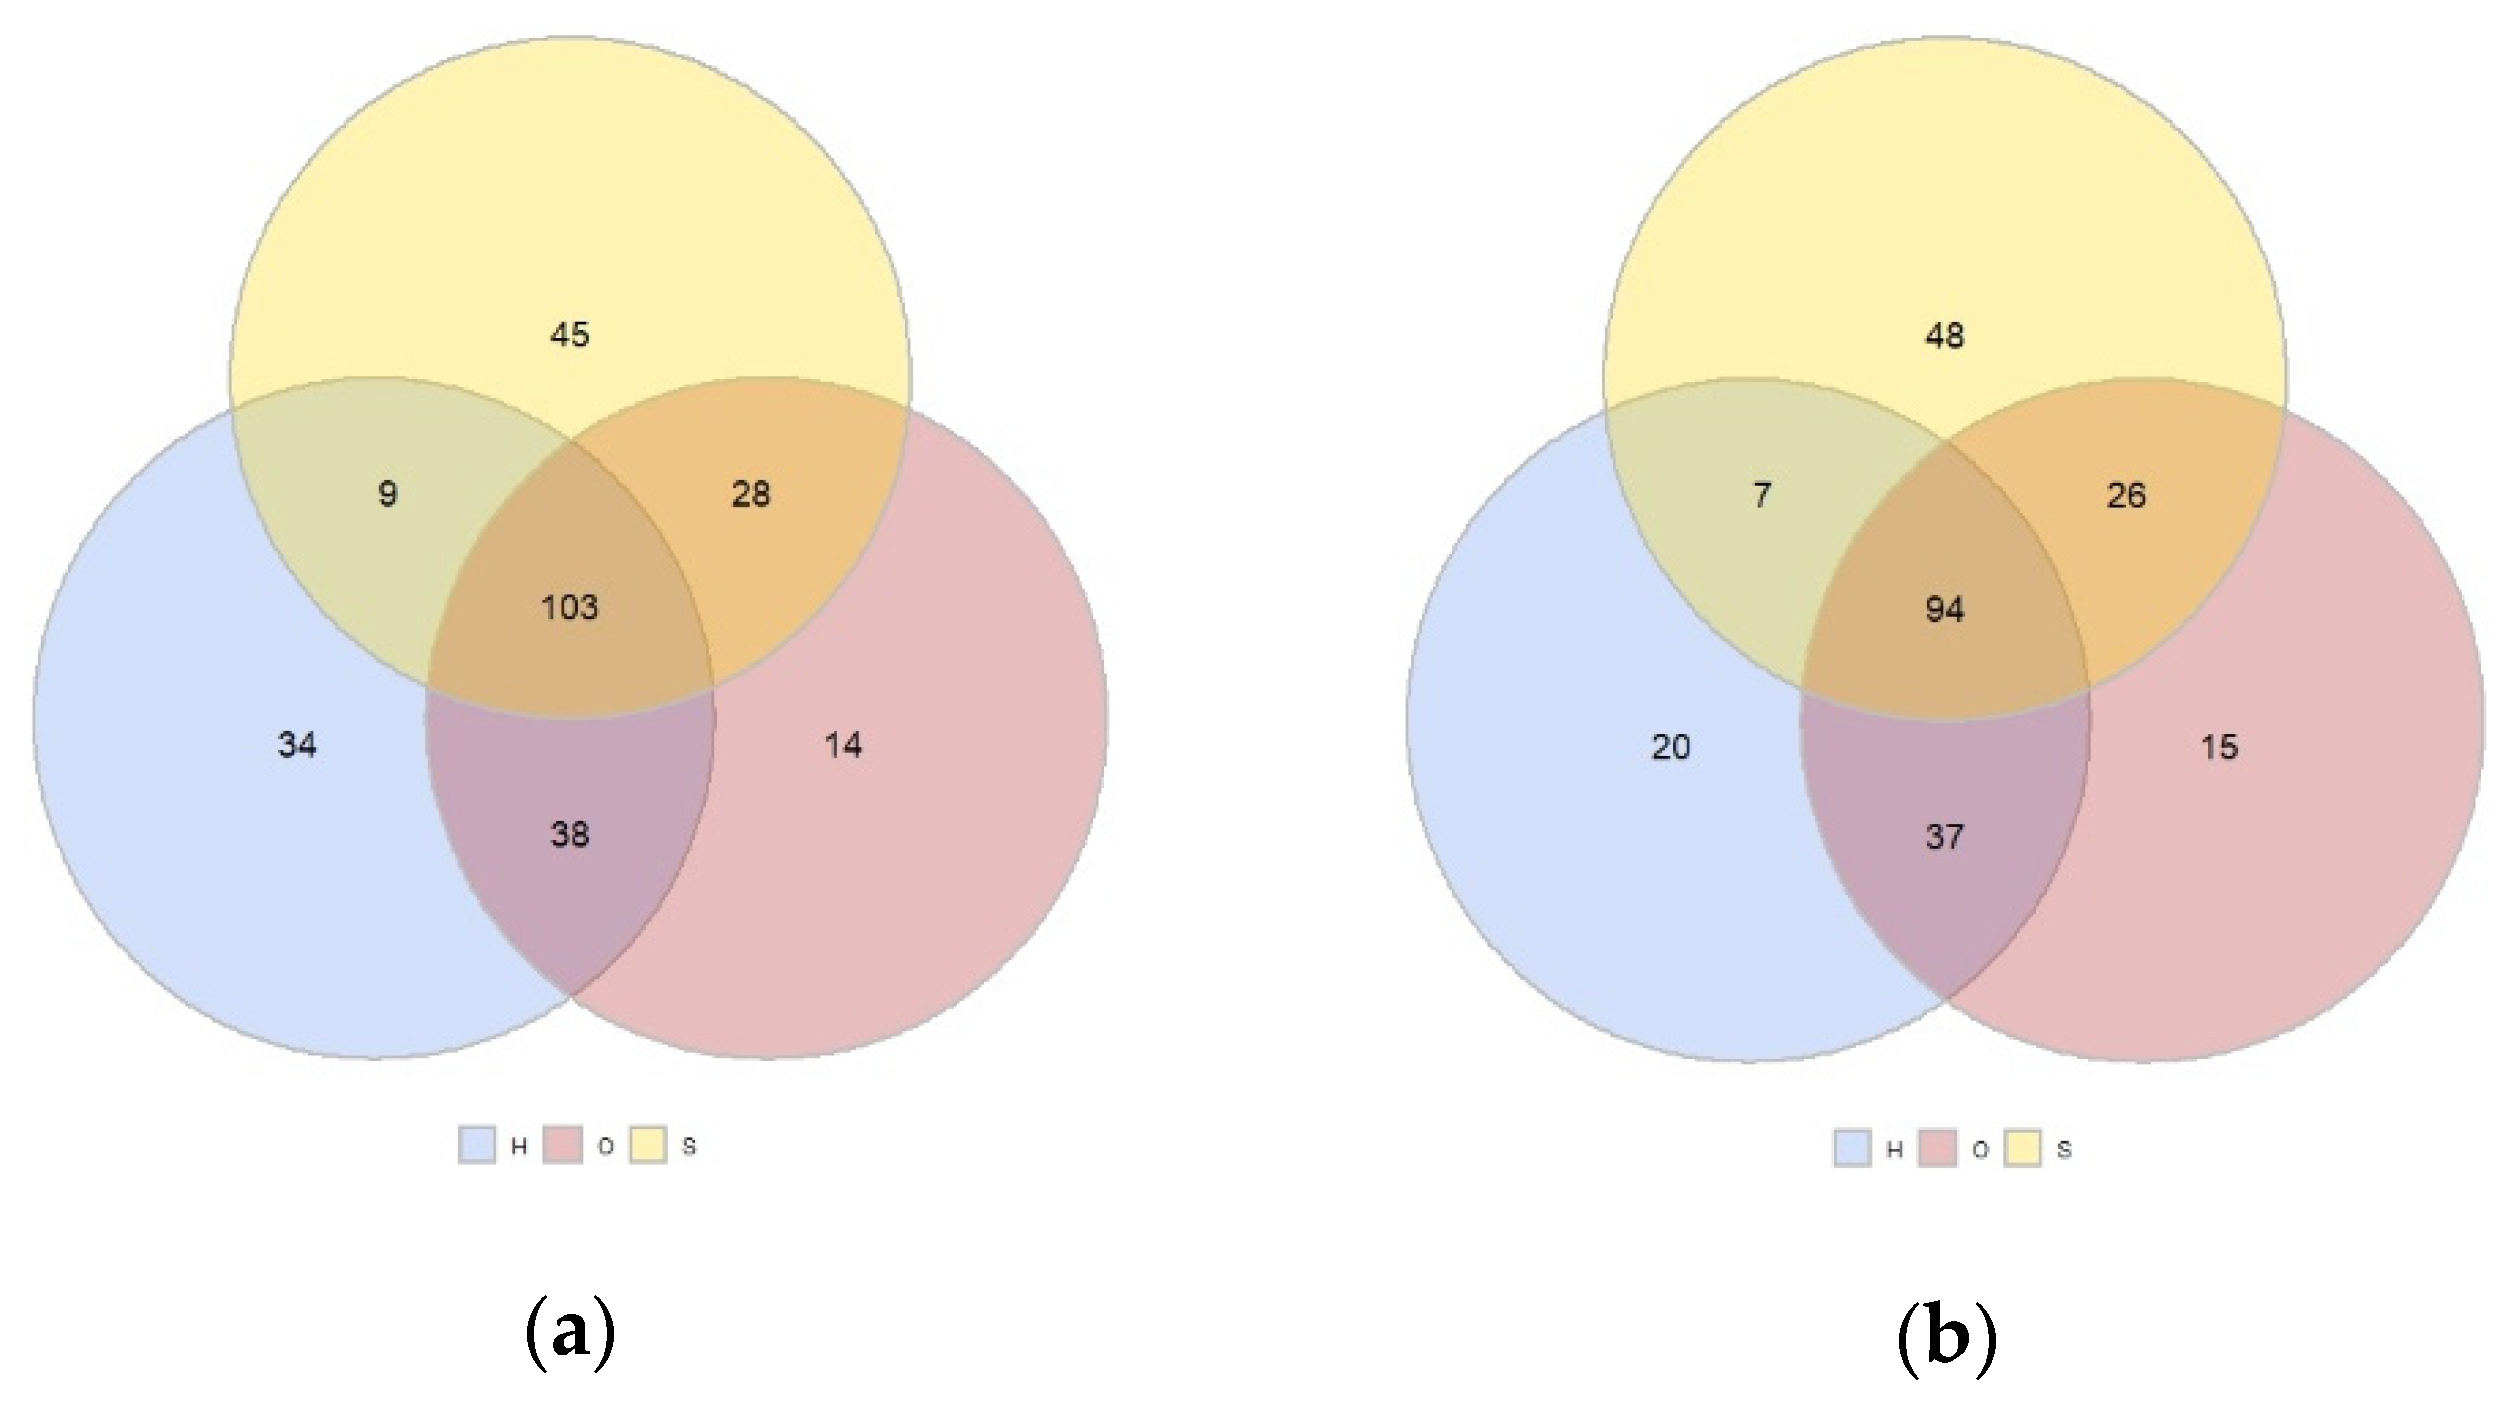
3.3. Simper Analysis: Species Divring the Differences among Land Uses and Sites and Most Abundant Species

This simper analysis performed a total of 36 comparisons between the plots in each season. Only the significant pairs in the Tukey’s HDS test after the PERMANOVA were analyzed. During the spring, between 17 and 48 species (a total of between 117 and 193 species) were responsible for 70% of the differences among the community composition of the flowering plants in the plots. The species that most contributed to the differences in each comparison were responsible for between 2% and 10% of the differences and coincided with the most abundant plants in the plots (Table 3). Additionally, in some cases, Coleostephus myconis (L.) Cass., Cistus ladanifer L., and Cytisus multiflorus (L’Her.) Sweet were the species that most contributed to the differences among the plots. During the summer, between 5 and 10 species (of a total between 25 and 76 species) were responsible for 70% of the differences among the community composition of flowering plants in the plots. The species that most contributed to the difference in each comparison were responsible for between 2.1% and 24.01% of the difference, and, excepting Andryala integrifolia L., they coincided with the most abundant plants (Table 3). During the autumn, between 2 and 11 species (of a total between 4 and 16 species and up to 50 in the comparisons with the herbaceous plot in Guribanes) were responsible for 70% of the differences among the community composition of the flowering plants in the plots. The species that most contributed to the difference in each comparison were responsible for between 2.53% and 67.03% of the difference, and they coincided with the most abundant plants (Table 3). Additionally, in some cases, Foeniculum vulgare Mill. was the species that most contributed to the differences among the plots.

4. Discussion

In this study, the community composition of flowering plants in an important olive-producing region from the north of Portugal was described. The results indicate that the community composition varies across a year. Spring was the most biodiverse season, followed by summer and autumn. The community composition of the flowering plants was generally different by land use (olive orchards and herbaceous vegetation and scrubland) in the three studied sites and in the three seasons, indicating a high variability of plants in the studied region. However, the species that most contributed to the differences in each pair of comparisons varied among one or two species for each land use and site and corresponded with the most abundant species. The high variability may be linked to the high landscape complexity of the studied region, composed mainly for small and irregular patches of several land uses, including many seminatural areas with different compositions (see reference [10]).
The plant variability among seasons may contribute to a spillover of natural enemies among the vegetation types and seasons. This type of spillover was described in olive orchards by reference [20], which identified the movements of predators and parasitoids from the ground cover to the adjacent vegetation and to olive trees in different periods, in some cases corresponding to the development of important pests such as P. oleae. Additionally, Álvarez et al. [13] suggested that a spillover of natural enemies may occur between olive orchards and the adjacent natural habitats when their resources differ in quality and quantity, as occurred in the present study.
The variability in plant compositions among land uses may also contribute to pest reductions. For example, the anthophagous generation of P. oleae (spring) was reduced in some years with the increase of its specific parasitoid A. fuscicollis in orchards with ground covers [7], the landscape composition negatively affected the P. oleae abundance [10], and the predation of B. oleae in olive orchards was associated with the area of scrublands in the autumn [14]. However, it is important also consider the potential risks of flowering plants through the potential benefits for pests [8] or vectors of diseases [21,22].

5. Conclusions

In this study, the community composition of the flowering plants in an olive agroecosystem was described. The results indicated a high variability among the land uses, sites, and seasons, which included excessive flowering plant species and may potentially originate from a spillover of arthropods. Further studies should study this potential spillover and its effects on the biological control.

Author Contributions

M.V. and J.A.P. conceived and designed the experiments; M.V. performed the experiments; M.V. and C.A. identified the plants; M.V. analyzed the data; and M.V., S.A.P.S. and J.A.P. wrote the paper. All authors have read and agreed to the published version of the manuscript.

Funding

The authors are grateful to the Foundation for Science and Technology (FCT, Portugal) for financial support by national funds FCT to CIMO (UIDB/00690/2020). National funding by FCT, through the individual postdoc grant (SFRH/BPD/119487/2016) (María Villa).

Conflicts of Interest

The authors declare no conflict of interest. The sponsors had no role in the design of the study; in the collection, analyses, or interpretation of the data; in the writing of the manuscript; or in the decision to publish the results.

Appendix A

Figure A1. Variance of the plant communities in the spring (a), summer (b), and autumn (c) by land use (olive (O), herbaceous patches (H), and Scrubland (S)) and location (Cedães (C), Guribanes (G), and Paradela (P)) as the distance to centroid of the Bray–Curtis distance matrix. Different letters indicate significant differences using Tukey’s HSD test. The upper and lower hinges in the boxplot represent the first and third quartiles, the error bar indicates the 95% confidence intervals, and the bar represents the median.
Blsf 04 00066 g0a1
Figure A2. Data points (points) and centroids (rectangles) across the two principal coordinates axes (PCoA1 and PCoA1) during the spring (a), summer (b), and autumn (c). H—herbaceous patches, O—olive orchard, S—Scrubland, C—Cedães, G—Guribanes, and P—Paradela.
Blsf 04 00066 g0a2

References

  1. Landis, D.L.; Wratten, S.D.; Gurr, G.M. Habitat management to conserve natural enemies of arthropod pests in agriculture. Annu. Rev. Entomol. 2000, 45, 175–201. [Google Scholar] [CrossRef]
  2. Isaacs, R.; Tuell, J.; Fiedler, A.; Gardiner, M.; Landis, D. Maximizing arthropod-mediated ecosystem services in agricultural landscapes: The role of native plants. Front. Ecol. Environ. 2009, 7, 196–203. [Google Scholar] [CrossRef] [Green Version]
  3. Wäckers, F.; van Rijn, P.C.J. Pick and mix: Selecting flowering plants to meet the requirements of target biological control insects. In Biodiversity and Insect Pests: Key Issues for Sustainable Management, 1st ed.; Gurr, G.M., Wratten, S.D., Snyder, W.E., Read, D.M.Y., Eds.; John Wiley & Sons, Ltd.: Chichester, UK, 2012; pp. 139–165. [Google Scholar]
  4. Alcalá Herrera, R.; Ruano, F.; Gálvez Ramírez, C.; Frischie, S.; Campos, M. Attraction of green lacewings (Neuroptera: Chrysopidae) to native plants used as ground cover in woody Mediterranean agroecosystems. Biol. Control 2019, 139, 104066. [Google Scholar] [CrossRef] [Green Version]
  5. Malheiro, R.; Casal, S.; Baptista, P.; Pereira, J.A. A review of Bactrocera oleae (Rossi) impact in olive products: From the tree to the table. Trends Food Sci. Technol. 2015, 44, 226–242. [Google Scholar] [CrossRef]
  6. Villa, M.; Santos, S.A.P.; Marrão, R.; Pinheiro, L.A.; López-Saez, J.A.; Mexia, A.; Bento, A.; Pereira, J.A. Syrphids feed on multiple patches in heterogeneous agricultural landscapes during the autumn season, a period of food scarcity. Agric. Ecosyst. Environ. 2016, 233, 262–269. [Google Scholar] [CrossRef] [Green Version]
  7. Villa, M.; Santos, S.A.P.; Mexia, A.; Bento, A.; Pereira, J.A. Ground cover management affects parasitism of Prays oleae (Bernard). Biol. Control 2016, 96, 72–77. [Google Scholar] [CrossRef]
  8. Villa, M.; Marrão, R.; Mexia, A.; Bento, A.; Pereira, J.A. Are wild flowers and insect honeydews potential food resources for adults of the olive moth, Prays oleae? J. Pest Sci. 2016, 90, 185–194. [Google Scholar] [CrossRef] [Green Version]
  9. Villa, M.; Somavilla, I.; Santos, S.A.P.; López-Sáez, J.A.; Pereira, J.A. Pollen feeding habits of Chrysoperla carnea s.l. adults in the olive grove agroecosystem. Agric. Ecosyst. Environ. 2019, 283, 106573. [Google Scholar] [CrossRef] [Green Version]
  10. Villa, M.; Santos, S.A.P.; Sousa, J.P.; Ferreira, A.; Martins da Silva, P.; Patanita, I.; Ortega, M.; Pascual, S.; Pereira, J.A. Landscape composition and configuration affect the abundance of the olive moth (Prays oleae, Bernard) in olive grove. Agric. Ecosyst. Environ. 2020, 294, 106854. [Google Scholar] [CrossRef]
  11. Paredes, D.; Cayuela, L.; Campos, M. Synergistic effects of ground cover and adjacent vegetation on natural enemies of olive insect pests. Agric. Ecosyst. Environ. 2013, 173, 72–80. [Google Scholar] [CrossRef]
  12. Gómez, J.A.; Campos, M.; Guzmán, G.; Castillo-Llanque, F.; Vanwalleghem, T.; Lora, A.; Giráldez, J.V. Soil erosion control, plant diversity, and arthropod communities under heterogeneous cover crops in an olive orchard. Environ. Sci. Pollut. Res. 2018, 25, 977–989. [Google Scholar] [CrossRef] [PubMed]
  13. Álvarez, H.A.; Morente, M.; Campos, M.; Ruano, F. La madurez de las cubiertas vegetales aumenta la presencia de enemigos naturales y la resiliencia de la red trófica de la copa del olivo. Ecosistemas 2019, 28, 92–106. [Google Scholar] [CrossRef] [Green Version]
  14. Ortega, M.; Sánchez-Ramos, I.; González-Núñez, M.; Pascual, S. Time course study of Bactrocera oleae (Diptera: Tephritidae) pupae predation in soil: The effect of landscape structure and soil condition. Agric. Forest Entomol. 2018, 20, 201–207. [Google Scholar] [CrossRef]
  15. Mueller-Dombois, D.; Ellenberg, H. Community Sampling: The Relevé Method. Aims and Methods of Vegetation Ecology; John Wiley and Sons: Hoboken, NJ, USA, 1974; pp. 45–66. [Google Scholar]
  16. Oksanen, J.; Guillaume Blanchet, F.; Friendly, M.; Kindt, R.; Legendre, P.; McGlinn, D.; Minchin, P.R.; O’Hara, R.B.; Simpson, G.L.; Solymos, P.; et al. Vegan: Community Ecology Package. R package Version 2.5-6. 2019. Available online: https://CRAN.R-project.org/package=vegan (accessed on 1 November 2020).
  17. R Core Team. R: A Language and Environment for Statistical Computing; R Foundation for Statistical Computing: Vienna, Austria, 2020; Available online: https://www.R-project.org/ (accessed on 1 November 2020).
  18. Hervé, M. RVAideMemoire: Testing and Plotting Procedures for Biostatistics. R Package Version 0.9-78. 2020. Available online: https://CRAN.R-project.org/package=RVAideMemoire (accessed on 1 November 2020).
  19. Nelder, J.A. A reformulation of linear models. J. R. Stat. Soc. Ser. A Ger. 1977, 140, 48–77. [Google Scholar] [CrossRef]
  20. Álvarez, H.A.; Morente, M.; Shigeo, F.; Rodríguez, E.; Campos, M.; Ruano, F. Semi-natural habitat complexity affects abundance and movement of natural enemies in organic olive orchards. Agric. Ecosyst. Environ. 2019, 285, 106618. [Google Scholar] [CrossRef]
  21. Villa, M.; Rodrigues, I.; Baptista, P.; Fereres, A.; Pereira, J.A. Populations and host/non-host plants of spittlebugs nymphs in olive orchards from northeastern Portugal. Insects 2020, 11, 720. [Google Scholar] [CrossRef] [PubMed]
  22. Bodino, N.; Cavalieri, V.; Dongiovanni, C.; Saladini, M.A.; Simonetto, A.; Volani, S.; Plazio, E.; Altamura, G.; Tauru, D.; Gilioli, G.; et al. Spittlebugs of Mediterranean olive groves: Host-plant exploitation throughout the year. Insects 2020, 11, 130. [Google Scholar] [CrossRef] [PubMed] [Green Version]
Figure 1. Venn graphics indicating the number of shared and nonshared species of the plant community blooming during the entire sampling period (a) and the spring (b), summer (c), and autumn (d). H—herbaceous plots, O—olive orchards, and S—Scrubland plots.
Blsf 04 00066 g001aBlsf 04 00066 g001b
Figure 2. A nonmetric multidimensional scaling (NMDS) analysis for flowering plant species (percentage of ground cover) in the spring by the interaction of land use (olive (O), herbaceous patches (H), and Scrubland (S)) and location (Cedães (C), Guribanes (G), and Paradela (P)). The sites are connected to the centroid in each group, and the 95% confident interval of each centroid is shown by shaded ellipses.
Blsf 04 00066 g002
Table 1. The biodiversity indices calculated the plant communities blooming by the season and land used (Olive—olive orchards; Herb—herbaceous plots; Scrub—scrubland plots).
SpringSummerAutumn
Biodiversity IndexesOliveHerbScrubOliveHerb ScrubOliveHerbScrub
Richness1099710540533814356
Pielou0.7490.6440.6640.5930.6420.7180.6050.6240.150
Shannon3.5142.9463.0892.1882.5482.6121.5962.2170.269
Simpson0.9570.9170.9150.7900.8790.8790.6660.8300.109
Table 2. PERMANOVA results for the variations of the plant communities in the spring, summer, and autumn by location and land use.
dfSSR2Pseudo-Fp-Value
SpringLocation212.5250.04420.4790.001
Land use234.4410.12256.3130.001
Location: Land use421.6010.07617.6600.001
Residual702214.6720.758
Total710283.2391.000
SummerLocation213.1880.07222.5560.001
Land use216.8270.09228.7810.001
Location: Land use420.9250.11417.8950.001
Residual452132.1340.722
Total460183.0741.000
AutumnLocation29.0450.13617.2990.001
Land use28.5940.12916.4350.001
Location: Land use410.0580.1519.6180.001
Residual14938.9550.584
Total15766.6511.000
Table 3. The most abundant flowering species by season, site, and land use.
SeasonSite Olive OrchardHerbaceous PlotScrubland Plot
SpringCedãesOrnithopus compressus L.Chamaemelum mixtum (L.) All.Lavandula pedunculata (Mill.) Cav.
GuribanesCrepis capillaris (L.) Wallr.Trifolium michelianum SaviL. pedunculata
ParadelaBunias erucago L.Chrysanthemum segetum L.L. pedunculata
SummerCedãesChondrilla juncea L.Chondrilla juncea L.Helichrysum stoechas (L.) Moench
GuribanesChondrilla juncea L.Hypochaeris radicata L.Centaurea aristata subsp. langeana (Arènes) Dostál
ParadelaAndryala integrifolia L.Tolpis barbata (L.) Gaertn.Daphne gnidium L.
AutumnCedãesChondrilla juncea L.Chondrilla juncea L.Daphne gnidium L
GuribanesChondrilla juncea L.Hypochaeris radicata L.Arbutus unedo L.
ParadelaChenopodium album L.Chondrilla juncea L.Daphne gnidium L
Publisher’s Note: MDPI stays neutral with regard to jurisdictional claims in published maps and institutional affiliations.

