Proceeding Paper

Assessment of the Genetic Diversity of Ulex europaeus in Maui, California, Hawaii and New Zealand by a Method of Microsatellite Markers †

Department of Environmental Engineering, Kyoto University, Kitashirakawa Oiwakecho, Sakyo-ku, Kyoto 606-8502, Japan
*
Author to whom correspondence should be addressed.
Presented at the 1st International Electronic Conference on Plant Science, 1–15 December 2020; Available online: https://iecps2020.sciforum.net/.
Biol. Life Sci. Forum 2021, 4(1), 5; https://doi.org/10.3390/IECPS2020-08564
Published: 30 November 2020
(This article belongs to the Proceedings of The 1st International Electronic Conference on Plant Science)

Abstract

:
One of the most serious, invasive, allohexaploid plant species, Ulex europaeus, is originally from western Europe and is now spreading to the world by some unknown pathways. Plants often show phenotypic plasticity according to their environment, but elucidating the fact that the differences are derived from environmental or genetic effects is very important for further study. Thus, the aim of this study was to assess the genetic distances among Ulex europaeus from four different regions, namely Maui, California, Hawaii and New Zealand. The microsatellite method, which has been frequently used to test the genetic distances of the hexaploid plant species, was recently used for assessment because a normal single nucleotide polymorphism (SNP) often shows genotypic ambiguity on hexaploids. We tested the leaf samples of 37 mother trees from four regions (Maui: 11; California: 4; Hawaii: 7; New Zealand: 15) at five microsatellite loci. After polymerase chain reaction analyses (PCR), dinucleotide-repeat motifs (DRMs) were counted and compared to test the genetic distances of the samples. As a result, a dendrogram and analysis of molecular variance (AMOVA) showed that Ulex europaeus sampled in four different regions were genetically very close. If they show any morphological differences, they are inferred to be derived from environmental effects.

1. Introduction

Phenotypic plasticity is an important trait for the adaptation of introduced U. europaeus in many places around the world. In order to explain the mechanism of the adaptation of U. europaeus, the genetic assessment of the samples collected in unique sites, such as Maui, California, Hawaii and New Zealand, should have been completed prior to the other assessments. This helped avoid ambiguous discussion about the results, such that the morphological and physiological differences could be derived from the differences in genetic traits. Microsatellite research on human and animal genomes is commonly reported, whereas similar research on plants has to date not been reported very often [1]. U. europaeus is a hexaploid species which evolved from the hybridization of a diploid and tetraploid of different Ulex lineages [2,3]. As mentioned by multiple authors in previous studies, assessing the genetic differences of the plants of allohexaploid by methods using normal SNP (single nucleotide polymorphism) is not possible [4]. However, the genetic differences of many allohexaploid species also need to be identified in population genetics. For this reason, analytical methods using microsatellites were used and progress is being made towards efficient genetic markers in population genetics [5]. The SSR (simple sequence repeats) method, a representative method using microsatellites, has been used for genotyping plants for over 20 years because it is highly informative and can be experimentally compared [5]. One of the reasons why SSRs is widely used for population genetics is that it enables the creation of sequence-based linkage maps that visually show the difference.

2. Experiments

2.1. Materials and Methods

Samples were taken in Maui, Hawaii, California and New Zealand from July 2016 to November 2017 (Table 1). Tissue samples of the leaves were taken on FTA® Plant Card (Whatman® Co., Ltd., Maidstone, UK) and prepared for further analysis according to the protocol by Whatman® for PCR.
Five primers (Table 2) were prepared for PCR (polymerase chain reaction) used in the previous research by Hornoy et al. [6]. They chose eight microsatellites’ loci from Genetic Identification Services (GIS Inc., Chatsworth, CA, USA) and obtained clear results from 6 loci. We used five of them.
The enzyme, KOD FX Neo of TOYOBO Co., Ltd. was used for PCR experiments. PCR reactions were performed for each locus in 25 μL containing 12.5 μL of buffer, 2.5 μL of dNTP, 9 μL of deionized and sterilized water, 0.4 μL each of primers (F and R) and 0.2 μL of enzyme.
PCR was performed by an initial denaturation step at 94 °C for 2 min, 35 cycles with 10 s denaturation at 98 °C, 30 s hybridization of primers at 60 °C and 1 min elongation at 68 °C, with a final elongation step at 68 °C for 7 min, using iCycler (Bio Rad Laboratories, California, USA). After checking the condition of the bands at electrophoresis with 2% agarose gel, next generation sequencing of the PCR products was conducted by Takara Bio Inc. (Kusatsu, Shiga, Japan).

2.2. Data Analysis

Genetic diversity among and within populations was estimated by the analysis of molecular variance with the software GenAlEx [7]. In addition, a cluster dendrogram was calculated and indicated by software R ver. 3.3.2 [8].

2.3. Estimation of Genetic Distance

All the FASTA data were checked with software ApE (Utah University, free software) and the effective length of the PCR product was manually determined. Only dinucleotide-repeat motifs (DRMs) were focused this time because they have been identified as an enhancer that expresses the gene [9]. Furthermore, as the length of the DNA fragment is often changed, affected by insertion or deletion, as directly counting the repeat numbers was suggested to determine the genotypes of SSR (short sequence repeat) or STR (short tandem repeat) marker more correctly [10]. In this reason, the repeat number of the most common motifs found in five loci, GT/TG, CT/TC, AG/GA, AG/GA, AG/GA, respectively, were counted by each locus using a software SEAVIEW [11] and accordingly amended to the mean effective product size (160 bp this time) for the comparison. By using the data taken, AMOVA was tested to see whether the genetic variation and cluster analysis for making the dendrogram with 1000 bootstraps was performed by using R. ver. 3.3.2 [8].

3. Results and Discussion

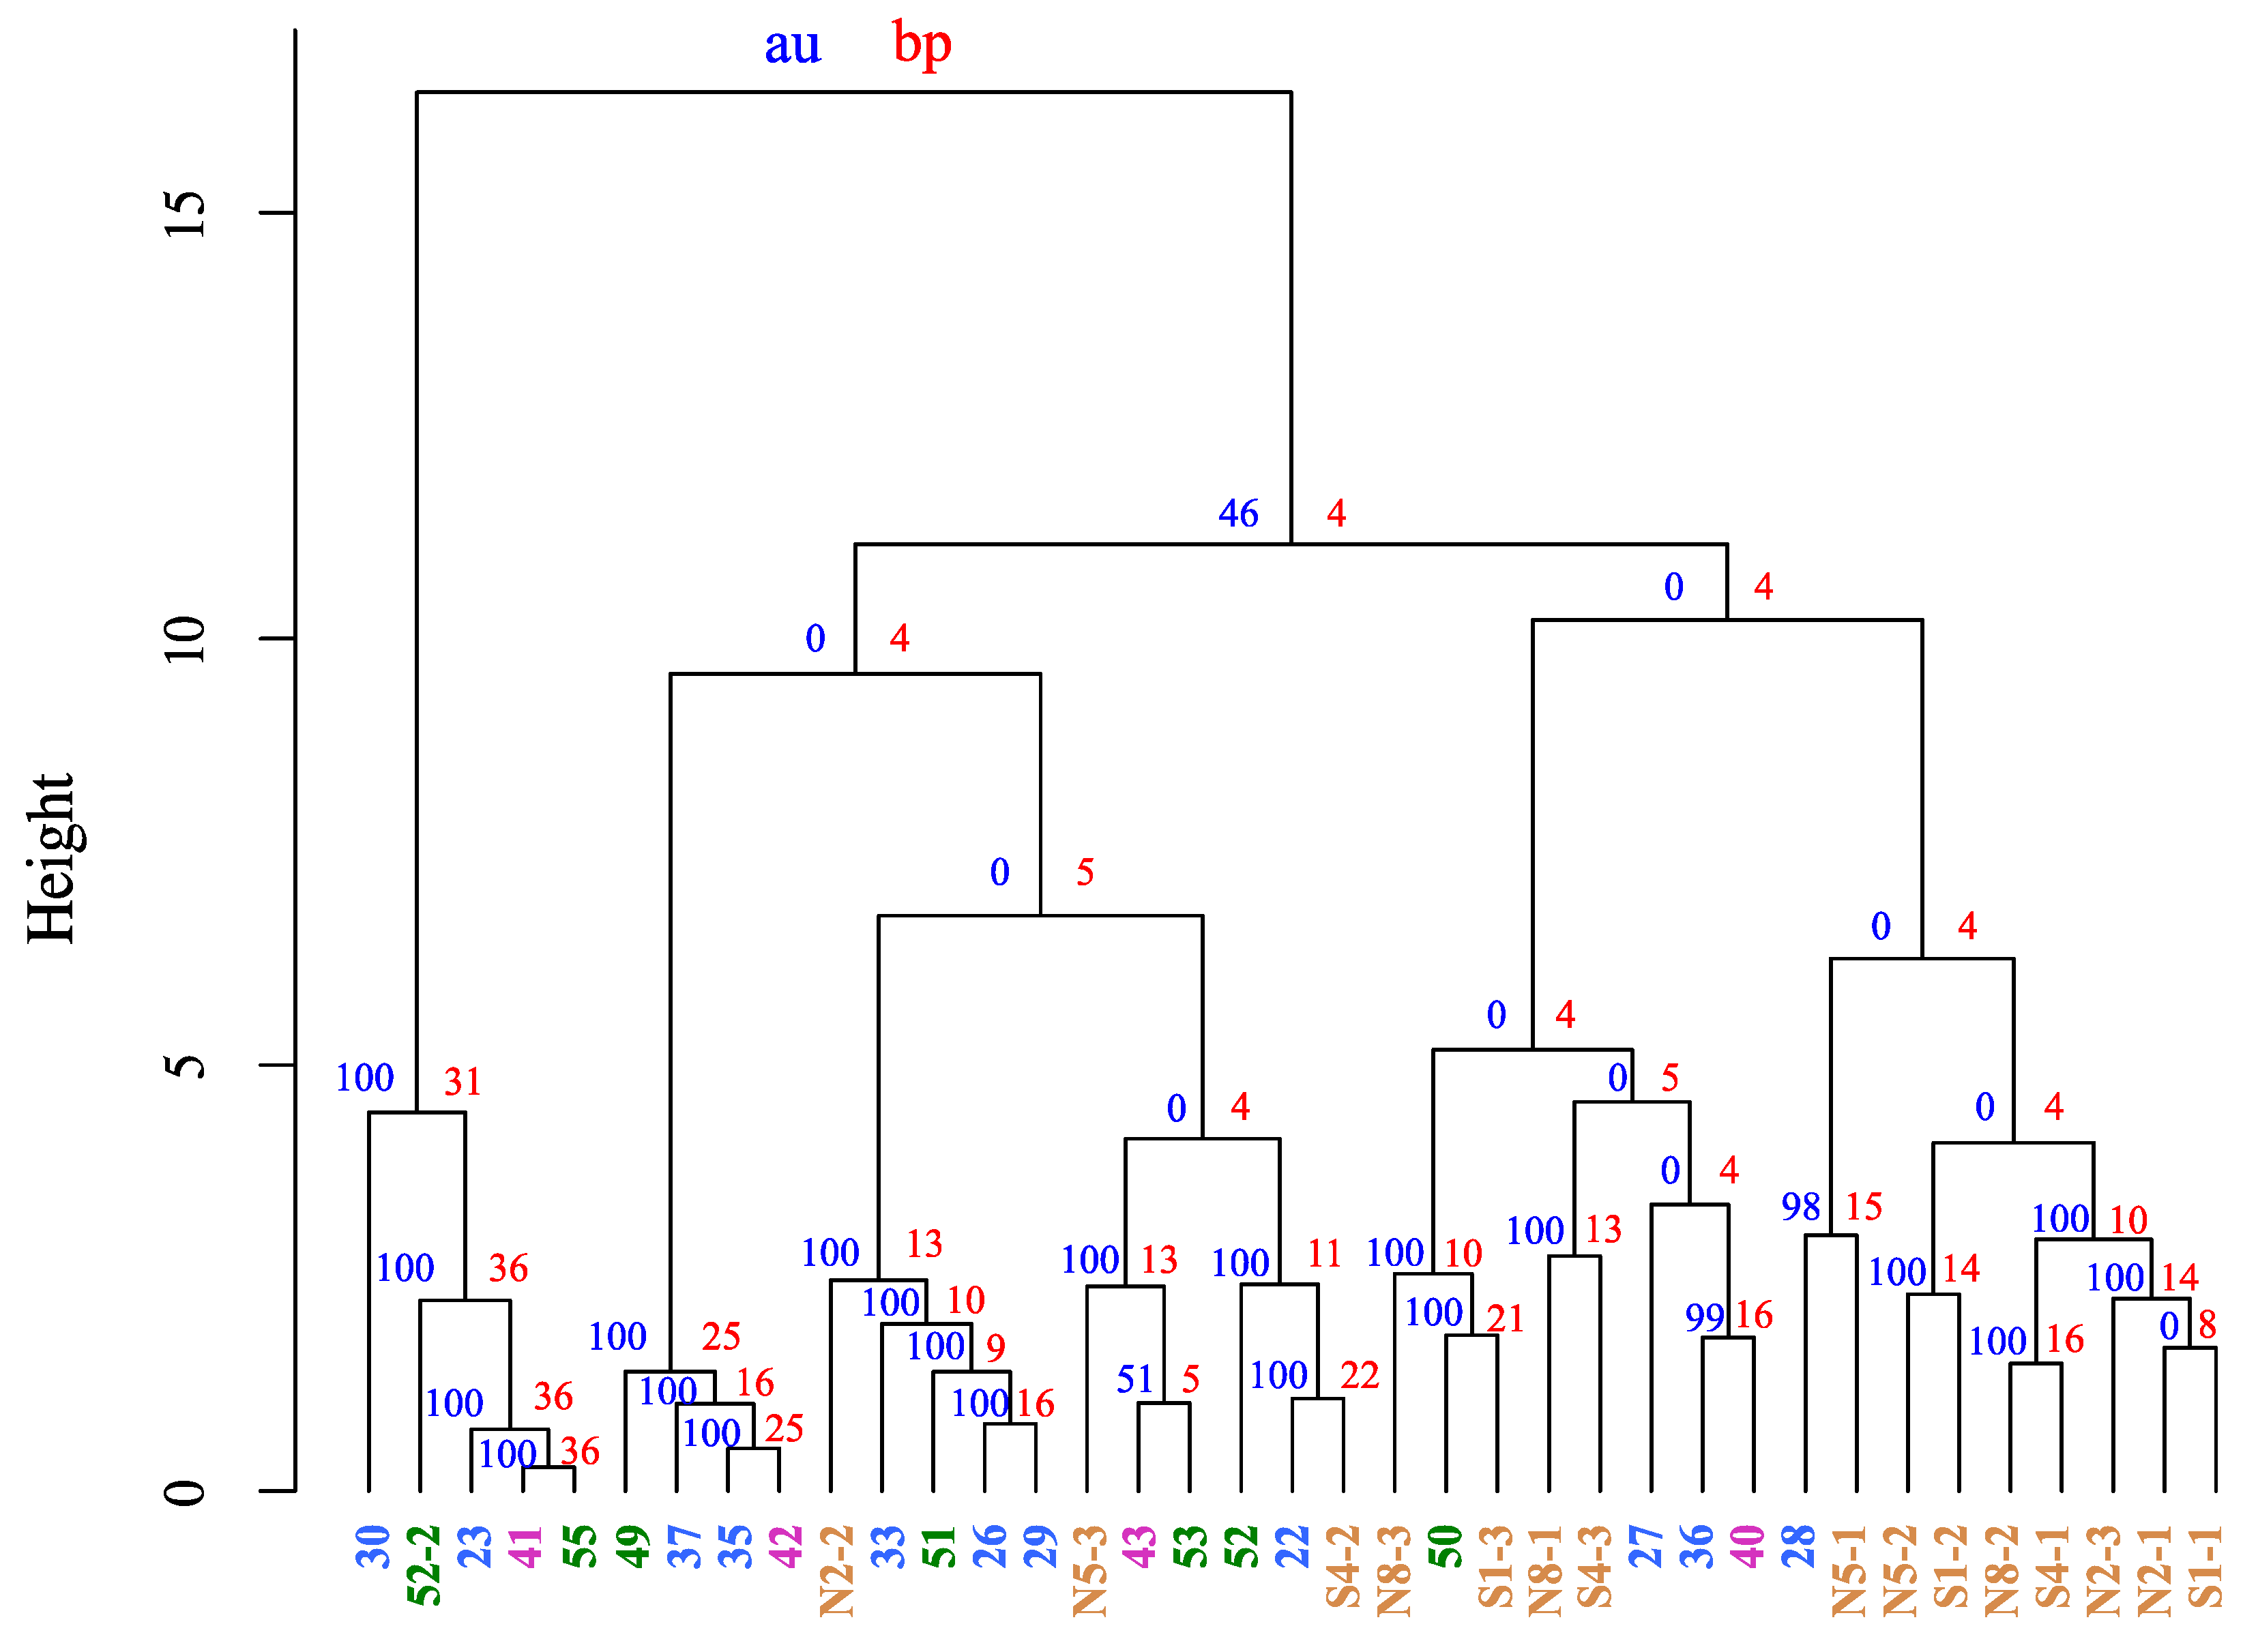
3.1. Cluster Analysis

The number of each target dinucleotide repeats were counted using SEAVIEW [11], as shown in Table 3.
As the next step, the data from Table 3 were analyzed by software R ver. 3.3.2 [8] for the dendrogram of Figure 1 (1000 boot strap) in order to visualize the correlation data of microsatellite results. The vertical axis was labeled as distance and refers to a distance measure between compounds or compound clusters. The height of the node can be thought of as the distance value between the right and left sub-ranch clusters. When D (distance) and C (correlation) are between a compound cluster, D = 1 − C. If compounds are highly correlated, they will have a correlation value close to 1, and the D (1 − C) will have a value close to zero. Therefore, highly correlated clusters are nearer the bottom of the dendrogram. As clusters increase in size, their abundance profiles become more general. From the result of the dendrogram (Figure 1), U. europaeus sampled in Maui, California, Hawaii and New Zealand show the similarity in genetic distances.

3.2. Analysis of Molecular Variance

In addition, the data from Table 3 were analyzed by GenAlEx to see the genetic variation. Table 4 shows the result of AMOVA.
Though the p-value was not significant, the results inferred that the most variation (95%) was detected among populations, and just 5% attributed to variation within four populations. These results showed that the genetic variation mainly occurred among populations: 95% of the total variations. In other words, Ulex europaeus which invaded and propagated in Maui, Hawaii, California and New Zealand did not show a large genetic difference among invaded populations. The genetic distance among the 37 samples of different mother trees (11, 4, 7, 15 from Maui, California, Hawaii and New Zealand, respectively) was not significantly large; Ulex europaeus of the above four sites were inferred to be introduced from very close places. Though a very stable and accurate method to assess the genetic distance of the plants has to date not been innovated, microsatellites are inferred to be the most useful methods [5]. Whenever the invasiveness of a plant is discussed, the main driver is concluded as its variability. As not all the original places of the invasive species were correctly recorded, records of the introduction of U. europaeus to the USA (Hawaii Island, Maui Island and California) and New Zealand were ambiguous. However, if the same plant species with long genetic distance were compared, the variability could be ambiguous. Furthermore, we question the possibility of discussing the results of the phenotypic plasticity of the samples of the same species from many spaciously different populations without performing any genetic assessments. The results of this investigation were used as the first benchmark before discussing the phenotypic plasticity of U. europaeus sampled in the USA (Hawaii Island, Maui Island and California) and New Zealand; their genetic distance was not very large.

4. Conclusions

U. europaeus is known to have originated in western Europe and has spread across the world. However, the introduction cases varied, and some are not very well documented. The genetic variation among U. europaeus, even in the place they originate from, has been revealed by recent study [6], and it has become mandatory to distinguish the genetic differences among Ulex europaeus in its invaded places far away from western Europe for further studies, such as strategies of invasibility. From the results shown in this study, the genetic distances of Ulex europaeus sampled in Maui, California, Hawaii and New Zealand are very close, and these could be the benchmark for further studies.

Supplementary Materials

The poster presentation is available online https://www.mdpi.com/article/10.3390/IECPS2020-08564/s1.

Author Contributions

M.H. and E.N. designed the investigation and experiments, analyzed the data and wrote the manuscript. All authors have read and agreed to the published version of the manuscript.

Acknowledgments

We would like to thank J.B. Friday with the University of Hawaii at Manoa, Pamela Scheffler with Hawaii Community College and staffs with Landcare Research and AgResearch of New Zealand for giving us advice, and the staff of US Fish and Wildlife Service in Hakalau and Land Manager, Jordan Jokiel of Haleakala Ranch for supporting sampling. This study was partly supported by a JSPS KAKENHI Grant (Grant No. 26257418).

Conflicts of Interest

The authors declare no conflict of interest.

References

  1. Gao, C.; Ren, X.; Mason, A.S.; Li, J.; Wang, W.; Xiao, M.; Fu, D. Revisiting an important component of plant genomes: Microsatellites. Funct. Plant. Biol. 2013, 40, 645–661. [Google Scholar] [CrossRef]
  2. Ainouche, A.; Bayer, R.; Cubas, P.; Misset, M.T. Phylogenetic relationships within tribe Genisteae (Papilionoideae) with special reference to genus Ulex. In Advances in Lugume Systematics Part 10, Higher Level Systematics; Klitgarrd, B.B., Bruneau, A., Eds.; Royal Botanic Gardens: Kew, UK, 2003; pp. 232–252. [Google Scholar]
  3. Ainouche, A.; Mahe, F.; Affagard, M.; Ainouche, M.; Misset, M. Molecular evidence for an allopolyploid origin of the invasive European gorse, Ulex europaeus subsp. europaeus (Fabaceae, Genistae). In Proceedings of the International Conference on Polyploidity, Hybridization and Biodiversity, University of Rennes, Rennes, France, 17–20 May 2009; p. 202. [Google Scholar]
  4. Blischak, P.D.; Kubatko, L.S.; Wolfe, A.D. SNP genotyping and parameter estimation in polyploids using low-coverage sequencing data. Bioinformatics 2017, 34, 407–415. [Google Scholar] [CrossRef]
  5. Vieira, M.L.C.; Santini, L.; Diniz, A.L.; de Munhoz, C.F. Microsatellite markers: What they mean and why they are so useful. Genet. Mol. Biol. 2016, 39, 312–328. [Google Scholar] [CrossRef] [PubMed]
  6. Hornoy, B.; Atlan, A.; Roussel, V.; Buckley, Y.M.; Tarayre, M. Two colonisation stages generate two different patterns of genetic diversity within native and invasive ranges of Ulex europaeus. Heredity 2013, 111, 355–363. [Google Scholar] [CrossRef] [PubMed] [Green Version]
  7. Peakall, R.; Smouse, P.E. GenAlEx 6.5: Genetic analysis in Excel. Population genetic software for teaching and research-an update. Bioinformatics 2017, 28, 2537–2539. [Google Scholar] [CrossRef] [PubMed] [Green Version]
  8. R Core Team. R: A Language and Environment for Statistical Computing; R Foundation for Statistical Computing: Vienna, Austria, 2018. [Google Scholar]
  9. Yáñez-Cuna, J.O.; Arnold, C.D.; Stampfel, G.; Boryń, Ł.M.; Gerlach, D.; Rath, M.; Stark, A. Dissection of thousands of cell type-specific enhancers identifies dinucleotide repeat motifs as general enhancer features. Genome Res. 2014, 24, 1147–1156. [Google Scholar] [CrossRef] [PubMed] [Green Version]
  10. Hasegawa, Y.; Asano, R.; Kobayashi, Y.; Fukushima, J.; Takada, K. Comparison of NGS-SSR analyses and fragment analyses at SSR marker genotyping. J. Jpn. For. Sci. 2017, 128, 92. [Google Scholar] [CrossRef]
  11. Gouy, M.; Guindon, S.; Gascuel, O. SeaView version 4: A multiplatform graphical user interface for sequence alignment and phylogenetic tree building. Mol. Biol. Evol. 2010, 27, 221–224. [Google Scholar] [CrossRef] [PubMed] [Green Version]
Figure 1. Dendrogram of Ulex europaeus sampled in Maui, California, Hawaii and New Zealand after 1000-boot strap. Blue: Maui; green: Hawaii; pink: California; yellow with N: New Zealand North Island; yellow with S: New Zealand South Island. Au, bp are two types of p-values (%): au (approximately unbiased) p-value and bp (bootstrap probability) value.
Blsf 04 00005 g001
Table 1. Location and coordinates of Ulex europaeus sampled for PCR experiments.
LocationMother TreeLatitudeLongitudeAltitude (m)Habitat
Maui#22N20.76W156.271758Ranch
#23N20.76W156.271823Ranch
#26N20.77W156.261767Ranch
#27N20.77W156.261763Ranch
#28N20.77W156.261763Ranch
#29N20.78W156.251773Ranch
#30N20.78W156.251768Ranch
#33N20.79W156.251656Ranch
#35N20.8W156.281060Forest
#36N20.8W156.281067Forest
#37N20.8W156.281046Forest
California#40,41,42,43N37.15W122.3433, 33, 34, 31Fallow land
Hawaii#49N19.72W155.442004Ranch
#50N19.72W155.432058Ranch
#51N19.93W155.412015Ranch
#52N19.73W155.391952Ranch
#52-2N19.73W155.391952Ranch
#53N19.74W155.371929Ranch
#55N19.77W155.361980Ranch
New ZealandN2-1, 2, 3S36.88E174.840Fallow land
N5-1, 2, 3S37.86E175.8297Roadside of a ranch
N8-1, 2, 3S38.99E175.76538Fallow land with grass
S1-1, 2, 3S43.8E173623Ranch
S4-1, 2, 3S43.5E172.5238Roadside of a ranch
Table 2. Five microsatellite loci used in the experiments.
LocusPrimers(Primers) (μM)
A110F: 5′-CTATGGTGAATTTGTGATACAC-3′0.35
R: 5′-ACCTTGTTGCATCTTTACC-3′
A125F: 5′-GCATATACATACCCGAGGTAAG-3′0.26
R: 5′-AACCTGATGAAATGCACTATTC-3′
B4F: 5′-GGGCTCTGGCTCTGATAC-3′0.2
R: 5′-TTGGATTAACCAACTTTCCTC-3′
B104F: 5′-GAACCTTATTCACTGGAATCTG-3′0.3
R: 5′-CCCTTTTCTTTCCTTTCTTAAC-3′
B123F: 5′-AATTTGCCTGACATTGTTACTC-3′0.22
R: 5′-AGACCGTGTTCATTATGGTTAG-3′
Table 3. Dinucleotide repeats number of 36 individuals. M: Maui; C: California; H: Hawaii; N-N: New Zealand North Island; N-S: New Zealand South Island.
Selected Loci
Sample NOPopulationA110A125B4B104B123
22M12160010
23M000023
26M1000815
27M120000
28M00020
29M1700613
30M00005
33M500826
35M12027021
36M1100130
37M14012019
40C12150140
41C000019
42C9023018
43C112701415
49H5036020
50H1403600
51H1700216
52H1300019
52-2H000039
53H134803815
55H000017
N2-1N-N4711417
N2-2N-N000418
N2-3N-N025614
N5-1N-N022030
N5-2N-N022370
N5-3N-N02201014
N8-1N-N323000
N8-2N-N152643313
N8-3N-N11214100
S1-1N-S12204616
S1-2N-S18267150
S1-3N-S13032200
S4-1N-S02437510
S4-2N-S12260024
S4-3N-S2111000
Table 4. Results of the molecular variance of U. europaeus sampled in 3 regions for this study. Probability, P (rand ≥ data), for PhiPT is based on standard permutation across the full data set.
SourcedfSSMSEst. Var.%
Among Pops42960.2740.0527.795%
Within Pops3217,276.99539.91539.9195%
Total3620,237.19 567.69100%
StatValueP (rand ≥ data)
PhiPT0.050.11
Publisher’s Note: MDPI stays neutral with regard to jurisdictional claims in published maps and institutional affiliations.

