Proceeding Paper

A GIS-Based Approach for Manure-Spreading Monitoring within the Digital Agricultural Framework †

1
Institute for Environmental Protection and Research (ISPRA), Via Vitaliano Brancati 48, 00144 Roma, Italy
2
Arpae-Struttura IdroMeteoClima, Viale Silvani 6, 40122 Bologna, Italy
3
Department of History and Cultures (DiSCi)-Geography Section, University of Bologna, Via Guerrazzi 20, 40125 Bologna, Italy
4
Science, Technology and Society Department, Istituto Universitario di Studi Superiori di Pavia (IUSS), Palazzo del Broletto, Piazza della Vittoria 15, 27100 Pavia, Italy
*
Author to whom correspondence should be addressed.
Presented at the 3rd International Electronic Conference on Agronomy, 15–30 October 2023; Available online: https://iecag2023.sciforum.net/.
Biol. Life Sci. Forum 2023, 27(1), 18; https://doi.org/10.3390/IECAG2023-15804
Published: 2 November 2023
(This article belongs to the Proceedings of The 3rd International Electronic Conference on Agronomy)

Abstract

:
Livestock manure management, especially related to soil-fertilisation practice, is responsible for most of the emissions in agriculture, and in particular the ammonia emissions (NH3), which play a key role in environmental problems, affecting water, soil and air quality. Within the digital agricultural framework, EO data contribute to agricultural-practices monitoring such as manure spreading, to mitigate pollutant emissions. This study presents a GIS-based tool on an open-source platform, developed for susceptibility estimation of sewage spreading occurrence in agricultural areas of Italy. The tool is based on the analysis of multispectral and hyperspectral satellite time series in synergy with field data and ancillary information collected from regional repositories, to produce a series of classified and prioritised spatially explicit information. Spectral analysis of satellite acquisitions enabled the identification of manure spreading with the precision of about 83%. Field campaigns from October to March were carried out to validate the spreading event. The case study demonstrates the ability of the proposed GIS-based tool in supporting the monitoring of manure spreading.

1. Introduction

The agricultural sector has a strong impact on emission of pollutants, including ammonia from livestock farming and the fertilisation of agricultural land.
At the European level, farmers will be permitted to spread manure in specific temporal windows [1], although monitoring every plot of land is a critical point [2].
The approach of integrating Earth Observation acquisitions, ground data and available datasets bring benefits to help deal with issue [2]. Within this perspective, the objective of the activity is to develop a tool to support monitoring of manure spreading. The final result is a GIS-based tool that estimates the areas most susceptible to manure spreading.

2. Materials and Methods

The study area identified to develop and demonstrate tool capacity is the Po Plain (Figure 1), one of the regions most involved in agricultural activity in Italy. The tool was developed using the open source software QGIS.
A number of surveys were conducted in the northeast and in the east of the study area (province of Modena and Bologna) (Figure 1) to collect Ground Truth Points (GTPs).
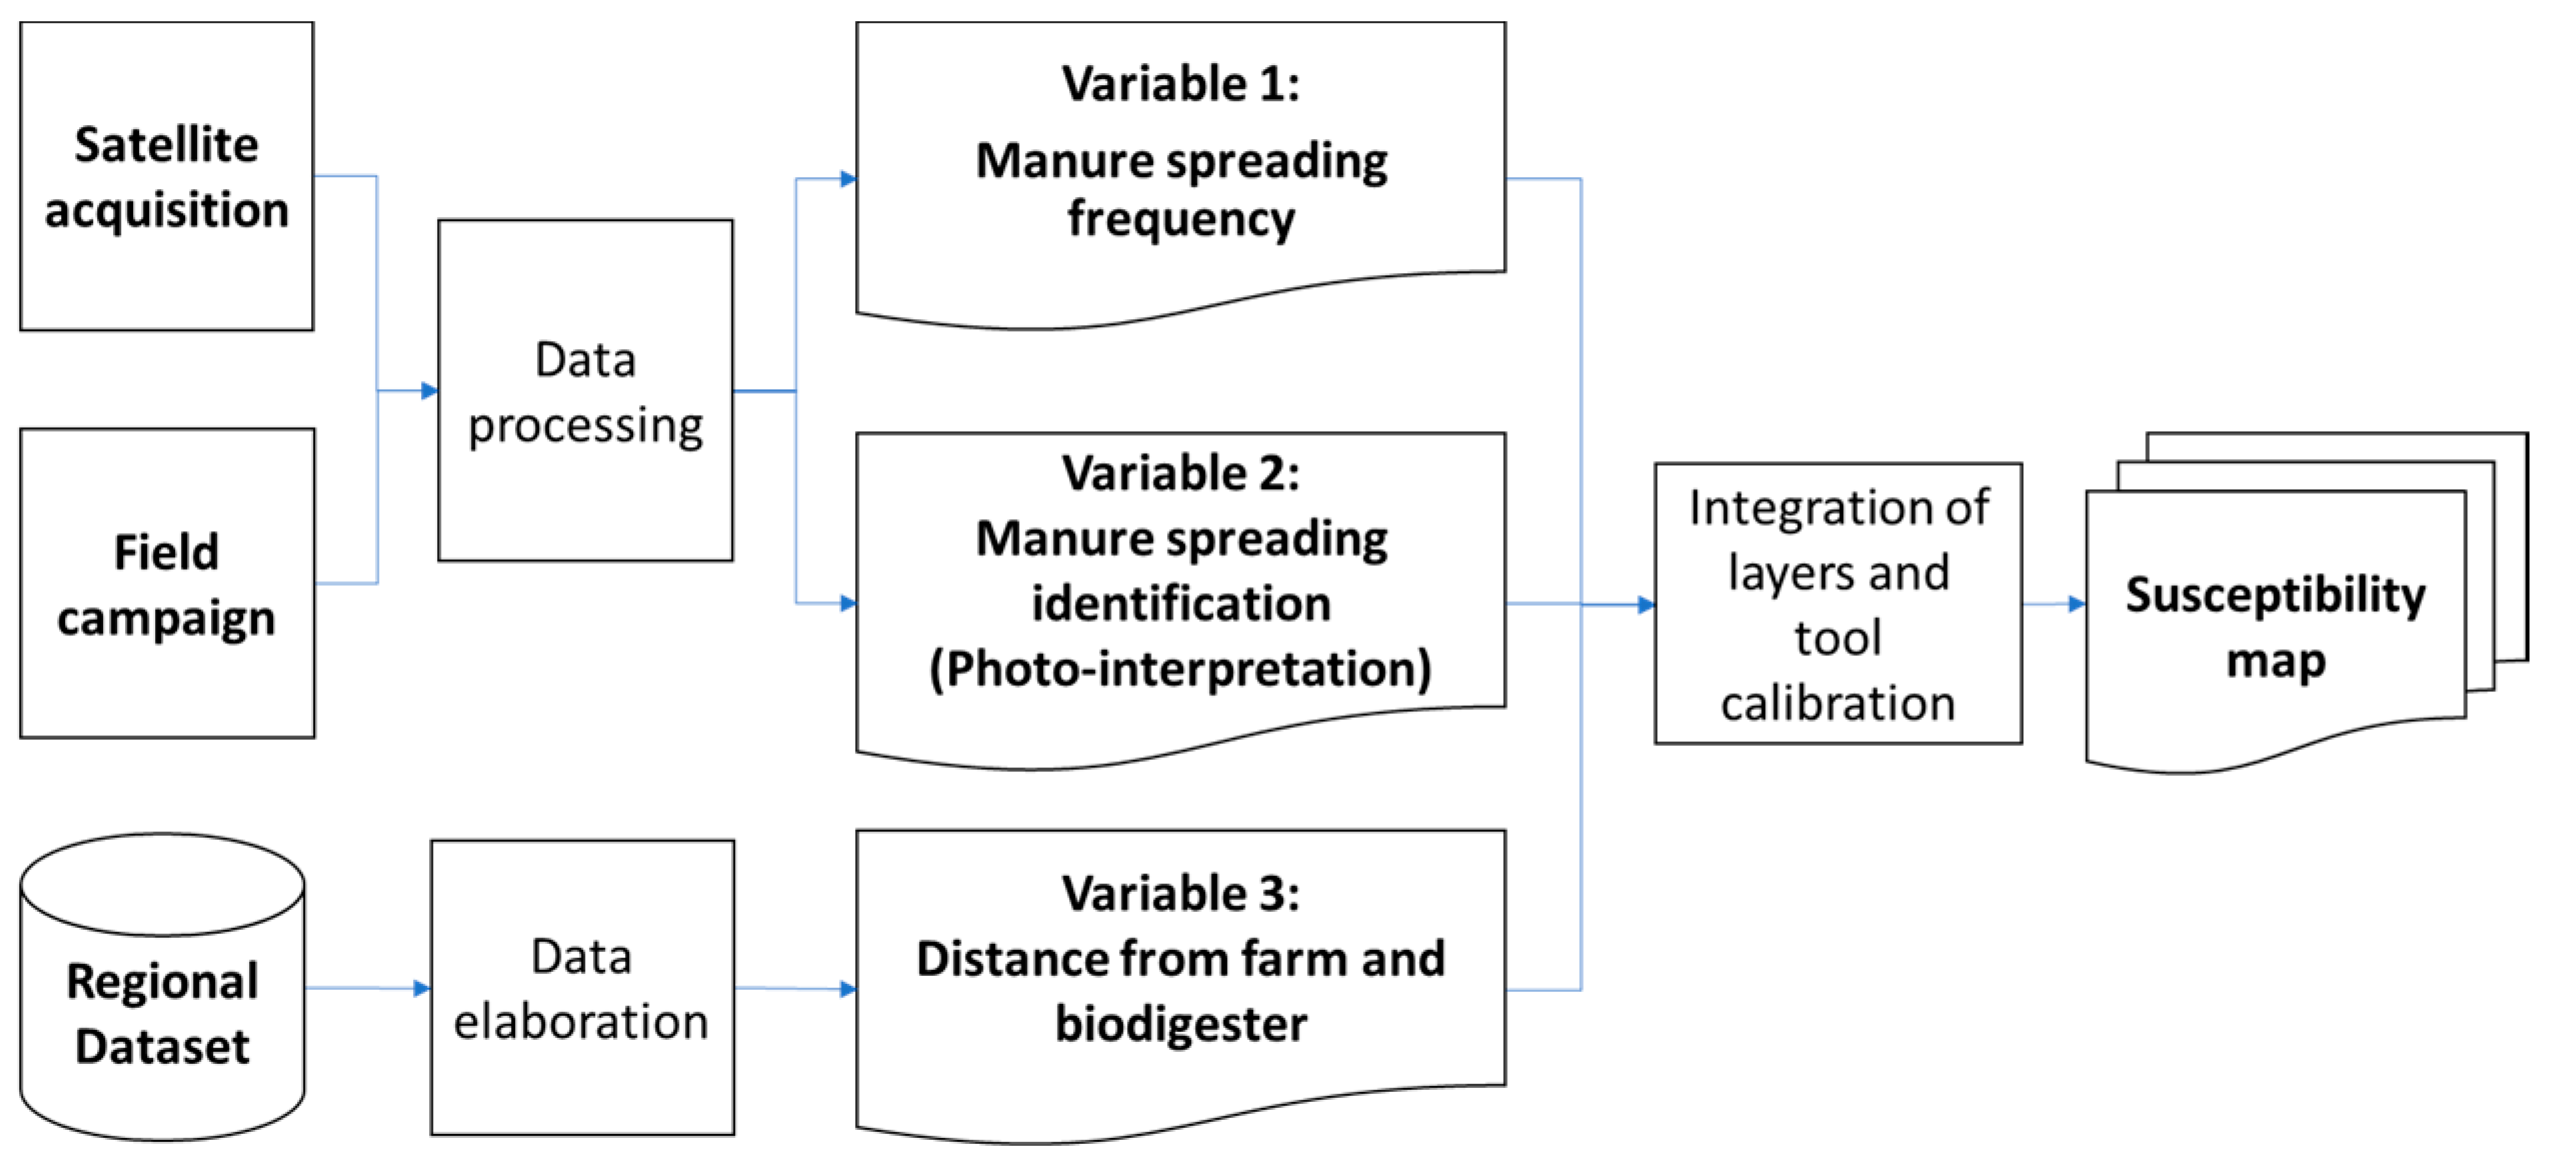
The approach is based on a combination of the following set of relevant spatially explicit variables, combined using a weighted formula:
  • Variable 1: Manure spreading frequency;
  • Variable 2: Manure spreading areas manually detected;
  • Variable 3: Distance from farms and/or bio-digesters.
The data-processing approach is shown in Figure 2.

2.1. Satellite Acquisitions

In this study, 46 Sentinel-2 MSI (S2) acquisitions (from February 2020 to February 2023) and 3 PRISMA acquisitions (collected on 7 and 25 November 2020 and 26 March 2021), both characterised by a minimal cloud coverage, were analysed. The technical specification of satellite data is summarised in Table 1. The processing operations, for both S2 and PRISMA acquisitions, have been executed using the software ENVI version 5.6.

2.2. Field Campaigns

Field campaigns were carried out to collect a dataset of GTPs, used to validate the spreading and non-spreading areas (Figure 3).
Field campaigns were performed in the temporal window from October to March: October manure spreading for winter crops, November to February fertilisation ban and March soil/land prepared for new crops.
Measurements of relative humidity, electrical conductivity and temperature were taken in the fields surveyed. They were carried out both where spillage had occurred and where it had not.

2.3. Satellite-Data Processing

First, the satellite acquisitions were pre-processed by applying raster masks that isolate arable fields by integrating the following ancillary datasets: Soil Map [5] to circumscribe the lowlands; Land Use [5] and Land Consumption [6] to exclude urban and non-agricultural; and Crop Map [7] to exclude grassland and alfalfa.
Then, spectral analysis was carried out in order to investigate manure-spreading response. Average reflectance values for each spectral band acquired using the satellite sensor were extracted and analysed, in particular for spread areas. Variations in the ShortWaveInfra-Red (SWIR) region of the electromagnetic spectrum (corresponding to bands B11 and B12 of S2 MSI data) have been considered to be more suited in manure-spreading detection, according to the scientific literature [2,8].
Finally, a spectral index calculated from the combination of SWIR, near-infrared (NIR) and red spectral bands of S2 MSI was employed to map manure spread regions in each satellite acquisition:
Manure   Spectral   Index = ( S W I R 1 + S W I R 2 ) N I R R E D
The separation between manure and other land cover has been reached with a threshold of 3, which represents the optimal performance according to the overlapping rate test for the pure pixel detection. Furthermore, the pixel aggregation procedure has removed the noise. These steps constitute a semi-automatic processing that provides the raw dataset utilised for the development of two different independent products: Variable 1 and Variable 2.
The manure spectral index, with the selected threshold, provides a precision of about 83% in the manure spread class; the statistical robustness is supported by a kappa coefficient value of 0.86. The test dataset consists of 1090 pure pixels (corresponding to about 11 hectares) that have been selected on two S2 MSI acquisitions, temporally consistent with the field campaign dates. Such accuracy evaluations, however, have been only performed over the surveyed sites.

2.4. Variable 1: Manure Spreading Frequency

The analysis of the preliminary output of the satellite-data processing has shown that some areas were more often involved with manure-spreading events; thus, the spreading frequencies have been investigated. Firstly, the data redundancy has been mitigated, realising a 350 m buffer for each candidate “manure spread” area. Later, each buffer was assigned the value 1, while the background was set to value 0. Then, manure-spread rates have been obtained by summing up the manure-spread maps generated from each satellite acquisition. Ultimately, the obtained values were converted into five classes, each of which was assigned a susceptibility value (as reported in Table 2). Manure spreading frequencies lower than 5 have been excluded, since they could represent a low-impact fertilisation practice.

2.5. Variable 2: Manure Spreading Manual Identification Areas

Using photo-interpretation, an expert operator confirmed manure-spreading areas identified by semi-automatic processing, in order to refine the product by removing false positives. The resulting product consists of a spatially explicit variable in which manure-spread regions are identified with a 350 m radius buffer. Buffer operation has enabled the aggregation of contiguous manure-spread areas. Buffer areas and background pixels have been assigned the values 1 and 0, respectively.

2.6. Variable 3: Distance from Farms and/or Bio-Digesters

Spray fields are typically located in close proximity to animal houses and manure lagoons due to the high cost of hauling the liquid [9,10,11,12,13]. Positions of livestock farms and biodigester (main manure storage points in Po Plain) were identified using information on the characteristics of farms and biodigesters in the Emilia–Romagna region found in regional datasets [14]. Only cattle farms with more than 80 animals/farm and pig farms with more than 600 animals/farm were selected.
A spatial analysis was then performed to assign each pixel in the study area a distance value from farms and biodigesters.
The last step was to reclassify the distance values into discrete classes by assigning each ring a susceptibility value between 0.2 and 1, as reported in Table 3. The assigned values were agreed upon with the stakeholders.

2.7. Integration of Variables and Tool Calibration

In order to prioritise and integrate the three variables, a set of weights, agreed upon with the primary users, were assigned to combine variables according to formula:
Susceptibility = (0.4 × Variable 1) + (0.2 × Variable 2) + (0.4 × Variable 3).
Within the variable-integration process, statistical indicators have been evaluated. Among the coefficient combinations following a normal distribution, the one that better shows the balance between the three variables has been selected. Thus, very high susceptibility rates are detected uniquely in the areas where the three variables reach a maximum value.

3. Results

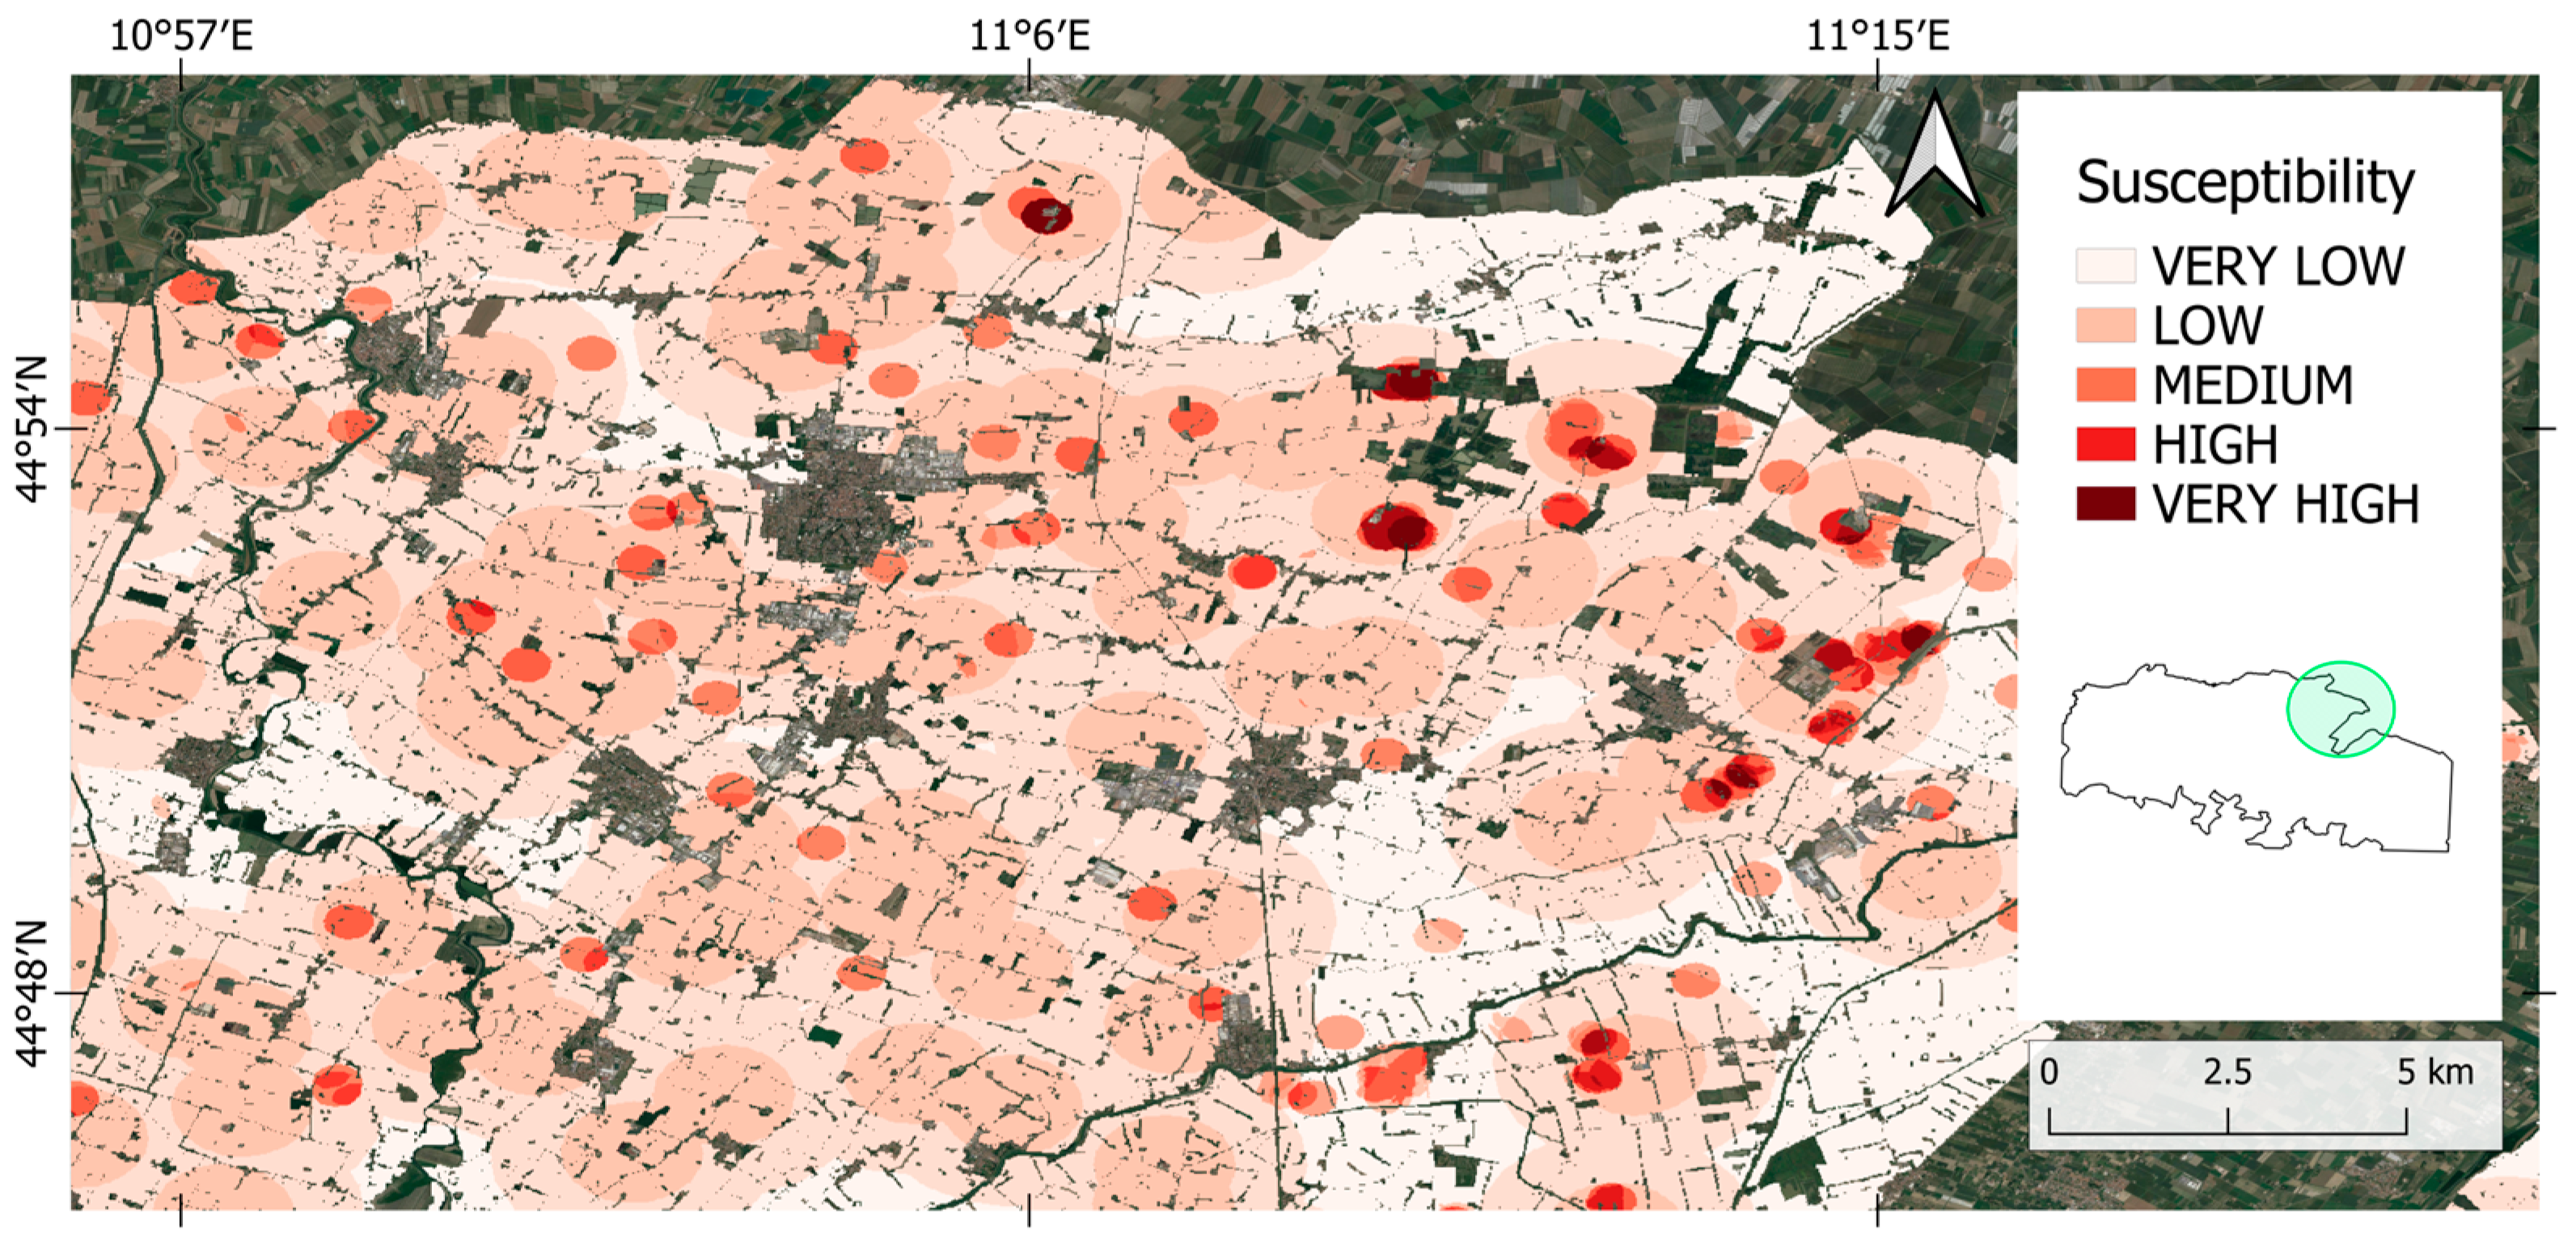
The product of the Formula (2) is the susceptibility tool (Figure 4), which ranges 0 to 1.
The values were converted into five classes (from very low to very high) to enhance the readability (Table 4).

4. Discussion and Conclusions

Regarding the parameters measured in field campaigns, no evidence was found between the spreading and the non-spreading areas. However, surveys have been essential in evaluating the correspondence between the satellite and the ground data. New field campaigns could be carried out together with soil chemical analyses to better investigate any differences and to enhance the accuracy of the monitoring of the area. In this study, the accuracy of the manure spectral index is calculated on test areas and will be implemented simultaneously with the aforementioned field campaigns.
The tool could be tailor-made to users’ needs for different geographic areas modifying the weights used for each variable in the Formula (2). In addition, the manure-spreading frequency could be provided annually, estimated from satellite time series analysis updates.
It is important to note that the study presents obstacles such as that it still needs an operator to validate the data, and the critical point to identify spreads in vegetated land.
Despite the above-mentioned limitations, the proposed approach has been proved to be a valid and innovative digital method to produce the susceptibility map. This GIS-based tool could serve as an information instrument for territory management, for the area monitoring system (AMS) to be adopted by 2024, as foreseen in article 70 (1) of Regulation (EU) 2021/2116, and for the achievement of the new Air Quality Directive 2008/50/CE targets for ammonia emissions.

Author Contributions

Conceptualization, A.T., A.P. and C.A.; methodology, A.T., A.P. and C.A.; software, S.R., M.B. and V.Z.B.; writing—original draft preparation, S.R., M.B. and V.Z.B.; writing—review and editing, A.T., A.P., S.S. and F.F.; supervision, A.T., M.D. and C.A.; project administration A.T. and C.A.; and funding acquisition, A.T. All authors have read and agreed to the published version of the manuscript.

Funding

This research was funded in the framework of the European Programme “Caroline Herschel Framework Partnership Agreement on Copernicus User Uptake, Specific Grant Agreement (SGA) #18 del 2021 SI2.858542/18 (ENV) between the European Commission and DLR (Deutsches Zentrum Fuer Luft—UND RAUMFAHRT EV), that include the action n. 2021-3-19—Geospatial Intelligence for Environment Protection against illegal activities (GEOINT4ENV)”.

Institutional Review Board Statement

Not applicable.

Informed Consent Statement

Not applicable.

Data Availability Statement

The data will be made available with a reasonable request to the corresponding author.

Acknowledgments

This work contains modified Copernicus Sentinel data (2023). Sentinel-2 MSI data used were available at no cost from ESA Sentinels Scientific Data Hub. Project carried out using ORIGINAL PRISMA Products—© Italian Space Agency (ASI). The authors want to acknowledge the Emilia–Romagna Region—DG Agricoltura Caccia e Pesca for the information in support of this action.

Conflicts of Interest

Arpae-Struttura IdroMeteoClima, as an environmental protection agency, has an interest in the development of such a service product to cope with the national and international legal requirements. Therefore, its contribution is not only scientific but also as a user.

References

  1. Tzilivakis, J.; Warner, D.; Green, A.; Lewis, K. A broad-scale spatial analysis of the environmental benefits of fertiliser closed periods implemented under the nitrates directive in europe. J. Environ. Manag. 2021, 299, 113674. [Google Scholar] [CrossRef] [PubMed]
  2. Pedrayes, O.D.; Usamentiaga, R.; Trichakis, Y.; Bouraoui, F. Remote sensing for detecting freshly manured fields. Ecol. Inform. 2023, 75, 102006. [Google Scholar] [CrossRef]
  3. Sentinel Copernicus. ESA. Available online: https://sentinels.copernicus.eu/web/sentinel/missions/sentinel-2/overview (accessed on 6 September 2023).
  4. PRISMA. ASI. Available online: https://www.asi.it/scienze-della-terra/prisma/ (accessed on 6 September 2023).
  5. Cartografie e Uso del Suolo di Dettaglio. Regione Emilia-Romagna. Available online: https://www.regione.emilia-romagna.it/ (accessed on 23 March 2023).
  6. Uso, Copertura e Consumo di Suolo. ISPRA. Available online: https://www.isprambiente.gov.it/it/banche-dati/banche-dati-folder/suolo-e-territorio/uso-del-suolo (accessed on 11 May 2023).
  7. iColt 2022. Arpae Servizio Idro-Meteo-Clima. Available online: https://sites.google.com/arpae.it/servizio-climatico-icolt/icolt2022 (accessed on 11 May 2023).
  8. Dodin, M.; Smith, H.D.; Levavasseur, F.; Hadjar, D.; Houot, S.; Vaudour, E. Potential of sentinel-2 satellite images for monitoring green waste compost and manure amendments in temperate cropland. Remote Sens. 2021, 13, 1616. [Google Scholar] [CrossRef]
  9. Bergström, L.; Bowman, B.t.; Sims, J.t. Definition of sustainable and unsustainable issues in nutrient management of modern agriculture. Soil Use Manag. 2008, 21, 76–81. [Google Scholar] [CrossRef]
  10. Furiness, C.S.; Cowling, E.B.; Frederick, D.J.; Zering, K.D.; Abt, R. Using Animal Manures in Forest Fertilization; North Carolina State University: Raleigh, NC, USA, 2011. [Google Scholar]
  11. Furiness, C.S.; Cowling, E.B.; Abt, R.; Frederick, D.J.; Zering, K.D. Forests as an Alternative for Swine Manure Application; North Carolina State University: Raleigh, NC, USA, 2019. [Google Scholar]
  12. Long, C.M.; Muenich, R.L.; Kalcic, M.M.; Scavia, D. Use of manure nutrients from concentrated animal feeding operations. J. Great Lake. Res. 2018, 44, 245–252. [Google Scholar] [CrossRef]
  13. Shea, K.; Schaffer-Smith, D.; Muenich, R.L. Using remote sensing to identify liquid manure applications in eastern North Carolina. J. Environ. Manag. 2022, 317, 115334. [Google Scholar] [CrossRef] [PubMed]
  14. Open Data di Arpae. Available online: https://dati.arpae.it/dataset (accessed on 8 September 2023).
Figure 1. Study area in Po Plain (in red). Surveys carried out in the green-marked areas.
Blsf 27 00018 g001
Figure 2. Workflow of the methodology for the GIS-based tool development (susceptibility map).
Blsf 27 00018 g002
Figure 3. Field campaign measures and S2 MSI true colour acquisition over the surveyed site.
Blsf 27 00018 g003
Figure 4. Susceptibility tool, zoom on the north-east portion of the Modena province.
Blsf 27 00018 g004
Table 1. Technical specification of satellite data [3,4].
AgencySatelliteTypeResolutionBandsSensorAccess
ESASentinel-2Level 1C10/20 m13MultispectralOpen data
ASIPRISMALevel 2D30 m240HyperspectralBy request
Table 2. Susceptibility values depending on the automatic frequency computation.
Number of SpreadsSusceptibility Value
<50
5–60.25
7–80.50
9–100.75
>101
Table 3. Spreading susceptibility values assigned for distance from livestock farms and biodigesters.
DistanceSusceptibility Value
0–1000 m1
1000–2000 m0.8
2000–3000 m0.6
3000–4000 m0.4
>4000 m0.2
Table 4. Classes of susceptibility according to values obtained.
ValueClass
<0.28very low
0.28–0.46low
0.46–0.64medium
0.64–0.82high
>0.82very high
Disclaimer/Publisher’s Note: The statements, opinions and data contained in all publications are solely those of the individual author(s) and contributor(s) and not of MDPI and/or the editor(s). MDPI and/or the editor(s) disclaim responsibility for any injury to people or property resulting from any ideas, methods, instructions or products referred to in the content.