Proceeding Paper

Effect of Food 3D Printing Process on the Rheological Properties of Rice Protein Printing Inks †

by
Yeison Fernando Barrios-Rodríguez
*,
Marta Igual-Ramo
,
Javier Martínez-Monzó
and
Purificación García-Segovia
i-Food, Instituto Universitario de Ingeniería de Alimentos-FoodUPV, Universitat Politècnica de València, 46022 València, Spain
*
Author to whom correspondence should be addressed.
Presented at the 4th International Electronic Conference on Foods, 15–30 October 2023; Available online: https://foods2023.sciforum.net/.
Biol. Life Sci. Forum 2023, 26(1), 15; https://doi.org/10.3390/Foods2023-15061
Published: 14 October 2023
(This article belongs to the Proceedings of The 4th International Electronic Conference on Foods)

Abstract

:
Different statistical approaches were used to analyze the rheological properties of a rice-protein-based product before and after printing. The printing ink was composed of 30% rice protein and 70% water, with the addition of 0.5% xanthan gum. Printing parameters: The layer height (1 and 1.5 mm), printing speed (50 and 35 mm/s), and nozzle diameter (1.2 and 1.7 mm) were evaluated. Rheological properties were determined before and after printing using an oscillatory test from 0.1 to 10 Hz at 1 Pa. The decomposition of the curves into principal components helped us better understand the variations of the rheological properties along the frequency, differentiating the samples before and after printing.

1. Introduction

Rheological properties are fundamental during the food 3D printing process, providing critical information about the material behavior throughout the printing stages [1,2]. In this regard, small amplitude oscillatory testing has been widely used to understand the rheological behavior of materials before and after printing. This method involves subjecting the material to a stress or frequency that varies harmonically with time [3]. From this analysis, it is possible to obtain the storage modulus (G′), loss modulus (G″), and complex viscosity (η*). The G′ is proportional to the number of permanent interactions and the strength of the interactions in the sample; thus, it can be considered a measure of the sample structure [4]. On the other hand, the G″ is the stress factor 90 degrees out of phase with the shear deformation and measures the flow properties of the sample [4].
The analysis of this information is generally performed descriptively based on the values of the G′ and G″ curves. Values at specific frequencies, such as 1 Hz and 10 Hz, have also been analyzed when comparing samples [5,6,7,8] because it provides timely information on the rheological behavior of printing inks. However, this analysis may be somewhat biased in finding differences between very similar samples or the effect of the printing process on the inks before and after printing, as it does not consider the total variability of the information provided by the rheology curve.
One option would be to observe the effect of each frequency range on the rheological values, i.e., to observe each point on the curve and compare it between samples. Multivariate principal component analysis (PCA) could provide this possibility by considering each rheological curve as a data vector, creating a data matrix where each row represents a rheological curve and each column a point on that curve. By performing PCA, linear combinations of these frequencies could be found to explain the patterns of variability in the rheological parameters. On the other hand, it is also possible to consider each curve as a continuous function and then analyze it using a PCA, i.e., with a functional approach. In this case, the continuous functions (the rheological curves) are decomposed into principal components that could extend the knowledge of the patterns of variability in the rheological properties along the frequency. Under this hypothesis and to better understand the information obtained from rheological curves of printing inks, this work applied different statistical approaches to analyze the rheological properties of rice protein (G′, G″ and η*) before and after printing.

2. Materials and Methods

2.1. Experimental Design

A completely randomized design (CRD) was performed to evaluate the effect of the rice protein printing process on rheological parameters. Two printing conditions were assessed by varying printing speed, layer height, and nozzle diameter, each in triplicate, defined as T1 (printing speed = 35 mm/s, layer height = 1.5 mm, nozzle diameter = 1.7 mm) and T2 (printing speed = 50 mm/s, layer height = 1 mm, nozzle diameter = 1.2 mm) (Figure 1).

2.2. Protein Ink Preparation

A food ink was prepared using 30% rice protein (Rice I850XF from Roquette Freres, Lestrem, France), 70% water, and 0.5% xanthan gum (Sosa Ingredients S.L, Barcelona, Spain). First, the water was heated to 30 °C using magnetic heating (VWR VMS-C7, Germany), and the xanthan gum was dissolved by stirring. Then, this solution was combined with rice protein, and the mixture’s temperature was adjusted to 25 °C before printing.

2.3. Rheological Analysis

A HAAKE RheoStress 1 rheometer (Thermo, Waltham, MA, USA) with parallel rough plates 60 mm in diameter and 1.0 mm gap was used to perform oscillatory tests on the protein ink before and after printing. The oscillatory test was performed in triplicate at a constant shear stress of 1 Pa and a frequency range of 0.1 to 10 Hz at 25 °C. Storage modulus (G′), loss modulus (G″), and complex viscosity (η*) were obtained via this analysis.

2.4. Statical Analysis

The data were analyzed using a univariate, multivariate, and functional approach to understand better the effect of printing on the rheological parameters of storage modulus G′), loss modulus (G″), and complex viscosity (η*). In the univariate process, rheological data obtained at 1 Hz and 10 Hz were considered and analyzed using a simple ANOVA with a confidence level of 95% (p < 0.05). For the multivariate approach, each frequency from 0.1–10 Hz was considered an independent variable, and a principal component analysis (PCA) was performed. Before analysis, the data matrix was centered and scaled so all variables had standard deviations equal to one and mean equal to zero. In the functional analysis, each rheological curve was considered a continuous function rather than a series of discrete points, and functional principal component analysis (FPCA) was performed. A P-spline approximation of the sample curves was proposed. The degree of smoothness of a P-spline was controlled by the smoothing parameter λ, which measures the rate of a trade-off between the fit to the data and the variability of the function [9]. Statistical procedures were performed with the General Public License of the R Core Team software [10].

3. Results and Discussion

The protein samples’ G′ and G″ curves before and after printing increase with increasing frequency, while viscosity tends to decrease (Figure 2). Additionally, G′ of the printing inks was higher than G″ (G′ > G″) over the entire frequency range. This indicates that the samples exhibit pseudoplastic behavior, i.e., the solution viscosity decreases with increasing shear rate [4]. This behavior of the samples is suitable for extrusion 3D printing, as the material will be able to flow easily through the nozzle due to shear thinning that occurs when the applied stress exceeds the elastic limit [11]. In general, the curves of the samples in the G′ and η* evidence a very similar behavior before and after printing. However, it is noted that in G″, the samples before printing have a noticeable difference in their behavior concerning the samples after printing, indicating an effect on the rheological conditions by the printing process (Figure 2). Interestingly, at frequencies above 3 Hz, the loss modulus of the samples after printing increases compared to the samples before printing. This may indicate an inflection point as the deformation and relaxation cycle increases above 3 Hz, increasing the printed samples, which may be more compact, with less air in their structure due to the extrusion process.
When analyzing the rheological parameters at specific frequencies of 1 Hz and 10 Hz, it is observed that there are significant differences (p < 0.05) before and after printing at 1 Hz, while at 10 Hz, the differences disappear (Table 1). This may indicate that the behavior of rheological parameters is variable and dependent on the strain rate at which the data is being analyzed. Additionally, this showed that it is not entirely appropriate to establish differences in the rheological behavior of printing inks at a specific frequency. The above is because before and after printing, the rheological behavior changes depending on the strain rates at which the rheological behavior is being observed.
On the other hand, the visual analysis of the rheological curves helped intuit existing differences between samples; however, as shown in Figure 2, it is more difficult to observe such differences in parameters, such as complex viscosity (Figure 2c). Multivariate PCA was intended to reduce the complexity of the data by transforming the measurements at different frequencies into a smaller set of variables called latent variables or principal components. Using the first two components, it was possible to represent a variability more significant than 98% of the total original information in the three rheological parameters (Figure 3). Additionally, this analysis allowed inferring a clear difference in the rheological behavior of the samples before and after printing (Figure 3), given mainly by the variability of the information in the frequency range. In G′, G″, and η*, the samples before printing are grouped distantly from those after printing, distributed mainly along PC1 (Figure 3). Higher variability of the samples after printing is also observed, which may be due to the changes generated in the structure of the samples by pressure differences during the printing process [12], influencing rheological parameters.
In G′, the samples before printing were mainly affected by frequencies from 1 to 3 Hz (Figure 3d), presenting an inverse relationship with the G′ values at these frequencies. Additionally, 4–10 Hz frequencies were essential to separating some samples after printing, located on the negative part of PC2 (Figure 3a–d). On the other hand, G″ confirms what was previously commented in the behavior of the rheological curves; there is a notable influence of frequencies in the range 0–3 Hz in the samples before printing, allowing to separate the treatments before and after printing (Figure 3e). In the case of complex viscosity, this analysis will enable us to infer with greater certainty that the samples differ significantly before and after the printing process (Figure 3c). It is highlighted that for η*, frequencies in the 3–4 Hz range are essential to differentiate between samples (Figure 3f). Finally, from this analysis, it is possible to infer that there is an extrusion effect during the 3D printing of the food that affects the internal structures of the material, generating a change in the elastic and viscous behavior, being some specific frequencies the ones that offer crucial information to differentiate the samples before and after printing.
Otherwise, instead of considering each rheological curve as a series of isolated points in frequency, functional analysis treats them as continuous functions. This means that instead of having a finite set of points, there is a smooth and continuous description of how the rheological properties vary over the frequency range. The first two components of the FPCA explained 99% of the total variability of the original data (Figure 4). Additionally, a decrease in intra-group variability was observed, showing more homogeneous groupings along PC1 for the three rheological variables (Figure 4). This may be because FPCA allows patterns and trends in rheological curves to be identified more entirely than traditional principal component analysis since the functions’ smooth, continuous nature is considered. This is especially useful when rheological curves show subtle or complex variations across frequencies, as for η*or G′ (Figure 1 and Figure 4). The analysis corroborated the previously observed differences between samples before and after printing. It is also evident that the first frequencies (0–4 Hz) considerably affect the clustering of the samples (Figure 5a–c), distributed mainly along PC1.

4. Conclusions

This is the first time a multifactorial and functional analysis of rheological variables has been performed, proving very important for understanding the rheological changes of food inks during 3D printing. Multifactorial and functional analysis of the rheological curves of G′, G″, and η* showed that they can identify which frequencies significantly impact the variability observed in the rheological parameters before and after printing, as opposed to descriptive or univariate analysis. Reducing the data to a few latent variables helped to highlight underlying patterns, identify trends, and simplify the interpretation of data in the 0–10 Hz frequency range. Similarly, the decomposition of the curves as continuous functions into principal components using FPCA contributed to a better understanding of the variations and patterns in the rheological properties over frequency so that it can be used in conjunction with multivariate PCA. This was because through this analysis, the rheological curves are considered a continuous function, which helps diminish the effect of the high correlation of the variables.

Author Contributions

Conceptualization, Y.F.B.-R., J.M.-M., P.G.-S. and M.I.-R.; methodology, Y.F.B.-R. and J.M.-M.; software, Y.F.B.-R.; formal analysis, Y.F.B.-R., J.M.-M., P.G.-S. and M.I.-R.; investigation, Y.F.B.-R., J.M.-M., P.G.-S. and M.I.-R.; resources, J.M.-M. and P.G.-S.; writing—original draft preparation, Y.F.B.-R.; writing—review and editing, Y.F.B.-R., J.M.-M., P.G.-S. and M.I.-R.; supervision, J.M.-M., P.G.-S. and M.I.-R.; project administration, J.M.-M., P.G.-S. and M.I.-R.; funding acquisition, J.M.-M. and P.G.-S. All authors have read and agreed to the published version of the manuscript.

Funding

This research was funded by Conselleria de Innovación, Universidades, Ciencia y Sociedad Digital, Generalitat Valenciana, grant number AICO/2021/137, project AGROALNEXT/2022/001, and from MCIN/AEI/10.13039/501100011033/ through project PID2020-115973RB-C22 and the FPI Ph.D. contract granted by Conselleria de Innovación, Universidades, Ciencia y Sociedad Digital, Generalitat Valenciana, grant number CIGRIS/2021/105.

Institutional Review Board Statement

Not applicable.

Informed Consent Statement

Not applicable.

Data Availability Statement

The data analyzed in this study are available from the authors upon reasonable request.

Conflicts of Interest

The authors declare no conflict of interest.

References

  1. Ahmed, J.; Ptaszek, P.; Basu, S. Food Rheology: Scientific Development and Importance to Food Industry. In Advances in Food Rheology and Its Applications; Elsevier: Amsterdam, The Netherlands, 2017; pp. 1–4. [Google Scholar]
  2. Maldonado-Rosas, R.; Tejada-Ortigoza, V.; Cuan-Urquizo, E.; Mendoza-Cachú, D.; Morales-de la Peña, M.; Alvarado-Orozco, J.M.; Campanella, O.H. Evaluation of Rheology and Printability of 3D Printing Nutritious Food with Complex Formulations. Addit. Manuf. 2022, 58, 103030. [Google Scholar] [CrossRef]
  3. Miri, T. Viscosity and Oscillatory Rheology. In Practical Food Rheology; Wiley: New York, NY, USA, 2011; pp. 7–28. [Google Scholar]
  4. Kasapis, S.; Bannikova, A. Rheology and Food Microstructure. In Advances in Food Rheology and Its Applications; Elsevier Inc.: Amsterdam, The Netherlands, 2017; pp. 7–46. ISBN 9780081004326. [Google Scholar]
  5. Lille, M.; Nurmela, A.; Nordlund, E.; Metsä-Kortelainen, S.; Sozer, N. Applicability of Protein and Fiber-Rich Food Materials in Extrusion-Based 3D Printing. J. Food Eng. 2018, 220, 20–27. [Google Scholar] [CrossRef]
  6. Yun, H.J.; Han, N.R.; An, H.W.; Jung, W.K.; Kim, H.W.; Lee, S.G. Development of an Abalone 3D Food Printing Ink for the Personalized Senior-Friendly Foods. Foods 2022, 11, 3262. [Google Scholar] [CrossRef] [PubMed]
  7. Cai, Q.; Zhong, Y.; Xu, M.; Huang, Q.; Lu, X. 3D Printed High Oil Custard Cream: Effects of Whey Protein Isolate, Hydroxypropylated Starch and Carrageenan on Physicochemical Properties and Printing Performance. LWT 2022, 156, 113039. [Google Scholar] [CrossRef]
  8. Hussain, S.; Arora, V.K.; Malakar, S. Formulation of Protein-Enriched 3D Printable Food Matrix and Evaluation of Textural, Rheological Characteristics, and Printing Stability. J. Food Process. Preserv. 2021, 45, e15182. [Google Scholar] [CrossRef]
  9. Aguilera-Morillo, M.C.; Aguilera, A.M. P-Spline Estimation of Functional Classification Methods for Improving the Quality in the Food Industry. Commun. Stat. Simul. Comput. 2015, 44, 2513–2534. [Google Scholar] [CrossRef]
  10. R Core Team. R: A Language and Environment for Statistical Computing, 2022. Available online: https://www.r-project.org/ (accessed on 6 September 2023).
  11. Matas, A.; Igual, M.; García-Segovia, P.; Martínez-Monzó, J. Application of 3D Printing in the Design of Functional Gluten-Free Dough. Foods 2022, 11, 1555. [Google Scholar] [CrossRef] [PubMed]
  12. Derossi, A.; Caporizzi, R.; Oral, M.O.; Severini, C. Analyzing the Effects of 3D Printing Process per Se on the Microstructure and Mechanical Properties of Cereal Food Products. Innov. Food Sci. Emerg. Technol. 2020, 66, 102531. [Google Scholar] [CrossRef]
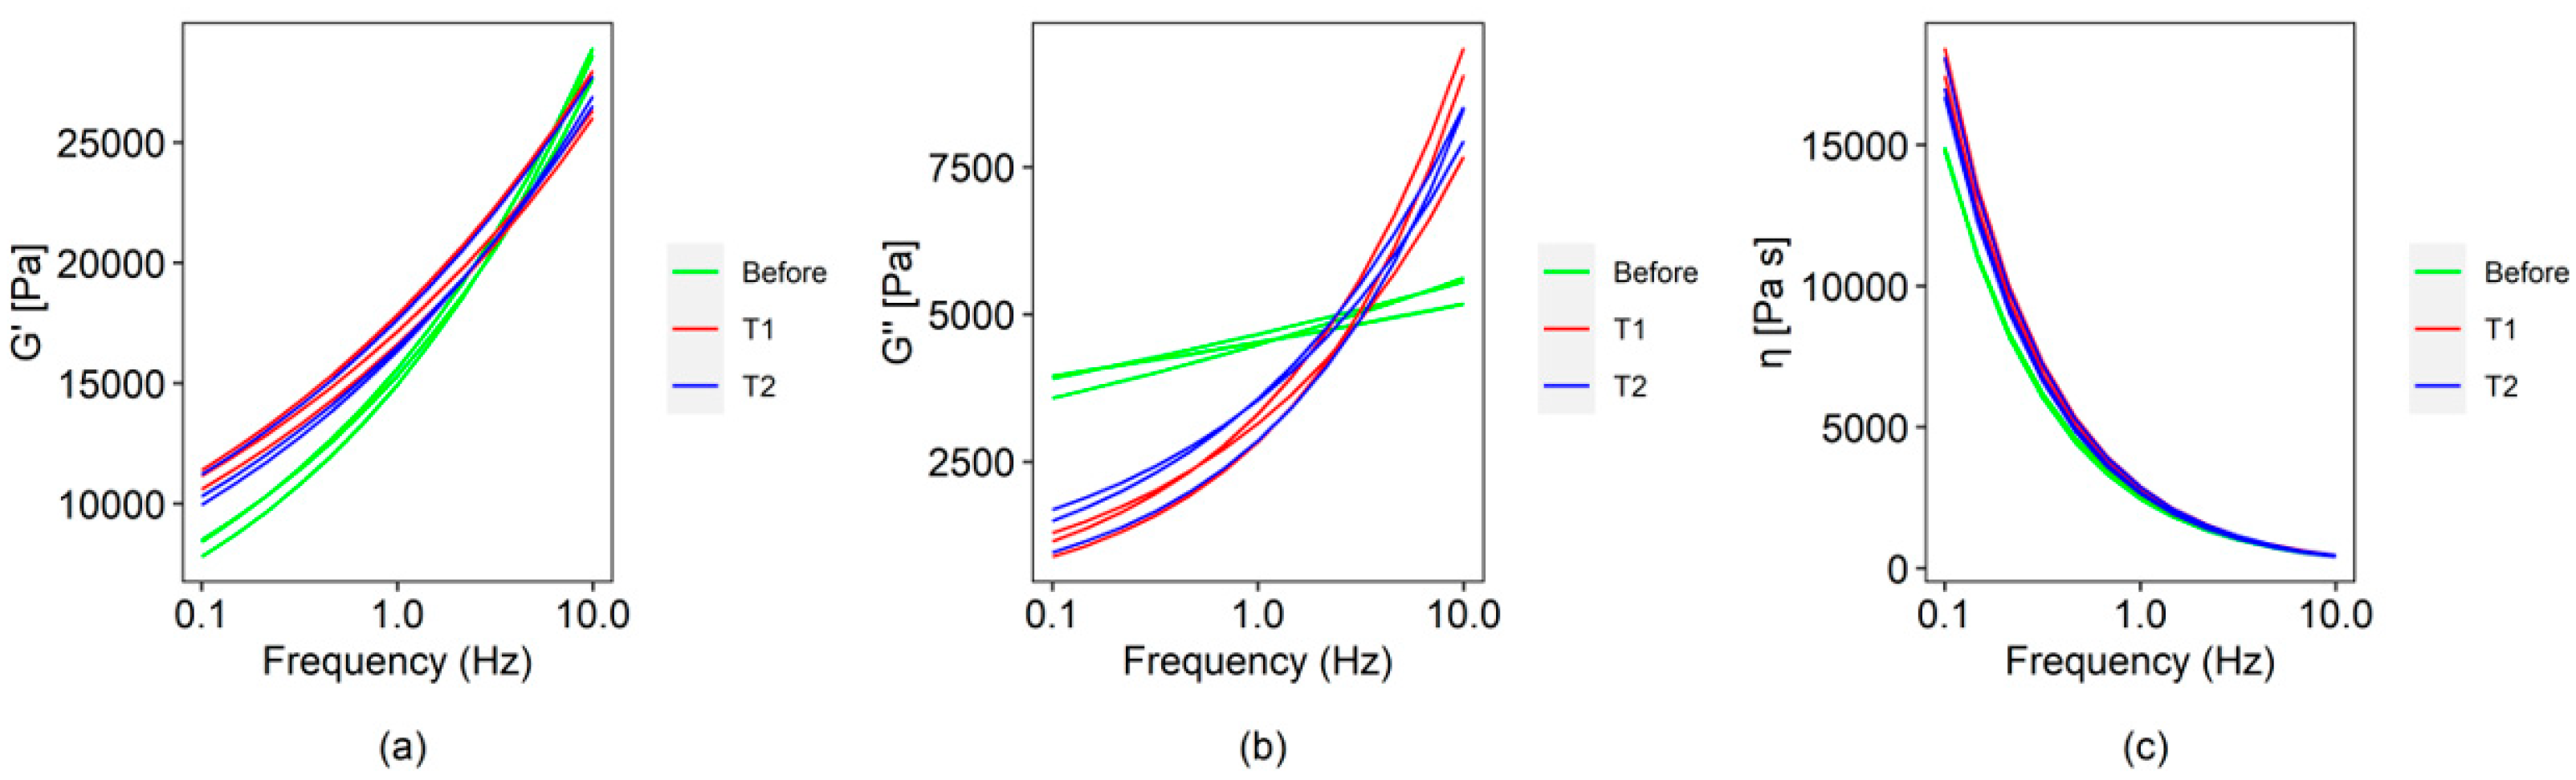
Figure 1. Rice protein printed with printing speed = 35 mm/s, layer height = 1.5 mm, nozzle diameter = 1.7 mm (a) and printing speed = 50 mm/s, layer height = 1 mm, nozzle diameter = 1.2 mm (b).
Blsf 26 00015 g001
Figure 2. Rheological parameters curves for rice protein before (green line) and after printing (T1 = red line and T2 = blue line): (a) storage modulus [G′], (b) loss modulus [G″], and (c) complex viscosity [η*]. T1 (printing speed = 35 mm/s, layer height = 1.5 mm, nozzle diameter = 1.7 mm) and T2 (printing speed = 50 mm/s, layer height = 1 mm, nozzle diameter = 1.2 mm).
Blsf 26 00015 g002
Figure 3. Multivariate analysis by PCA for (a) storage modulus [G′], (b) loss modulus [G″], and (c) complex viscosity [η], and loadings of each of the frequencies on the first two components in (d) storage modulus [G′], (e) loss modulus [G″], and (f) complex viscosity [η*], for before (red dots) and after printing (T1: blue dots and T2: green dots). T1 (printing speed = 35 mm/s, layer = 1.5 mm, nozzle diameter = 1.7 mm) and T2 (printing speed = 50 mm/s, layer = 1 mm, nozzle diameter = 1.2 mm).
Blsf 26 00015 g003
Figure 4. Functional analysis using PCAF of the curves for (a) storage modulus [G′], (b) loss modulus [G″], and (c) complex viscosity [η*], for before (red dots) and after printing (T1: blue dots and T2: green dots). T1 (printing speed = 35 mm/s, layer height = 1.5 mm, nozzle diameter = 1.7 mm) and T2 (printing speed = 50 mm/s, layer height = 1 mm, nozzle diameter = 1.2 mm).
Blsf 26 00015 g004
Figure 5. Weight functions for PC1 and PC2, obtained from functional analysis for (a) storage modulus [G′], (b) loss modulus [G″], and (c) complex viscosity [η*].
Blsf 26 00015 g005
Table 1. Mean of the storage modulus (G′), loss modulus (G″), and complex viscosity (η*) of rice protein before and after printing at the frequencies of 1 Hz and 10 Hz.
G′ [Pa]G″ [Pa]η* [Pa s]
Frequency to 1 Hz
Before15,284.3 ± 193.6 a4556.5 ± 54.3 a2542.5 ± 44.2 a
T117,193.7 ± 357.1 b3090.6 ± 139.8 b2817 ± 50.8 ab
T216,832.7 ± 404.7 b3317 ± 233.1 b2735.6 ± 74.9 b
Frequency to 10 Hz
Before28,400.4 ± 386.6 a5447.7 ± 137.9 a435.5 ± 15.4 a
T126,775.2 ± 602.9 a8753.1 ± 555 b441.4 ± 8.8 a
T227,059.8 ± 369 a8317.1 ± 187.9 b433.2 ± 12.9 a
Values are presented as mean ± standard error. Different lowercase letters in the same column indicate significant differences (p < 0.05) between treatments at 1 Hz and 10 Hz frequencies. T1 (printing speed = 35 mm/s, layer height = 1.5 mm, nozzle diameter = 1.7 mm) and T2 (printing speed = 50 mm/s, layer height = 1 mm, nozzle diameter = 1.2 mm).
Disclaimer/Publisher’s Note: The statements, opinions and data contained in all publications are solely those of the individual author(s) and contributor(s) and not of MDPI and/or the editor(s). MDPI and/or the editor(s) disclaim responsibility for any injury to people or property resulting from any ideas, methods, instructions or products referred to in the content.

