Proceeding Paper

Development of a UPLC-Q-ToF-MS Method for the Determination of Sulforaphane and Iberin in Cruciferous Vegetables †

by
Panagiota-Kyriaki Revelou
1,2,
Marinos Xagoraris
1,
Alexandros Michail
2,
Maroula G. Kokotou
1 and
Violetta Constantinou-Kokotou
1,*
1
Laboratory of Chemistry, Department of Food Science and Human Nutrition, Agricultural University of Athens, 75 Iera Odos, 11855 Athens, Greece
2
Department of Food Science and Technology, University of West Attica, Agiou Spyridonos Str, Egaleo, 12243 Athens, Greece
*
Author to whom correspondence should be addressed.
Presented at the 2nd International Electronic Conference on Nutrients, 15–31 March 2022; Available online: https://iecn2022.sciforum.net/.
Biol. Life Sci. Forum 2022, 12(1), 24; https://doi.org/10.3390/IECN2022-12389
Published: 14 March 2022
(This article belongs to the Proceedings of The 2nd International Electronic Conference on Nutrients)

Abstract

:
Sulforaphane (1-isothiocyanato-4-(methylsulfinyl)-butane) and iberin (1-isothiocyanato-3-methylsulfinylpropane) have attracted widespread attention due to their anti-inflammatory and cancer-preventive properties. These isothiocyanates are products of the enzymatic hydrolysis of the glucosinolates glucoraphanin and glucoiberin, which are found only in the plants of the order Brassicales. Cruciferous vegetables, such as broccoli, cabbage and cauliflower, belong to the order Brassicales, specifically, in the Brassicaceae family. Our aim was to develop an efficient and accurate method for the simultaneous determination of sulforaphane and iberin in cruciferous vegetables using Ultra-high Performance Liquid Chromatography-Quadrupole Time-of-Flight Mass Spectrometry (UPLC-Q-ToF-MS). The method was applied for the quantitative determination of these compounds in a variety of cruciferous vegetables (green and purple broccoli, white and purple cabbage, radish, turnip, arugula, watercress and cauliflower). The results showed that green and purple broccoli contained the highest levels of sulforaphane (660.14 ± 34.29 to 210.11 ± 9.76 μg g−1 dry weight), while the highest concentration of iberin was detected in purple broccoli (144.98 ± 3.56 μg g−1 dry weight). The lowest concentrations of sulforaphane and iberin were measured in watercress and radish. The differences in the content of these compounds can be attributed to the variability among Brassicaceae species, geography, season and various environmental factors.

1. Introduction

Cruciferous vegetables are plant foods belonging to the Brassicaceae family (order Brassicales). The consumption of these vegetables has been associated with a lower risk of developing non-communicable diseases [1]. These benefits are attributed to the presence of glucosinolates which, upon enzymatic hydrolysis by myrosinase, release isothiocyanates; these are highly beneficial for human health. Among these, sulforaphane (1-isothiocyanato-4-(methylsulfinyl)-butane) and iberin (1-isothiocyanato-3-methylsulfinylpropane) (Figure 1), derived from the enzymatic hydrolysis of glucoraphanin and glucoiberin glucosinolates, have been reported to present considerable anti-inflammatory capacity [2,3,4,5,6]. The analytical determination of sulforaphane and iberin presents several problems due to the lack of chromophores, the high volatility and the precipitation of these unstable oils in the liquid chromatography column [7]. Herein, we present a reliable method for the identification and quantification of sulforaphane and iberin in cruciferous vegetables, utilizing Ultra-Performance Liquid Chromatography-Quadrupole Time-of-Flight Mass Spectrometry (UPLC-Q-ToF-MS).

2. Materials and Methods

2.1. Reagents

The synthesis of sulforaphane was accomplished based on literature [8]. Iberin, dichloromethane (CH2Cl2) (analytical grade) and methanol (MeOH) (LC-MS grade) were purchased from Sigma-Aldrich Chemical Co. (St. Louis, MO, USA). Ultra-pure water was obtained using a MilliQ system (Millipore Direct-Q, Bedford, MA, USA).

2.2. Standard Solutions

Methanol was used for the preparation of stock solutions (1000 mg L−1) of sulforaphane and iberin, which were stored in dark glass vials at −20 °C. For the performance of the full scan and MS/MS experiments, a 10 mg L−1 solution in MeOH was utilized. Calibration curves of sulforaphane and iberin were constructed using the standard concentrations of 0.1, 0.5, 1.0, 3.0, 5.0, 8.0, 10.0 and 12.0 mg L−1 via dilution with MeOH.

2.3. Sampling

Fresh samples of green broccoli, purple broccoli (sample 1), white cauliflower, white cabbage, red cabbage, watercress and radish were obtained from Chalkida (38°28′02.5′′ N 23°38′13.4″ E), Greece, and one purple broccoli sample (sample 2) originated from Achaia (38°05′31.6″ N 21°31′24.0″ E), Greece. Samples were collected in February 2017. Broccoli and cauliflower florets, cabbage and watercress leaves, and roots of radish were used for the experiments. Vegetables were lyophilized and ground using a mortar and pestle.

2.4. Extracts Preparation

The preparation of vegetable extracts was accomplished based on a previous study [9] with some modifications: 25 mL of distilled water (pH 7.0) was added into 1 g of dry vegetables, and the mixture was incubated for 3 h at 45 ± 3 °C. Afterwards, the mixture was left to reach room temperature. After the addition of 30 mL CH2Cl2, the mixture was stirred for 15 min and then filtered using a Buchner funnel with Whatman grade 1filter paper (Whatman Ltd., Maidstone, UK). The solid residue was extracted twice with 30 mL CH2Cl2. In order to remove the excess water, the filtrates were combined into a separation funnel, and the organic phase was dried with anhydrous sodium sulfate. The solvent was evaporated at 35 °C, on a Heidolph II rotary evaporator (Heidolph Instruments GmbH and Co.KG, Schwabach, Germany). The residue was dissolved in 1 mL MeOH and injected into the UPLC-Q-ToF-MS system after a 10-fold dilution with MeOH. The measurements were performed in triplicate.

2.5. UPLC-Q-ToF-MS

An Agilent 6530 Quadrupole Time of Flight system (Q-ToF-MS) with an ESI source was used. The Q-ToF-MS was coupled with an Agilent 1290 Infinity Ultra Performance-Liquid Chromatography (UPLC) system and an auto sampler (Agilent Technologies, Santa Clara, CA, USA). The MS experiments were performed through positive electrospray ionization (ESI), and nitrogen was used as the collision gas.
The Agilent MassHunter software (version B.06.00) was used for the acquisition of data. The Q-TOF conditions were as follows: fragmentor, 150 V; drying gas, 12 L/min; nebulizer gas, 45 psi; capillary voltage, 4000 V; skimmer, 65 V; gas temperature, 300 °C; acquisition rate, 1 spectra/s (threshold 200 Abs, 0.01% rel.). The MS/MS experiments were performed using an auto-MS/MS method as follows: collision energy slope, 5 V; MS/MS acquisition rate, 1 spectrum/a (threshold 5 Abs, 0.01% rel.); offset, 2.5 V; preferred charge state, 2, 1, unknown. The MS system was calibrated before each analysis using a calibrant solution. The mass calibration of the MS system was also controlled by the constant infusion of a solution with the reference ions 121.0509 and 922.0098 (obtained from Agilent Technologies). The Agilent MassHunter Qualitative Analysis software (version B.07.00) was used for data processing.

2.6. Chromatographic Study

A reverse phase Agilent Zorbax C18 (50 × 2.1 mm, 1.8 μm) column was used for the chromatographic study with a flow of 0.4 mL min−1. Mobile phase A = 0.1% formic acid in water; mobile phase B = 0.1% formic acid in MeOH; gradient elution: 0–1 min 5% B, 8.5–9.5 min 95% B, 11.5-26.5 min 5% B. The column temperature was 27 °C, with an injection volume of 2 μL.

3. Results and Discussion

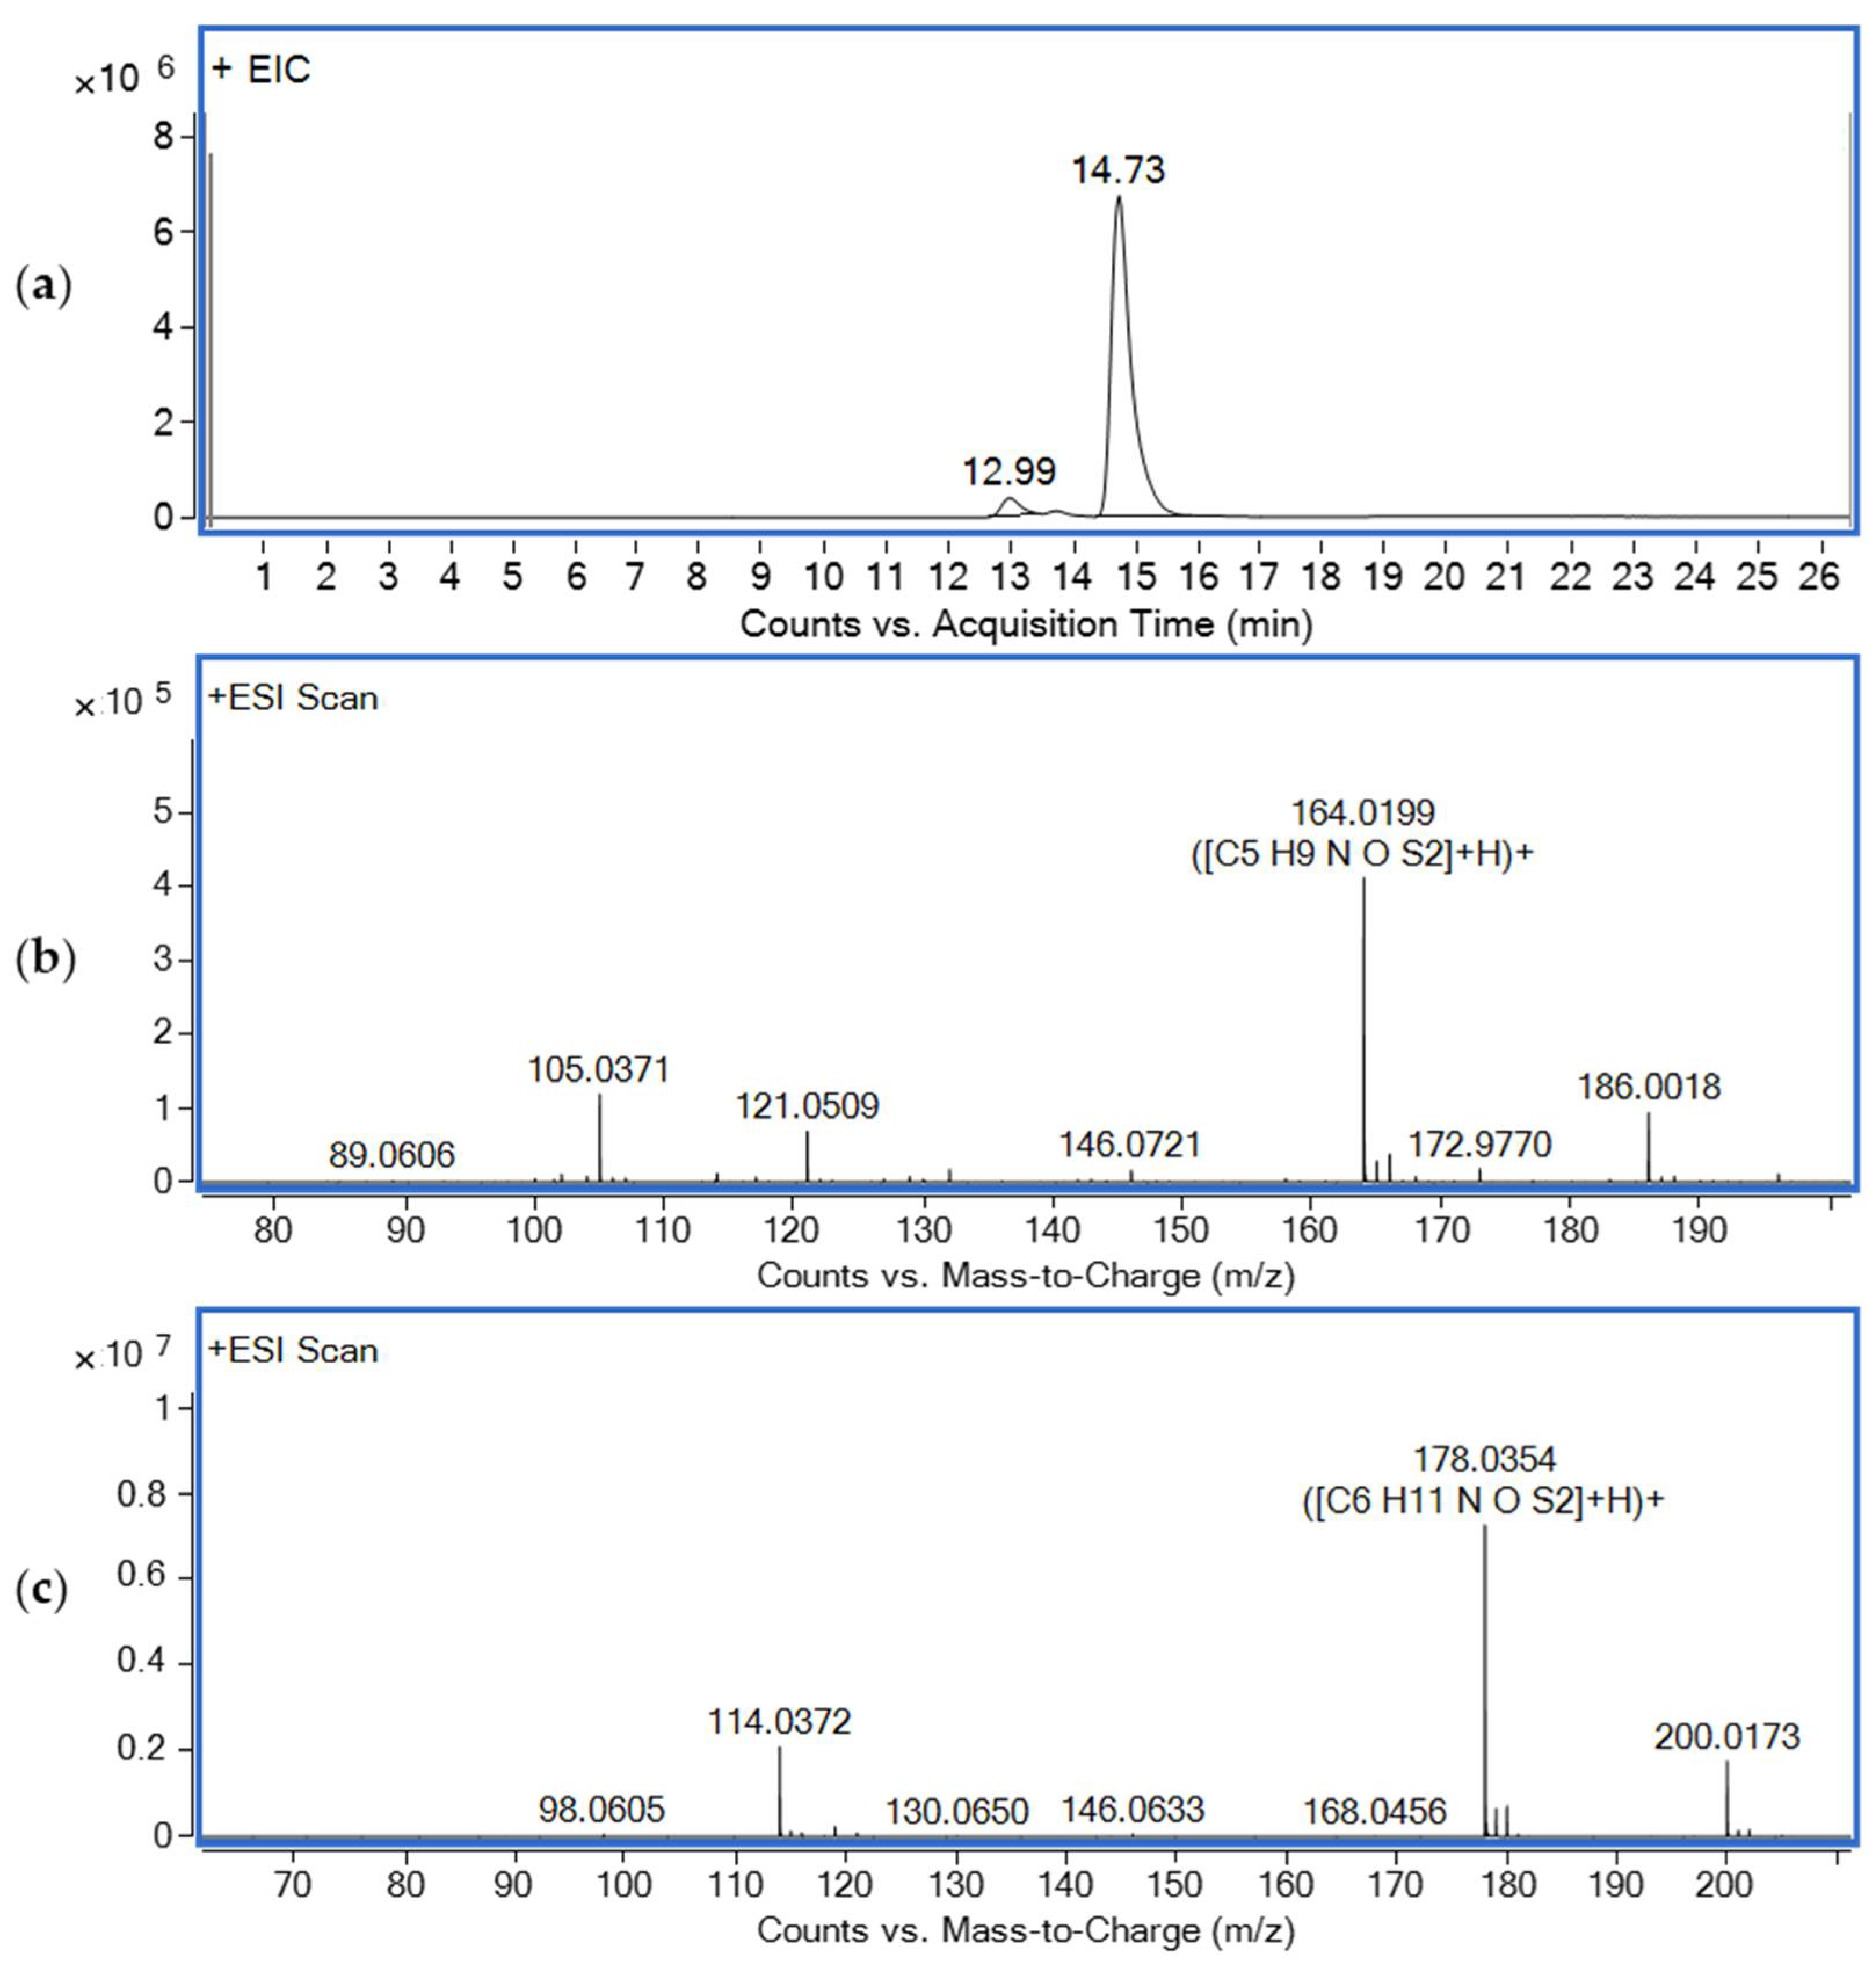
3.1. Mass Spectrometry Study

Sulforaphane and iberin were studied in positive ESI mode through flow injection analysis (FIA), to record the full scan and MS2 spectra (Figure 2). The full scan spectrum of sulforaphane showed the ion [M + H]+ at m/z 178.0354 (Δ0.56 ppm), while the ion [M + Na]+ was observed at m/z 200.0172 (Δ1.00 ppm) (Figure 2a). In the MS2 spectrum of the ion [M + H]+, an ion at m/z 114.0372 was detected (Figure 2b) in accordance with a previous literature study [10]. The full scan spectrum of iberin showed the ion [M + H]+ at m/z 164.0197 (Δ1.22 ppm), while the ion [M + Na]+ was observed at m/z 186.0017 (Δ0.54 ppm) (Figure 2c). In the MS2 spectrum of the ion [M + H]+, a characteristic ion at m/z 105.0364 was detected (Figure 2d).

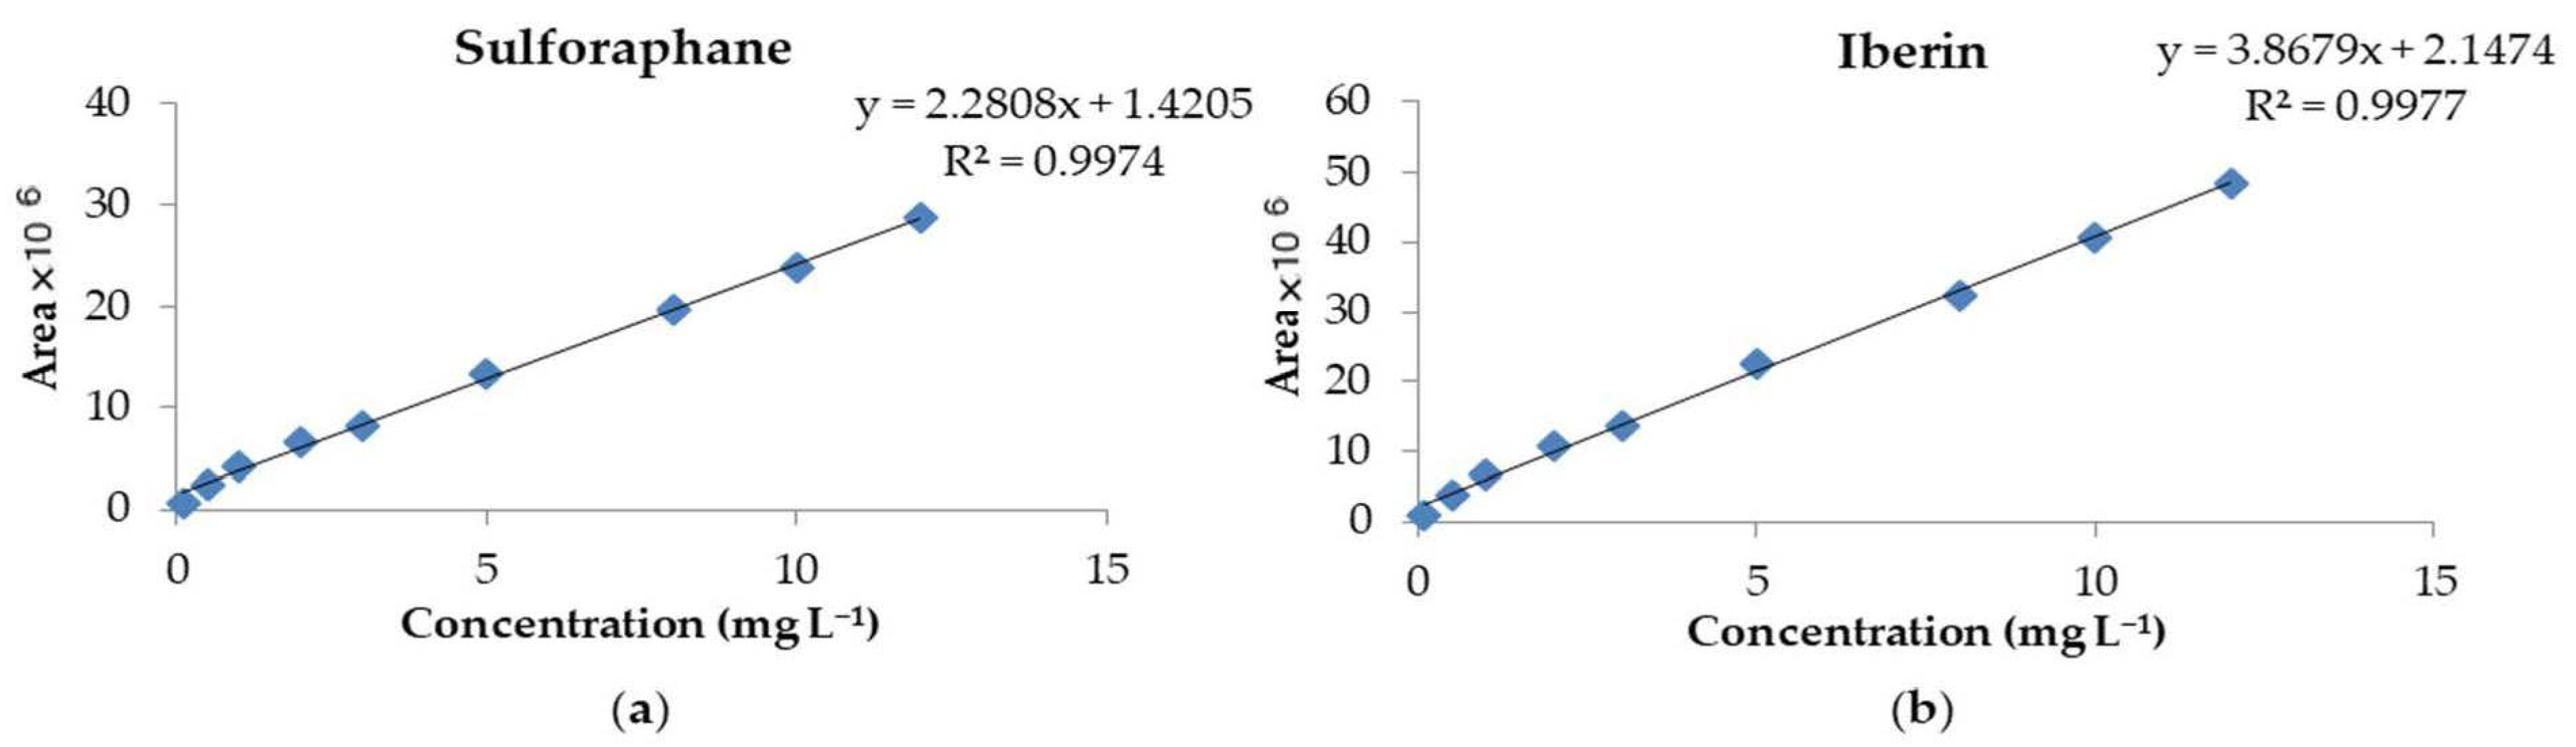
3.2. Method Validation

The peak area of the extracted ion chromatograms was utilized for the quantification of sulforaphane and iberin in cruciferous vegetables. The linearity of the new UPLC-Q-ToF-MS method was determined through the construction of a calibration curve at different concentrations (Figure 3). The limit of detection (LOD) and quantification (LOQ) of sulforaphane were 1.19 mg L−1 and 3.61 mg L−1, while for iberin, the LOD and LOQ were calculated at 1.11 mg L−1 and 3.35 mg L−1, respectively.

3.3. Analysis of Extracts

Table 1 presents the content of sulforaphane and iberin in various cruciferous vegetables. Green broccoli was found to contain the highest amount of sulforaphane (660.14 ± 34.29 μg g−1 dry weight), while the highest concentration of iberin was measured in purple broccoli sample 1 (144.98 ± 3.56 μg g−1 dry weight), which originated from Chalkida. The results are in accordance with literature [7]. A representative extracted ion chromatogram of sulforaphane and iberin is presented in Figure 4a. In the mass spectra of the corresponding retention times of each compound, the characteristic ions reported earlier in this study (Figure 2) at m/z 105.0371 (Figure 4b) and m/z 114.0372 (Figure 4c) were detected, confirming the presence of these compounds in the vegetable extracts.

Author Contributions

Conceptualization, P.-K.R.; methodology, P.-K.R., M.G.K. and V.C.-K.; software, P.-K.R. and M.X.; validation, P.-K.R. and M.X.; formal analysis, P.-K.R.; investigation, P.-K.R. and A.M.; resources, P.-K.R. and M.X.; data curation, P.-K.R. and A.M.; writing—original draft preparation, P.-K.R.; writing—review and editing, P.-K.R., M.X., A.M., M.G.K. and V.C.-K.; visualization P.-K.R. and A.M.; supervision, V.C.-K.; project administration, V.C.-K. All authors have read and agreed to the published version of the manuscript.

Funding

This research received no external funding.

Institutional Review Board Statement

Not applicable.

Informed Consent Statement

Not applicable.

Data Availability Statement

Not applicable.

Conflicts of Interest

The authors declare no conflict of interest.

References

  1. Manchali, S.; Chidambara Murthy, K.N.; Patil, B.S. Crucial Facts about Health Benefits of Popular Cruciferous Vegetables. J. Funct. Foods 2012, 4, 94–106. [Google Scholar] [CrossRef]
  2. Zhao, F.; Zhang, J.; Chang, N. Epigenetic Modification of Nrf2 by Sulforaphane Increases the Antioxidative and Anti-Inflammatory Capacity in a Cellular Model of Alzheimer’s Disease. Eur. J. Pharmacol. 2018, 824, 1–10. [Google Scholar] [CrossRef] [PubMed]
  3. Heiss, E.; Herhaus, C.; Klimo, K.; Bartsch, H.; Gerhäuser, C. Nuclear Factor ΚB Is a Molecular Target for Sulforaphane-Mediated Anti-Inflammatory Mechanisms. J. Biol. Chem. 2001, 276, 32008–32015. [Google Scholar] [CrossRef] [PubMed] [Green Version]
  4. Subedi, L.; Lee, J.H.; Yumnam, S.; Ji, E.; Kim, S.Y. Anti-Inflammatory Effect of Sulforaphane on LPS-Activated Microglia Potentially through JNK/AP-1/NF-ΚB Inhibition and Nrf2/HO-1 Activation. Cells 2019, 8, 194. [Google Scholar] [CrossRef] [PubMed] [Green Version]
  5. Shibata, T.; Nakashima, F.; Honda, K.; Lu, Y.-J.; Kondo, T.; Ushida, Y.; Aizawa, K.; Suganuma, H.; Oe, S.; Tanaka, H.; et al. Toll-like Receptors as a Target of Food-Derived Anti-Inflammatory Compounds. J. Biol. Chem. 2014, 289, 32757–32772. [Google Scholar] [CrossRef] [PubMed] [Green Version]
  6. Wang, W.; Wang, S.; Howie, A.F.; Beckett, G.J.; Mithen, R.; Bao, Y. Sulforaphane, Erucin, and Iberin Up-Regulate Thioredoxin Reductase 1 Expression in Human MCF-7 Cells. J. Agric. Food Chem. 2005, 53, 1417–1421. [Google Scholar] [CrossRef] [PubMed]
  7. Karanikolopoulou, S.; Revelou, P.-K.; Xagoraris, M.; Kokotou, M.G.; Constantinou-Kokotou, V. Current Methods for the Extraction and Analysis of Isothiocyanates and Indoles in Cruciferous Vegetables. Analytica 2021, 2, 93–120. [Google Scholar] [CrossRef]
  8. D’Souza, C.A.; Amin, S.; Desai, D. A Facile and Efficient Synthesis of 14C-Labelled Sulforaphane. J. Label. Compd. Radiopharm. 2003, 46, 851–859. [Google Scholar] [CrossRef]
  9. Campas-Baypoli, O.N.; Sánchez-Machado, D.I.; Bueno-Solano, C.; Ramírez-Wong, B.; López-Cervantes, J. HPLC Method Validation for Measurement of Sulforaphane Level in Broccoli By-Products. Biomed. Chromatogr. 2010, 24, 387–392. [Google Scholar] [CrossRef] [PubMed]
  10. Kokotou, M.G.; Revelou, P.-K.; Pappas, C.; Constantinou-Kokotou, V. High Resolution Mass Spectrometry Studies of Sulforaphane and Indole-3-Carbinol in Broccoli. Food Chem. 2017, 237, 566–573. [Google Scholar] [CrossRef] [PubMed]
Figure 1. Molecular structures of (a) sulforaphane and (b) iberin.
Blsf 12 00024 g001
Figure 2. (a) Full scan mass spectrum of sulforaphane; (b) MS2 mass spectrum of sulforaphane; (c) full scan mass spectrum of iberin; (d) MS2 mass spectrum of iberin.
Blsf 12 00024 g002
Figure 3. Calibration curves for (a) sulforaphane and (b) iberin.
Blsf 12 00024 g003
Figure 4. (a) Extracted ion chromatograms of sulforaphane and iberin in green broccoli extract; (b) mass spectrum of iberin in green broccoli extract; (c) mass spectrum of sulforaphane in green broccoli extract.
Blsf 12 00024 g004
Table 1. Content of sulforaphane and iberin in various cruciferous vegetables in μg g−1 dry weight ± S.D.
CompoundGreen
Broccoli
Purple
Broccoli 1
Purple
Broccoli 2
White
Cauliflower
White
Cabbage
Red
Cabbage
RadishWatercress
Sulforaphane660.14 ± 34.2915.05 ± 0.43210.11 ± 9.7614.89 ± 1.6273.71 ± 1.27143.83 ± 3.449.25 ± 0.144.44 ± 0.53
Iberin20.95 ± 0.67144.98 ± 3.56<LOD47.48 ± 5.0784.57 ± 0.2030.12 ± 0.130.83 ± 0.09<LOD
Publisher’s Note: MDPI stays neutral with regard to jurisdictional claims in published maps and institutional affiliations.

