Proceeding Paper

The Role of PME2 and PME3 in Arabidopsis Stomatal Development and Morphology  †

by
Amalia Tsakali
,
Ioannis-Christos Asitzoglou
,
Vassiliki Basdeki
,
Varvara Podia
,
Ioannis-Dimosthenis S. Adamakis
,
Eleni Giannoutsou
* and
Kosmas Haralampidis
*
Section of Botany, Department of Biology, National and Kapodistrian University of Athens, 157 72 Athens, Greece
*
Authors to whom correspondence should be addressed.
Presented at the 2nd International Electronic Conference on Plant Sciences—10th Anniversary of Journal Plants, 1–15 December 2021; Available online: https://iecps2021.sciforum.net/.
Biol. Life Sci. Forum 2022, 11(1), 36; https://doi.org/10.3390/IECPS2021-12010
Published: 1 December 2021

Abstract

:
Pectin methylesterases (PMEs) are enzymes, encoded by multigene families, that catalyze the demethylesterification of cell wall homogalacturonans. The removal of methyl groups, if performed block-wise in large series of methylesters, leads to the production of homogalacturonans that can be cross-linked with calcium bridges. This fine modulation of the methylesterification status of the pectin network alters the mechanical properties of the cell wall and has been proven crucial for stomatal complex ontogenesis and function. Considering this significant role of PMEs, as well as their involvement in numerous plant development processes, we investigated the phenotypic implications of two Arabidopsis thaliana PME compromised mutants (pme2 and pme3) and the corresponding double mutant (pme2 pme3) in stomatal development and morphology. The cotyledons of the double mutant were larger and wider, while the ratio of length/width was smaller compared to that of WT plants. The stomatal patterning was also affected since the pme2 pme3 mutant displayed a higher number of mature stomata as well as a higher percentage of stomatal clustering. Furthermore, the guard cells of the double mutant displayed a lower ratio of cell length to width, indicating alterations in the morphology of mature stomata. As far as the cell wall matrix composition is concerned, callose and pectins’ epitope distribution displayed significant differences in pme single and double mutants compared to WT plants. Taken together, our results underline the indispensable role of PME2 and PME3 in stomatal development, since their functional disruption affects not only stomatal patterning but also the morphology and function of the guard cells.

1. Introduction

Guard cell (GC) ontogenesis in both kidney and dumbbell-shaped stomata has been extensively studied for decades in grasses and dicotyledonous plants [1,2,3]. In the model plant Arabidopsis thaliana, stomata developmental pathway is controlled by a number of cellular components, including peptide ligands, membrane-associated receptors, a number of kinases, as well as a variety of transcription factors and polarity agents [4]. In Arabidopsis, stomatal ontogenesis commences when a meristemoid mother cell (MMC) originates from a subset of protodermal cells [5,6]. An asymmetrical division of the MMC produces a small triangular cell called meristemoid and a larger cell called stomatal-lineage ground cell (SLGC). An SLGC can finally turn into a lobed pavement cell (PC). When a second asymmetric spacing division occurs, a satellite meristemoid is produced, which is always formed opposite to an existing stoma or precursor. The meristemoid becomes a guard cell mother cell (GCM) and its symmetrical division leads to the formation of the two guard cells of the stomatal apparatus.
Pectin is a crucial matrix cell wall polysaccharide component required for cellular adhesion, extension, and plant growth. Among pectins, homogalacturonans are comprised of large chains of galacturonic acids that are methylesterified when leaving the Golgi apparatus and then are demethylesterified through the action of various PMEs. These demethylesterified homogalacturonans chains, when demethylesterification occurs in a block wise manner, are then crosslinked with calcium bridges. When these “egg-boxes” are formed, the properties of the cell wall matrix change, making it more stiff and rigid. The demethylesterification status of homogalacturonans seems to be crucial in various morphogenetic mechanisms, including pavement cell patterning [7], transduction of the inductive stimuli [8] and mesophyll cells morphogenesis [9]. The pectin network seems to be important for the fine tuning of the cell wall properties both for the dumbbell-shaped and the kidney-shaped stomata [10,11]. Recent data reveal that matrix cell wall components, like different types of pectins and xyloglucans, are also involved in the mechanism of stomatal opening and closure [12,13,14,15]. In this fine tuning, PMEs seem to play crucial roles, which are not restricted to the mechanism of stomatal movement but also to the formation of the stomatal pore [16]. To decipher the role of these enzymes in stomatal biogenesis, patterning and function, we investigated the phenotypes of the single pme2 and pme3 mutants, as well as the double pme2 pme3 mutant. The length and the width of each cotyledon of 5-day old plants was measured. Furthermore, the number of stomata (mature and young) were quantified per surface. Next, the distribution of cell wall matrix components was studied by using aniline blue for callose staining and immunofluorescence to observe the distribution of various homogalacturonans. The changes observed in stomatal patterning, morphology, and function are discussed in relation to recent studies, concerning the role of callose and homogalacturonans in both morphogenesis and function of kidney-shaped stomata.

2. Materials and Methods

2.1. Plant Material and Growth Conditions

In this study A. thaliana (L.) Heynh. (ecotype Col-0) plants were used. The AtPME2 (CS2103493 and CS926709), AtPME3 (CS2103492 and CS431531) and the double mutant (CS2102758) transgenic lines, were obtained from ABRC Arabidopsis stock center. CS2103493, CS926709, CS2103492, and CS431531 lines will be referred from this point onwards as pme2-1 (pme2P2), pme2-2 (pme2SLK), Pme3-1 (pme3P1), and pme3-2 (pme3GB), respectively. WT and T2 or T3 transgenic seeds were imbibed for 24 h at 4 °C, and thereafter surface sterilized with 70% (v/v) ethanol for 2 min, followed by 15% (v/v) sodium hypochlorite containing 0.1% (v/v) Tween 20 for 6 min. Seeds were then washed several times with sterile deionized water and sowed on half-strength Murashige and Skoog (MS) medium without sucrose or on medium containing 50 mg/L kanamycin and placed in a growth chamber to initiate germination. Grown seedling were transferred after 7 days to soil for further development.
Root growth measurements were carried out on 1 to 8 days-old seedlings grown vertically on ½ strength MS plates without sucrose. For the germination assays, seeds were plated on petri dishes containing two layers of water saturated filter paper (Whatman). The germination frequency (%) was calculated after scoring the seed for root extrusion in 6-h time intervals for up to 48 h. The assays were repeated three times using biological replicates.
For germination and plant growth, wild-type (WT) and transgenic seeds sown on soil, as well as on petri dishes, were incubated in a controlled growth chamber at 22 °C with 60% humidity under long-day conditions (16 h light/8 h dark). Cool-white, fluorescent tungsten tubes (Osram, Berlin, Germany), providing illumination of 110 μE m−2 s−1 PAR, were used.

2.2. DNA and RNA Extraction, Synthesis of cDNA and Gene Expression Analysis

The NucleoSpin® Plant II and NucleoSpin® RNA Plant kits were used to extract DNA and total RNA, respectively, from plant tissues, according to the manufacturer’s instructions (Macherey Nagel, Düren, Germany). For cDNA synthesis, 1 μg of total RNA was used as template and reverse transcribed by using the PrimeScript RT (Takara-Clontech, Kyoto, Japan). Semiquantitative RT-PCR was carried out with Taq DNA polymerase (Invitrogen, Carlsbad, CA, USA), according to the manufacturer’s instructions. In all PCR reaction and for RNA calibration, the transcripts of GAPDH or rDNA were monitored as internal controls. PCR products were separated on 0.8% agarose gels and visualized, after staining with 80 μg L−1 ethidium bromide, under UV light. Appendix A Table A1 lists all primers used in this study.

2.3. Bioinformatic and Phylogenetic Analysis

The DNA sequence of the AtPME2 (At1g53830) and the AtPME3 (At3g14310) genes were obtained from TAIR (http://www.arabidopsis.org, accessed on 8 December 2021). For the phylogenetic analysis and tree construction, the full-length amino acid sequences were obtained from NCBI (http://www.ncbi.nlm.nih.gov/pmc/, accessed on 8 December 2021). The sequences were aligned by using the CLUSTAL OMEGA server at EBI (http://www.ebi.ac.uk/, accessed on 10 December 2021). Protein domain search was carried out by using the PROSITE database (https://prosite.expasy.org/index.html, accessed on 10 December 2021). For all other routine bioinformatics analyses the ExPaSy software suite (http://www.expasy.org/, accessed on 10 December 2021) was used. The phylogenetic tree was constructed by using the PHYLIP package, version 3.65 (Department of Genome Science, University of Washington, Seattle, WA, USA), as described previously by Beris et al. [17]. Accession numbers and gene model names are listed in Appendix A Table A2.

2.4. Callose Localization

Callose in living stomatal complexes was performed as described in Giannoutsou et al. [11].

2.5. Immunolocalization of Homogalacturonans

For immunolabeling of LM20- (homogalacturonans displaying a high degree of methylesterification), JIM5- (homogalacturonans displaying a lower degree of methylesterification), and 2F4 (demethylesterified homogalacturonans interconnected with calcium bridges), -HG epitopes in paradermal hand-made leaf sections the protocol described by Giannoutsou et al. [11] was performed.

2.6. Observation and Photography

The specimens were examined with a Zeiss Axioplan microscope equipped with a UV source, a Differential Interference Contrast (DIC) optical system, and a Zeiss Axiocam MRc5 digital camera as described by Giannoutsou et al. [11].

3. Results

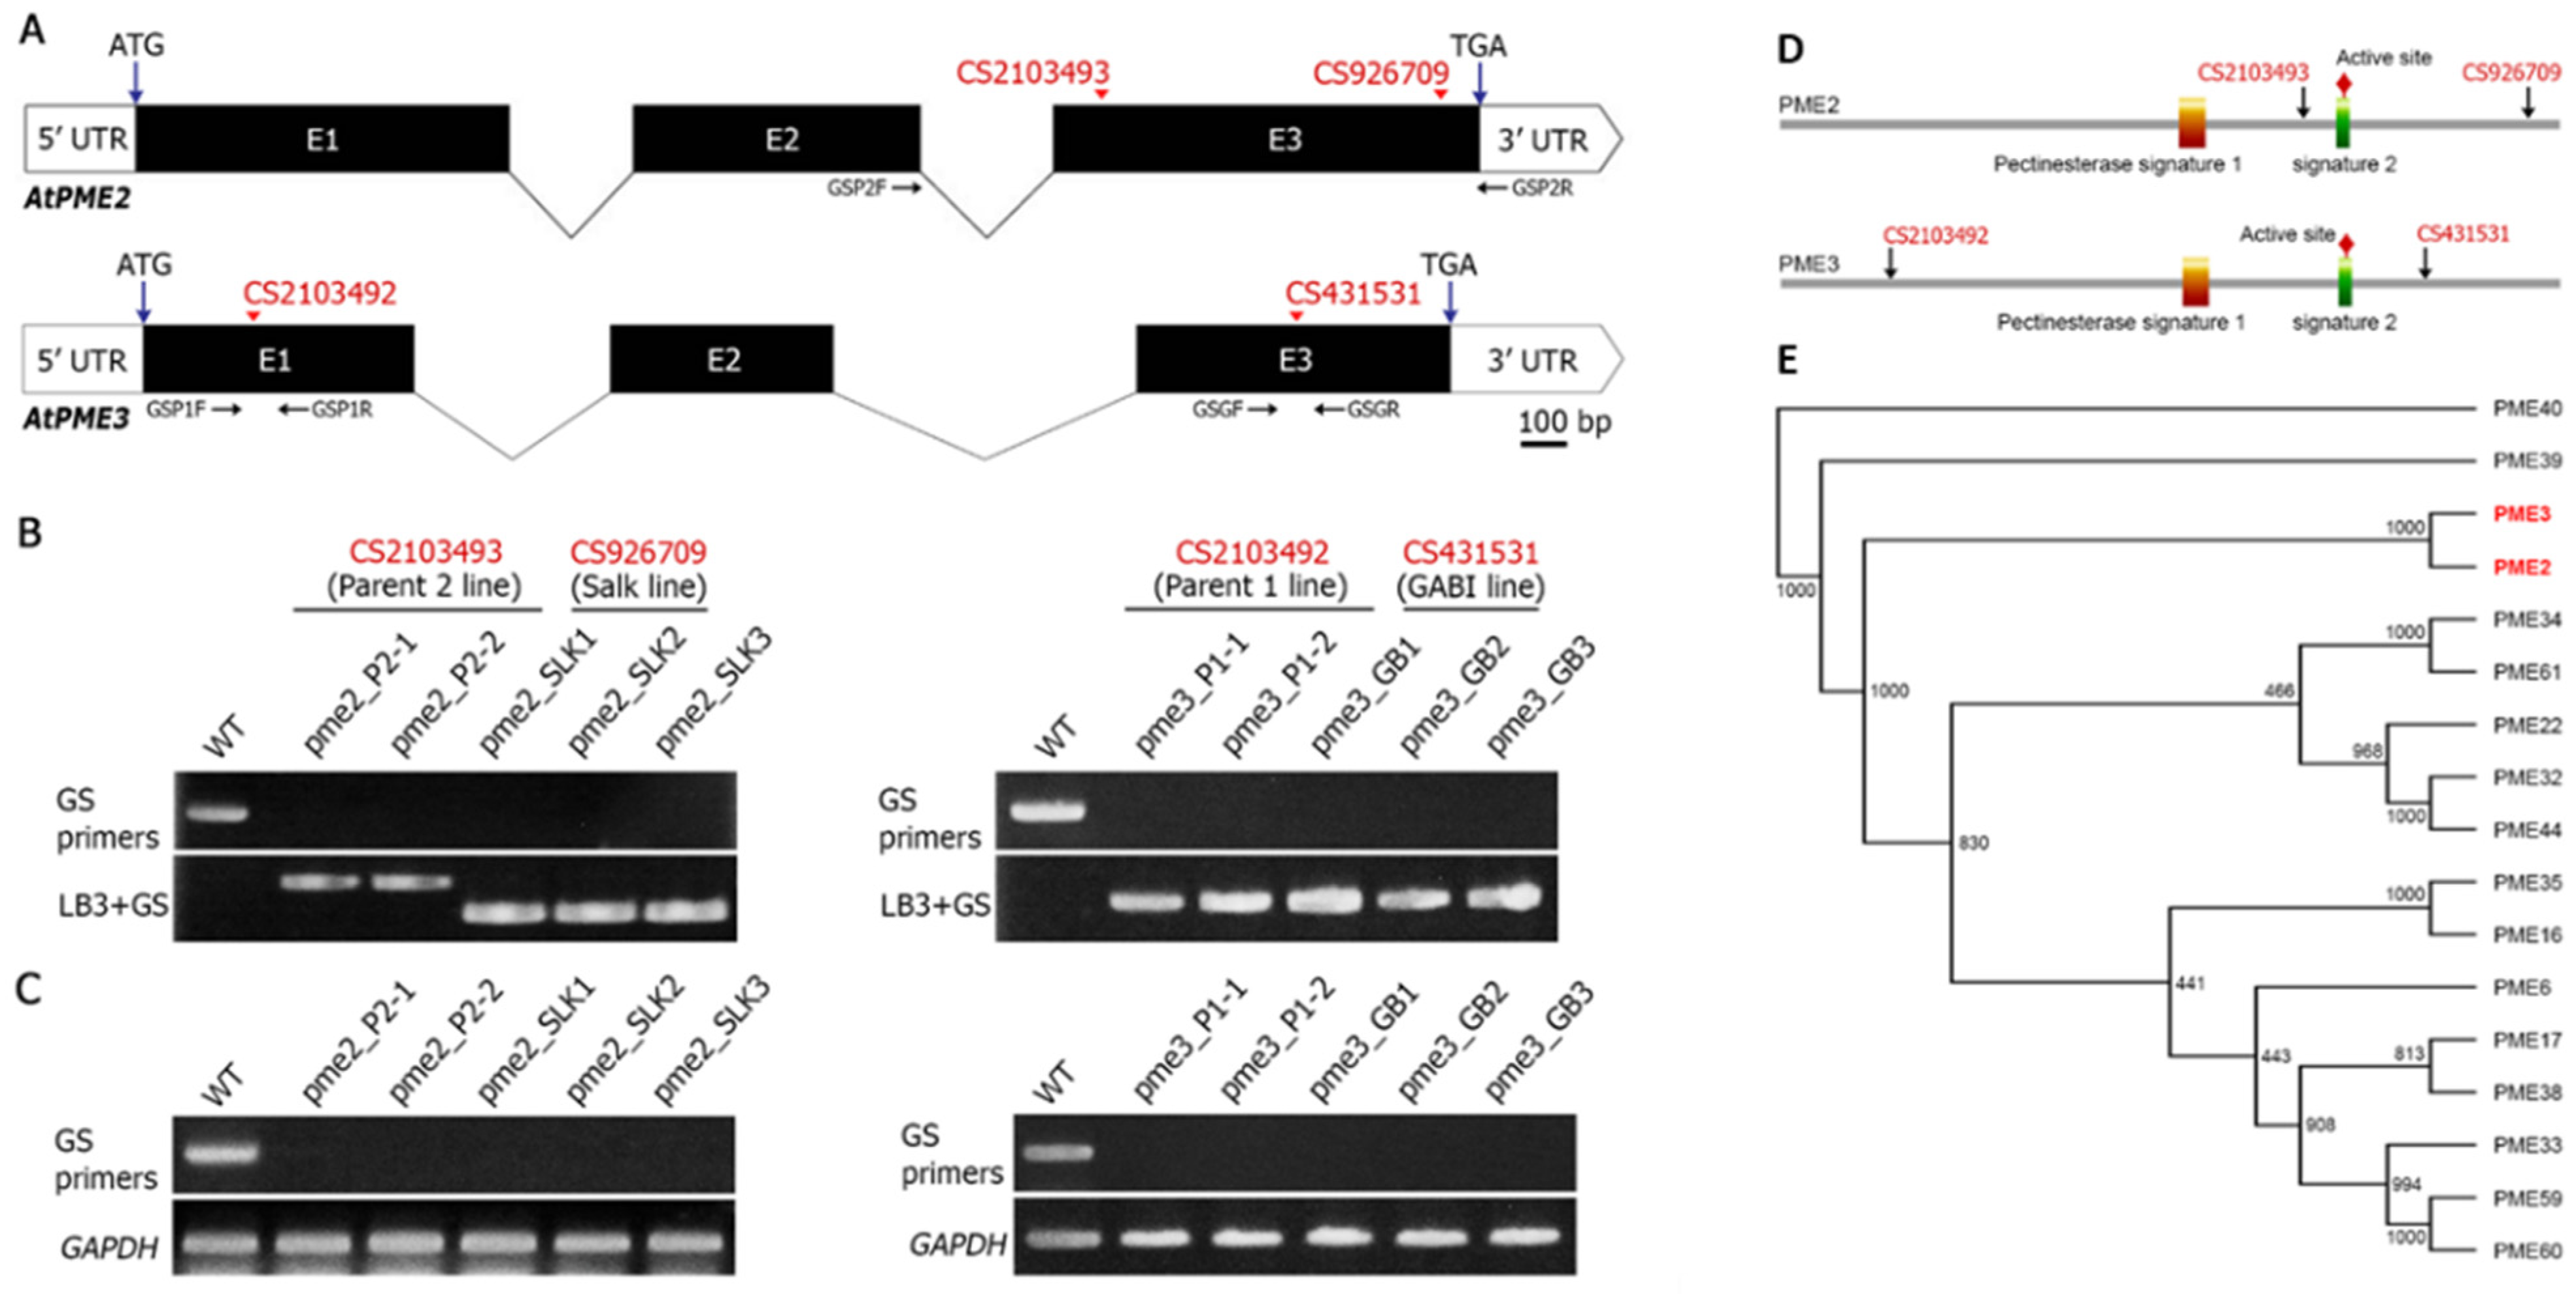
3.1. Analysis of PME Insertion Lines and Phylogeny

Both PME2 and PME3 gene loci are organized in 3 exons and 2 introns, encoding for pectin methylesterases. To investigate the putative functional role of PME2 and PME3 proteins in stomatal development, two independent T-DNA knock out lines for each gene were obtained and subjected to molecular and phenotypic analysis. Based on the information provided by TAIR, PME2 insertions (CS2103493 and CS926709) were mapped within exon 3, whereas that of PME3 (CS2103492 and CS431531) were located within the 1st and 3rd intron, respectively (Figure 1A). Furthermore, a homozygous pme2 pme3 double mutant (CS2102758) was obtained, resulted from the cross between CS2103493 (Parent 2 line for PME2) and CS2103492 (Parent 1 line for PME3). Transgenic plants were grown on MS plates for segregation analysis and to verify the T-DNA insertion loci by PCR. Lines CS2103493 (Parent 2 line for PME2), CS2103492 (Parent 1 line for PME3) and CS2102758 (pme2 pme3 double mutant) displayed a segregation of 100% mutant offsprings, indicating that the parental lines and the double mutant were homozygous. Lines CS926709 (Salk line for PME2 and CS431531 (GABI line for PME3) displayed a Mendelian segregation of 1:2:1 (WT:heterozygous:homozygous) offspring, indicating that the parental lines were heterozygous. Several progenies from these heterozygous plants were subjected to further segregation analysis, in order to obtain homozygous plants. Figure 1B shows the PCR analysis of five homozygous progeny from each PME2 and PME3 line, by using an LB based primer and a gene specific primer or a combination of two gene specific primers located on either site of the insertions. All homozygous plants displayed a T-DNA insertion band and no amplification with gene specific primers, while in WT plants the amplification of only the PME2 or PME3 specific band was observed (Figure 1B). Analysis of the selected homozygous plants by RT-PCR revealed complete absence of AtPME2 and AtPME3 transcripts, indicating that the lines were total loss of function mutants (Figure 1C). All experiments were carried out by using the above confirmed homozygous lines.
AtPME2 and AtPME3 encode for a 587 and 592 amino acids protein respectively. BLAST searches revealed that AtPME2 and AtPME3 proteins display an 81% identity and 88% similarity between them, and a 46–64% amino acid identity with other PME homologous from A. thaliana. Protein domain prediction tool “prosite” at Expasy identified two pectinesterase signature motifs in each protein sequence at similar positions, while their active sites are predicted within the second signature motifs (Figure 1D). Based on the BLAST search, the full-length amino acid homologous sequences from A. thaliana were used to construct a phylogenetic tree and to examine their evolutionary relationship. The analysis showed that AtPME2 and AtPME3 are evolutionary highly related and are clustered together in a distinct clade, with a bootstrap support value 1000/1000. The phylogenetic tree also showed the most closely related PME homologs from A. thaliana, which form with a high probability several separated clades (Figure 1E).

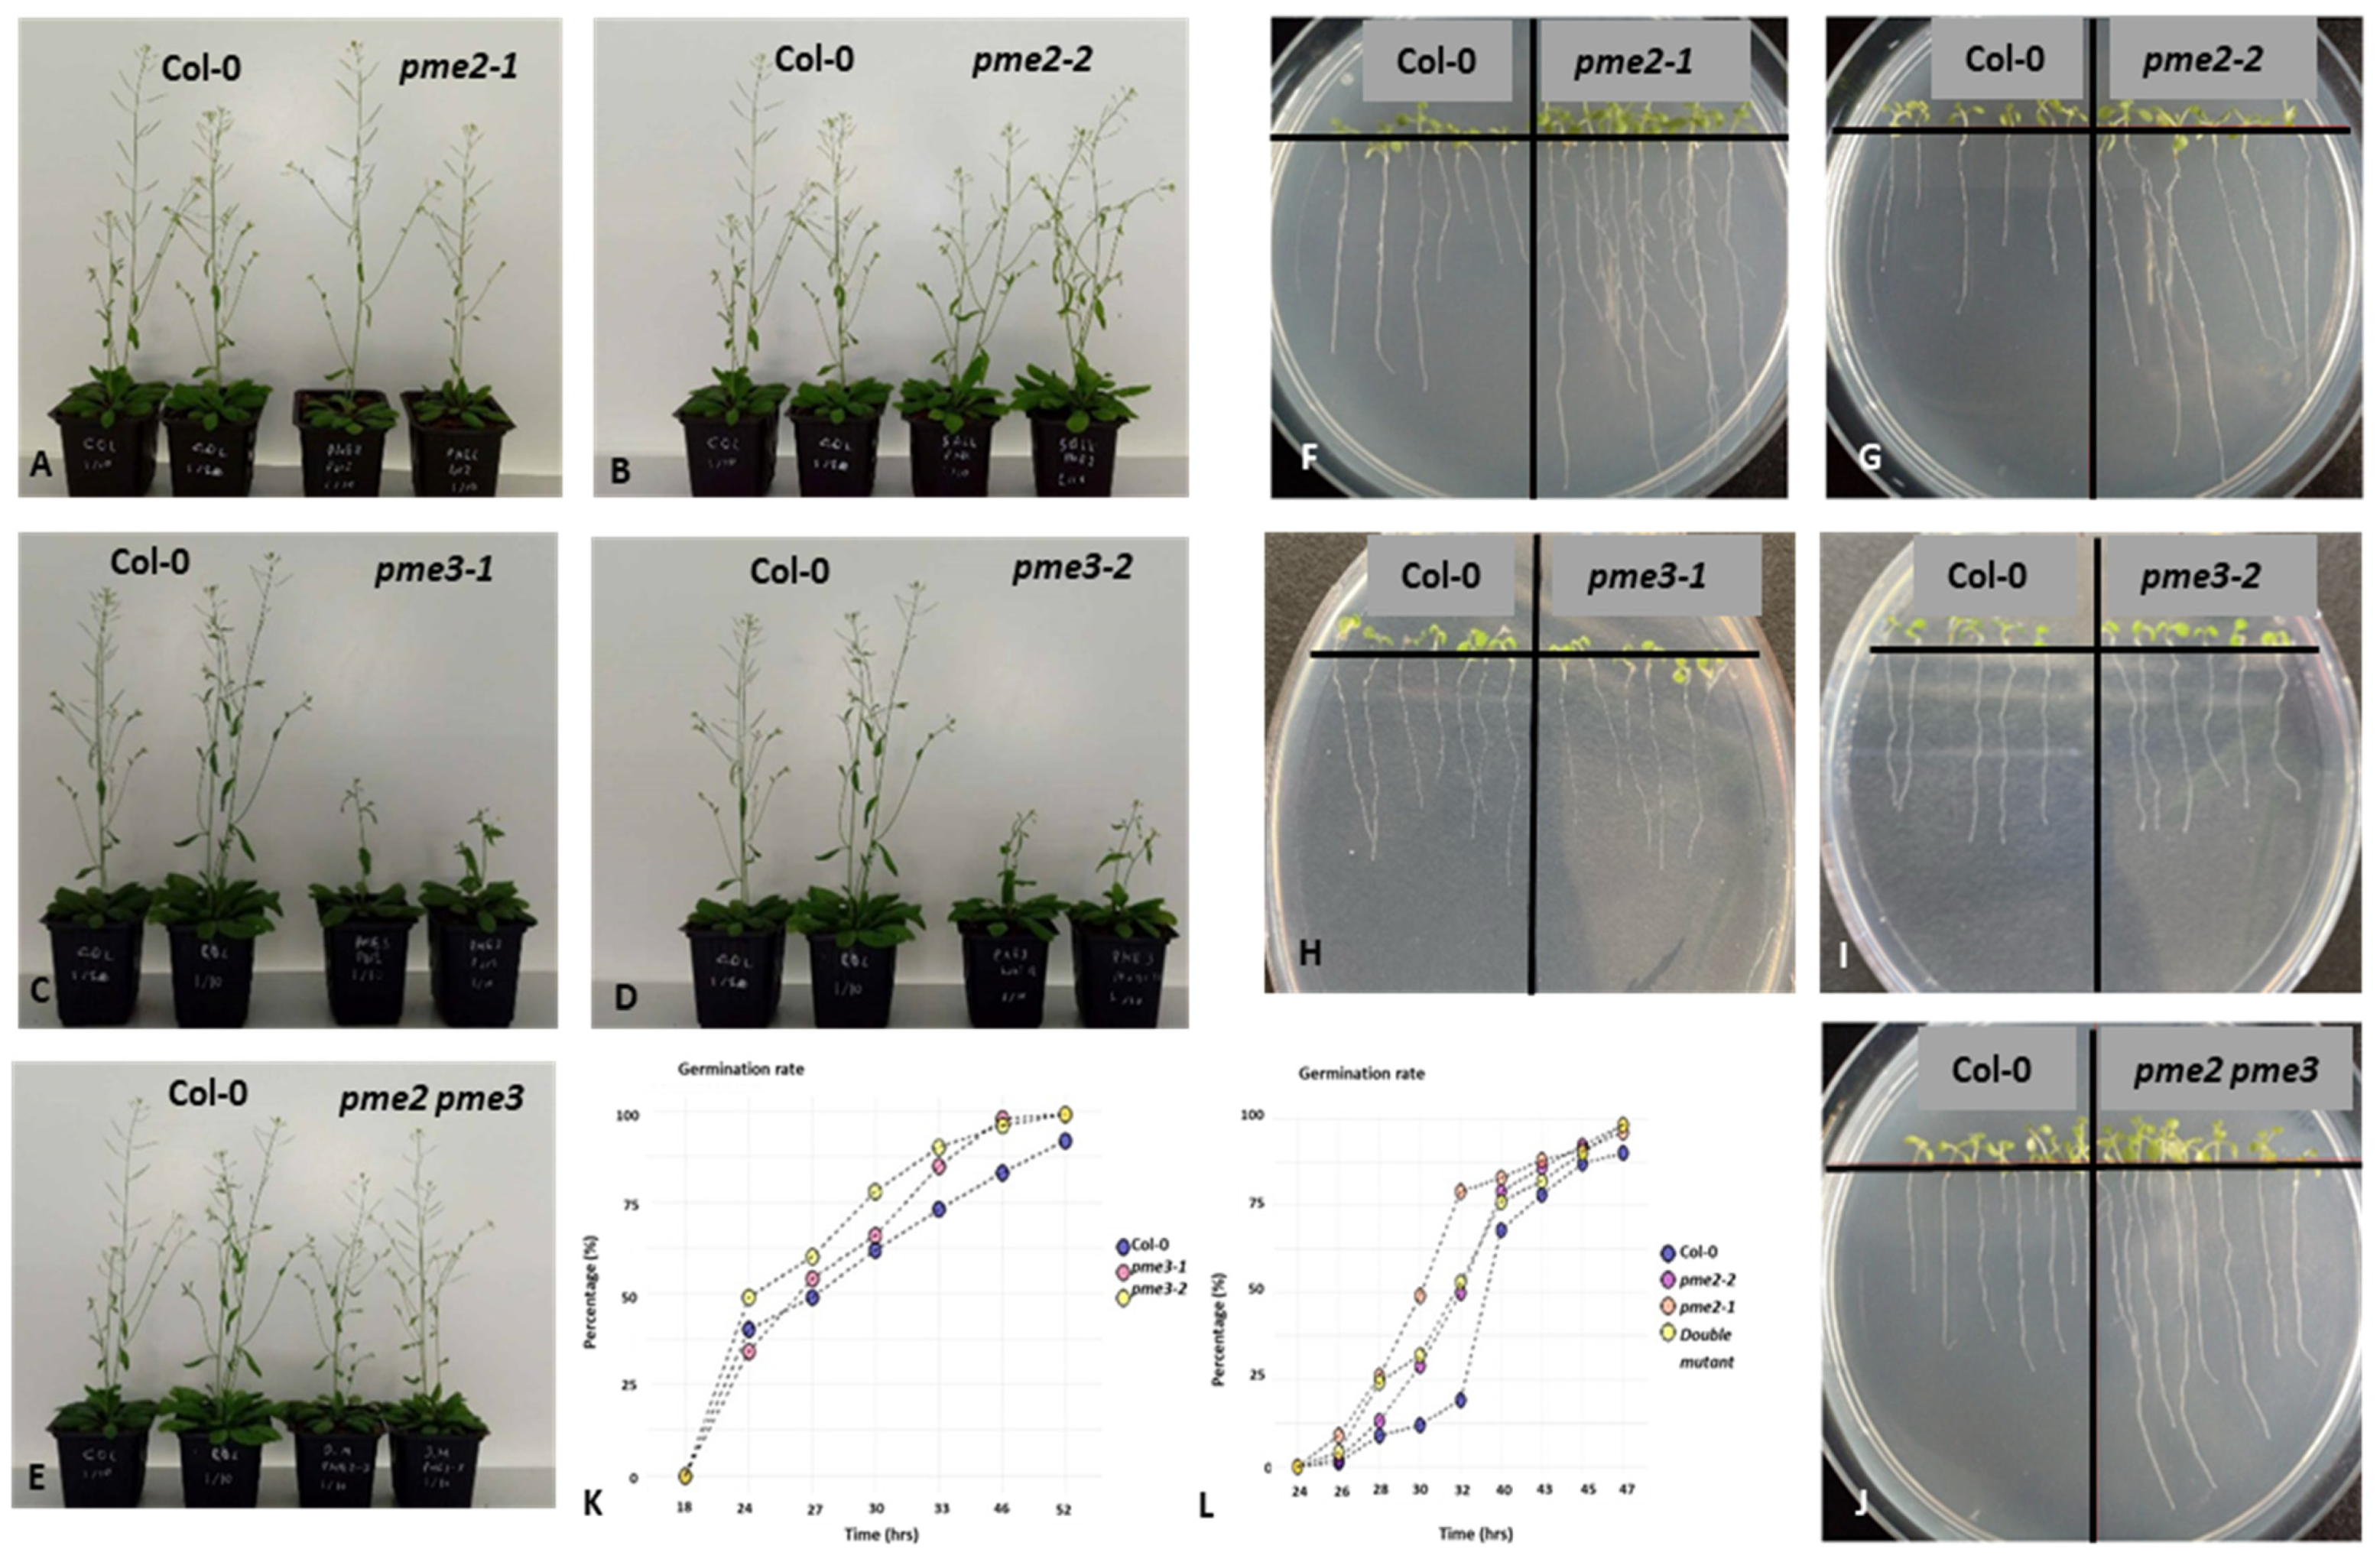
3.2. Macroscopic Phenotypes, Root Growth and Germination Rates of pme2, pme3 and pme2 pme3 Mutants

The macroscopic phenotypes of pme2 mutants (where pme2-1 corresponds to line pme2_P2-1 and pme2-2 corresponds to line pme2_SLK1) did not differ from those of Col-0 (Figure 2A,B). However, the growth of pme3-1 (corresponding to line pme3_P1-1) and pme3-2 (corresponding to line pme3_GB1) plants in soil seemed to be stunted (Figure 2C,D). As far as the pme2 pme3 mutant is concerned, after 30 d of soil growth, the phenotypes expressed did not display any phenotypic abnormalities or growth retardation. When seedlings were grown on MS agar, the root length of pme3-1 and pme3-2 was similar to that of Col-0 (Figure 2H,I). The roots of pme2-1 and pme2-2 as well as that of the pme2 pme3 mutant were longer after 7 d of growth on MS medium (Figure 2F,G,J respectively). However, seed germination seemed to be affected in all mutants examined (Figure 2K,L), since their seeds germinate earlier than those of Col-0.

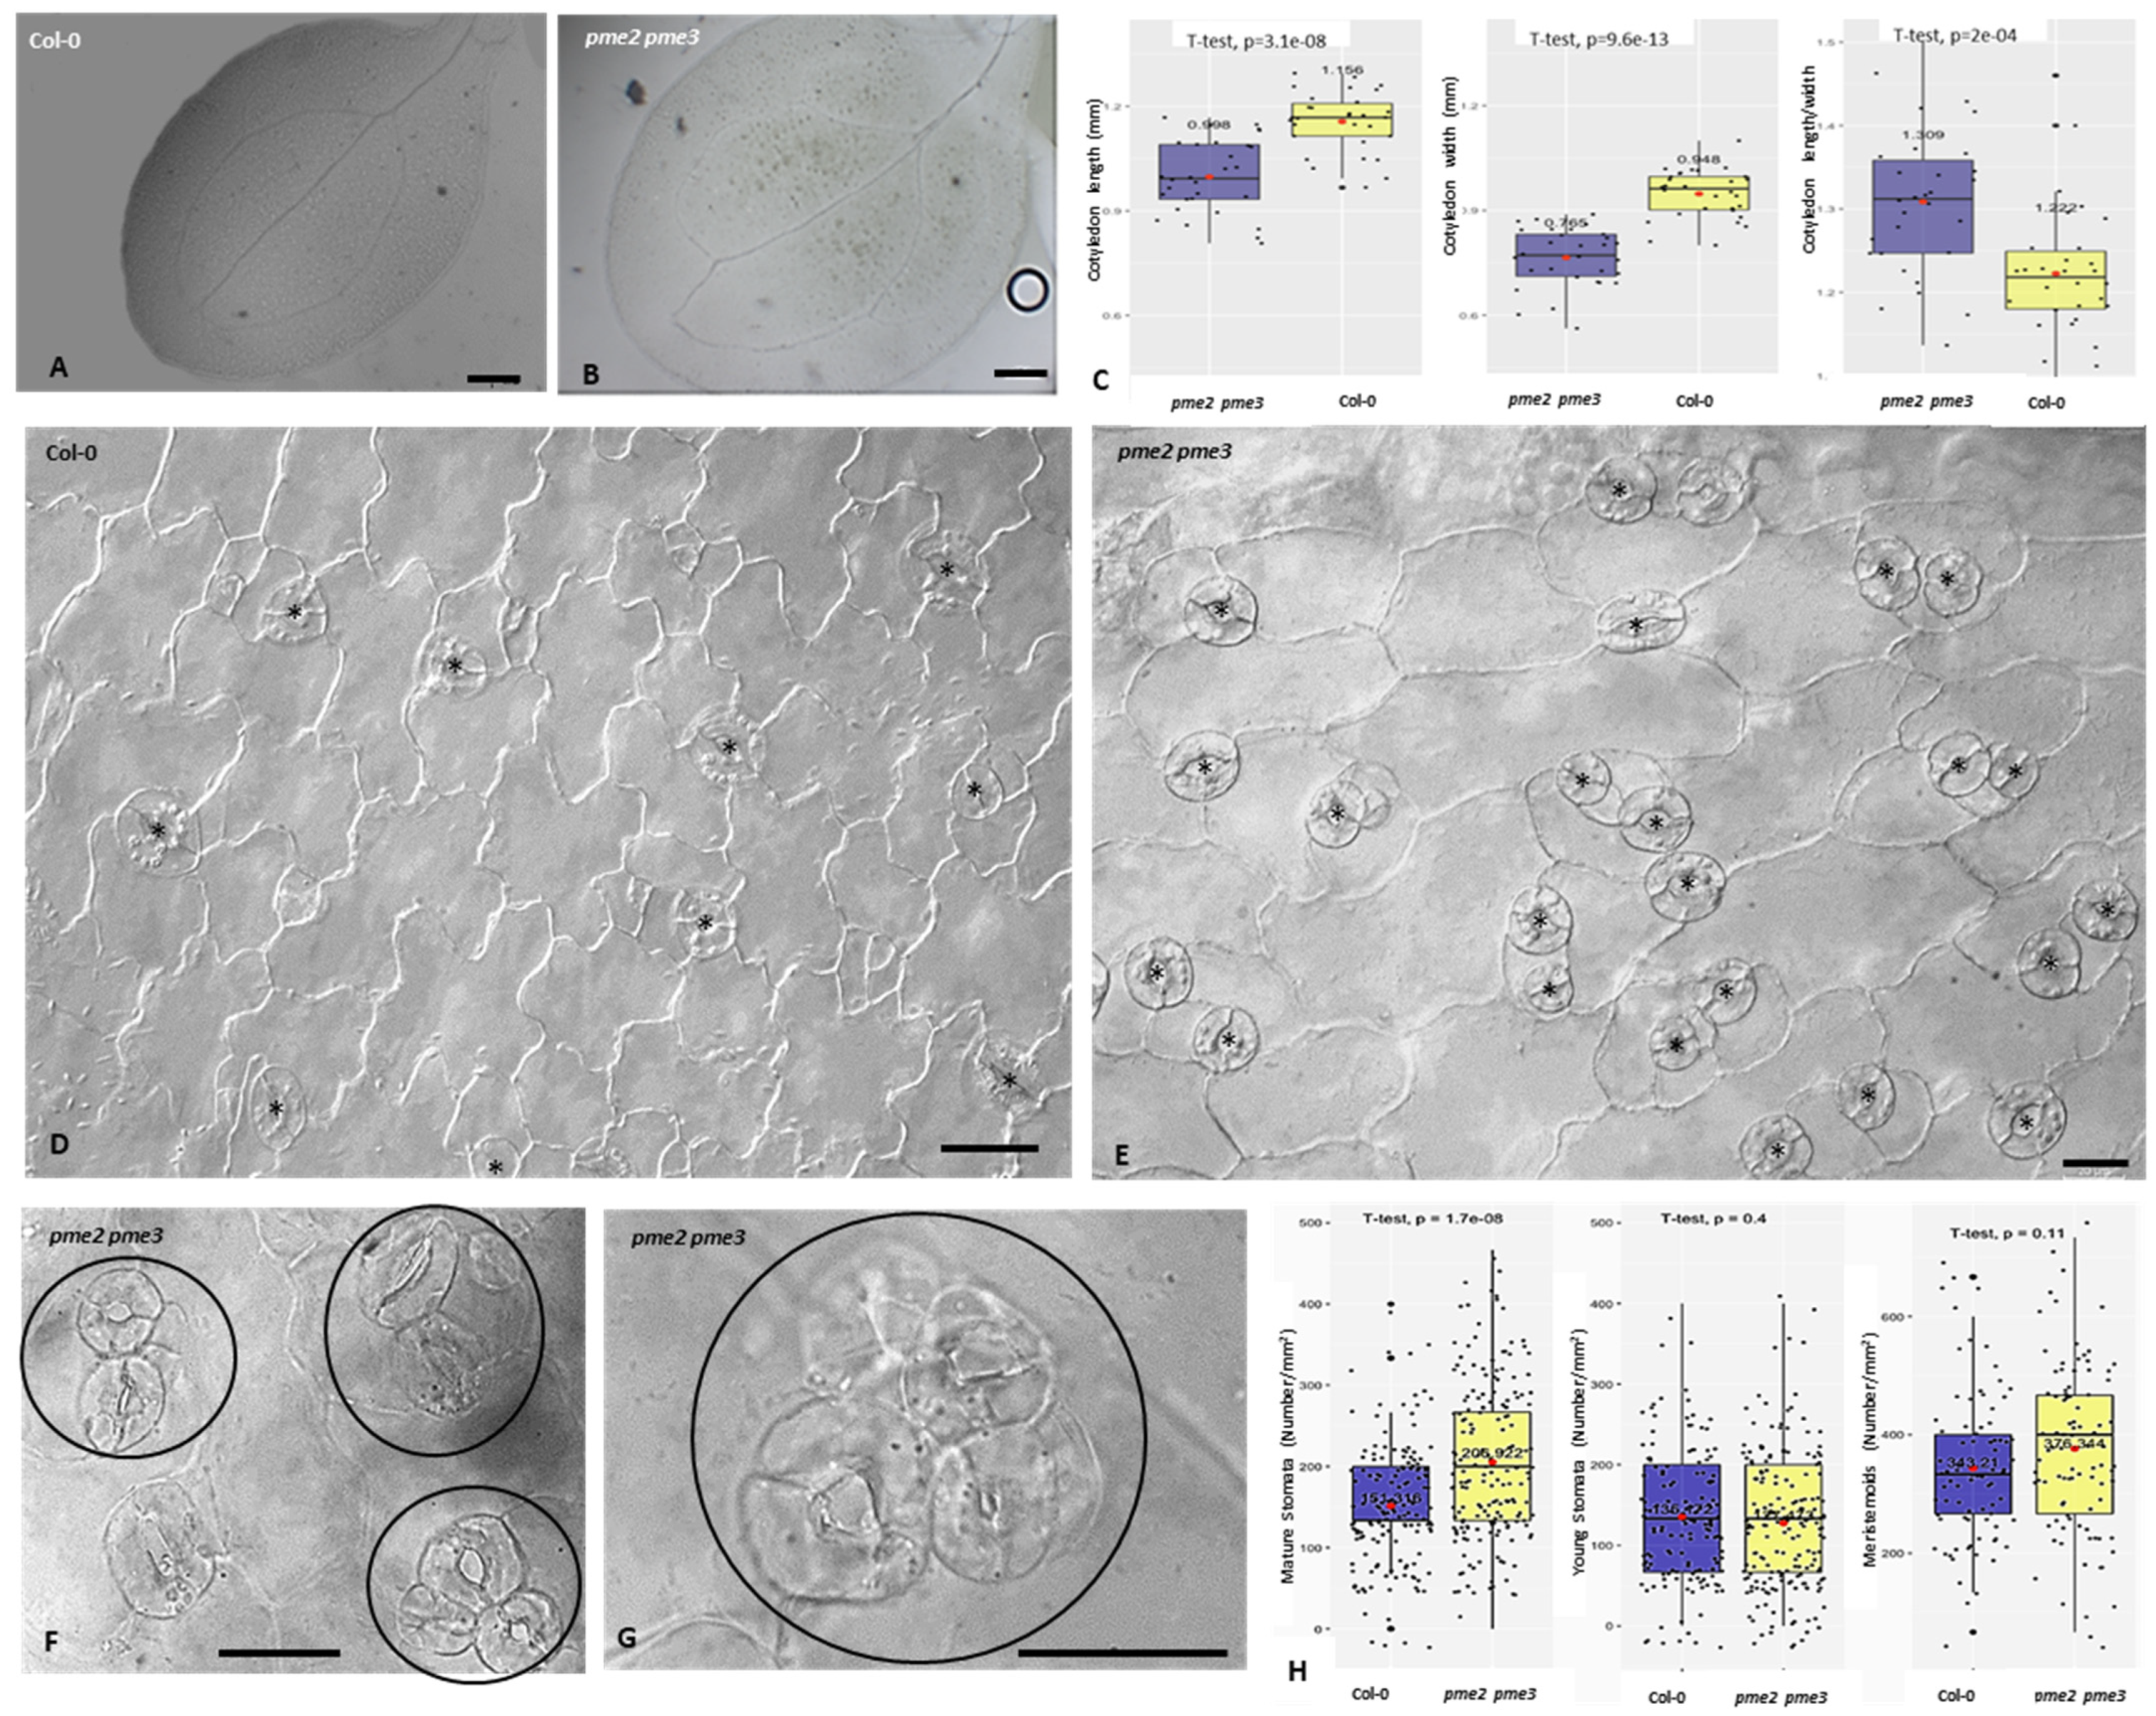
3.3. Cotyledons Shape, Pavement Cells Morphology and Stomatal Cells Patterning and Ontogenesis Are Affected in pme Mutants

Cotyledons of pme2pme3 displayed a different shape since they were longer but also wider than those of Col-0 (Figure 3A–C). As it can be observed in Figure 3E when compared to Figure 3D, the pavement cells at the cotyledon of pme2 pme3 did not form lobes and indentations that are typically observed in WT plants. In Figure 3, the increased number of mature stomata in the pme2 pme3 mutant was obvious (Figure 3E) compared to the WT (Figure 3D), as well as the density and clustering of the stomatal complexes (circles in Figure 3F,G), indicating that the one cell spacing rule is clearly compromised. The total number of mature, young and meristemoids in 5d grown cotyledons were measured and the results showed a higher number of stomata and meristemoids in the mutant line (Figure 3H). The changes in stomatal patterning and frequency are in line with the significant roles of these specific PME genes in the transduction of various stimuli, responsible for the precise placement of the stomatal meristemoids and their successive differentiation into guard cells.

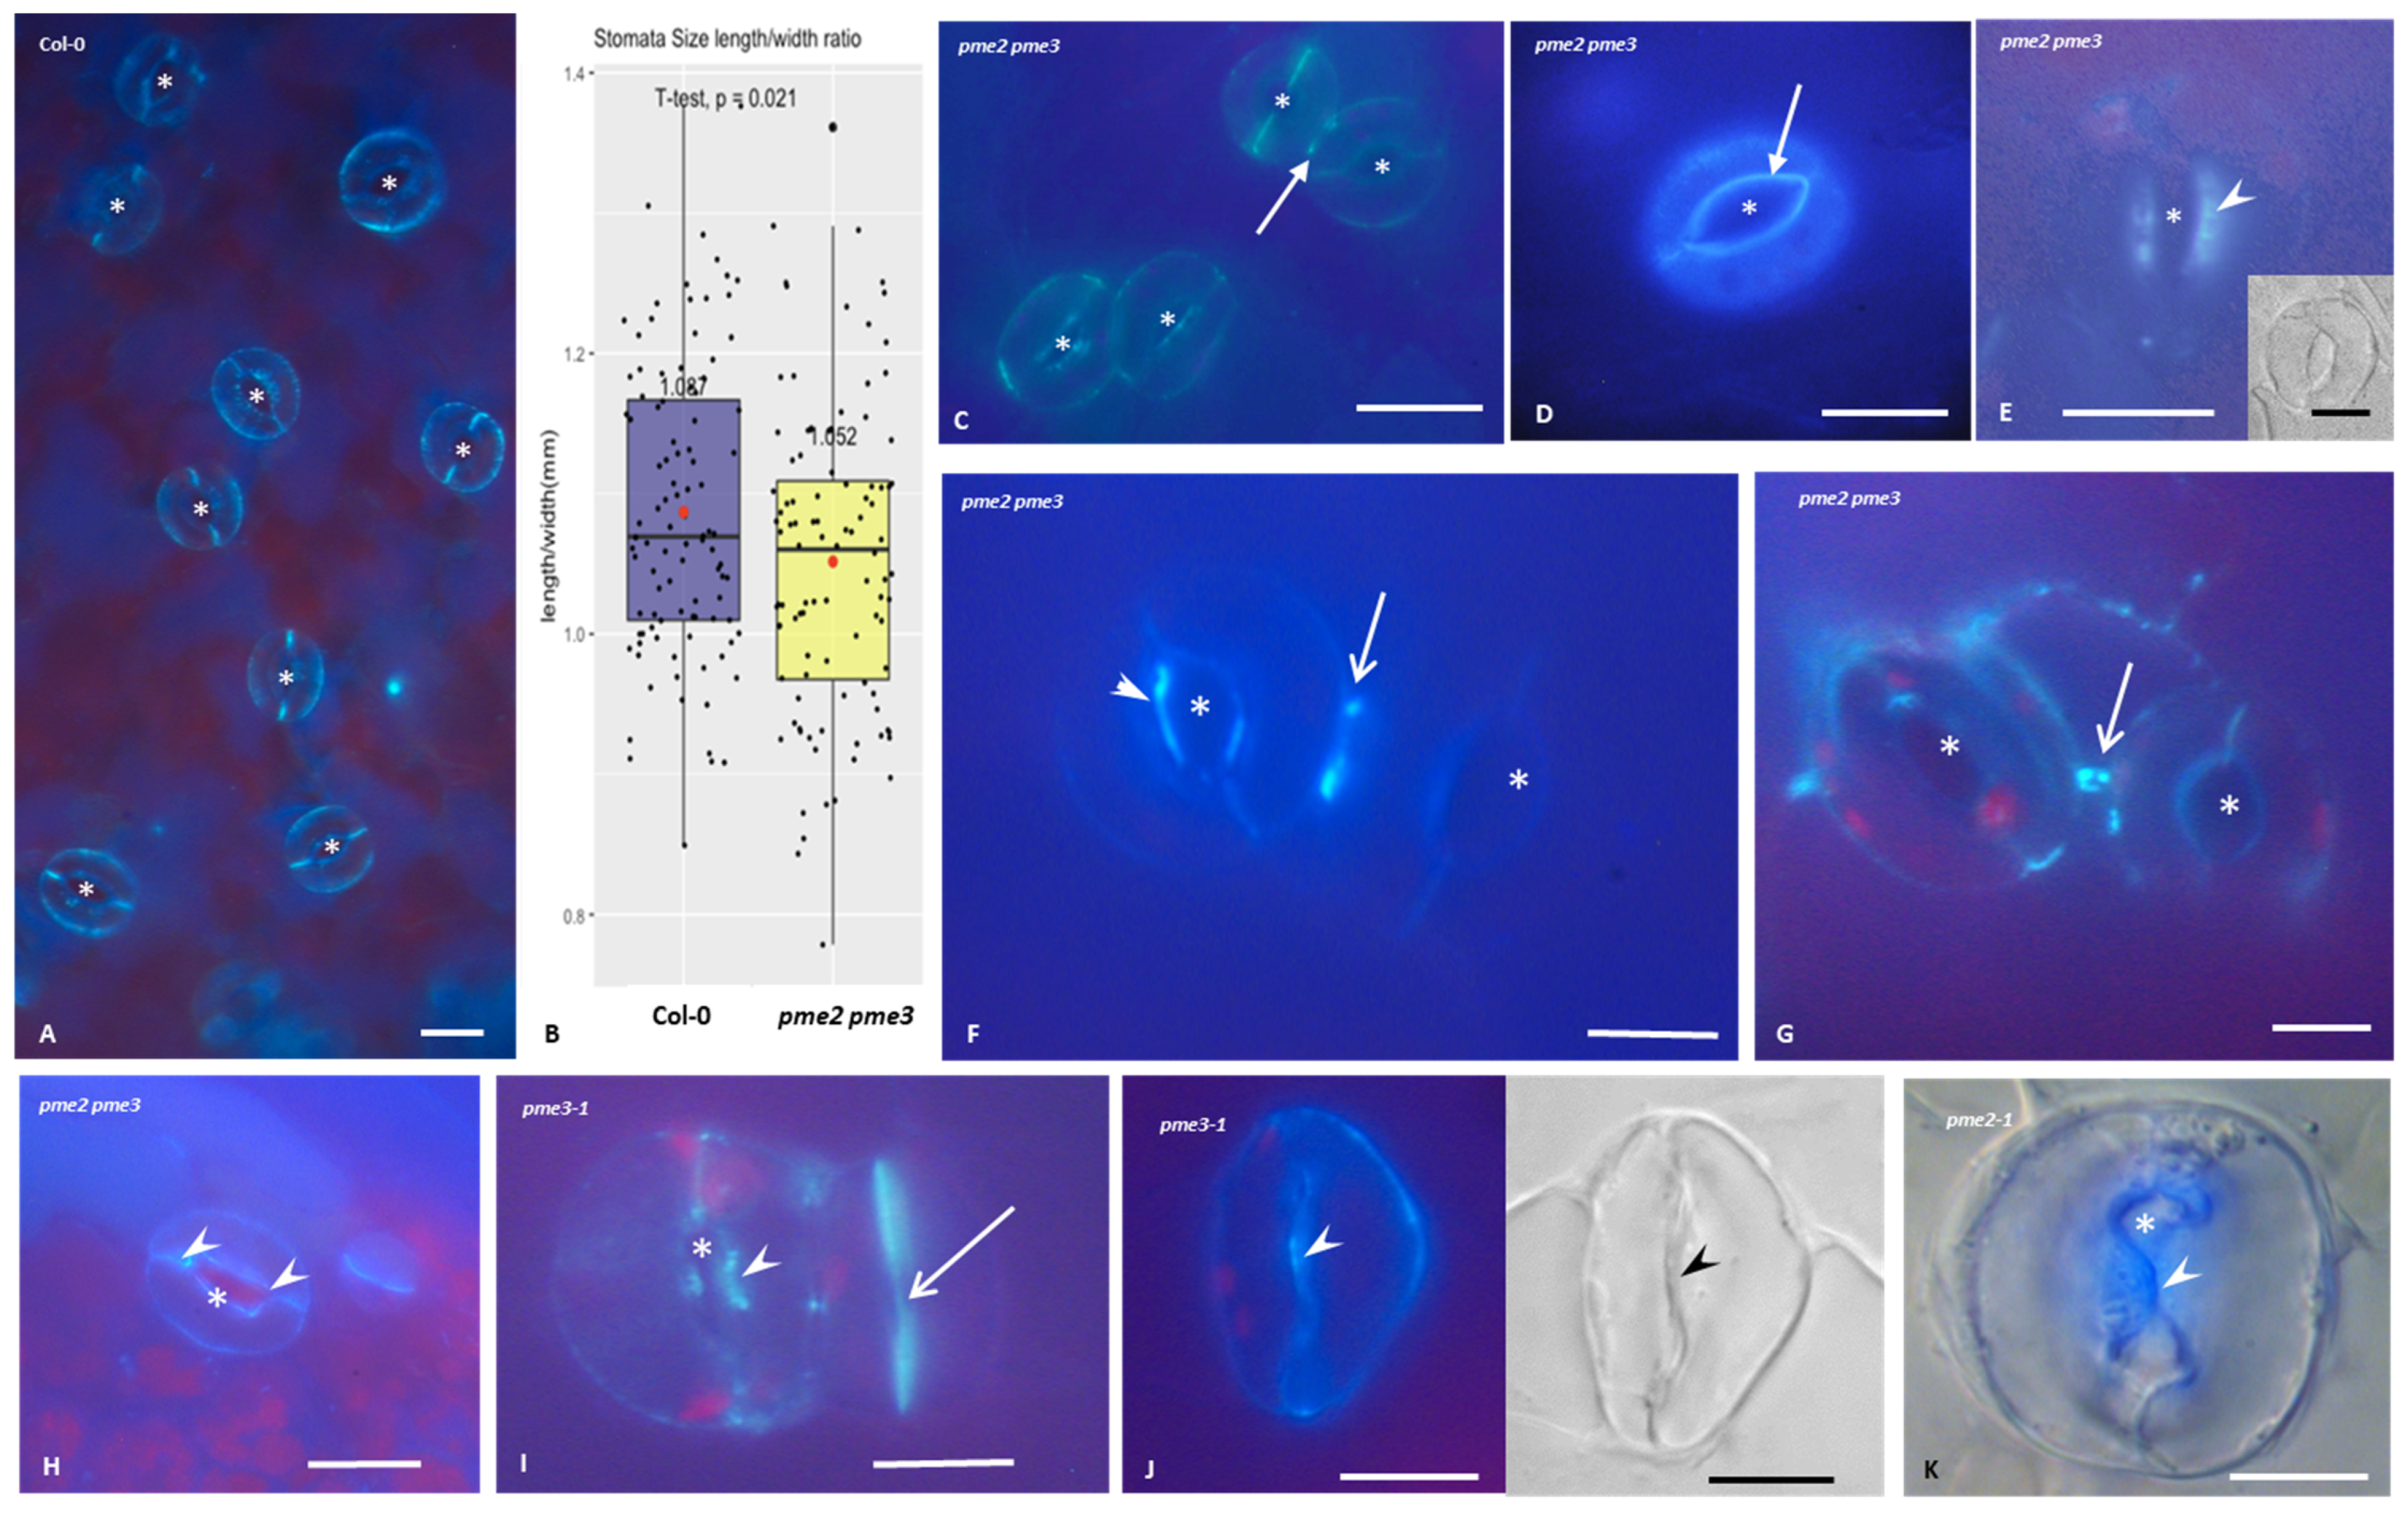
3.4. Callose Deposition in Stomatal Complexes of pme2, pme3 and pme2 pme3 Mutants

Callose deposition in pme mutants (Figure 4C–K) displayed significant differences compared to Col-0 (Figure 4A). Aniline blue staining was prominent in young cell plates, in both Col-0 and pme mutants, while in the mature stomata a strong staining in the polar ventral cell wall ends was observed (Figure 4A,C). In Figure 4B, the stomata length/width ration is depicted, where it can be seen, that the pme2 pme3 guard cells are wider than those of Col-0. In pme2 pme3 mutant, apart from an intense fluorescent signal at the ledges of the periclinal cell walls (arrow in Figure 4D), intense callose signal is observed at the ventral cell walls at the site of the stomatal pore (Figure 4E), which was not observed at the open stomata of Col-0 (cf. Figure 4A). When stomata clustering was observed, callose was also present at the dorsal cell walls of the neighbouring guard cells that are in contact (Figure 4F). Cell wall strands interconnecting two stomata also contained callose (arrow in Figure 4G). Irregular shape of the stomatal pore was a frequent phenomenon, not only at pme2 pme3 mutant (Figure 4H), but also of the single mutants (Figure 4I,J). The ventral cell wall ends delimiting the stomatal pore are marked with intense callose fluorescent signal (arrowheads in Figure 4H). Morever, mature stomata where the stomatal pore formation was delayed (pointed arrow in Figure 4I and arrowhead in Figure 4J) or with irregular stomatal pore opening were also observed (Figure 4K).

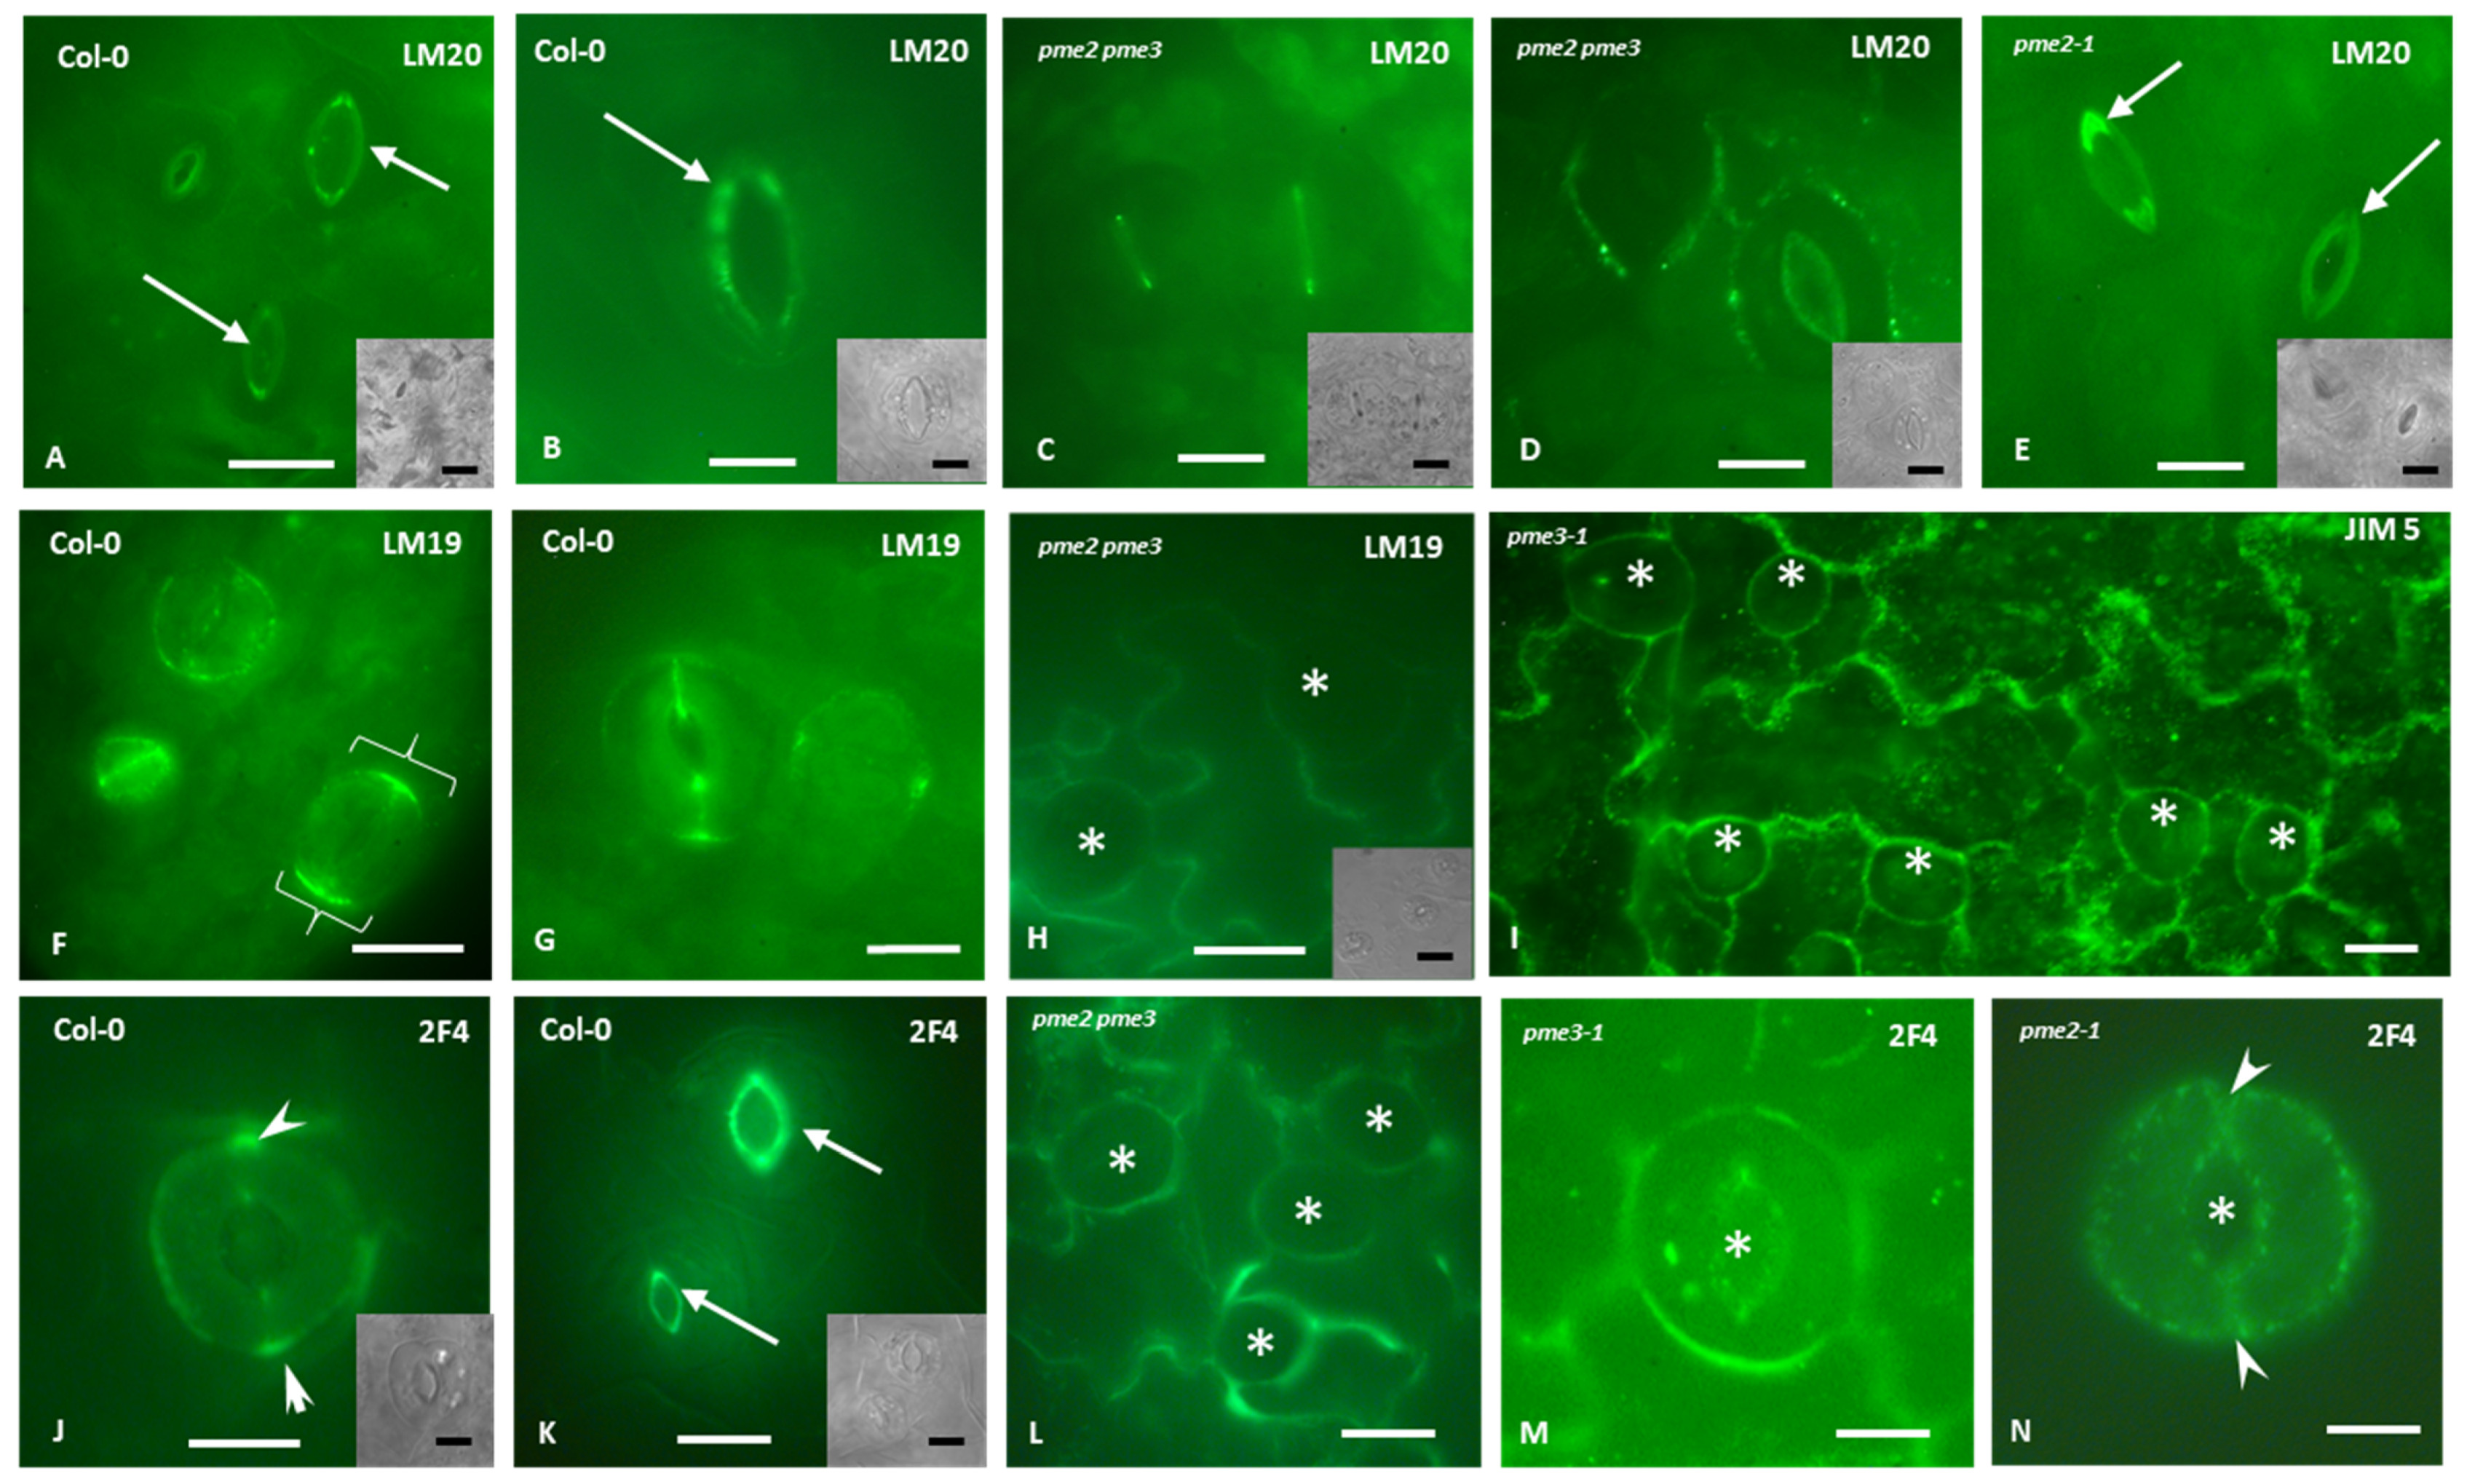
3.5. Homogalacturonans’ Deposition in Stomatal Complexes of pme2, pme3 and pme2 pme3 Mutants

Cell wall matrix components distribution was observed in pme mutants mature stomata (Figure 5). In mature Col-0 stomata, the LM20-, homogalacturonan (HG) epitope was mainly found at the base of the stomatal pore ledges (Figure 5A,B). At the pme2 pme3 mutants the same epitope was distributed at the ventral cell wall (Figure 4C) and also broadly in the dorsal cell walls of the guard cells at the stomata periphery (Figure 4D). LM19-HG epitope at Col-0 was mainly observed at the cell wall thickenings of the junction sites of the dorsal walls with the ventral wall in mature stomata (Figure 4F), while in younger ones it was deposited at the polar ends of the ventral cell wall (Figure 4F,G). In the pme2 pme3 mutant as well as in the pme3 mutant, the signal is intense at the dorsal cell walls and at the junctions sites with the epidermal cells (Figure 4H,I). The 2F4-HG epitope showed a prominent distribution at the junction sites of the dorsal cell walls of the guard cells (Figure 5J) and at the ledges of the periclinal cell walls (Figure 4K) in Col-0, while in pme2 pme3 mutants, intense fluorescent signal was observed only at the dorsal cell wall junctions with the epidermal cells and around the periphery of the dorsal cell wall (Figure 5L–N). No 2F4-HG epitope signal was observed at the thickenings of the junction site of the dorsal cell walls to the ventral cell wall (arrowheads in Figure 4N).

4. Discussion

4.1. PMEs Role in Regulating Stomatal Patterning and Pavement Cells Shape

Intrinsic cues, comprising developmental programs as well as hromones, seem to control stomatal patterning [18]. Signaling peptides such as EPIDERMAL PATTERNING FACTOR1/2 and STOMAGEN activate plasma membrane receptors, like ERECTA and TOO MANY MOUTHS, to accurately control stomatal distribution and patterning on the epidermis [18]. When the receptors are activated, the downstream intracellular MAPK kinase pathway consisting of YODA (MAPKKK), MKK4/5, and MPK3/6 is triggered [19,20]. Finally, the differential activation and function of the following three beta helix-loop-helix transcription factors seem to regulate stomatal cell lineage patterning: (a) SPEECHLESS (SPCH), controlling the entry, spacing and amplifying divisions, (b) MUTE required to terminate asymmetric divisions and promote the differentiation of meristemoids into guard cell mother cells (GMCs), and (c) FAMA, expressed in GMCs, required to promote maturation of the GCs [18]. The pectinmethylesterification status of homogalacturonans has already been implicated in the transduction of the morphogenetic stimulus- probably auxin- in grasses [1,8]. The establishment of polarity is often accompanied by cell wall modifications e.g., the stomata lineage of Z. mays [8], but also in fungi, algae and various angiosperm cell types. In this work, we present data showing that the impairment of two PMEs genes (PME2 and PME3) results in stomatal density and distribution changes. The above result strengthens the notion that the spatiotemporal tuning of the cell wall matrix materials deposition is important for the establishment of polarity and the following stomatal lineage development. Recent data have already revealed the role of selective expansion of cell wall matrix regions in the morphogenesis of mesophyll cells [21,22] as well as pavement cells [7,23]. The lack of cell lobes and indentations formation, observed (Figure 3E) in the pme2 pme3 double mutant, can be attributed to the failure of the cell wall to render stiff at specific sites, like the tips of the lobes, compromising, therefore, lobe formation.

4.2. PMEs Role in Stomatal Shape, Stomatal Movement and Homogalacturonans Deposition

Matrix cell wall materials are implicated in stomatal movement [12,13,15,24]. Xyloglucans and pectins seem to participate in stomatal movement of Arabidopsis thaliana, since they are associated with controlling cellulose microfibril reorganization accompanying stomatal movement [15,25]. Arabidopsis guard cell walls are rich in unesterified pectins [14]. A pectin methylesterase gene that is highly expressed in GCs and is required for stomatal function was identified, suggesting that the reduction of pectin de-esterification alters the stiffness of the GCs cell walls, limiting the potential changes in GC size during stomatal movements. Rui et al. [26] found out that a polygalacturonase gene (PGX3) is expressed in GC of Arabidopsis thaliana, which, among others, contributes to the proper opening/closure dynamics of stomata by modifying pectin size and abundance. Carter et al. [27], using atomic force microscopy analysis, observed in the kidney-shaped stomata of Arabidopsis thaliana, a radial gradient of stiffness at the middle of GCs and a stiffening at the polar GC ends, related to demethylesterified homogalacturonans deposition in these regions. This polar guard cell stiffening, caused partially by accumulation of de-esterified HGs at specific sites, plays a key role in stomatal function. The guard cell pole stiffening limits stomatal extension during stomatal movement, thus contributing in stomatal pore opening. Our results suggest that the stomatal shape is altered in pme mutants (Figure 4B), since stomata in the mutant were wider than those of Col-0. This may be attributed to the change in the cell wall composition of the periclinal and dorsal cell walls and the lack of demethylesterified pectins in these regions, which allows the flexibility and the change in the cell shape when turgor pressure rises. In Figure 5N, the polar ends of the guard cells do not display 2F4-HG signaling, suggesting an inability of the guard cells to fortify the specific regions responsible for stomatal movement. Stomata complexes had a distorted LM19, JIM5-, 2F4-HG epitope deposition in the cell wall thickenings of the polar ventral ends in contact with the dorsal cell wall junctions also indicating a lack of the required stiffness of this area.

4.3. PMEs Affecting Callose and Stomatal Pore Formation

In stomata of the fern Asplenium nidus, callose is implicated in stomatal pore formation, guard cell wall thickenings formation as well as in stomatal function [28,29,30]. The deposition of distinct local callose pads on the external periclinal guard cell walls are observed at closed stomata, but they seem to disappear in the opened ones. Experimental evidence showed that callose is also involved in stomatal movement [30,31]. In Vigna sinensis as well as in Arabidopsis thaliana [32], callose is detected along the whole surface of the polar ventral wall ends but is absent from the regions of the forming stomatal pore, a distribution maintained after stomatal pore formation. In pme mutants, callose was present at the ventral cell wall at the site where stomatal pore is formed, even at mature stomata (Figure 4I,J). Furthermore, many abnormalities at the already formed stomatal have been observed (Figure 4H,K) leading in inability of the stomatal pore to open satisfactorily. Rui et al. [16] have proved that pectin degradation by PMEs is essential for the initiation of the stomatal pore formation. Data indicate that de-methyl-esterified HG and HG-degrading enzymes become enriched at sites of stomatal pore initiation after exocyst accumulation at these sites. Subsequently, changes in the demethylesterification status may have an impact on stomatal pore formation and elongation. The lack of demethylesterified pectins at this area as well as the presence of callose, which is not degraded at the specific site, might both severely affect not only stomatal pore formation and elongation but also the mechanics implicated during stomatal opening.

5. Conclusions

In conclusion, the functional disruption of two pectinmethylesterases (PME2 and PME3) appears to affect stomatal lineage development at the epidermis of Arabidopsis thaliana cotyledons, pavement cells morphogenesis, and stomatal pore initiation. All the above indicate that the fine tuning of the demethylesterification of homogalacturonans play a significant role in the spatiotemporal differentation of the cell wall matrix materials. Among various morphogenetic processes that are controlled by this procedure, stomatal patterning as well as stomatal formation and movement are severely affected.

Author Contributions

Conceptualization, K.H. and E.G.; validation, A.T. and I.-D.S.A.; investigation, A.T., I.-C.A., V.B. and V.P.; writing—original draft preparation, E.G.; writing—review and editing, K.H., E.G. and I.-D.S.A. All authors have read and agreed to the published version of the manuscript.

Funding

This work was funded by the National and Kapodistrian University of Athens Special Account For Research Grants (S.A.R.G.), grant number KE16673.

Institutional Review Board Statement

Not applicable.

Informed Consent Statement

Not applicable.

Conflicts of Interest

The authors declare no conflict of interest.

Appendix A

Table A1. Primers used for semi-quantitative RT-PCR.
Gene/SequencePrimer NameSequence
AtPME2GSP2FGACGGTAGCACCACTTTCCA
AtPME2GSP2RCAGCCCGAGTTATGCATTGAC
AtPME3GSP1FTCTGCCGGAGCTTCAAAAGC
AtPME3GSP1RACAGCCACCGTAGTTTCCTG
AtPME3GSGFGGAGATGGTCGGACGAGAAC
AtPME3GSGRCAAGGCGCAAAAACCCGCAT
T-DNA (Wisconsin)p745AACGTCCGCAATGTGTTATTAAGTTGTC
T-DNA (Salk)LBb1.3ATTTTGCCGATTTCGGAAC
T-DNA (Gabi)o8474ATAATAACGCTGCGGACATCTACATTTT
T-DNA (Gabi)o8409ATATTGACCATCATACTCATTGC
AtGAPDHAtGAPDH-FCTGTGAGTAACCCCATTCATTACATACCAAGC
AtGAPDHAtGAPDH-RGCAATGCATCTTGCACTACCACTGTCTTGC
Table A2. Arabidopsis thaliana protein sequences used for the phylogenetic analysis.
AbbreviationTair IDUniProtKB
PME2At1g53830Q42534
PME3At3g14310O49006
PME6At1g23200O49298
PME16At2g43050Q9SKX2
PME17At2g45220O22149
PME22At3g05620Q9M9W7
PME32At3g43270Q9LXK7
PME33At3g47400Q9STY3
PME34At3g49220Q9M3B0
PME35At3g59010Q9LYT5
PME38At4g00190O81320
PME39At4g02300O81415
PME40At4g02320O81301
PME44At4g33220Q9SMY7
PME59At5g51490Q9FHN5
PME60At5g51500Q9FHN4
PME61At5g53370Q9FK05

References

  1. Apostolakos, P.; Livanos, P.; Giannoutsou, E.; Panteris, E.; Galatis, B. The intracellular and intercellular cross-talk during subsidiary cell formation in Zea mays: Existing and novel components orchestrating cell polarization and asymmetric division. Ann. Bot. 2018, 122, 679–696. [Google Scholar] [CrossRef] [PubMed]
  2. Nadeau, J.A.; Sack, F.D. Control of stomatal distribution on the Arabidopsis leaf surface. Science 2002, 296, 1697–1700. [Google Scholar] [CrossRef] [PubMed]
  3. Chowdhury, M.R.; Ahamed, M.S.; Mas-Ud, M.A.; Islam, H.; Fatamatuzzohora, M.; Hossain, M.F.; Billah, M.; Hossain, M.S.; Matin, M.N. Stomatal development and genetic expression in Arabidopsis thaliana L. Heliyon 2021, 7, e07889. [Google Scholar] [CrossRef] [PubMed]
  4. Herrmann, A.; Torii, K.U. Shouting out loud: Signaling modules in the regulation of stomatal development. Plant Physiol. 2021, 185, 765–780. [Google Scholar] [CrossRef]
  5. Han, S.K.; Torii, K.U. Lineage-specific stem cells, signals and asymmetries during stomatal development. Development 2016, 143, 1259–1270. [Google Scholar] [CrossRef] [Green Version]
  6. Pillitteri, L.J.; Dong, J. Stomatal development in arabidopsis. Arab. Book/Am. Soc. Plant Biol. 2013, 11, e0162. [Google Scholar] [CrossRef] [Green Version]
  7. Sotiriou, P.; Giannoutsou, E.; Panteris, E.; Galatis, B.; Apostolakos, P. Local differentiation of cell wall matrix polysaccharides in sinuous pavement cells: Its possible involvement in the flexibility of cell shape. Plant Biol. 2018, 20, 223–237. [Google Scholar] [CrossRef]
  8. Giannoutsou, E.; Apostolakos, P.; Galatis, B. Spatio-temporal diversification of the cell wall matrix materials in the developing stomatal complexes of Zea mays. Planta 2016, 244, 1125–1143. [Google Scholar] [CrossRef]
  9. Sotiriou, P.; Giannoutsou, E.; Panteris, E.; Apostolakos, P.; Galatis, B. Cell wall matrix polysaccharide distribution and cortical microtubule organization: Two factors controlling mesophyll cell morphogenesis in land plants. Ann. Bot. 2016, 117, 401–419. [Google Scholar] [CrossRef] [Green Version]
  10. Jones, L.; Milne, J.L.; Ashford, D.; McCann, M.C.; McQueen-Mason, S.J. A conserved functional role of pectic polymers in stomatal guard cells from a range of plant species. Planta 2005, 221, 255–264. [Google Scholar] [CrossRef]
  11. Giannoutsou, E.; Sotiriou, P.; Nikolakopoulou, T.L.; Galatis, B.; Apostolakos, P. Callose and homogalacturonan epitope distribution in stomatal complexes of Zea mays and Vigna sinensis. Protoplasma 2020, 257, 141–156. [Google Scholar] [CrossRef] [PubMed]
  12. Marom, Z.; Shtein, I.; Bar-On, B. Stomatal opening: The role of cell-wall mechanical anisotropy and its analytical relations to the bio-composite characteristics. Front. Plant Sci. 2017, 8, 2061. [Google Scholar] [CrossRef] [PubMed] [Green Version]
  13. Woolfenden, H.C.; Bourdais, G.; Kopischke, M.; Miedes, E.; Molina, A.; Robatzek, S.; Morris, R.J. A computational approach for inferring the cell wall properties that govern guard cell dynamics. Plant J. 2017, 92, 5–18. [Google Scholar] [CrossRef] [PubMed] [Green Version]
  14. Amsbury, S.; Hunt, L.; Elhaddad, N.; Baillie, A.; Lundgren, M.; Verhertbruggen, Y.; Scheller, H.V.; Knox, J.P.; Fleming, A.J.; Gray, J.E. Stomatal function requires pectin de-methyl-esterification of the guard cell wall. Curr. Biol. 2016, 26, 2899–2906. [Google Scholar] [CrossRef] [Green Version]
  15. Rui, Y.; Chen, Y.; Kandemir, B.; Yi, H.; Wang, J.Z.; Puri, V.M.; Anderson, C.T. Balancing strength and flexibility: How the synthesis, organization, and modification of guard cell walls govern stomatal development and dynamics. Front. Plant Sci. 2018, 9, 1202. [Google Scholar] [CrossRef] [Green Version]
  16. Rui, Y.; Chen, Y.; Yi, H.; Purzycki, T.; Puri, V.M.; Anderson, C.T. Synergistic pectin degradation and guard cell pressurization underlie stomatal pore formation. Plant Physiol. 2019, 180, 66–77. [Google Scholar] [CrossRef] [Green Version]
  17. Beris, D.; Podia, V.; Dervisi, I.; Kapolas, G.; Isaioglou, I.; Tsamadou, V.; Pikoula, L.; Rovoli, M.; Vallianou, A.; Roussis, A.; et al. RNAi silencing of the Arabidopsis thaliana ULCS1 gene results in pleiotropic phenotypes during plant growth and development. Int. J. Dev. Biol. 2021; in press. [Google Scholar] [CrossRef]
  18. Endo, H.; Torii, K.U. Stomatal development and perspectives toward agricultural improvement. Cold Spring Harb. Perspect. Biol. 2019, 11, a034660. [Google Scholar] [CrossRef] [Green Version]
  19. Komis, G.; Šamajová, O.; Ovečka, M.; Šamaj, J. Cell and Developmental Biology of Plant Mitogen-Activated Protein Kinases. Annu. Rev. Plant Biol. 2018, 69, 237–265. [Google Scholar] [CrossRef]
  20. Samakovli, D.; Komis, G.; Šamaj, J. Uncovering the Genetic Networks Driving Stomatal Lineage Development. Mol. Plant 2020, 10, 1355–1357. [Google Scholar] [CrossRef]
  21. Giannoutsou, E.; Sotiriou, P.; Apostolakos, P.; Galatis, B. Early local differentiation of the cell wall matrix defines the contact sites in lobed mesophyll cells of Zea mays. Ann. Bot. 2013, 112, 1067–1081. [Google Scholar] [CrossRef] [Green Version]
  22. Zhang, L.; McEvoy, D.; Le, Y.; Ambrose, C. Live imaging of microtubule organization, cell expansion, and intercellular space formation in Arabidopsis leaf spongy mesophyll cells. Plant Cell 2021, 33, 623–641. [Google Scholar] [CrossRef] [PubMed]
  23. Sapala, A.; Runions, A.; Routier-Kierzkowska, A.L.; Gupta, M.D.; Hong, L.; Hofhuis, H.; Verger, S.; Mosca, G.; Li, C.B.; Hay, A.; et al. Why plants make puzzle cells, and how their shape emerges. eLife 2018, 7, 1–32. [Google Scholar] [CrossRef] [PubMed]
  24. Woolfenden, H.C.; Baillie, A.L.; Gray, J.E.; Hobbs, J.K.; Morris, R.J.; Fleming, A.J. Models and mechanisms of stomatal mechanics. Trends Plant Sci. 2018, 23, 822–832. [Google Scholar] [CrossRef] [PubMed]
  25. Rui, Y.; Anderson, C.T. Functional analysis of cellulose and xyloglucan in the walls of stomatal guard cells of Arabidopsis. Plant Physiol. 2016, 170, 1398–1419. [Google Scholar] [CrossRef] [Green Version]
  26. Rui, Y.; Xiao, C.; Yi, H.; Kandemir, B.; Wang, J.Z.; Puri, V.M.; Anderson, C.T. Polygalacturonase involved in expansion3: Functions in seedling development, rosette growth, and stomatal dynamics in Arabidopsis thaliana. Plant Cell 2017, 29, 2413–2432. [Google Scholar] [CrossRef] [Green Version]
  27. Carter, R.; Woolfenden, H.; Baillie, A.; Amsbury, S.; Carroll, S.; Healicon, E.; Sovatzoglou, S.; Braybrook, S.; Gray, J.E.; Hobbs, J.; et al. Stomatal opening involves polar, not radial, stiffening of guard cells. Curr. Biol. 2017, 27, 2974–2983.e2. [Google Scholar] [CrossRef] [Green Version]
  28. Apostolakos, P.; Livanos, P.; Galatis, B. Microtubule involvement in the deposition of radial fibrillar callose arrays in stomata of the fern Asplenium nidus L. Cell Motil. Cytoskel. 2009, 66, 342–349. [Google Scholar] [CrossRef]
  29. Apostolakos, P.; Livanos, P.; Nikolakopoulou, T.L.; Galatis, B. The role of callose in guard cell wall differentiation and stomatal pore formation in the fern Asplenium nidus L. Ann. Bot. 2009, 104, 1373–1387. [Google Scholar] [CrossRef] [Green Version]
  30. Apostolakos, P.; Livanos, P.; Nikolakopoulou, T.L.; Galatis, B. Callose implication in stomatal opening and closure in the fern Asplenium nidus. New Phytol. 2010, 186, 623–635. [Google Scholar] [CrossRef]
  31. Galatis, B.; Apostolakos, P. A new callose function: Involvement in differentiation and function of fern stomatal complexes. Plant Sign Behav. 2010, 5, 1359–1364. [Google Scholar] [CrossRef] [Green Version]
  32. Paraskevopoulou, D.; Anezakis, N.; Giannoutsou, E.; Sotiriou, P.; Adamakis, I.-D.S. The Stomata of the Katanin Mutants, fra2, lue1 and bot1. Biol. Life Sci. Forum 2021, 4, 30. [Google Scholar] [CrossRef]
Figure 1. Molecular analysis of pme2 and pme3 T-DNA insertion lines (AC) and phylogenetic analysis of PMEs (D,E). (A) Schematic map of the AtPME2 and AtPME3 genes. Exons (black boxes), introns (lines), untranslated regions (white boxes) and the locations of the T-DNA insertions (arrowheads) in each gene are indicated. (B) PCR genotyping of progeny plants for each T-DNA insertion line identified five homozygous lines for PME2 (pme2_P2-1, pme2_P2-2, pme2_SLK1, pme2_SLK2, pme2_SLK3) and five homozygous lines for PME3 (pme3_P1-1, pme3_P1-2, pme3_GB1, pme3_GB2, pme3_GB3). (C) Semiquantitative RT-PCR showing PME2 and PME3 transcript abundance in the homozygous pme2 and pme3 mutants, respectively, and in WT plants. PME transcripts were undetectable in all homozygous T-DNA insertion lines. Expression of the GAPDH gene was monitored as a control. (D,E): Phylogenetic relationship of the PME2 and PME3 proteins with selected PME homologs from Arabidopsis thaliana. The tree was constructed, after Clustal Omega alignment of the full-length protein sequences, by using the neighbor-joining method of the PHYLIP software. Numbers indicate bootstrap support values from 1000 replicates. Accession numbers of the protein sequences used are listed in Appendix A Table A2.
Blsf 11 00036 g001
Figure 2. Macroscopic phenotypes of pme2, pme3 and pme2 pme3 mutants grown on soil for 30 d (AE) and on MS agar for 7 d (FJ). Germination indexes of the mutants pme2 and pme2 pme3 (K) and of pme3 mutants (L) when compared to Col-0. In (C,D), pme3 mutants exhibit retarded growth when compared to Col-0, while in (F,G,J), pme3 and pme2 pme3 mutants display a longer root than that of Col-0. Germination curves, in (K,L), show that seeds germinate earlier for all mutants examined.
Blsf 11 00036 g002
Figure 3. Cotyledons of Col-0 and pme2 pme3 mutant as seen in DIC optics. Epidermis of cotyledons of Col-0 (A) and pme2pme3 mutant (B), measurement of the length and width of various cotyledons as well as length/width ratio depicted in (C). Pavement cells and stomata in 7d cotyledons of Col-0 (D) and pme2 pme3 mutant (E), where pavement cells unable to form lobes can be observed. In (F,G), stomata clustering appearing frequently can be observed, where a pair of guard cells or three (circle in (F)) or even four (circle in (G)) guard cells are formed. In (H), the number of mature and young stomata, as well as the number of meristemoids in 5d grown cotyledons is depicted. Asterisks mark the stoma, while circles mark the clusters. Bars: 100 μm (A,B), 20 μm (DG).
Blsf 11 00036 g003
Figure 4. Aniline staining in Col-0 (A), pme2pme3 (CH), pme3 (I,J) and pme2 (K) epidermis of cotyledons. (B) Stomatal length/width ratio is depicted, showing pme2pme3 stomata being wider than those of Col-0. Arrows point to connections between neighboring cell walls (C,F,G), while arrow in (D) points to ledges of the periclinal cell wall. In (H), an abnormal opening displaying callose at the sites delimiting the stomatal pore is shown, while the pointed arrow in I and the arrowhead in (J) mark a delay in the pore formation. Arrowhead in (K) point to irregular stomatal pore opening. Asterisks mark the stomata. Scale bars: 20 μm for (A,C,D,H); 10 μm for (FK) and insets in (D,E).
Blsf 11 00036 g004
Figure 5. Mature A. thaliana stomata following LM20, LM19, JIM5 and 2F4 homogalacturonans epitope localization. All pictures taken from paradermal hand-made leaf sections. Localization of the LM20-HG epitope in surface optical sections of Col-0 (A,B), pme2 pme3 (C,D) and pme2-1 (E) and as seen in DIC optics (insets in (AE)) respectively. Localization of the LM19-HG epitope in surface optical sections of Col-0 (F,G), pme2 pme3 (H) and of JIM5-HG epitope in pme 3-1 mutant as seen in DIC optics (H) respectively. Localization of the 2F4 epitope in surface optical sections of Col-0 (J,K), pme2 pme3 in L, pme3-1 in M and pme2-1 in N and as seen in DIC optics (inset in (J,K)) respectively. Arrows in (A,B) show immunodetection at the ledges of the periclinal cell walls, while brackets in F show fluorescent signal at the thickenings observed at the junction sites of the dorsal cell walls. Asterisks mark stomata, while arrowheads point to the junction sites. Bar: 20 μm in (A,FI,K,L) and 10 μm in (BF,J,M,N) and insets.
Blsf 11 00036 g005
Publisher’s Note: MDPI stays neutral with regard to jurisdictional claims in published maps and institutional affiliations.

