
Nomophobia Levels in Turkish High School Students: Variations by Gender, Physical Activity, Grade Level and Smartphone Use

 , ,
, ,  ,
,  , and
, and
Abstract
1. Introduction
- Does the gender variable affect the level of nomophobia?
- Does the participation in physical activity affect the level of nomophobia?
- Does the high school type affect the level of nomophobia?
- Does the grade level affect the level of nomophobia?
- Does the smartphone usage affect the level of nomophobia?
2. Materials and Methods
2.1. Research Design and Participants’ Selection
2.2. Measures
2.3. Ethical Statements
2.4. Data Collection Procedures
2.5. Statistical Analysis
3. Results
3.1. Normality Assumption
3.2. Variation in Nomophobia Levels by Gender
3.3. Nomophobia Level Variations by Physical Activity Participation
3.4. Nomophobia Levels According to High School Type
3.5. Nomophobia Levels According to High School Students’ Grade Level
3.6. Nomophobia Levels by Duration of Smartphone Use
4. Discussion
4.1. Strengths and Limitations
4.2. Practical Implications
5. Conclusions
Author Contributions
Funding
Institutional Review Board Statement
Informed Consent Statement
Data Availability Statement
Acknowledgments
Conflicts of Interest
Appendix A
References
- Adnan, M., & Gezgin, D. M. (2016). A modern phobia: Prevalence of nomophobia among college students. Ankara University Journal of Faculty of Educational Sciences (JFES), 49(1), 141–158. [Google Scholar]
- Agbangba, C. E., Aide, E. S., Honfo, H., & Kakai, R. G. (2024). On the use of post-hoc tests in environmental and biological sciences: A critical review. Heliyon, 10(3), e25131. [Google Scholar] [CrossRef]
- Al Battashi, N., Al Omari, O., Sawalha, M., Al Maktoumi, S., Alsuleitini, A., & Al Qadire, M. (2021). The relationship between smartphone use, insomnia, stress, and anxiety among university students: A cross-sectional study. Clinical Nursing Research, 30(6), 734–740. [Google Scholar] [CrossRef] [PubMed]
- AlMarzooqi, M. A., Alhaj, O. A., Alrasheed, M. M., Helmy, M., Trabelsi, K., Ebrahim, A., Hattab, S., Jahrami, H. A., & Ben Saad, H. (2022). Symptoms of nomophobia, psychological aspects, ınsomnia and physical activity: A cross-sectional study of ESports Players in Saudi Arabia. Healthcare, 10(2), 257. [Google Scholar] [CrossRef] [PubMed]
- Arslan, H., Tozkoparan, S. B., & Kurt, A. A. (2019). Öğretmenlerde mobil telefon yoksunluğu korkusunun ve gelişmeleri kaçırma korkusunun incelenmesi. Erzincan Üniversitesi Eğitim Fakültesi Dergisi, 21(3), 237–256. [Google Scholar] [CrossRef]
- Association, W. M. (2025). World Medical Association Declaration of Helsinki: Ethical principles for medical research involving human participants. JAMA, 333(1), 71–74. [Google Scholar] [CrossRef]
- Atıcı, A. R., & Erbaş, M. K. (2021). COVİD-19 sürecinde spor bilimleri fakültesi öğrencilerinin nomofobi düzeylerinin incelenmesi. Available online: https://acikerisim.aksaray.edu.tr/items/bfc93b80-3e8c-4269-b497-91532a160d70 (accessed on 10 April 2025).
- Aygün, A., Ulu, E., & Akça, R. P. (2024). Nomofobi Üzerine Bir Araştırma: Lise Öğrencileri Örneği. Socıal Scıences Studıes Journal (SSSJournal), 9(116), 8649–8656. [Google Scholar] [CrossRef]
- Black, R., Walsh, L., Waite, C., Collin, P., Third, A., & Idriss, S. (2022). In their own words: 41 stories of young people’s digital citizenship. Learning, Media and Technology, 47(4), 524–536. [Google Scholar] [CrossRef]
- Bragazzi, N. L., & Del Puente, G. (2014). A proposal for including nomophobia in the new DSM-V. Psychology Research and Behavior Management, 7, 155–160. [Google Scholar] [CrossRef]
- Brailovskaia, J., Delveaux, J., John, J., Wicker, V., Noveski, A., Kim, S., Schillack, H., & Margraf, J. (2023). Finding the “sweet spot” of smartphone use: Reduction or abstinence to increase well-being and healthy lifestyle?! An experimental intervention study. Journal of Experimental Psychology: Applied, 29(1), 149–161. [Google Scholar] [CrossRef]
- Buke, M., Egesoy, H., & Unver, F. (2021). The effect of smartphone addiction on physical activity level in sports science undergraduates. Journal of Bodywork and Movement Therapies, 28, 530–534. [Google Scholar] [CrossRef]
- Cerisola, A. (2017). Impacto negativo de los medios tecnológicos en el neurodesarrollo infantil. Pediátr Panamá, 46, 126–131. [Google Scholar]
- Creswell, J. W. (1994). Research design: Qualitative & quantitative approaches. Sage Publications, Inc. [Google Scholar]
- Çelebi, M., Metin, A., İncedere, F., Aygün, N., Bedir, M., & Özbulut, Ö. (2020). Investigation of relationship between nomophobia and loneliness level: Erciyes university sample. Sciences, 10(2), 315–334. [Google Scholar]
- Çilek, A., Özgüray, Ö., Demircan, S., Özgüray, A., & Demircan, N. (2024). Farklı kademelerde öğrenim gören öğrencilerin nomofobi düzeyleri. Academıc Socıal Resources Journal, 8(47), 2314–2333. [Google Scholar] [CrossRef]
- Daraj, L. R., AlGhareeb, M., Almutawa, Y. M., Trabelsi, K., & Jahrami, H. (2023). Systematic review and meta-analysis of the correlation coefficients between nomophobia and anxiety, smartphone addiction, and insomnia symptoms. Healthcare, 11, 2066. [Google Scholar] [CrossRef]
- Durak, H. Y. (2019). Investigation of nomophobia and smartphone addiction predictors among adolescents in Turkey: Demographic variables and academic performance. The Social Science Journal, 56(4), 492–517. [Google Scholar] [CrossRef]
- Dursun, B., Gerçek, H., & Torlak, M. S. (2024). Üniversite Öğrencilerinde Fiziksel Aktivite Düzeyi ile Nomofobi ve İnternet Bağımlılığı Arasındaki İlişki. Başkent Üniversitesi Sağlık Bilimleri Fakültesi Dergisi, 9(2), 223–235. [Google Scholar]
- Dwyer, R. J., Zhuo, A. X., & Dunn, E. W. (2023). Why do people turn to smartphones during social interactions? Journal of Experimental Social Psychology, 109, 104506. [Google Scholar] [CrossRef]
- Geçgel, H. (2020). Investigation of smartphone addiction levels of Turkish pre-service teachers with regards to various variables. Journal of Language and Linguistic Studies, 16(3), 1415–1442. [Google Scholar] [CrossRef]
- Gonçalves, S., Dias, P., & Correia, A.-P. (2020). Nomophobia and lifestyle: Smartphone use and its relationship to psychopathologies. Computers in Human Behavior Reports, 2, 100025. [Google Scholar] [CrossRef]
- Göktaş, H., & Demirer, V. (2023). LİSE ÖĞRENCİLERİNİN NOMOFOBİ, AKILLI TELEFON BAĞIMLILIĞI VE AKADEMİK BAŞARI DÜZEYLERİ ARASINDAKİ İLİŞKİ. Eğitim Teknolojisi Kuram ve Uygulama, 13(1), 209–232. [Google Scholar] [CrossRef]
- Greenfield, D. N. (1999). Psychological characteristics of compulsive Internet use: A preliminary analysis. Cyberpsychology & Behavior, 2(5), 403–412. [Google Scholar]
- Hällgren, C., & Björk, Å. (2022). Young people’s identities in digital worlds. The International Journal of Information and Learning Technology, 40(1), 49–61. [Google Scholar] [CrossRef]
- Kardos, P., Unoka, Z., Pléh, C., & Soltész, P. (2018). Your mobile phone indeed means your social network: Priming mobile phone activates relationship related concepts. Computers in Human Behavior, 88, 84–88. [Google Scholar] [CrossRef]
- Kim, H. Y. (2013). Statistical notes for clinical researchers: Assessing normal distribution (2) using skewness and kurtosis. Restorative Dentistry & Endodontics, 38(1), 52–54. [Google Scholar] [CrossRef]
- Lee, Y.-K., Chang, C.-T., Lin, Y., & Cheng, Z.-H. (2014). The dark side of smartphone usage: Psychological traits, compulsive behavior and technostress. Computers in Human Behavior, 31, 373–383. [Google Scholar] [CrossRef]
- Lepp, A., Barkley, J. E., & Karpinski, A. C. (2014). The relationship between cell phone use, academic performance, anxiety, and Satisfaction with Life in college students. Computers in Human Behavior, 31, 343–350. [Google Scholar] [CrossRef]
- Le Steunf, A., Page, E., Guillodo, Y., & Saraux, A. (2024). Does reducing smartphone use impact physical activity? PLoS ONE, 19(10), e0311248. [Google Scholar] [CrossRef] [PubMed]
- Liébana-Cabanillas, F., Sánchez-Fernández, J., & Muñoz-Leiva, F. (2014). Antecedents of the adoption of the new mobile payment systems: The moderating effect of age. Computers in Human Behavior, 35, 464–478. [Google Scholar] [CrossRef]
- Lin, Y.-C., & Huang, P.-C. (2025). Digital traps: How technology fuels nomophobia and insomnia in Taiwanese college students. Acta Psychologica, 252, 104674. [Google Scholar] [CrossRef]
- Liu, W., Chen, J.-S., Gan, W. Y., Poon, W. C., Tung, S. E. H., Lee, L. J., Xu, P., Chen, I.-H., Griffiths, M. D., & Lin, C.-Y. (2022). Associations of problematic ınternet use, weight-related self-stigma, and nomophobia with physical activity: Findings from Mainland China, Taiwan, and Malaysia. International Journal of Environmental Research and Public Health, 19(19), 12135. [Google Scholar] [CrossRef]
- Prasad, M., Patthi, B., Singla, A., Gupta, R., Saha, S., Kumar, J. K., Malhi, R., & Pandita, V. (2017). Nomophobia: A cross-sectional study to assess mobile phone usage among dental students. Journal of Clinical and Diagnostic Research: JCDR, 11(2), ZC34–ZC39. [Google Scholar] [CrossRef] [PubMed]
- Precht, L.-M., Mertens, F., Brickau, D. S., Kramm, R. J., Margraf, J., Stirnberg, J., & Brailovskaia, J. (2024). Engaging in physical activity instead of (over)using the smartphone: An experimental investigation of lifestyle interventions to prevent problematic smartphone use and to promote mental health. Journal of Public Health, 32(4), 589–607. [Google Scholar] [CrossRef] [PubMed]
- R Core Team. (2024). R: A language and environment for statistical computing. R Foundation for Statistical Computing. Available online: https://www.R-project.org/ (accessed on 5 May 2025).
- Ruiz-Ruano, A. M., López-Salmerón, M. D., & Puga, J. L. (2020). Evitación experiencial y uso abusivo del smartphone: Un enfoque bayesiano. [Experiential avoidance and excessive smartphone use: A Bayesian approach.]. Adicciones, 32(2), 116–127. [Google Scholar] [CrossRef] [PubMed]
- Salmela-Aro, K., & Motti-Stefanidi, F. (2022). Digital revolution and youth: Consequences for their development and education (Vol. 27). Hogrefe Publishing. [Google Scholar] [CrossRef]
- Sırakaya, M. (2018). Ön Lisans Öğrencilerinin Nomofobi Düzeylerinin Akıllı Telefon Kullanım Durumlarına Göre İncelenmesi. Mersin Üniversitesi Eğitim Fakültesi Dergisi, 14(2), 714–727. [Google Scholar] [CrossRef]
- Srivastava, L. (2005). Mobile phones and the evolution of social behaviour. Behaviour & Information Technology, 24(2), 111–129. [Google Scholar] [CrossRef]
- Takane, Y., Beh, E. J., & Lombardo, R. (2025). A theory of contrasts for modified Freeman–Tukey statistics and its applications to Tukey’s post-hoc tests for contingency tables. Computational Statistics, 40(3), 1423–1446. [Google Scholar] [CrossRef]
- Terzi, H., Ayaz-Alkaya, S., & Köse-Kabakcıoğlu, N. (2024). Nomophobia and eHealth literacy among adolescents: A cross-sectional study. Journal of Pediatric Nursing, 75, 158–163. [Google Scholar] [CrossRef]
- Wickham, H. (2016). ggplot2: Elegant graphics for data analysis. Springer. Available online: https://ggplot2.tidyverse.org/ (accessed on 5 May 2025).
- Wickham, H., François, R., Henry, L., Müller, K., & Vaughan, D. (2023). dplyr: A grammar of data manipulation, (R package version 1.1.3); Available online: https://CRAN.R-project.org/package=dplyr (accessed on 5 May 2025).
- Yildirim, C., & Correia, A.-P. (2015). Exploring the dimensions of nomophobia: Development and validation of a self-reported questionnaire. Computers in Human Behavior, 49, 130–137. [Google Scholar] [CrossRef]
- Yildirim, C., Sumuer, E., Adnan, M., & Yildirim, S. (2016). A growing fear:Prevalence of nomophobia among Turkish college students. Information Development, 32(5), 1322–1331. [Google Scholar] [CrossRef]
- Yılmaz, M., Köse, A., & Doğru, Y. B. (2018). Akıllı Telefondan Yoksun Kalmak: Nomofobi Üzerine Bir Araştırma [Staying away from the smart phone: A research on nomophobia]. AJIT-e: Academic Journal of Information Technology, 9(35), 31–47. [Google Scholar] [CrossRef]

| Variable | N | % | |
|---|---|---|---|
| Gender | Male | 425 | 48.1 |
| Female | 459 | 51.9 | |
| Participation in Physical Activity | Yes | 371 | 42.0 |
| No | 513 | 58.0 | |
| High School Type | Science High School | 388 | 43.9 |
| Anatolian High School | 496 | 56.1 | |
| Grade Level | 9. class | 250 | 28.3 |
| 10. class | 205 | 23.2 | |
| 11. class | 209 | 23.6 | |
| 12. class | 220 | 24.9 | |
| Smartphone Usage Time | Less than 1 year | 22 | 2.5 |
| 1–2 years | 87 | 9.8 | |
| 3–4 years | 296 | 33.5 | |
| 5 years and above | 479 | 54.2 |
| Sub-Dimension | Mean | Sd | Skewness | Kurtosis |
|---|---|---|---|---|
| Participation in physical activity | 1.58 | 0.494 | −0.326 | −1.136 |
| High school type | 1.56 | 0.496 | −0.247 | −0.944 |
| Grade level | 2.45 | 1.14 | 0.052 | −1.420 |
| Smartphone usage time | 3.39 | 0.765 | 0.431 | 0.164 |
| Not being able to access information | 15.7 | 5.84 | −0.074 | −0.760 |
| Not being able to communicate | 25.6 | 6.40 | −0.336 | −0.733 |
| Losing connectedness | 18.6 | 6.92 | 0.146 | −0.639 |
| Giving up convenience | 13.0 | 6.88 | 0.821 | 0.095 |
| Nomophobia total | 72.9 | 22.9 | 0.077 | −0.333 |
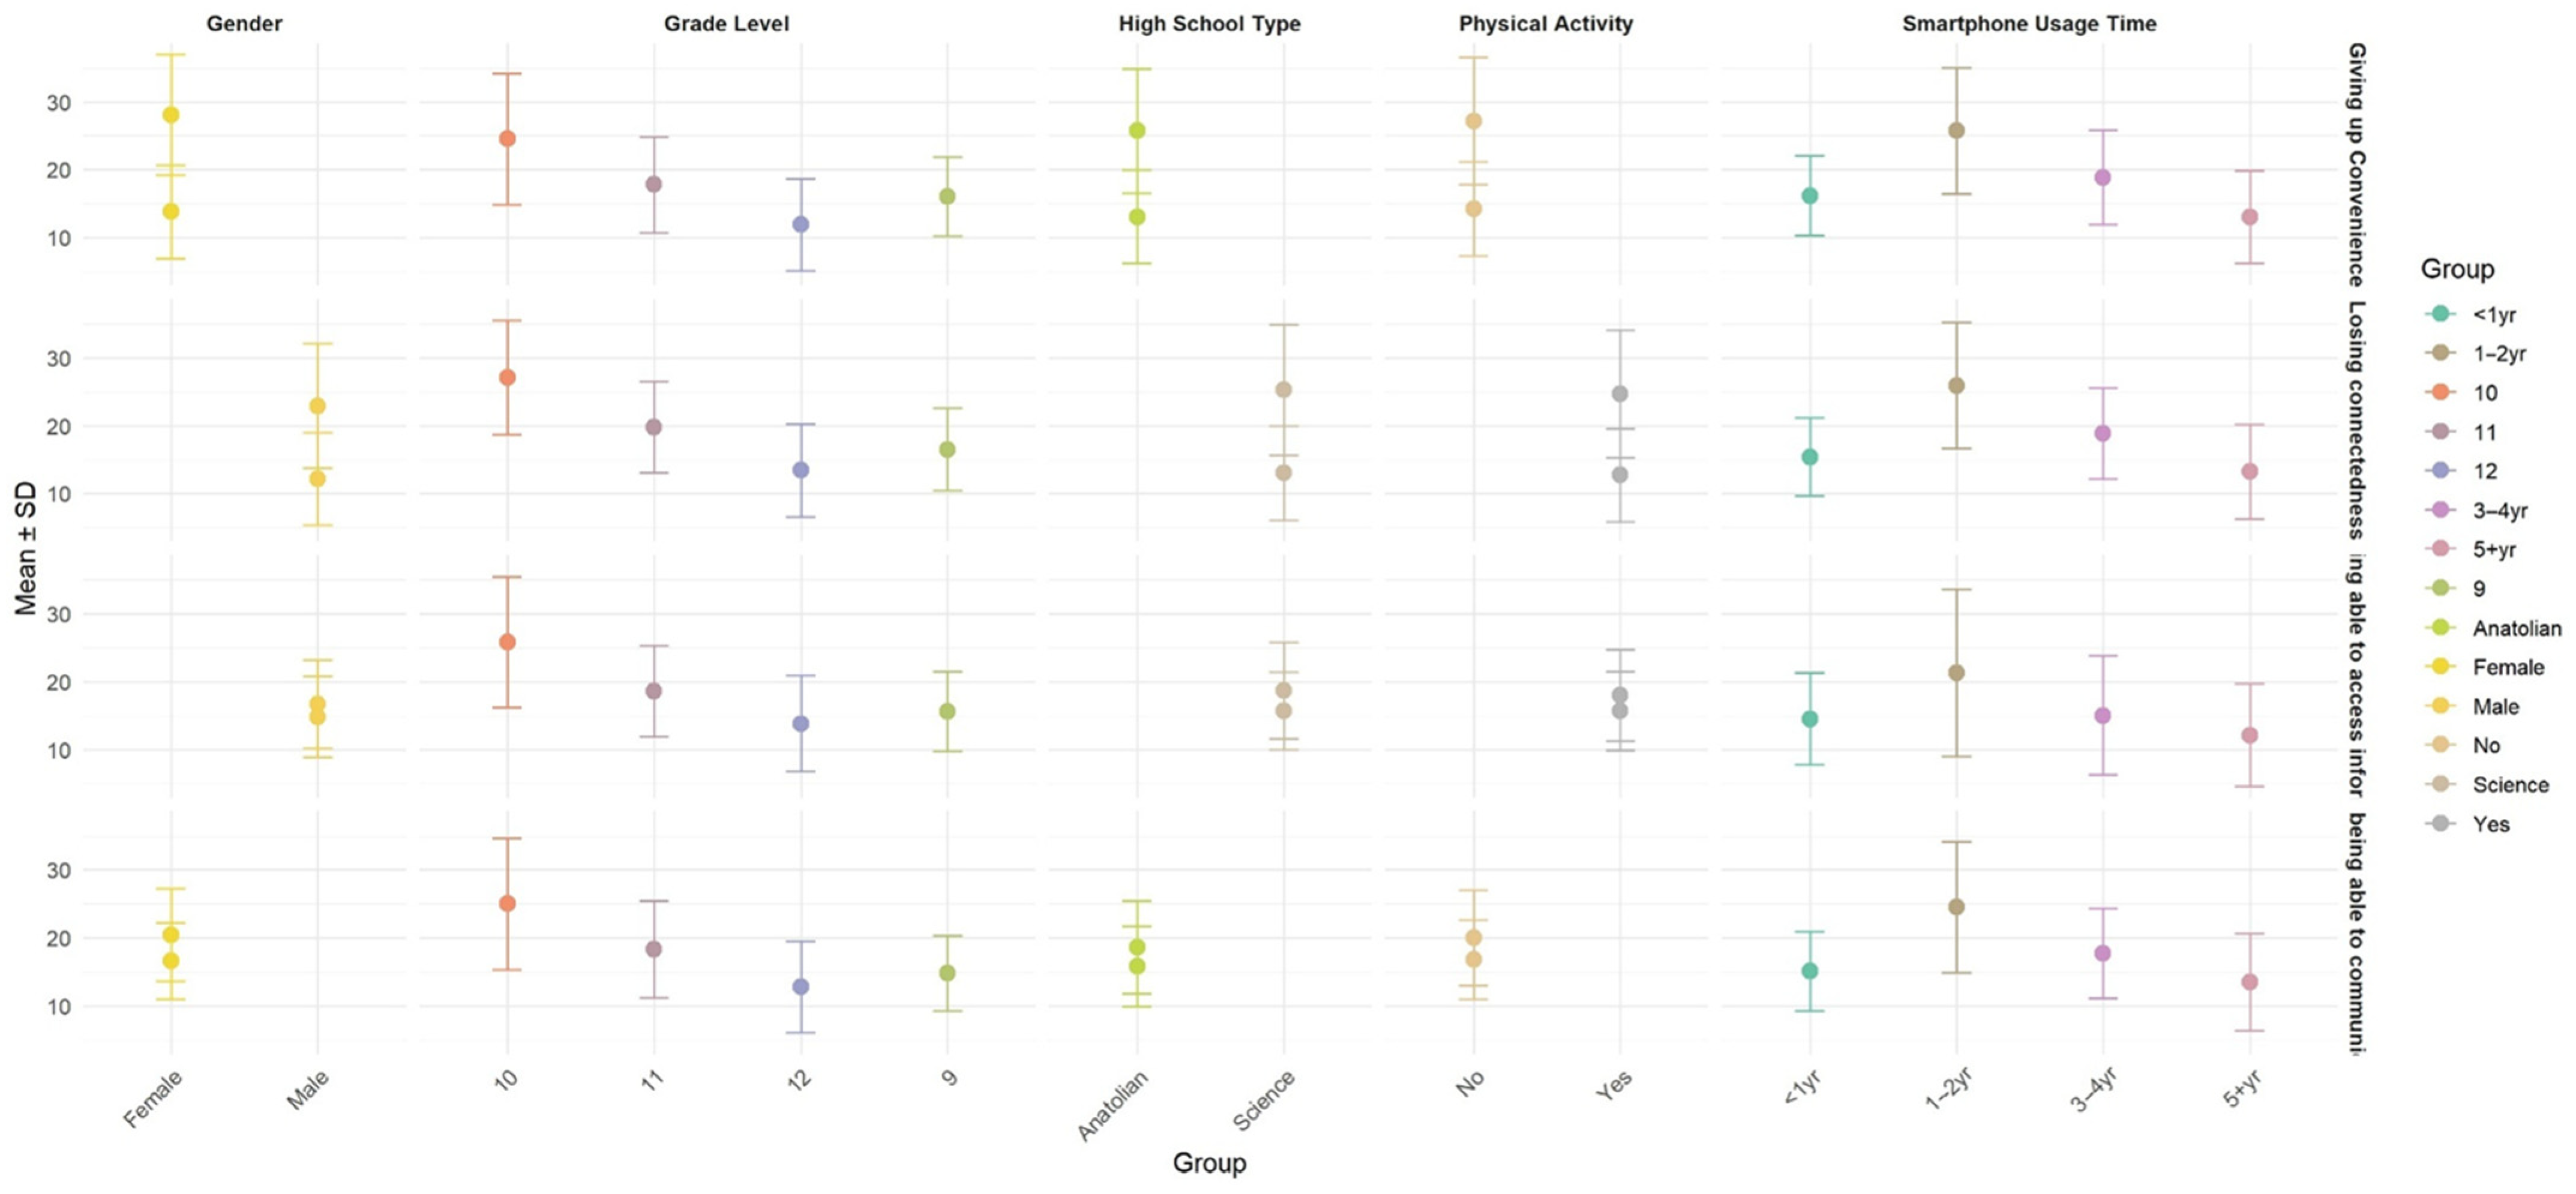
| Sub-Dimension | Gender | N | X ± SS | t | p |
|---|---|---|---|---|---|
| Not being able to access information | Male | 425 | 14.8 ± 5.97 | −4.494 | 0.00 * |
| Female | 459 | 16.6 ± 5.59 | |||
| Not being able to communicate | Male | 425 | 22.9 ± 9.19 | −8.571 | 0.00 * |
| Female | 459 | 28.1 ± 8.90 | |||
| Losing connectedness | Male | 425 | 16.7 ± 6.52 | −8.232 | 0.00 * |
| Female | 459 | 20.4 ± 6.80 | |||
| Giving up convenience | Male | 425 | 12.1 ± 6.82 | −3.643 | 0.00 * |
| Female | 459 | 13.8 ± 6.85 | |||
| Nomophobia total | Male | 425 | 66.5 ± 22.2 | −8.286 | 0.00 * |
| Female | 459 | 79.0 ± 21.9 |
| Sub-Dimension | Participation in Physical Activity | N | X ± SS | t | p |
|---|---|---|---|---|---|
| Not being able to access information | Yes | 371 | 15.7 ± 5.83 | −0.212 | 0.032 * |
| No | 513 | 16.8 ± 5.84 | |||
| Not being able to communicate | Yes | 371 | 24.7 ± 9.44 | −2.246 | 0.025 * |
| No | 513 | 27.2 ± 9.34 | |||
| Losing connectedness | Yes | 371 | 18.0 ± 6.75 | −2.121 | 0.034 * |
| No | 513 | 20.0 ± 7.01 | |||
| Giving up convenience | Yes | 371 | 12.7 ± 6.88 | −1.038 | 0.017 * |
| No | 513 | 14.2 ± 6.89 | |||
| Nomophobia total | Yes | 371 | 71.2 ± 23.3 | −1.925 | 0.045 * |
| No | 513 | 78.2 ± 22.6 |
| Sub-Dimension | High School Type | N | X ± SS | t | p |
|---|---|---|---|---|---|
| Not being able to access information | Science High School | 388 | 15.7 ± 5.72 | −0.166 | 0.408 |
| Anatolian High School | 496 | 15.8 ± 5.93 | |||
| Not being able to communicate | Science High School | 388 | 25.3 ± 9.64 | −0.647 | 0.312 |
| Anatolian High School | 496 | 25.7 ± 9.21 | |||
| Losing connectedness | Science High School | 388 | 18.67 ± 7.11 | 0.099 | 0.518 |
| Anatolian High School | 496 | 18.62 ± 6.77 | |||
| Giving up convenience | Science High School | 388 | 13.01 ± 6.97 | −0.105 | 0.226 |
| Anatolian High School | 496 | 13.06 ± 6.83 | |||
| Nomophobia total | Science High School | 388 | 72.8 ± 24.0 | −0.309 | 0.760 |
| Anatolian High School | 496 | 73.7 ± 22.1 |
| Sub-Dimension | Grade Level | N | X ± SS | F | p | Tukey |
|---|---|---|---|---|---|---|
| Not being able to access information | 9. class | 250 | 15.6 ± 5.87 | 3.077 | 0.027 * | b–c |
| 10. class | 205 | 14.8 ± 5.49 | ||||
| 11. class | 209 | 16.5 ± 6.08 | ||||
| 12. class | 220 | 16.0 ± 5.80 | ||||
| Not being able to communicate | 9. class | 250 | 25.8 ± 9.60 | 3.016 | 0.029 * | c–d |
| 10. class | 205 | 25.0 ± 9.66 | ||||
| 11. class | 209 | 27.1 ± 8.43 | ||||
| 12. class | 220 | 24.5 ± 9.67 | ||||
| Losing connectedness | 9. class | 250 | 18.6 ± 6.71 | 3.201 | 0.023 * | c–d |
| 10. class | 205 | 18.3 ± 7.09 | ||||
| 11. class | 209 | 19.8 ± 6.73 | ||||
| 12. class | 220 | 17.8 ± 7.05 | ||||
| Giving up convenience | 9. class | 250 | 13.8 ± 7.07 | 3.428 | 0.017 * | a–d c–d |
| 10. class | 205 | 12.8 ± 6.71 | ||||
| 11. class | 209 | 13.4 ± 6.83 | ||||
| 12. class | 220 | 11.9 ± 6.77 | ||||
| Nomophobia total | 9. class | 250 | 74.0 ± 22.8 | 3.748 | 0.011 * | a–b a–d b–c c–d |
| 10. class | 205 | 71.0 ± 23.1 | ||||
| 11. class | 209 | 76.9 ± 22.1 | ||||
| 12. class | 220 | 70.3 ± 23.2 |
| Sub-Dimension | Smartphone Usage Time | N | X ± SS | F | p | Tukey |
|---|---|---|---|---|---|---|
| Not being able to access information | Less than 1 year | 22 | 14.5 ± 6.78 | 1.532 | 0.205 | |
| 1–2 years | 87 | 15.12 ± 5.78 | ||||
| 3–4 years | 296 | 15.4 ± 5.72 | ||||
| 5 years and above | 479 | 16.13 ± 5.86 | ||||
| Not being able to communicate | Less than 1 year | 22 | 21.3 ± 12.3 | 2.112 | 0.097 | |
| 1–2 years | 87 | 24.5 ± 9.61 | ||||
| 3–4 years | 296 | 25.9 ± 9.29 | ||||
| 5 years and above | 479 | 25.7 ± 9.25 | ||||
| Losing connectedness | Less than 1 year | 22 | 15.0 ± 8.79 | 2.794 | 0.039 * | a–d |
| 1–2 years | 87 | 17.7 ± 6.63 | ||||
| 3–4 years | 296 | 18.82 ± 6.71 | ||||
| 5 years and above | 479 | 18.87 ± 6.96 | ||||
| Giving up Convenience | Less than 1 year | 22 | 12.1 ± 7.58 | 0.209 | 0.890 | |
| 1–2 years | 87 | 13.5 ± 7.14 | ||||
| 3–4 years | 296 | 13.2 ± 6.94 | ||||
| 5 years and above | 479 | 13.0 ± 6.79 | ||||
| Nomophobia Total | Less than 1 year | 22 | 62.9 ± 31.7 | 1.861 | 0.135 | |
| 1–2 years | 87 | 70.8 ± 23.3 | ||||
| 3–4 years | 296 | 73.3 ± 22.5 | ||||
| 5 years and above | 479 | 73.7 ± 22.9 |
Disclaimer/Publisher’s Note: The statements, opinions and data contained in all publications are solely those of the individual author(s) and contributor(s) and not of MDPI and/or the editor(s). MDPI and/or the editor(s) disclaim responsibility for any injury to people or property resulting from any ideas, methods, instructions or products referred to in the content. |
© 2025 by the authors. Licensee MDPI, Basel, Switzerland. This article is an open access article distributed under the terms and conditions of the Creative Commons Attribution (CC BY) license (https://creativecommons.org/licenses/by/4.0/).
Share and Cite
Çakto, P.; Görgüt, İ.; Tannoubi, A.; Agyei, M.; Srem-Sai, M.; Hagan, J.E.; Yüksel, O.; Demir, O. Nomophobia Levels in Turkish High School Students: Variations by Gender, Physical Activity, Grade Level and Smartphone Use. Youth 2025, 5, 78. https://doi.org/10.3390/youth5030078
Çakto P, Görgüt İ, Tannoubi A, Agyei M, Srem-Sai M, Hagan JE, Yüksel O, Demir O. Nomophobia Levels in Turkish High School Students: Variations by Gender, Physical Activity, Grade Level and Smartphone Use. Youth. 2025; 5(3):78. https://doi.org/10.3390/youth5030078
Chicago/Turabian StyleÇakto, Piyami, İlyas Görgüt, Amayra Tannoubi, Michael Agyei, Medina Srem-Sai, John Elvis Hagan, Oğuzhan Yüksel, and Orhan Demir. 2025. "Nomophobia Levels in Turkish High School Students: Variations by Gender, Physical Activity, Grade Level and Smartphone Use" Youth 5, no. 3: 78. https://doi.org/10.3390/youth5030078
APA StyleÇakto, P., Görgüt, İ., Tannoubi, A., Agyei, M., Srem-Sai, M., Hagan, J. E., Yüksel, O., & Demir, O. (2025). Nomophobia Levels in Turkish High School Students: Variations by Gender, Physical Activity, Grade Level and Smartphone Use. Youth, 5(3), 78. https://doi.org/10.3390/youth5030078