Abstract
South Africa continues to be marked by high youth unemployment. This paper investigates youth labor market perspectives in northern South Africa in the light of data from the Livelihoods, Religion and Youth Survey. In addition to standard explanatory variabless of labor market outcomes, it explores whether the ‘soft’ factors of social capital and religion might contribute to youth’s labor market success. Methodologically, the study draws on descriptive statistics and the estimation of linear probability models. The results indicate that religious social capital goes along with improved labor market success, while there is no indication in the data that (non-religious) social capital or religiosity are positively correlated with labor market performance among the youth in the sample. The social capital created in religious communities seems to contribute to youth labor market success. Further research should investigate how these structures can serve as models for the improvement of government interventions aiming at improving youth labor market outcomes. Moreover, the results are in line with the findings of previous research on spatial mismatches in the labor market and highlight the need for job creation, particularly in rural areas.
1. Introduction
Youth labor market perspectives remain a crucial concern in South Africa. Statistics South Africa’s most recent labor force survey shows a rate of young people between the ages of 15 and 34 who are not in education, employment, or training (NEET) of 43% (In the South African policy context, youth is defined as the age group from 15 to 34 years [1]. Hence, this age group is used in this paper). When including discouraged work-seekers, unemployment is at 74.1% in the age group of 15 to 24 and 49.8% in the age group of 25 to 34 [2] (p. 48). Particularly in rural and historically disadvantaged former homeland areas, the figures are even higher. There is also a stark contrast between previously advantaged and previously disadvantaged population groups: while the expanded unemployment rate of ‘White’ persons is at 13.0%, for the ‘Black’ population majority, the rate is at 47.4% [2] (pp. 46–47).
Various policy initiatives have been launched to increase youth employment, such as tax incentives for the employment of young people, financial support to youth business and small business initiatives, internships in the public sector, and the increased inclusion of youth in public work programs [1]. However, the policies implemented so far have not decreased youth unemployment substantially [3]. Unemployment in South Africa seems to have structural causes [4,5], which the policies have not addressed.
Various studies have investigated the causes of youth unemployment. There is a lively discussion in the literature on the role of the social grant system, particularly the effect of child and old-age grants on young people’s labor market supply [6]. Two further key issues are spatial mismatches [7] and mismatches between young people’s qualifications and the skills demanded in the labor market [8].
This paper contributes to the literature by investigating youth labor market performance in the predominantly Setswana- and Sepedi-speaking regions of the Limpopo, Northwest, Gauteng, and Mpumalanga provinces of South Africa. I use a novel dataset, the Livelihoods, Religion and Youth Survey, a comprehensive household survey led by the author in 2016 for the purposes of this and other studies. The survey covers rural, urban, and semi-urban (township) areas. Due to its focus on areas with a high percentage of Sepedi and Setswana speakers, various former homeland areas are covered, and the majority of the sample is from previously disadvantaged population groups. The data shows only 34% of out-of-school youth aged 15 to 34 to be active in the formal sector, either through formal employment or tertiary education or training. Only 18% are engaged in informal labor market activity. This leaves nearly half of the youth unemployed or economically inactive.
In this context, the aim of this paper is to explore what factors and strategies available to youth contribute to success in the labor market in economically weak regions of South Africa. In addition to standard explanatory variables of labor market performance, such as educational and sociodemographic factors, the article focuses on the receipt of social grants in the household, rural-urban migration and the ‘soft’ factors of social capital and religion. While there is some evidence on the effects of social grants on youth labor supply and migration decisions [6,9], the roles of social capital and religion have, to the best of my knowledge, thus far not been taken into account in economic research on youth labor market performance in South Africa.
The concept of social capital employed in this paper relies on Portes [10], who—relying on Bourdieu and Coleman—defines it as follows: “Social capital stands for the ability of actors to secure benefits by virtue of membership in social networks or other social structures.” As Maselko et al. [11] point out, “religious communities, which are based on longstanding social relationships within a context of shared beliefs, represent a social space that may be particularly salient as repositories of social capital.” Hence, this article takes into account a specific form of social capital, religious social capital, which by extension of Portes’ aforementioned definition, is here conceptualized as the ability of actors to secure benefits by virtue of membership in religious networks or other religious structures. In addition to religious social capital, religion is furthermore operationalized as individual religiosity using Huber’s Centrality of Religion Scale [12].
The empirical approach is the estimation of probit models of different labor market outcomes, such as being in formal employment and being in informal (self) employment. I control for a range of covariates relating to sociodemographic factors, such as education, migration, rural or urban residence, social grant receipt, social capital, and religion.
The results substantiate the findings of the literature both on skills mismatches and spatial mismatches. Tertiary education qualifications are not found to be correlated with better labor market outcomes, while urban residence is a strong predictor of working, both in the formal and the informal sector. The receipt of old-age grants in a household goes along with a lower probability of youth engagement in formal and informal labor market activity. Moreover, religious social capital seems to have a positive effect on youth labor market outcomes.
The remainder of this paper is organized as follows. Section 2 outlines key choices faced by out-of-school youth and the literature on the determinants of youth labor market success in South Africa. Section 3 introduces the Livelihoods, Religion and Youth Survey and provides a descriptive analysis. Section 4 presents the econometric analysis. The results are discussed in Section 5.
2. Literature Review
Upon leaving secondary school, young adults are faced with numerous choices that have implications for their success in the labor market. Whether to look for employment in the formal labor market or to rather focus on informal income-generating activities is a first key choice. The South African labor market has a dual nature [13], in the words of South Africa’s former president Thabo Mbeki, divided into a ‘first world economy’ and a ‘third world economy’ [14]. The upper 10% of the working population earns wages at the levels of high-income countries from relatively secure formal employment. While the formal sector provides stable and comparatively high income, it is unable to absorb large parts of the population. Wages at the lower end of the distribution are at the levels of the poorest countries in the world, and employment is informal and insecure [15]. In the literature on the South African informal sector, it is, hence, generally accepted that informal economic activity, consisting mostly of microbusinesses, is only a second-best option to formal-sector economic activity [16,17]. This is unsurprising considering that half of the informal businesses had a turnover of about USD 108 per month, and only about 10% made monthly profits of over USD 430 [18].
A second set of choices relates to tertiary education. Tertiary education substantially improves the chances of being in formal-sector employment. While the decision to engage in tertiary education is dichotomous, important subdecisions have to be made regarding the subject of study and the type of qualification to enroll for (learnership, certificate, diploma, or degree), as well as the specific educational institution to be attended. While tertiary education increases the chances of finding formal-sector employment, it is an expensive investment due to the high direct (tuition fees) and indirect costs involved. Moreover, there are opportunity costs due to the potential foregone income because of not being able to work during the time spent studying. Furthermore, having a tertiary qualification is no guarantee for finding a job. Particularly in rural areas, unemployment rates among graduates of tertiary educational institutions are high. Makhuduthamaga, one of the municipalities covered by the present dataset, has an unemployment rate of 28.5% among those that have graduated from a tertiary institution, as pointed out in a Sunday Times report on 24 April 2016. There is evidence of skills mismatches. Mncayi and Dunga [8] show that students’ subjects of studies have a significant impact on the length of their unemployment after graduation. They find graduates the humanities, especially majors in public management, public administration, and politics, were found to be unemployed longer after graduation and more likely to be underemployed once finding labor than those graduating in the sciences, especially accounting, math, education, and health, which show the shortest waiting period for labor after graduation. In a similar vein, Yu [3] finds that the skills obtained by youths do not match industries’ needs and that the quality of education, lack of experience, and expectations of the youths were the main causes of youth unemployment. Oluwajodu et al. [19] show that skills, educational institution, and the differences in expectations of employers and prospective employees to be major factors for unemployment among university graduates.
A third set of choices relates to migration. Particularly in rural areas where employment opportunities are relatively scarce, individuals are faced with the choice of whether to relocate elsewhere, to a regional urban center (such as the provincial capital) or to one of the large, metropolitan areas constituting the economic hubs of the country (Johannesburg/Pretoria, Durban, or Cape Town). Fintel and Fourie [20] additionally point to persistent institutional weaknesses of former homeland areas, causing people to out-migrate from these areas, particularly to urban centers. Migration, however, is costly, and household financial constraints play a role in this decision. Yu [7] finds evidence for spatial mismatches, which extenuate previously disadvantaged population groups. His study showed that poverty, lack of mobility, and high unemployment in the residing area, in addition to the high cost of a job search, are the major factors discouraging youth from actively looking for employment. The impact of social grants on labor supply is studied by Ardington et al. [9]. The authors find young men to be more likely to migrate for work opportunities when someone in their household receives an old-age pension. The article shows that a relaxation of the financial constraints of a household allows young men with a secondary school to engage in a relatively costly job search far away from home.
Moreover, discrimination seems to persist in the South African labor market. Baldry [21] points out that social factors such as ‘race’, socio-economic status, and year of graduation had a major impact on graduates’ unemployment, while factors such as field of study, career guidance, or marks obtained are found insignificant for employment. ‘Race’ is the strongest factor for employment after graduation. ‘Black’ students are five times less likely to be employed than students from ‘White’, ‘Coloured’, or ‘Indian/Asian’ backgrounds with similar educational characteristics (‘Black’, ‘Coloured’, ‘Indian/Asian’, and ‘White’ are racial categories introduced in South Africa during apartheid. They are still used in South Africa’s official statistics). Anand et al. [22] find prior work experience and gender to be essential determinants of finding employment in the formal sector. High unemployment rates at large are found to be caused by skills mismatches, low educational levels, and the apartheid legacies.
Social capital has been shown to play an important role as an asset with economic returns, particularly in developing countries [23,24]. Various studies highlight the role of social capital for finding employment [25,26,27]. Moreover, religious communities play an important role for youth. Research indicates that religion not only constitutes an important source of identity and stability in early adolescence [28,29], but that religious communities also provide direct support to youth in economic terms [30,31]. Fruehwirth et al. [29] show that religion buffers against depression factors better than number of friends or school activities. Focusing on the South African context, Brittian et al. [32] find that adolescents from urban areas in South Africa report similar experiences of being religious to those described in North American contexts. Religion is reported to provide a sense of purpose and meaning in life and to offer social and emotional support, fostering the healthy development of adolescents, even in particularly stressful and high-risk environments. Brittian et al.’s [32] paper also points out that most youth are well-aware of the conflicts that could possibly arise between cultural and religious practices and beliefs, but that most of them find ways to combine both.
3. Materials and Methods
3.1. Core Concepts: Social Capital and Religious Social Capital
Bourdieu [33] describes social capital as “the aggregate of the actual or potential resources which are linked to possession of a durable network of more or less institutionalized relationships of mutual acquaintance and recognition—or in other words, to membership in a group—which provides each of its members with the backing of the collectively-owned capital.” He further notes that “these relationships may […] be socially instituted and guaranteed by the application of a common name (the name of a family, a class, or a tribe or of a school, a party, etc.) and by a whole set of instituting acts designed simultaneously to form and inform those who undergo them; in this case, they are more or less really enacted and so maintained and reinforced, in exchanges.” Coleman [34] highlights that social capital enables us to better understand economic actions and locates social capital within “a theory of rational action, in which each actor has control over certain resources and interest in certain resources and events, then social capital constitutes a particular kind of resource available to an actor.” He points out that “social capital is defined by its function. It is not a single entity but a variety of different entities, with two elements in common: they all consist of some aspect of social structures, and they facilitate certain actions of actors—whether persons or corporate actors—within the structure. […] Unlike other forms of capital, social capital inheres in the structure of relations between actors and among actors.” Drawing on Bourdieu and Coleman, Portes encapsulates this in a more general definition of social capital: “Social capital stands for the ability of actors to secure benefits by virtue of membership in social networks or other social structures“ [10].
As Maselko et al. [11] point out, “religious communities, which are based on longstanding social relationships within a context of shared beliefs, represent a social space that may be particularly salient as repositories of social capital”—or in the words of Swart [35] (p. 221), religion can constitute “as a special repository of social capital”. Religious social capital can be considered unique because of the high level of trust prevalent in religious social structures: “Given the quality and extent of its networks as well as the general trust that it commands, the religious sector could be presented as a special agent and generator of social capital” [36] (p. 28). Cilliers and Wepener [37], as well as Swart [35], have emphasize the crucial role of religious rituals in the generation of religious social capital. Religious rituals promote and foster mutual trust; mutual trust is constantly created and affirmed through religious rituals. Moreover, religious rituals transport and shape values [38], which “contribute to and sustain social capital” (ibid., 11), and might well constitute a very intense form of social capital specific to religious communities. Hence, this article takes into account a specific form of social capital, religious social capital, characterized by a specific density of (religious) social ties and the trust created in social structures inter alia though rituals. By extension of Portes’ definition of social capital, religious social capital is here conceptualized as the ability of actors to secure benefits by virtue of membership in religious networks or other religious structures.
3.2. Data: The Livelihoods, Religion and Youth Survey
The Livelihoods, Religion and Youth Survey was a cross-sectional household and individual survey conducted in northern South Africa from June to August 2016. It was conceptualized and led by the author for the purposes of this and other studies [39]. The survey focuses on predominantly Sepedi-and Setswana-speaking populations in four South African provinces: Limpopo, Northwest, Gauteng, and Mpumalanga. In total, 1039 households were interviewed across 15 sampling clusters (in most cases, equivalent to electoral wards). The total number of persons listed as members of these households is 4978. In each household, all persons from the age of 15 were interviewed individually, yielding 1863 individuals in the dataset. Here, the focus is on the subsample of youth aged 15 to 34, the definition of youth employed in the South African policy context and used in research on youth in South Africa [1,6]. In total, there are 831 observations in this age group. When subtracting those still attending secondary school, the number is 578. Due to missing values in some of the variables, 497 cases constitute the basis for most of the analyses. All data presented in the following comes from the Livelihoods, Religion and Youth Survey. See Table 1 for an overview of the variables and their descriptive statistics.

Table 1.
Descriptive statistics.
As a unique feature, the Livelihoods, Religion and Youth Survey provides data on social capital, individual religiosity, and religious social capital. Table 2 depicts the questionnaire inventory of the social capital scale. The scale is computed as the sum of the memberships in the different types of social groups mentioned.
Table 2.
Inventory used for the measurement of social capital.
Individual religiosity is operationalized using the Centrality of Religion Scale, a state-of-the-art interreligious measurement tool for religious intensity [12,40]. Table 3 outlines the construction and the inventory of the scale employed, which was slightly adapted to the South African context. Religious social capital is measured along the central dimensions of social capital and its functions for economic action [34,41]. Table 4 shows the inventory of the religious social capital scale.
Table 3.
Inventory of the Centrality of Religion Scale.
Table 4.
Inventory of the religious social capital scale.
3.3. Methods
The analysis progresses in two steps. First, a descriptive analysis is presented to provide an overview of youth labor market status in the data, as well as correlations of labor market status with religion, social capital, and religious social capital (Section 4.1). To study the factors determining the labor market outcomes of South African youth, the second part of the analysis (Section 4.2) uses probit regressions of labor market status. Labor market outcomes were denoted L. Four different labor market statuses are used as outcome variables: (1) being active in the formal labor market, (2) being active in the formal or informal labor market, (3) formal labor market activity or enrollment in tertiary education, and (4) formal or informal labor market activity or enrollment in tertiary education (the following description follows Wooldridge [42]).
In the probit approach taken here, a latent continuous variable L* is defined as follows:
In (1), xi is a vector of the explanatory variables (1 × K), and β (K × 1) is the vector of the estimation coefficients. The error term ei is assumed to be normally distributed (ei ~ N(0, 1)). The subscript i denotes the individual. The explanatory variables include sociodemographic characteristics at the individual and household levels, educational qualifications, social grant receipt, an indicator of residence in an urban area, and an indicator of migration within the past five years, as well as measures of social capital, individual religiosity, religious social capital, and religious affiliation.
L assumes the values of 0 or 1 according to the value of L*:
The response probability of each outcome of L was the probability that the value of the latent variable L* is below or above zero. The probabilities are:
In (2), Φ(.) is the standard normal cumulative distribution function. The model is estimated with maximum likelihood estimation in Stata 15.
4. Results
4.1. Descriptive Analysis: Data on Youth Labor Market Outcomes in the Livelihoods, Religion and Youth Survey
Of those individuals in the dataset that are in the age group between 15 and 34 years and are out of school, only about 23% are in formal employment. While 11% are currently enrolled in a tertiary educational institution, about two-thirds are neither studying nor working in the formal sector. Half of those not working and not studying report to be actively looking for work, while nearly 16% are not looking for work (cf. Table 5).
Table 5.
Educational and labor market status of youth out of secondary school.
Figure 1 displays the shares of persons in each of these categories by age cohort (including those still attending secondary school). The figures display a low rate of school dropout before finishing grade 12. At the same time, a large proportion of youth was neither absorbed into the formal labor market nor into the tertiary education sector. The majority of youth falls into the gap between tertiary education and the formal labor market. The proportion of NEETs increases as the proportion of secondary school attendees decreases until about age 24 and stays at around 65% from there onward.
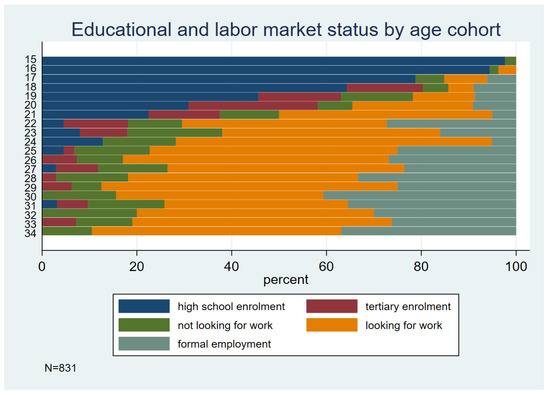
Figure 1.
Educational and labor market status by age cohort.
Informal economic activity seems to be an alternative only for a minority. Of those neither enrolled in tertiary education nor in formal employment or formal self-employment, only about 24% engage in informal employment or self-employment (see Table 6). Figure 2 zooms in on those out of school and includes informal labor market activity as an additional category. With respect to spatial considerations, Figure 3 depicts labor market status by rural and urban residence and by migration within the past five years. Urban residents and persons who migrated within the past five years are about twice as likely to be in formal employment than not-migrated rural residents (about 16% versus about 30%). The differences with respect to the informal sector are less pronounced. The percentage of persons engaged in informal labor market activity is about one-third higher among the urban or migrated than in the other categories. The percentage of youth not working is highest among the rural or not-migrated (64%), followed by rural or migrated (56%) and urban or not-migrated (51%), with the lowest value in the urban or migrated graph (43%). From the descriptive analysis, hence, it seems that urban residence is a labor market advantage and that migration into an urban area is a possible strategy for youth to increase their chances of informal- and formal-sector employment.
Table 6.
Labor market status of youth out of school, not enrolled in tertiary education, and not active in the formal labor market.
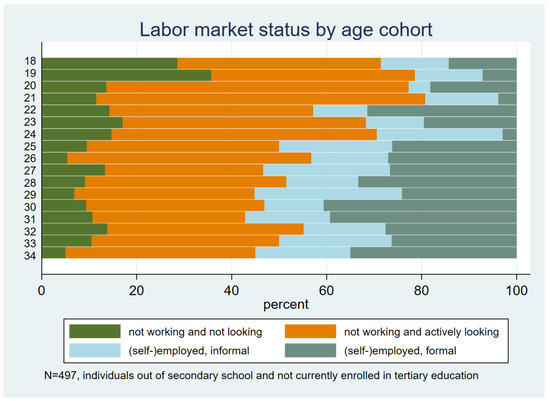
Figure 2.
Labor market status by age cohort.
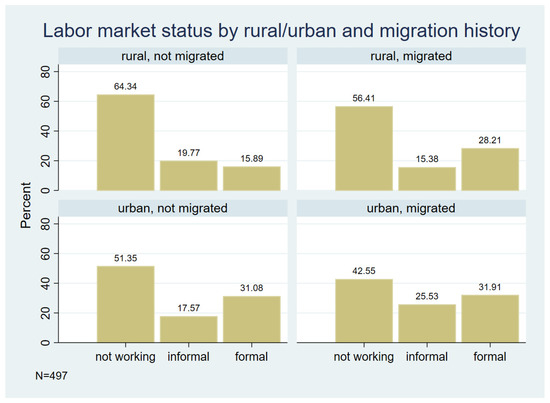
Figure 3.
Labor market status by rural or urban and migration history (past five years).
Figure 4 displays the deviation from the mean of social capital, individual religiosity, and religious social capital according to labor market status. On average, youth not working have lower values of all three variables. Values of social capital are highest among those in the informal labor market, potentially indicating that access to social networks is conducive to informal economic activity. The mean values of individual religiosity and religious social capital are highest among those in formal employment, deviating from the mean by 12% and 13% of the standard deviations, respectively.
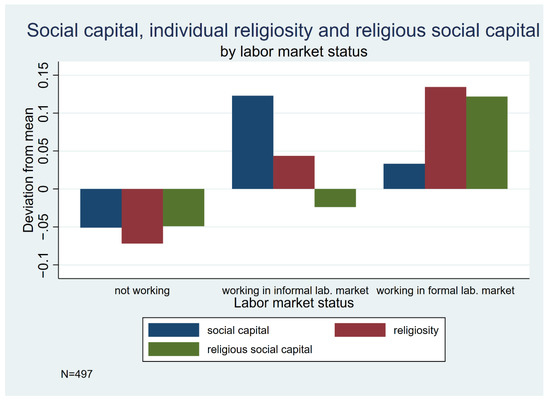
Figure 4.
Social capital, individual religiosity, and religious social capital by labor market status.
4.2. Econometric Analysis: Probit Estimations of Four Labor Market Statuses
Table 7 shows the estimation results of the four binary labor market outcomes specified. Most of the sociodemographic characteristics have the expected sign. Labor market success increases with age. Household heads are more likely to be engaged in both formal and informal labor market activity. Disability, measured by the receipt of a disability grant, reduces the probability of being in employment. Likewise, the probability decreases with an increasing number of children cared for (measured through the number of child grants received). A gender imbalance seems to exist only with respect to informal labor market activity; women are about 10 percentage points less likely to engage in labor market activity when including informal labor market activity (models (2) and (4)), while in models (1) and (3) the female indicator is not significant. Whether the mother tongue of the youth is Sepedi, Setswana, or another language does not seem to make much of a difference. Interestingly, neither do most of the educational characteristics seem to play a role. The indicators for having completed twelve years of schooling or having obtained tertiary qualifications do not have significant coefficients. Current tertiary enrollment substantially decreases the probability of being in formal employment (by 16.3 percentage points). The fact that the indicator is not significant in model (2) is likely indicative of two opposite trends: while tertiary enrollment decreases the probability of formal employment, youth enrolled in tertiary institutions might be more likely to engage in informal labor market activities during their studies. Having received business training increases the likelihood of informal and formal labor market activity by nearly 15 percentage points, but there is no significant effect when including tertiary enrollment as a positive outcome.
Table 7.
Estimation results.
Having migrated in the past five years has no significant effect in any of the models. Residence in an urban or semi-urban area, on the contrary, increases the probability of being engaged in formal or informal labor market activity by almost 10 percentage points. It increases the probability of labor market activity and educational continuity by 16.3 and 14.8 percentage points for formal and informal labor market activity, respectively.
Household size and the share of children in the household only have weakly significant coefficients in some of the models. The share of pension grant recipients in the household was associated with a lower probability of being engaged in labor market activity, and a standard deviation increase in the share of pensioners in the household reduces the probability of both formal and informal labor market activity by around 5 percentage points.
The coefficients of social capital, measured by the number of memberships in social networks, and individual religiosity, measured by the Centrality of Religion Scale [12], are not near any levels of significance. There is, however, a robust association between religious social capital and labor market outcomes. A standard deviation increase in religious social capital increases the probability of formal labor market activity by 5.6 percentage points and the probability of formal or informal activity by 7.8 percentage points. When including educational continuity as a positive outcome, the values are 8.4 and 9.9 percentage points, respectively. There is also a positive relationship between African traditional religious practice and labor market activity, particularly when including the informal sector: Youth practicing African traditional religion are 9.8 percentage points more likely to be engaged in labor market activity.
5. Discussion
This paper explores factors influencing labor market outcomes among youth in northern South Africa. The following main findings merit highlighting: First, the analysis conducted substantiates previous research arguing that skills mismatches are hindrances for youth in finding employment. Having completed secondary school or even tertiary education does not contribute to increased probabilities of finding employment.
Second, the literature highlights migration, particularly from rural to urban areas, as a strategy of increasing one’s chances of finding employment. The analysis in this paper shows residence in an urban area to go along with substantially higher probabilities of being in formal or informal labor market activity (10 percentage points). It, hence, substantiates findings from the literature on spatial mismatches in the South African labor market: youth in rural areas seem to be worse off in the labor market.
Third, the receipt of government old-age pensions goes along with lower probabilities of working in the formal sector and in the informal sector. Whereas some scholars have argued this to be a causal effect due to decreased incentives to engage in labor market activity by younger household members and higher reservation wages, others have pointed to the possibility that the negative relationship is visible because only poor households, whose members tend to be disadvantaged in the labor market, receive old-age grants. As the data at hand does not allow the identification of causal effects, both explanations are possible from the perspective of the analysis presented here.
Fourth, this paper is the first to include social capital, individual religiosity, religious social capital, and religious affiliation as explanatory variables of youth labor market outcomes in the South African context. From the descriptive analysis, it emerges that the mean levels of social capital, religiosity, and religious social capital of youths working either in the informal sector or the formal sector are higher than among those not working. In the econometric analysis, however, only religious social capital displays a robust association with labor market performance, increasing the probability of working in the informal or formal sectors by between 6 and 10 percentage points, respectively. This confirms previous qualitative research findings from religious studies arguing that religious communities in South Africa are particularly important sources of social capital and, hence, contribute to their adherents’ economic success [35,43]. Moreover, I find the practice of African traditional religion to be correlated with a higher probability of being engaged in informal or formal labor market activity, while I find no such relationship for church membership. This resonates with previous findings by Öhlmann and Hüttel [44], but it remains unclear what the specific transmission mechanisms of African traditional religion to labor market performance might be.
In summary, the analysis corroborates arguments on skills and spatial mismatches as important factors hindering youth labor market success. Economic development policies that prioritize creating jobs in rural areas could facilitate higher youth employment without burdening young people with the high cost of migration. Moreover, particular attention should be paid to the roles of the social networks provided by religious communities. The social capital created in these communities and the related resources members have access to, ranging from mutual support structures over networks of information and contacts to concrete structures and activities offered among the membership (savings groups, insurances, and scholarships) seems to impact youth labor market success. Further investigation into these structures is necessary in order to ascertain whether these structures can serve as models for the improvement of government interventions aiming at improving youth labor market outcomes.
Funding
The data collection for this research was financed by RWI—Leibniz Institute for Economic Research and Humboldt-Universität zu Berlin.
Institutional Review Board Statement
The Livelihoods, Religion and Youth Survey received ethical clearance through the Turfloop Research Ethics Committee at University of Limpopo, South Africa, under the project number TREC/61/2016: IR. The Turfloop Research Ethics Committee is registered with the South African National Health Research Ethics Council, Registration Number: REC-0310111-031.
Informed Consent Statement
All respondents gave their informed consent before they participated in the survey.
Data Availability Statement
Data are available from the author on request (no consent was obtained from survey participants for public data sharing).
Acknowledgments
The Livelihoods, Religion and Youth Survey was conducted in close collaboration with the University of Limpopo, South Africa, where special thanks are due to J.J. Hlongwane, Marelize Kellermann, and David Norris, as well as the colleagues at the Department of Agricultural Economics and Animal Production for providing support and advice. Special thanks are due to Johnny Monyebodu of Statistics South Africa for providing sampling frames and GIS data for the data collection. I am furthermore indebted to Cosmo Mapitsa, Elvis Mofokeng, Rammusi Pooe, Magkaba Molapo and Rangarirai Shoko for their advice on and contributions to the survey planning and implementation. The following University of Limpopo students’ excellent work as survey enumerators is gratefully acknowledged: Tlangelani Baloyi, Dalcie Bapela, Thapelo Hlongoane, Georgina Mabotja, Reason Malatji, Jan Malema, Conrad Maliavusa, Thabiso Manaka, Malebo Manamela, Stephen Mantsho, Naume Maponya, Christina Masegela, Brilliant Mokonyama, Kagiso Mothogoane, Innocent Pilane, Chatty Seerane, and Judy Thantsha. Moreover, the openness of the members of 1039 households to share their personal information with the researchers is gratefully acknowledged as well. Finally, the author thanks Jochen Kluve for constructive advice in the research process. Comments on earlier versions of this manuscript by the participants of the Development Economics Network Berlin Discussion Round as well as two anonymous reviewers are greatly appreciated. Any remaining errors are the author’s.
Conflicts of Interest
The author declares no conflict of interest.
References
- NYP. National Youth Policy 2015—2020; Presidency of the Republic of South Africa: Pretoria, South Africa, 2015. [Google Scholar]
- Statistics South Africa. Quarterly Labour Force Survey. Quarter 3: 2020: Statistical Release P0211; Statistics South Africa: Pretoria, South Africa, 2020. [Google Scholar]
- Yu, D. Youths in the South African Labour Market since the Transition: A Study of Changes between 1995 and 2011; Stellenbosch Economic Working Papers: 18/12; Stellenbosh University: Stellenbosch, South Africa, 2012. [Google Scholar]
- Banerjee, A.; Galiani, S.; Levinsohn, J.; McLaren, Z.; Woolard, I. Why Has Unemployment Risen in the New South Africa? Econ. Transit. 2008, 16, 715–740. [Google Scholar] [CrossRef]
- Thaba, T.K.; Belete, A.; Hlongwane, J.J.; Ledwaba, L.J. Econometric estimation of the relationship between the unemployment rate and economic growth in Limpopo Province, South Africa. Jard 2020, 58, 343–349. [Google Scholar] [CrossRef]
- Ardington, C.; Bärnighausen, T.; Case, A.; Menendez, A. Social Protection and Labor Market Outcomes of Youth in South Africa. ILR Rev. 2016, 69, 455–470. [Google Scholar] [CrossRef]
- Yu, D. Youth Unemployment in South Africa Revisited. Dev. South. Afr. 2013, 30, 545–563. [Google Scholar] [CrossRef]
- Mncayi, P.; Dunga, S.H. Career Choice and Unemployment Length: A Study of Graduates from a South African University. Ind. High. Educ. 2016, 30, 413–423. [Google Scholar] [CrossRef]
- Ardington, C.; Case, A.; Hosegood, V. Labor Supply Responses to Large Social Transfers. Longitudinal Evidence from South Africa. Am. Econ. J. Appl. Econ. 2009, 1, 22–48. [Google Scholar] [CrossRef]
- Portes, A. Social Capital: Its Origins and Applications in Modern Sociology. Annu. Rev. Sociol. 1998, 24, 1–24. [Google Scholar] [CrossRef]
- Maselko, J.; Hughes, C.; Cheney, R. Religious social capital: Its measurement and utility in the study of the social determinants of health. Soc. Sci. Med. 2011, 73, 759–767. [Google Scholar] [CrossRef]
- Huber, S.; Huber, O. The Centrality of Religiosity Scale (CRS). Religions 2012, 3, 710–724. [Google Scholar] [CrossRef]
- African Development Bank. African Economic Outlook 2018; African Development Bank: Abidjan, Côte d’Ivoire, 2018. [Google Scholar]
- Mbeki, T. Bold Steps to End the Two Nations Divide. ANC Today 2003, 3., 33. [Google Scholar]
- World Bank. Overcoming Poverty and Inequality in South Africa. An Assessment of Drivers, Constraints and Opportunities; World Bank: Washington, DC, USA, 2018. [Google Scholar]
- Davies, R.; Thurlow, J. Formal-Informal Economy Linkages and Unemployment in South Africa. S. Afr. J. Econ. 2010, 78, 437–459. [Google Scholar] [CrossRef]
- Nackerdien, F.; Yu, D. A Panel Data Analysis of the Formal-Informal Sector Labour Market Linkages in South Africa. Dev. South. Afr. 2019, 36, 329–350. [Google Scholar] [CrossRef]
- Statistics South Africa. Survey of Employers and the Self-Employed, 2013: Statistical Release P0276; Statistics South Africa: Pretoria, South Africa, 2014. [Google Scholar]
- Oluwajodu, F.; Blaauw, D.; Greyling, L.; Kleynhans, E.P. Graduate unemployment in South Africa: Perspectives from the banking sector. SA J. Hum. Resour. Manag. 2015, 13, 181. [Google Scholar] [CrossRef]
- von Fintel, D.; Fourie, J. The great divergence in South Africa: Population and wealth dynamics over two centuries. J. Comp. Econ. 2019, 47, 759–773. [Google Scholar] [CrossRef]
- Baldry, K. Graduate Unemployment in South Africa: Social Inequality Reproduced. J. Educ. Work. 2016, 29, 788–812. [Google Scholar] [CrossRef]
- Anand, R.; Kothari, S.; Kumar, N. South Africa: Labor Market Dynamics and Inequality; International Monetary Fund IMF Working Paper: Volume 16/137; International Monetary Fund: Wahington, DC, USA, 2016. [Google Scholar]
- Knack, S.; Keefer, P. Does Social Capital have an Economic Payoff? A Cross- Country Investigation. Q. J. Econ. 1997, 112, 1251–1288. [Google Scholar] [CrossRef]
- Woolcock, M. Social Capital and Economic Development: Toward a Theoretical Synthesis and Policy Framework. Theory Soc. 1998, 27, 151–208. [Google Scholar] [CrossRef]
- Asquith, B.; Hellerstein, J.; Kutzbach, M.; Neumark, D. Social Capital and Labor Market Networks. NBER Work. Pap. 2017. [Google Scholar] [CrossRef]
- Santos, P.; Naidoo, D. Social Networks and Wages in South Africa; Working Paper: 2013. Available online: https://www2.novasbe.unl.pt/Portals/0/Research/documents/Paulo%20Santos.pdf?ver=2019-04-11-102133-480 (accessed on 18 September 2022).
- Verhage, K. Impact of Social Capital on Youth Employability in Johannesburg, South Africa. Master’s Thesis, Utrecht University, Utrecht, The Netherlands, 2015. [Google Scholar]
- Cross, C.; Oosthuizen, G.C.; Clark, C. Out of the Wind. The African Independent Churches and Youth Urbanization in Metropolitan Natal. A Report Prepared for the Co-Operative Programme on the Youth; Co-operative Programme on Youth of the Human Sciences Research Council: Durban, South Africa, 1993. [Google Scholar]
- Fruehwirth, J.C.; Iyer, S.; Zhang, A. Religion and Depression in Adolescence. J. Political Econ. 2019, 127, 1178–1209. [Google Scholar] [CrossRef]
- Oosthuizen, G.C. African Independent Churches and Small Businesses: Spiritual Support for Secular Empowerment; Human Sciences Research Council: Pretoria, South Africa, 1997; ISBN 9780796918123. [Google Scholar]
- Schlemmer, L. Dormant Capital: The Pentecostal Movement in South Africa and its Potential Social and Economic Role; Centre for Development and Enterprise: Johannesburg, South Africa, 2008; ISBN 978-0-9802628-4-1. [Google Scholar]
- Brittian, A.S.; Lewin, N.; Norris, S.A. You Must Know Where You Come From: South African Youths’ Perceptions of Religion in Time of Social Change. J. Adolesc. Res. 2013, 28, 642–663. [Google Scholar] [CrossRef]
- Bourdieu, P. The Forms of Capital. In Handbook of Theory and Research for the Sociology of Education; Richardson, J.G., Ed.; Greenwood Press: New York, NY, USA, 1986; pp. 241–258. [Google Scholar]
- Coleman, J.S. Social Capital in the Creation of Human Capital. Am. J. Sociol. Suppl. Organ. Inst. Soc. Econ. Approaches Anal. Soc. Struct. 1988, 94, S95–S120. [Google Scholar] [CrossRef]
- Swart, I. Social Capital, Religious Social Capital and the Missing Element of Religious Ritual. Relig. Theol. 2017, 24, 221–249. [Google Scholar] [CrossRef]
- Swart, I. Networks and Partnerships for Social Justice? The Pragmatic Turn in Religious Social Development Debate in South Africa. Relig. Theol. 2005, 12, 20–47. [Google Scholar] [CrossRef]
- Cilliers, J.; Wepener, C. Ritual and the Generation of Social Capital in Contexts of Poverty: A South African Exploration. Int. J. Pract. Theol. 2007, 11, 39–55. [Google Scholar] [CrossRef]
- Wepener, C.; Swart, I.; ter Haar, G.; Barnard, M. The Role of Religious Ritual in Social Capital Formation for Poverty Alleviation and Social Development: Theoretical and Methodological Points of Departure for a South African Exploration. Relig. Theol. 2010, 17, 1–18. [Google Scholar] [CrossRef]
- Öhlmann, P. Religion and Labor Market Performance: Is It What You Believe or How Much? Religions 2021, 12, 102. [Google Scholar] [CrossRef]
- Huber, S. Kerndimensionen, Zentralität und Inhalt. Ein interdisziplinäres Modell der Religiosität. J. Für Psychol. 2008, 16. Available online: https://journal-fuer-psychologie.de/index.php/jfp/article/view/202 (accessed on 18 September 2022).
- Democracies in Flux: The Evolution of Social Capital in Contemporary Society; Putnam, R.D., Ed.; Oxford University Press: Oxford, NY, USA, 2002; ISBN 0-19-515089-9. [Google Scholar]
- Wooldridge, J.M. Econometric Analysis of Cross Section and Panel Data; MIT Press: Cambridge, MA, USA, 2010; ISBN 978-0-262-23258-6. [Google Scholar]
- Swart, I. Churches as a Stock of Social Capital for Promoting Social Development in Western Cape Communities. J. Relig. Afr. 2006, 36, 346–478. [Google Scholar] [CrossRef]
- Öhlmann, P.; Hüttel, S. Religiosity and Household Income in Sekhukhune. Dev. South. Afr. 2018, 36, 179–193. [Google Scholar] [CrossRef]
Publisher’s Note: MDPI stays neutral with regard to jurisdictional claims in published maps and institutional affiliations. |
© 2022 by the author. Licensee MDPI, Basel, Switzerland. This article is an open access article distributed under the terms and conditions of the Creative Commons Attribution (CC BY) license (https://creativecommons.org/licenses/by/4.0/).