
Graded Response Modeling of the DESSA’s Self- and Social Awareness Subscales in a Special Needs Sample


Abstract
:1. Introduction
2. Materials and Methods
2.1. Participants
2.2. Measures
2.3. Analysis Strategies
3. Results
3.1. Item Descriptive Statistics
3.2. Dimensionality and Local Independence Assumptions
3.3. Monotonically Assumption
3.4. Model Fit
4. Discussion
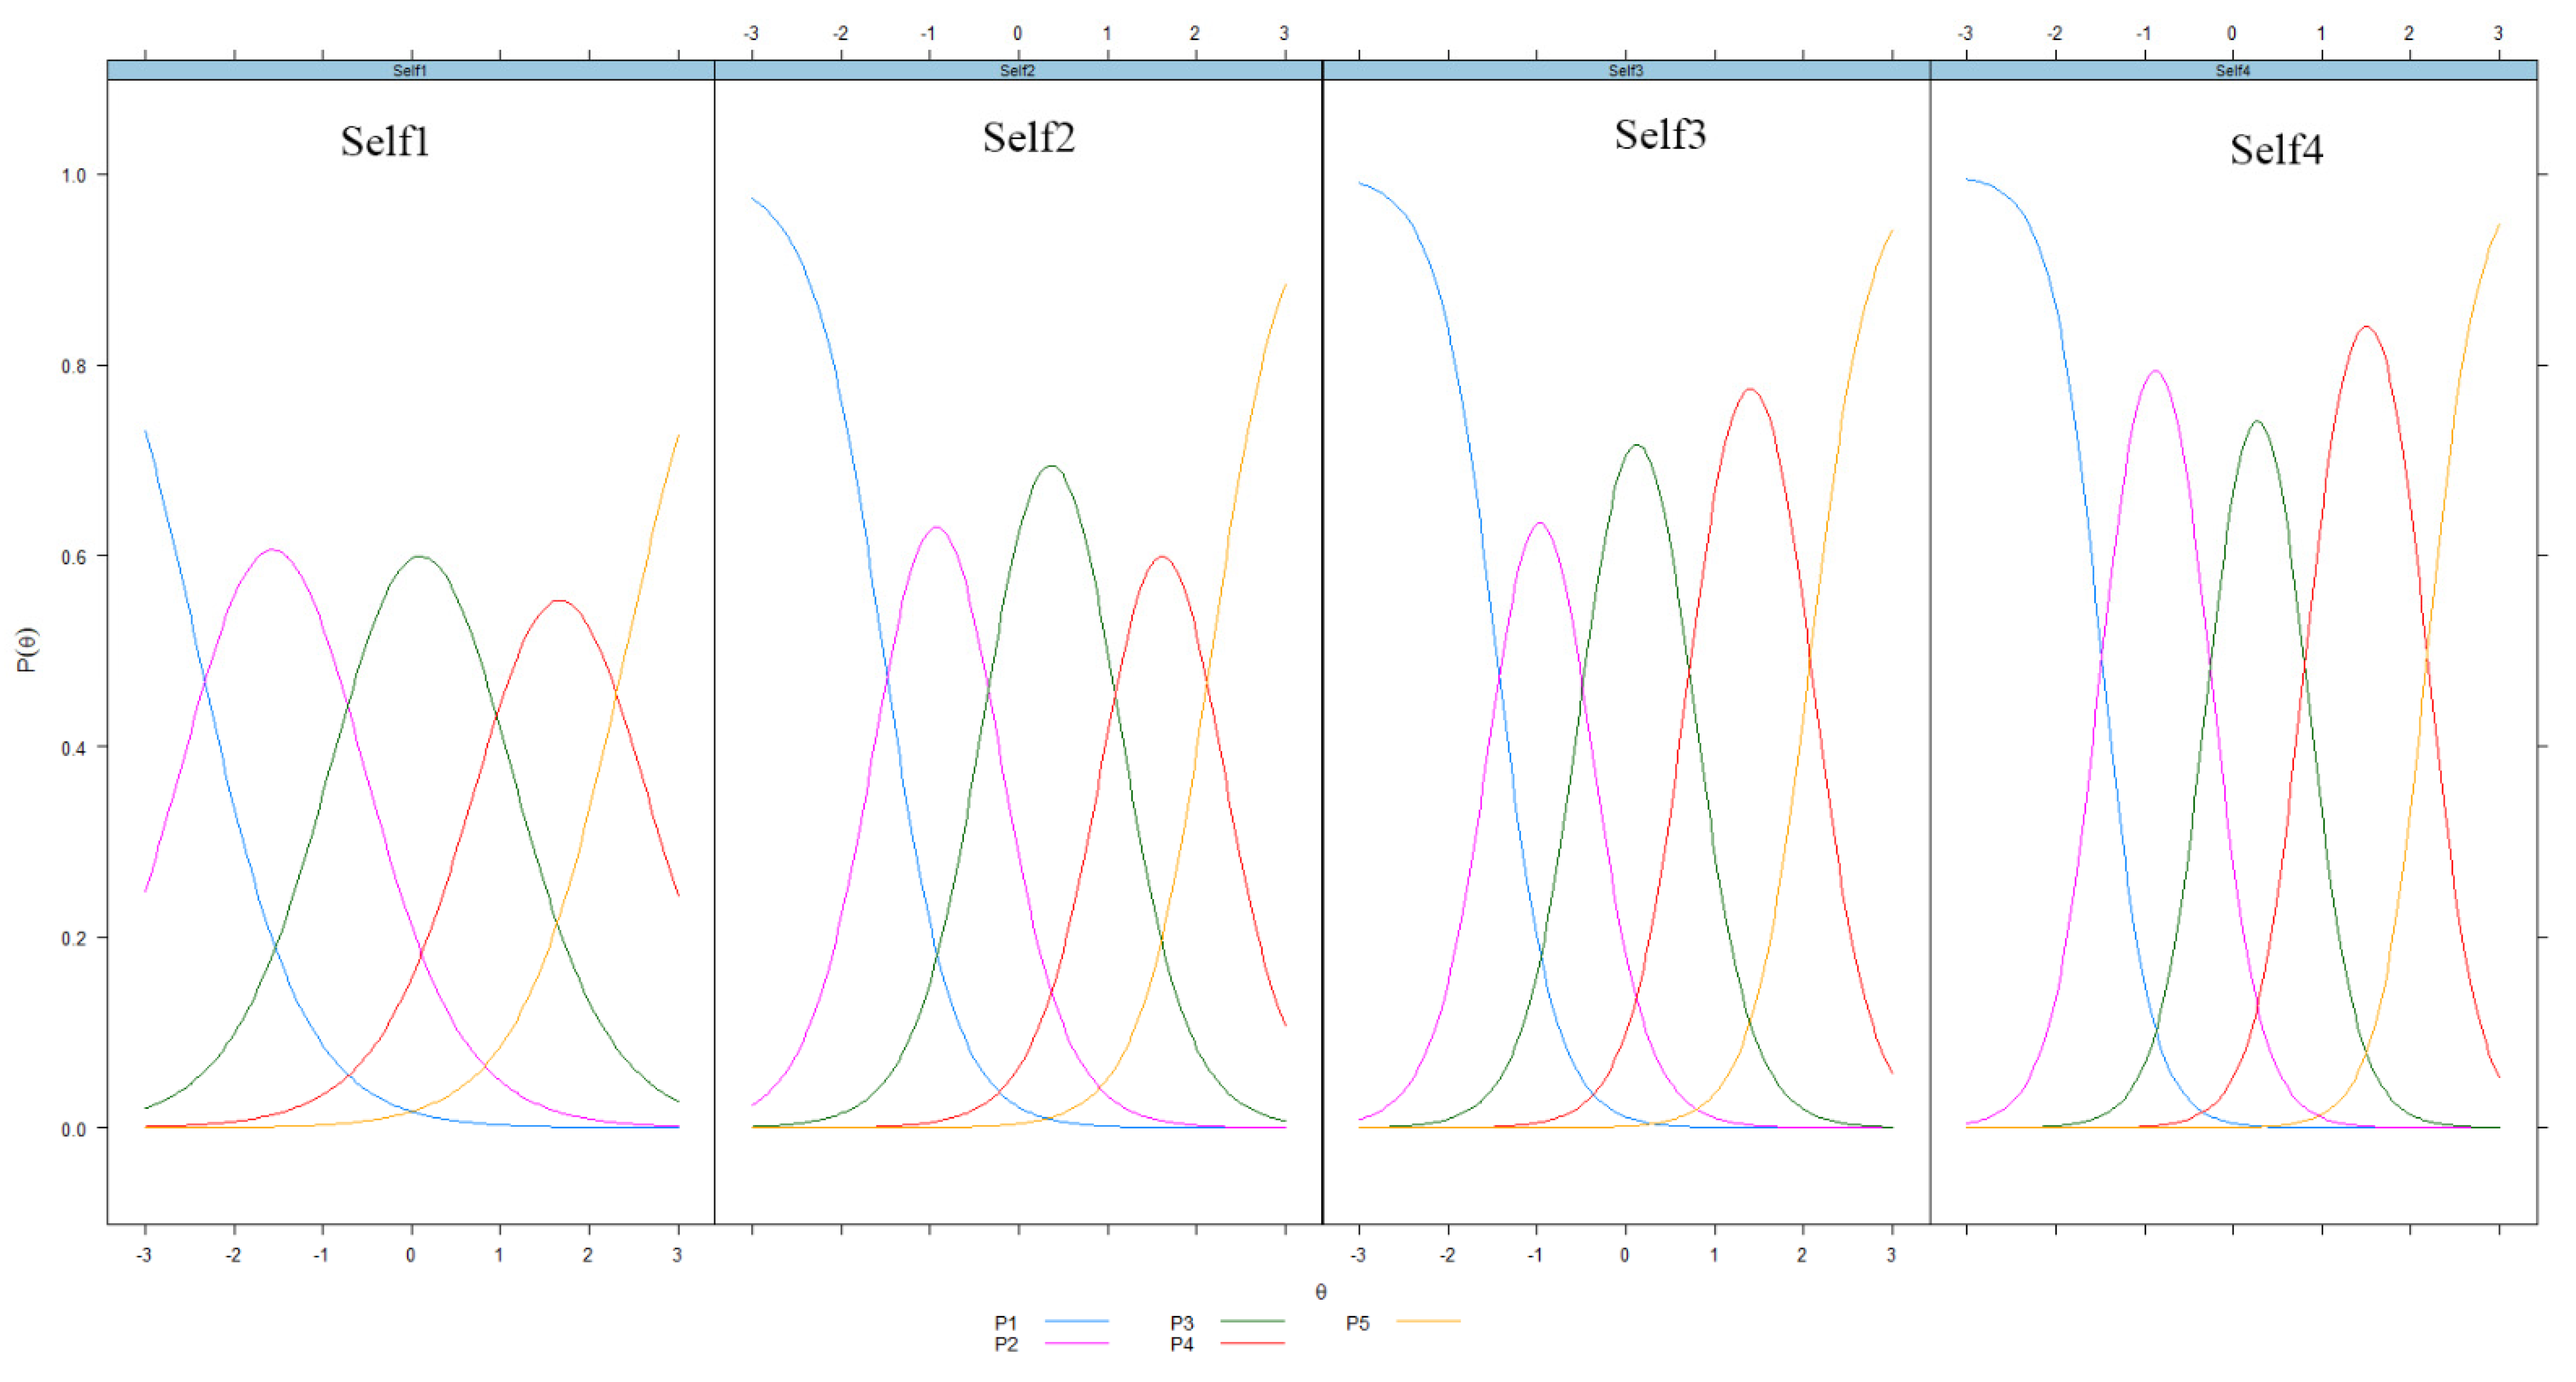
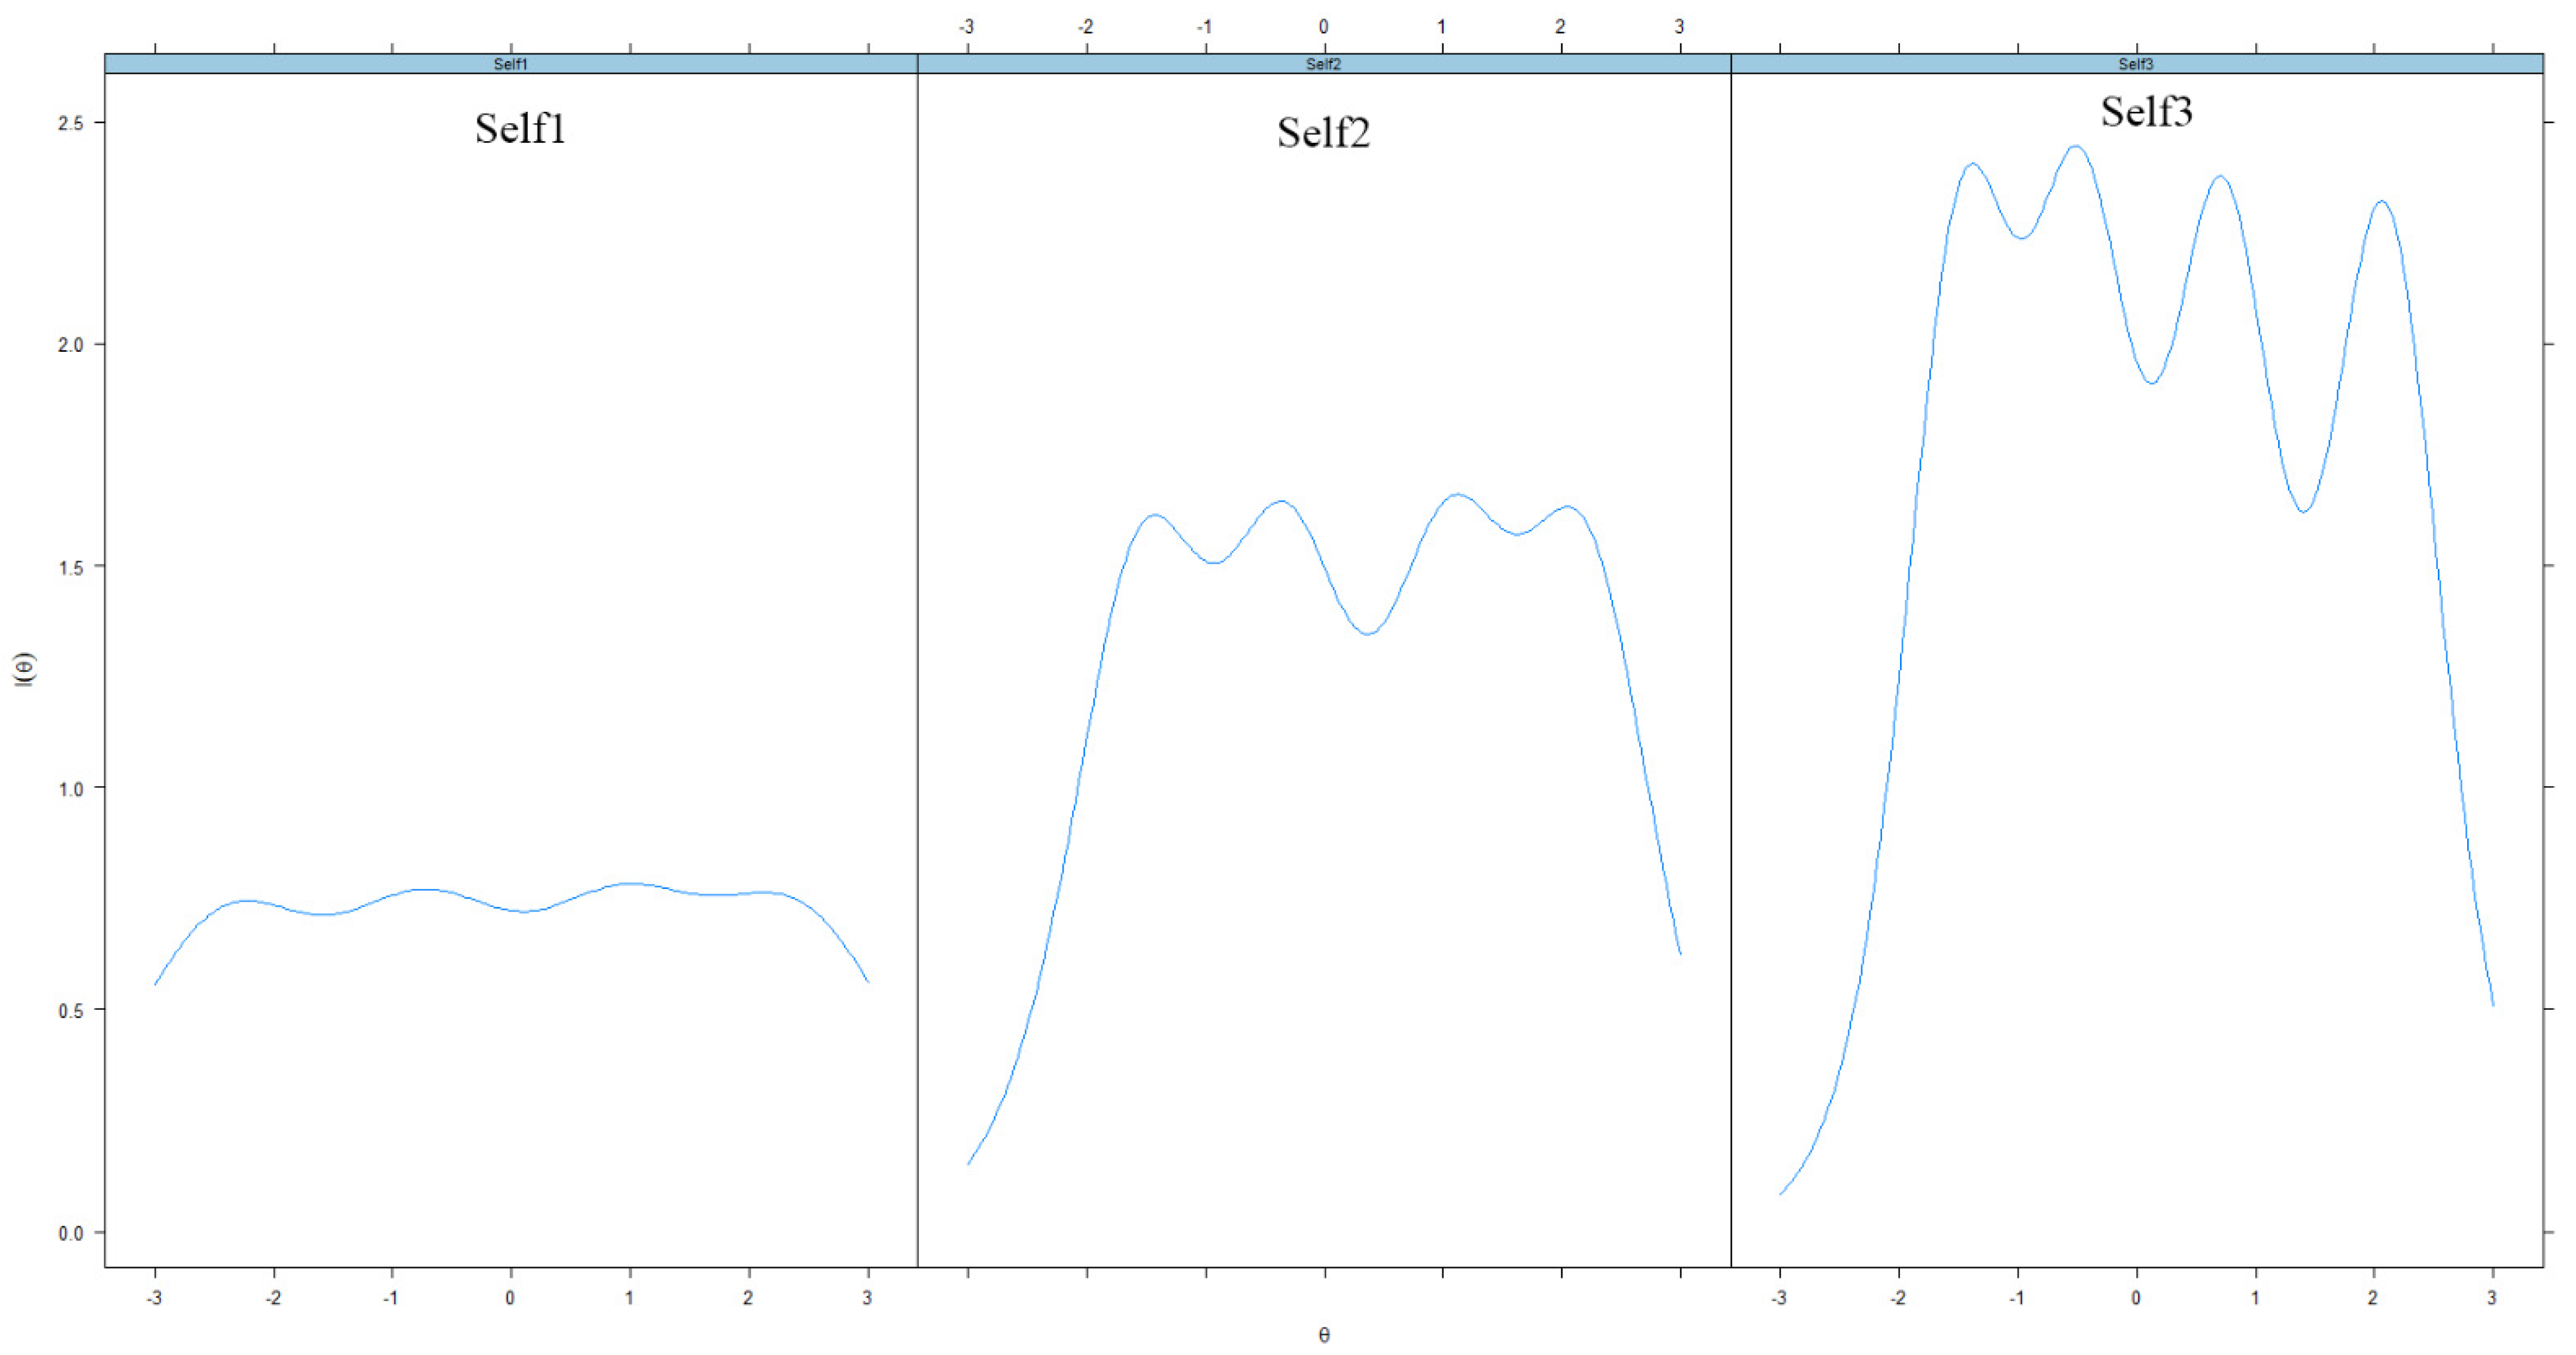
- Self 1: Accurately talks about life events
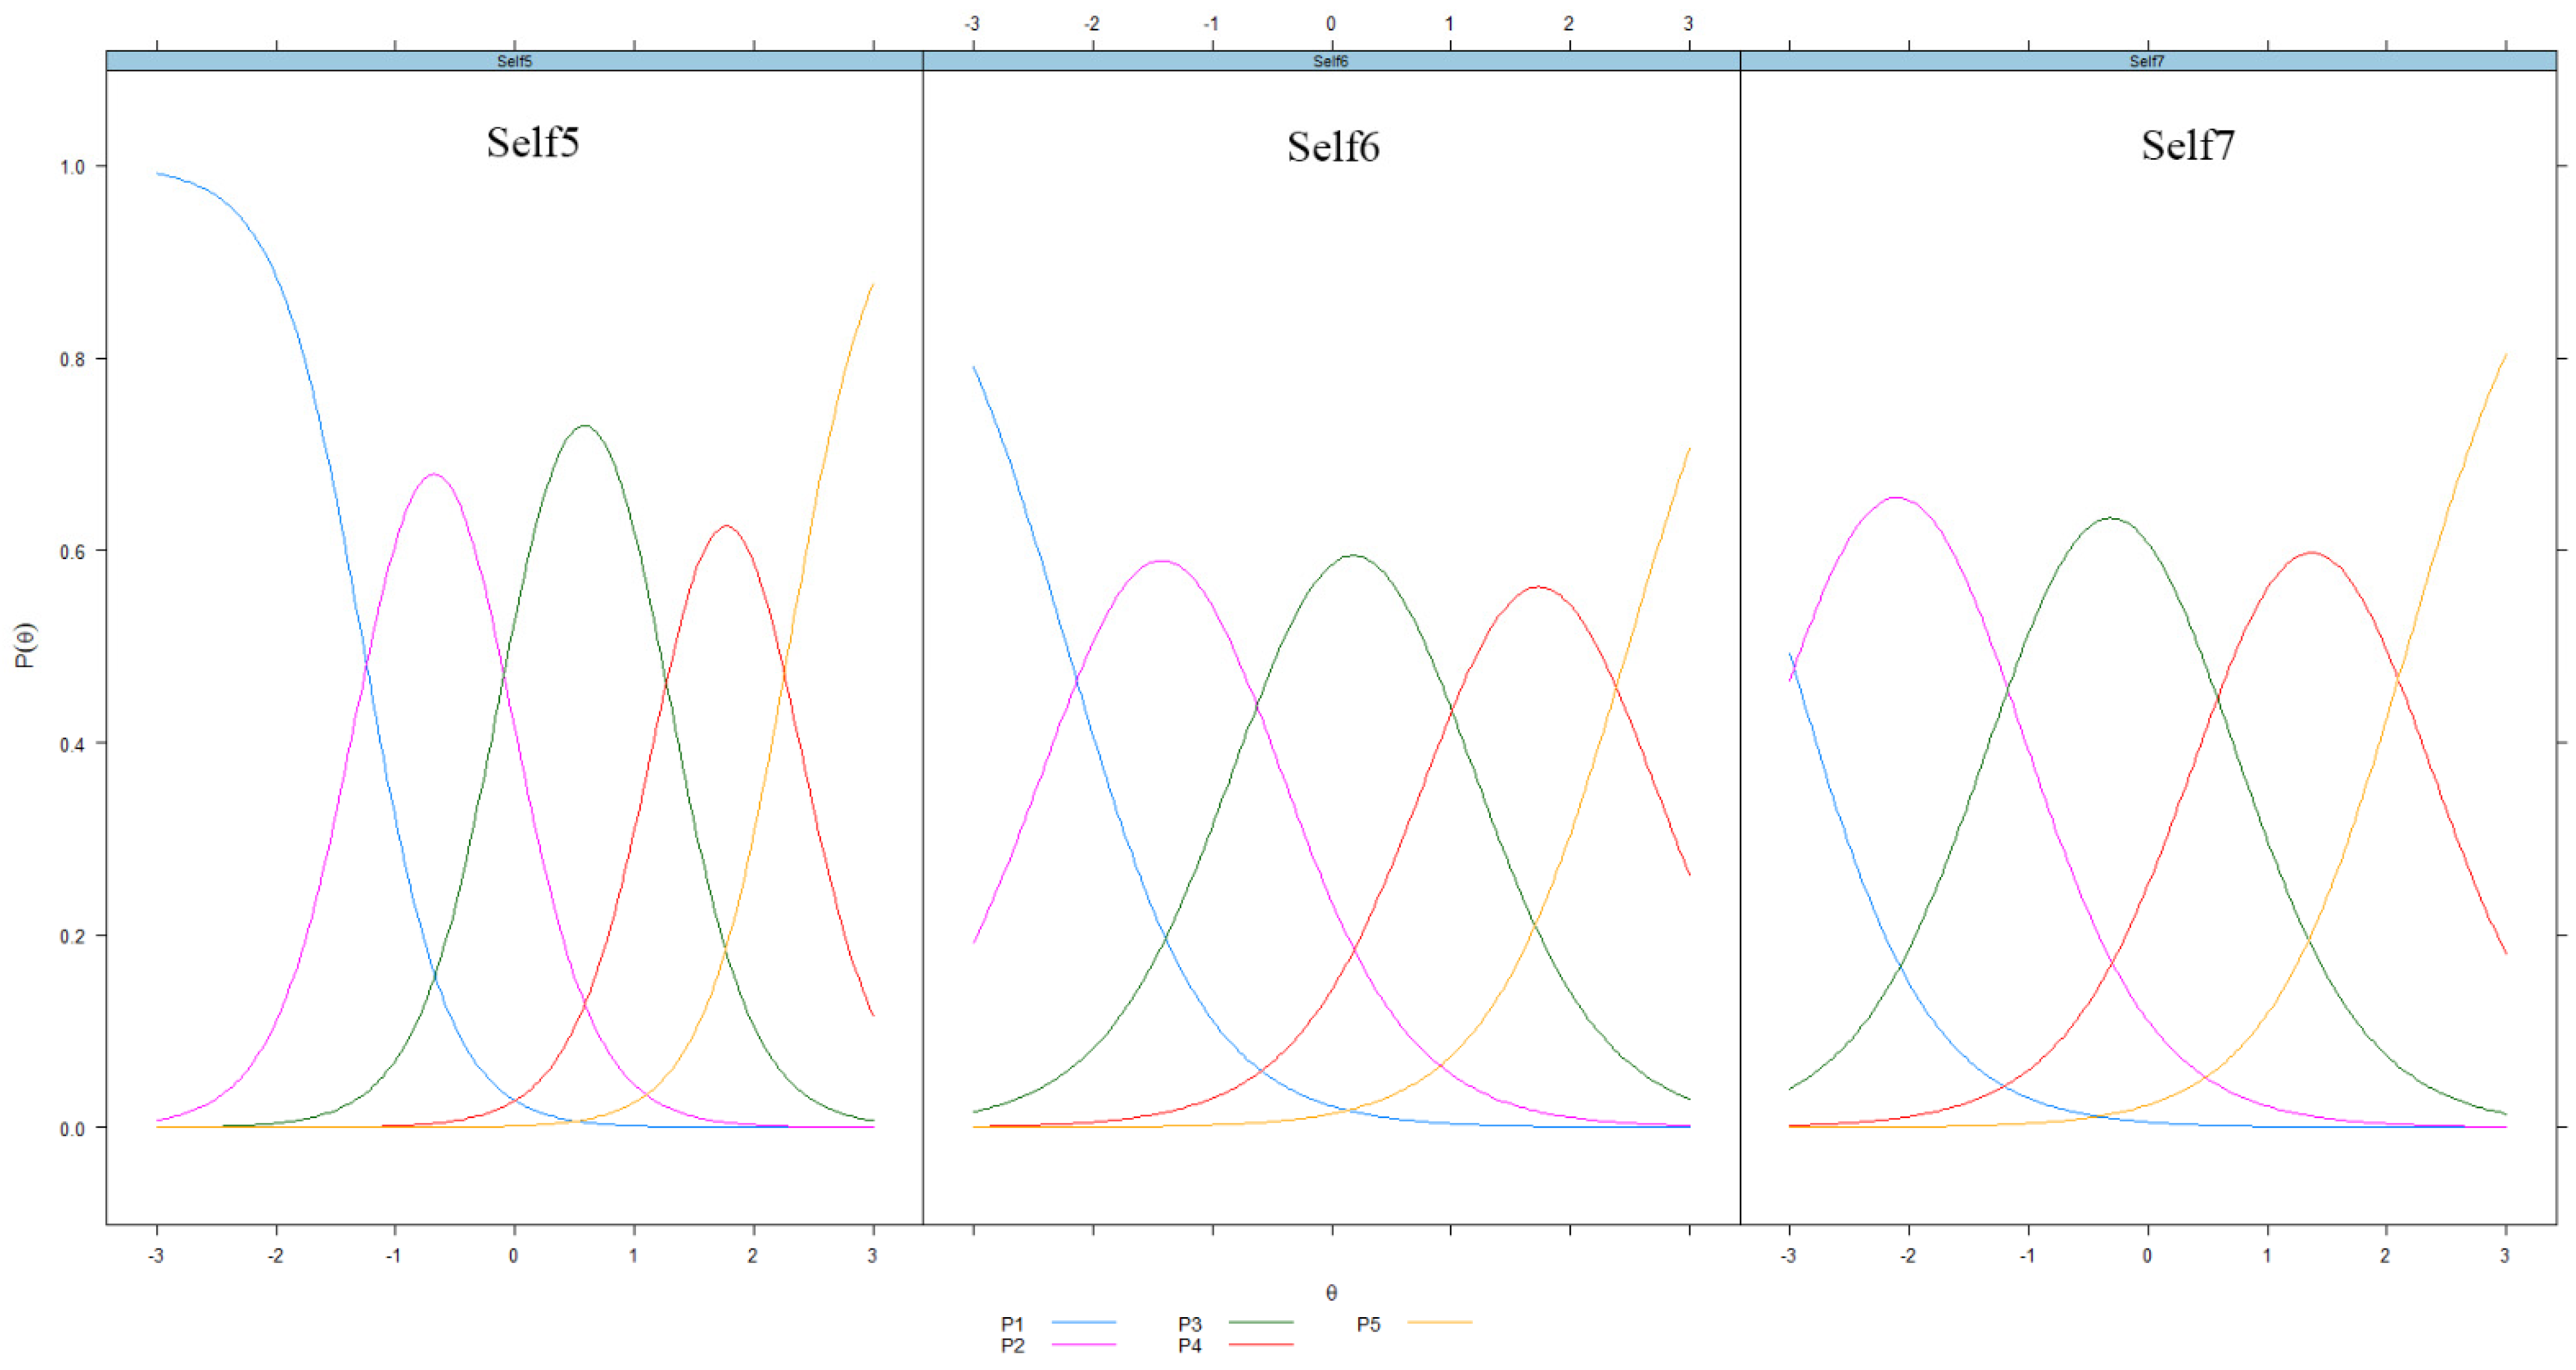
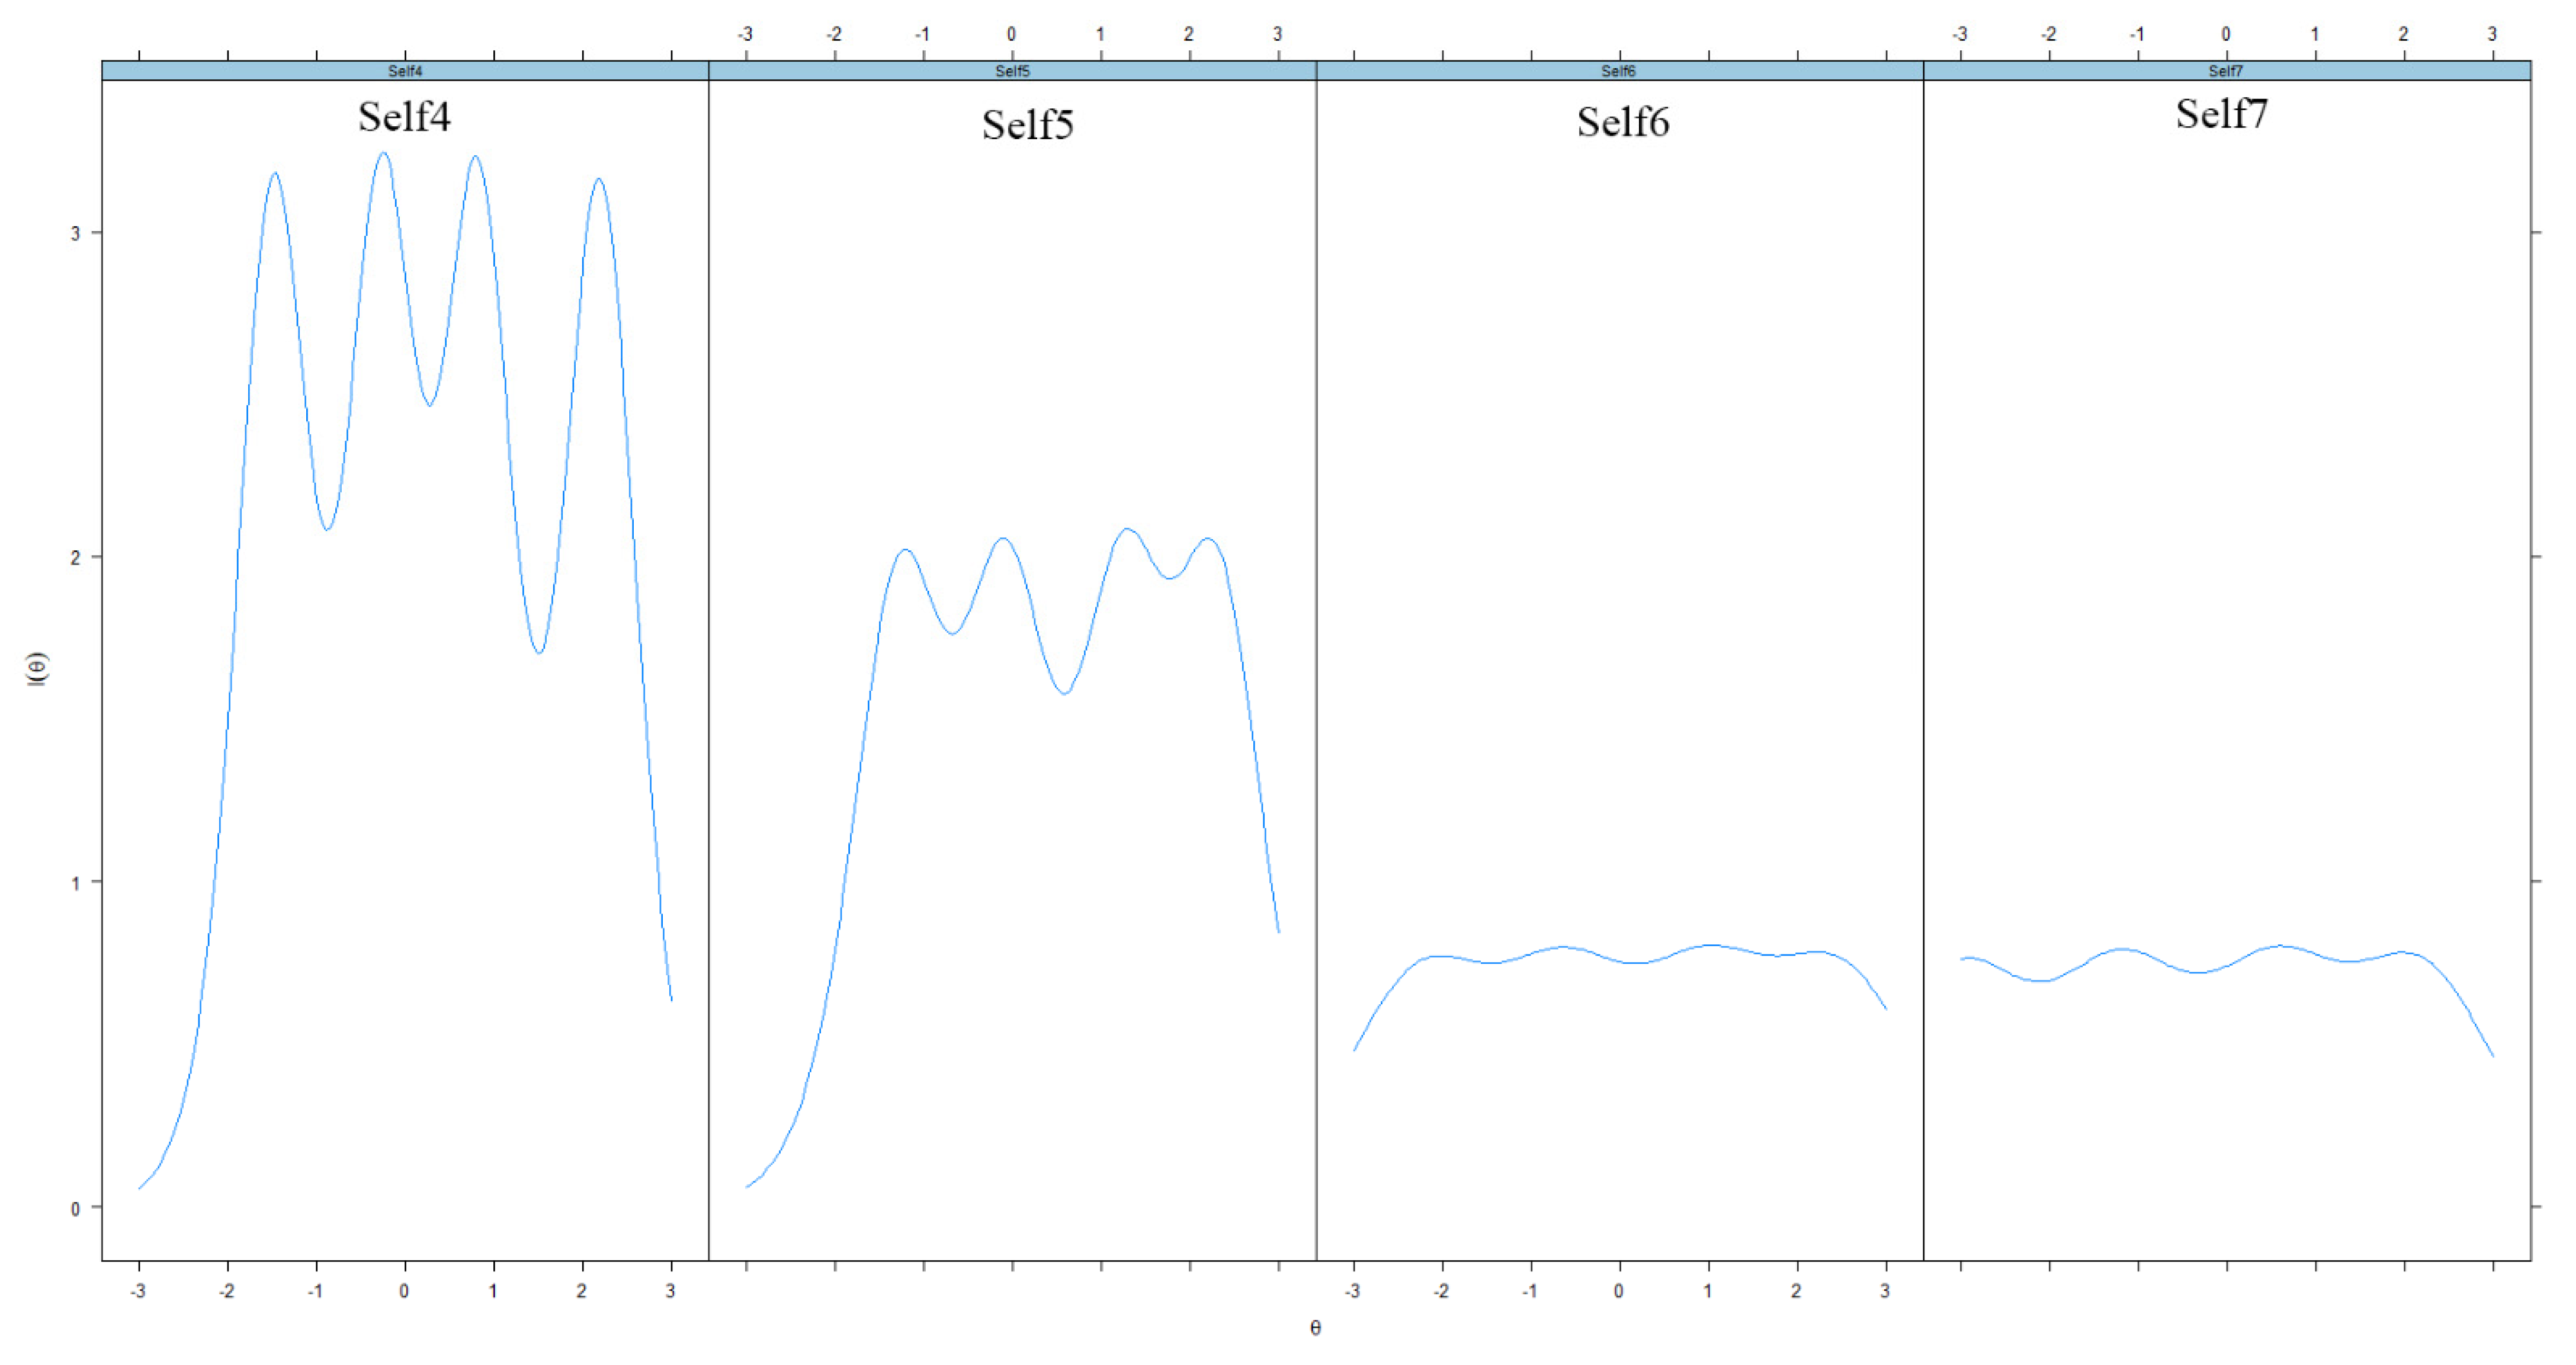
- Self 6: Describes feelings
- Self 7: Give an opinion when asked
- Self 2: Teaches others to do something
- Self 3: Ask questions to clarify understanding
- Self 4: Is aware of personal strengths
- Self 5: Ask for feedback
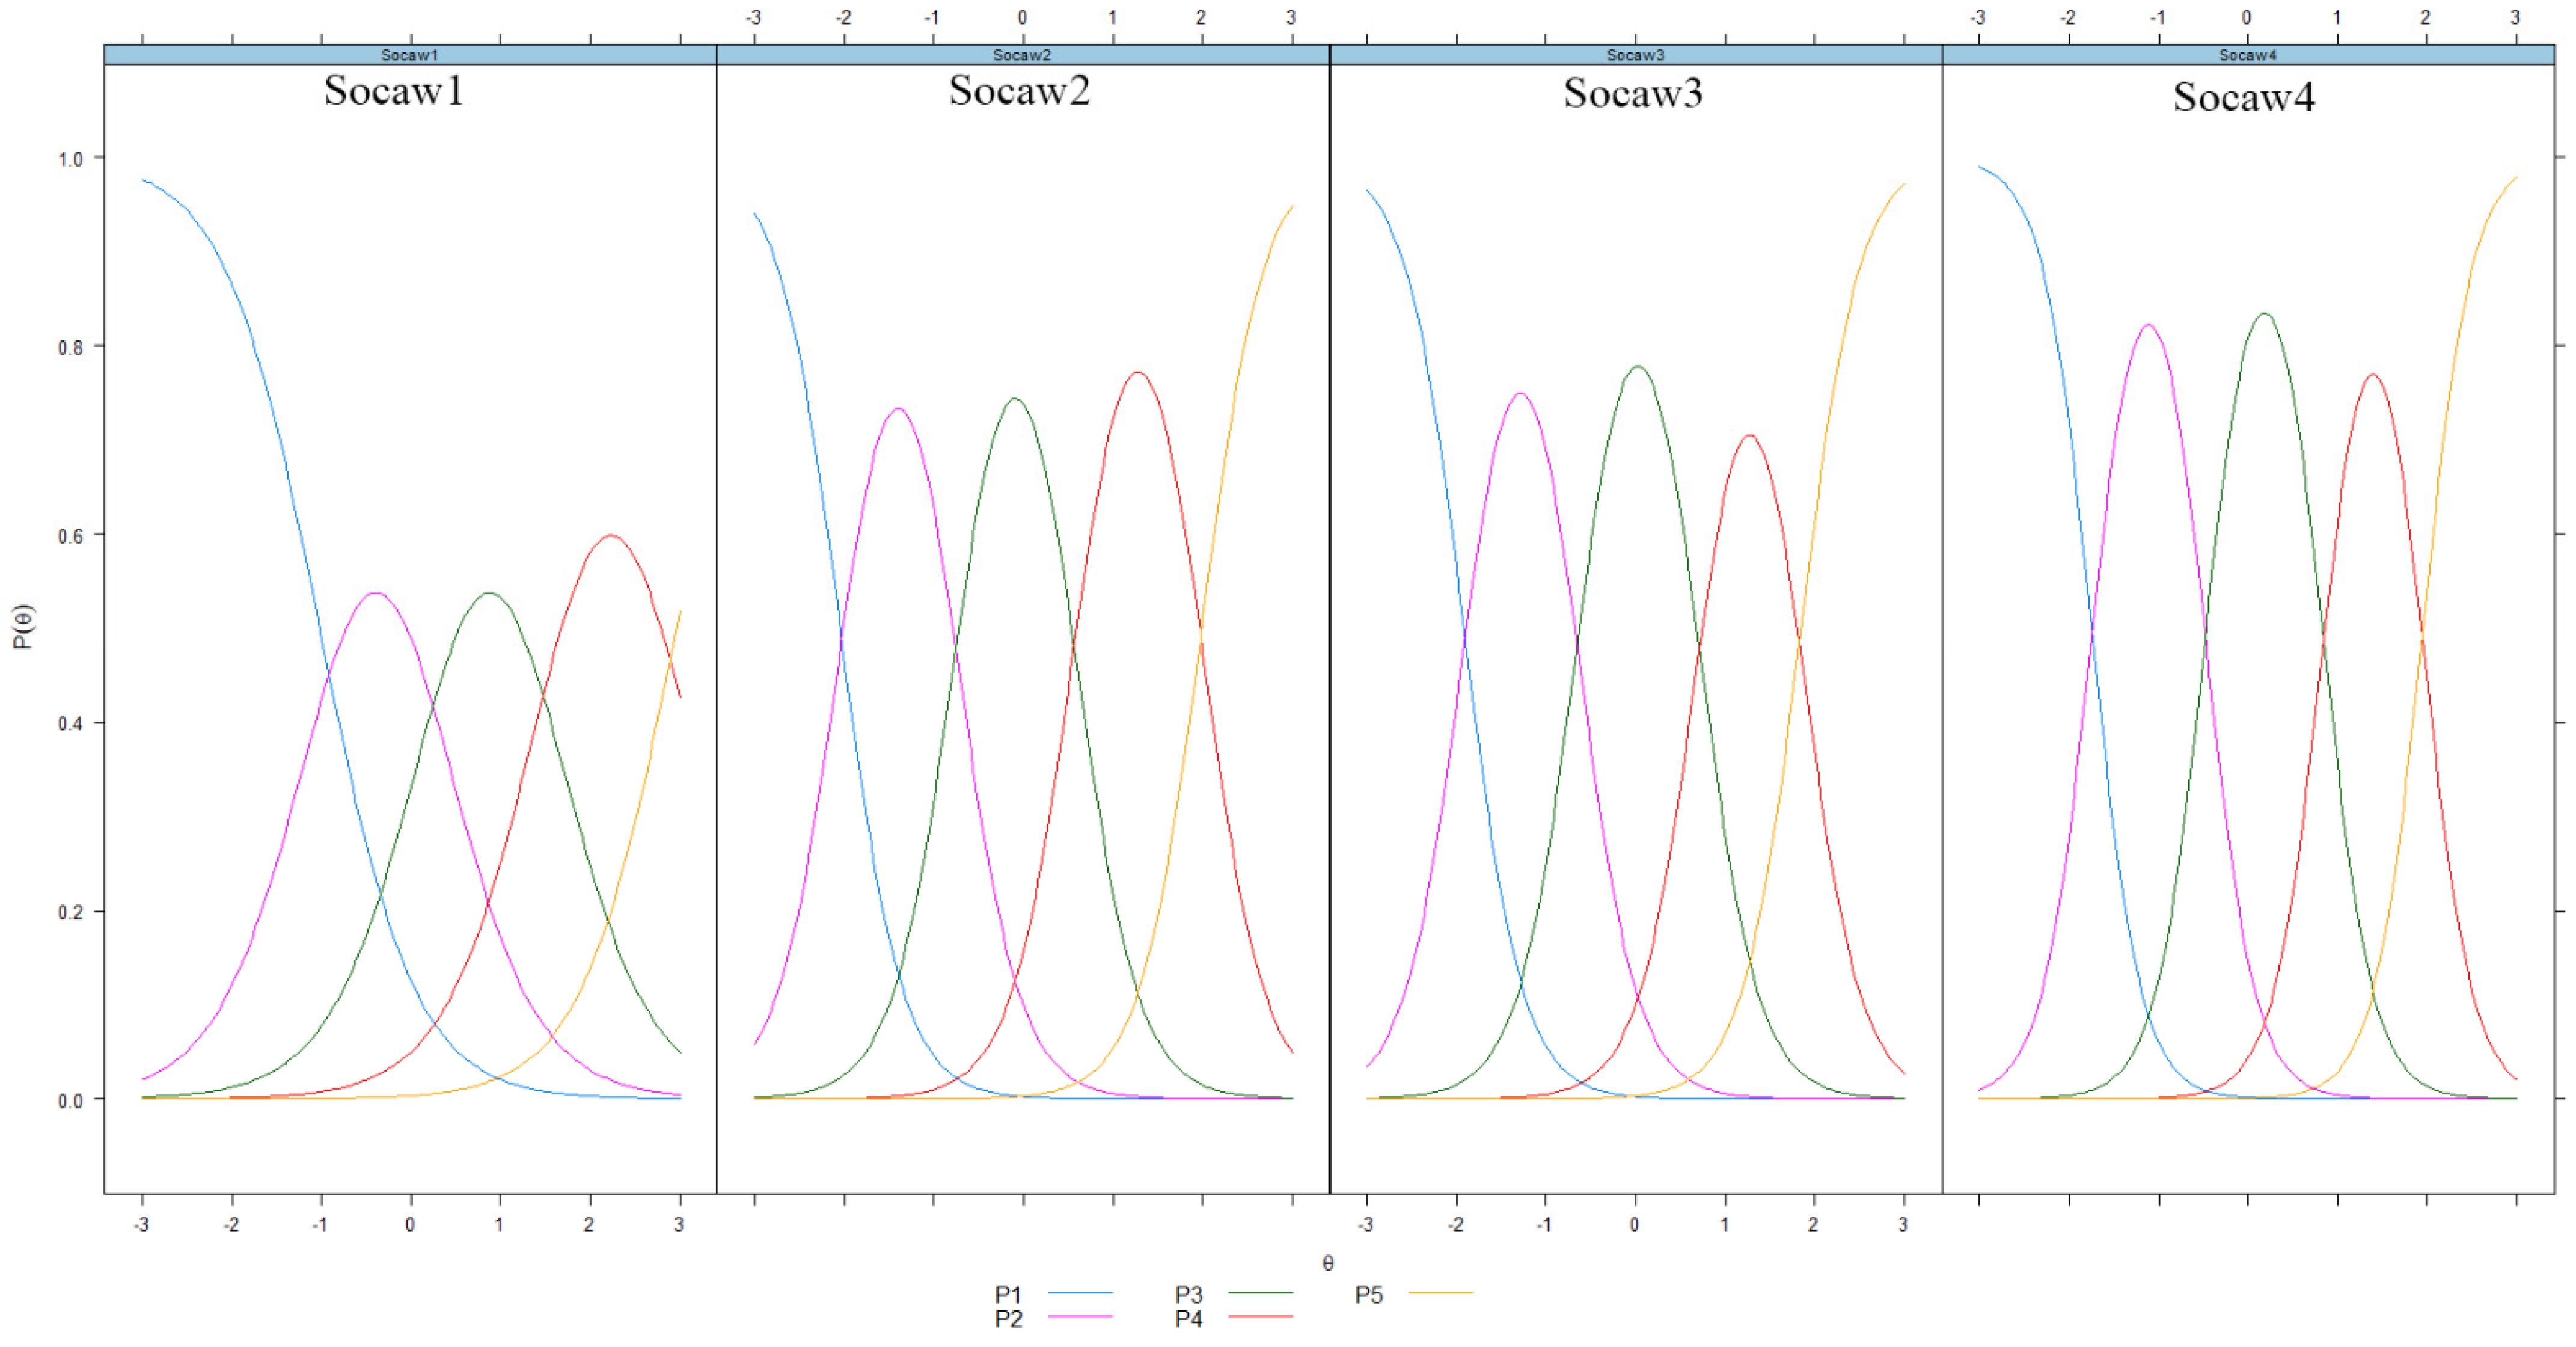
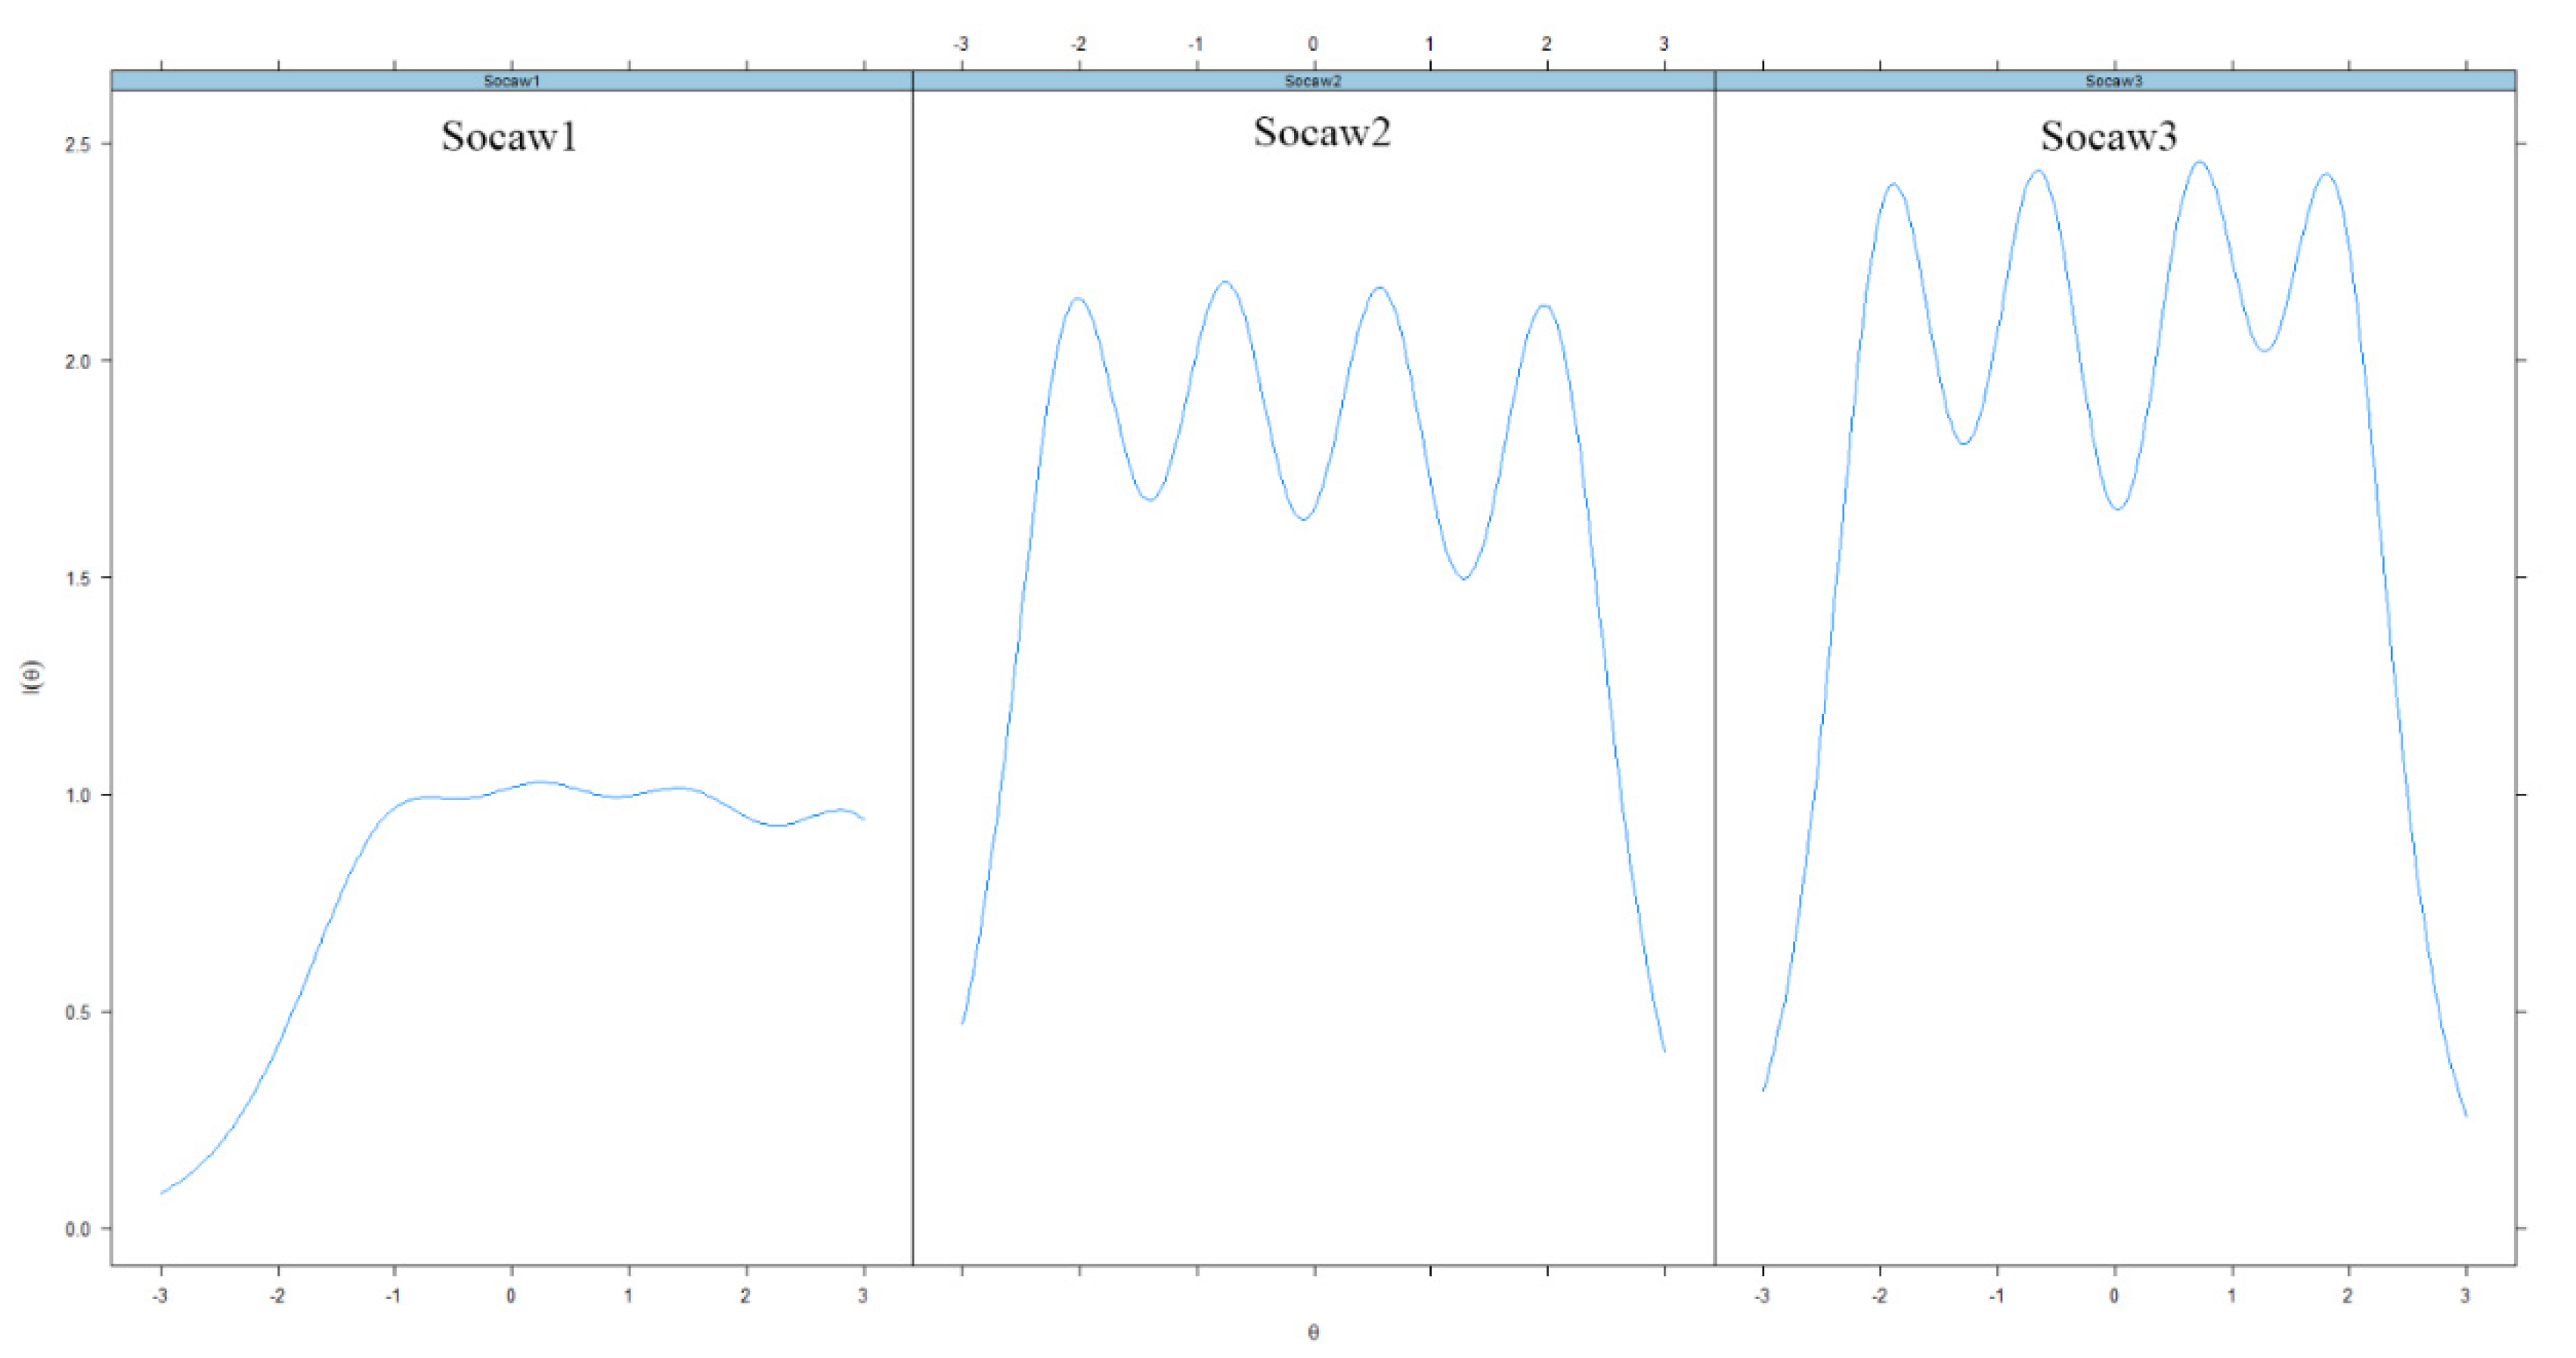
- Socaw 1: Cope with insults
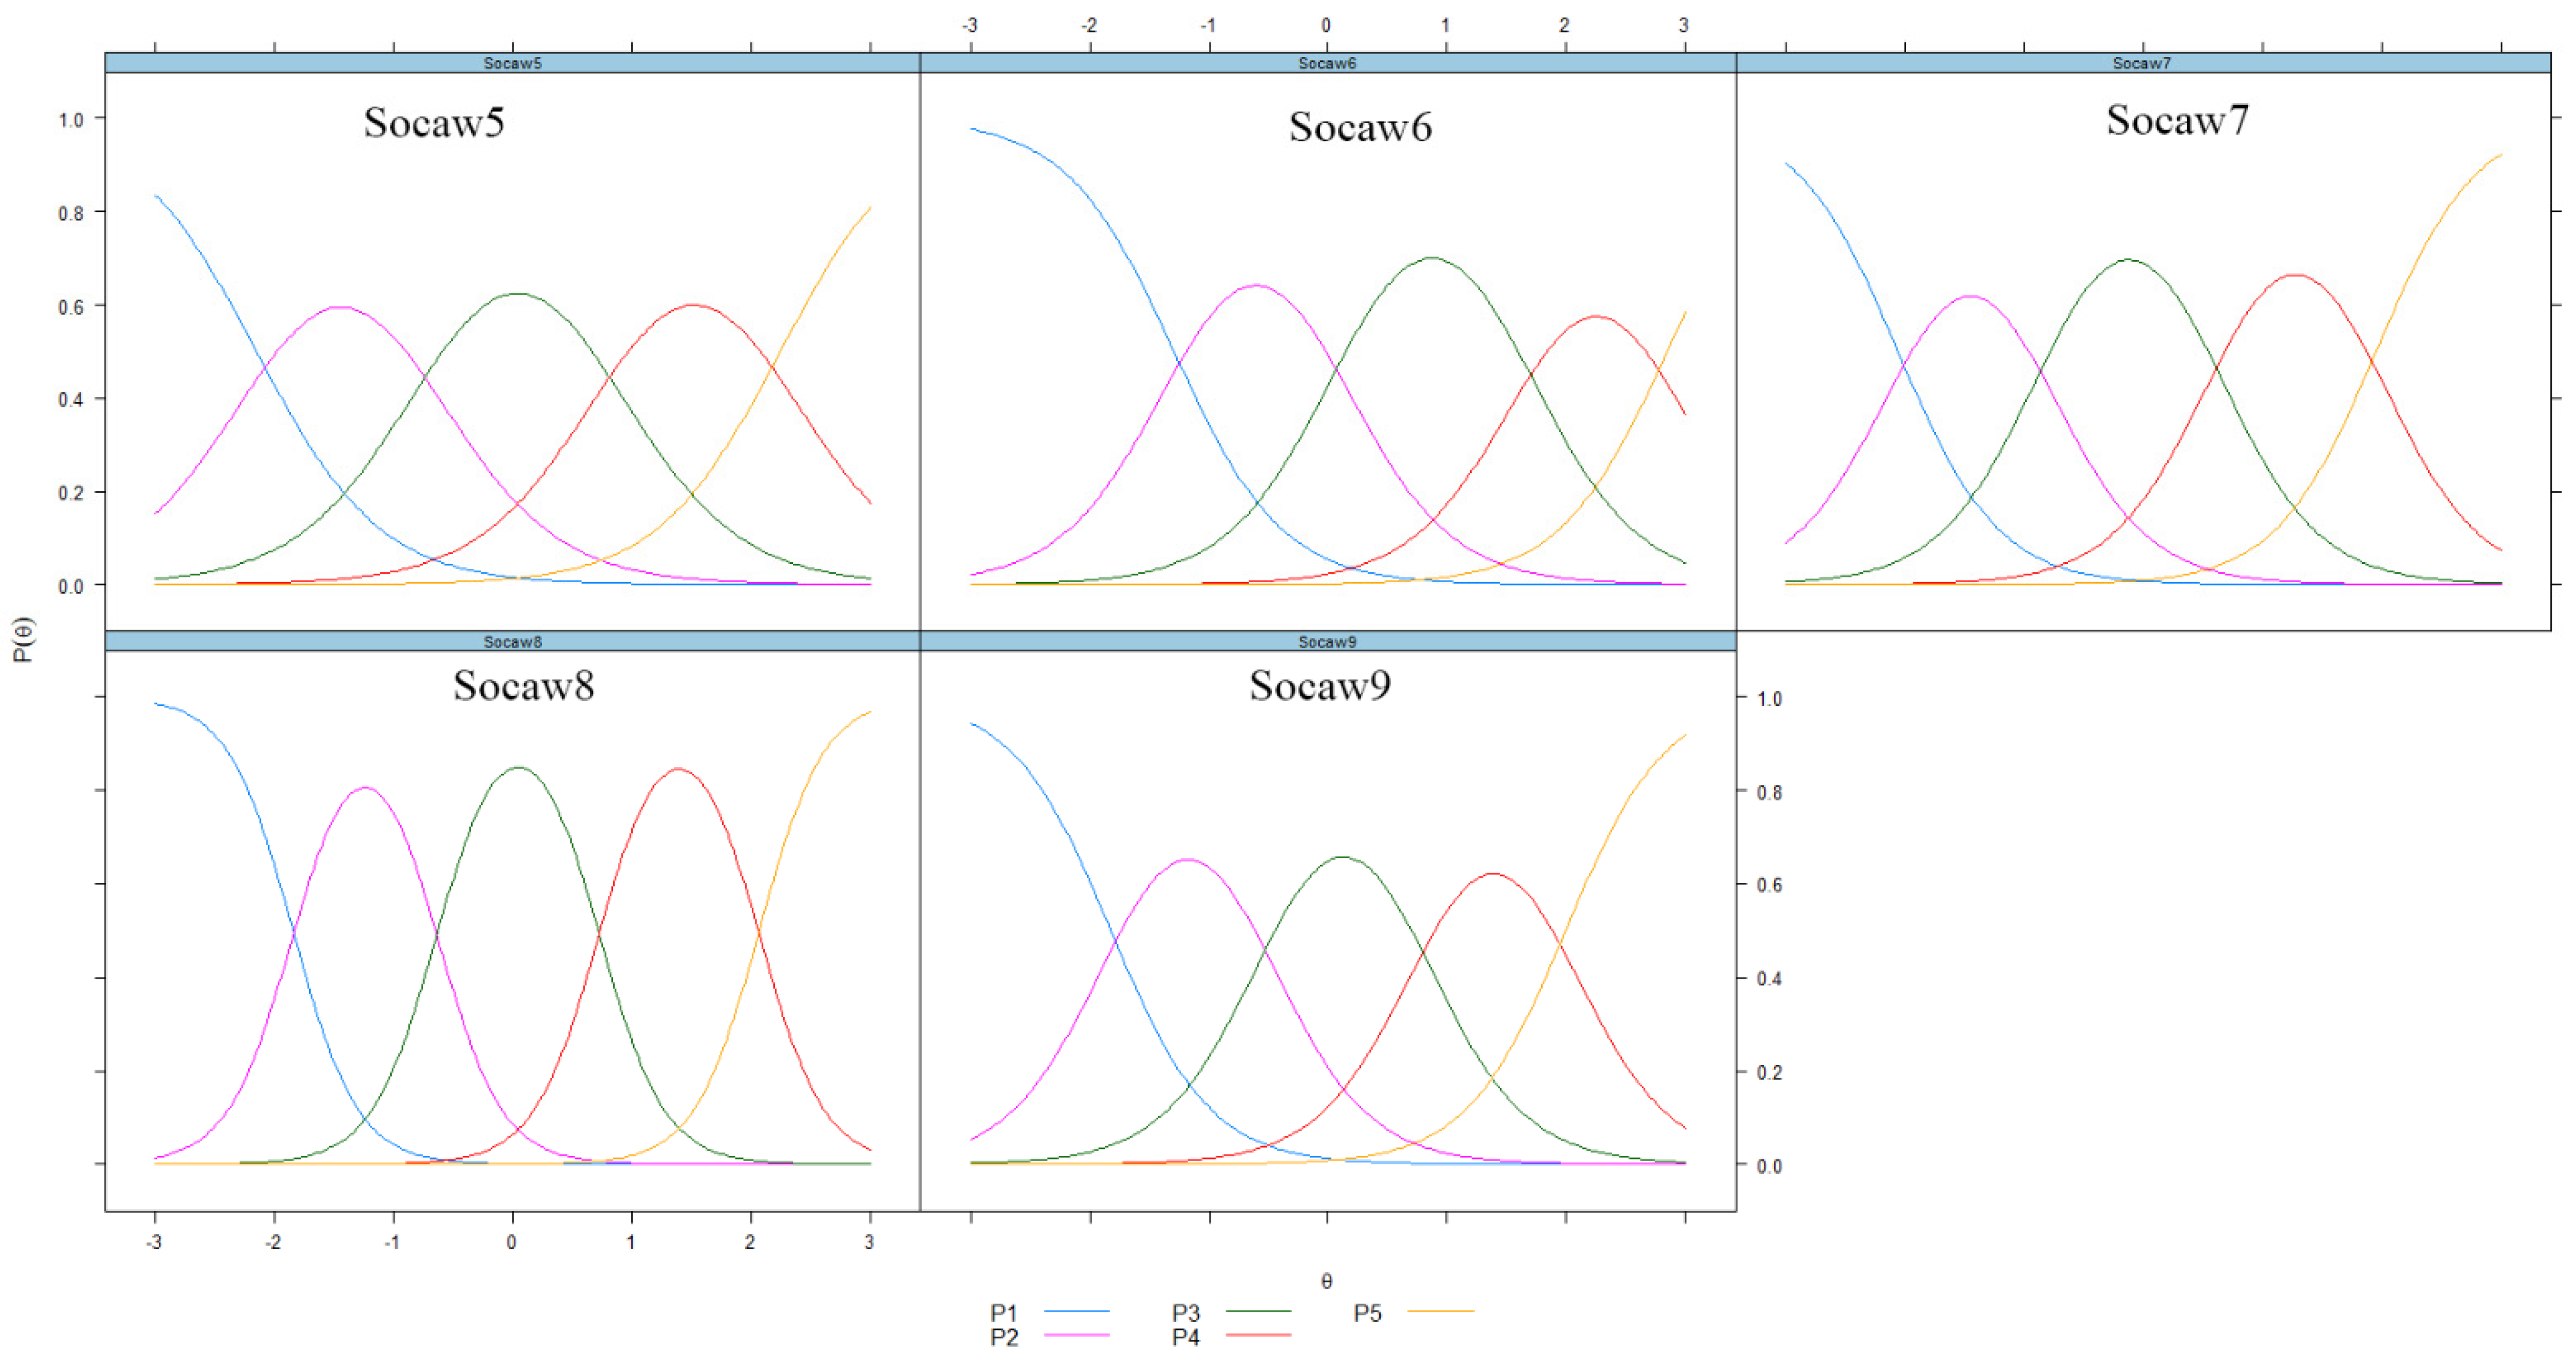
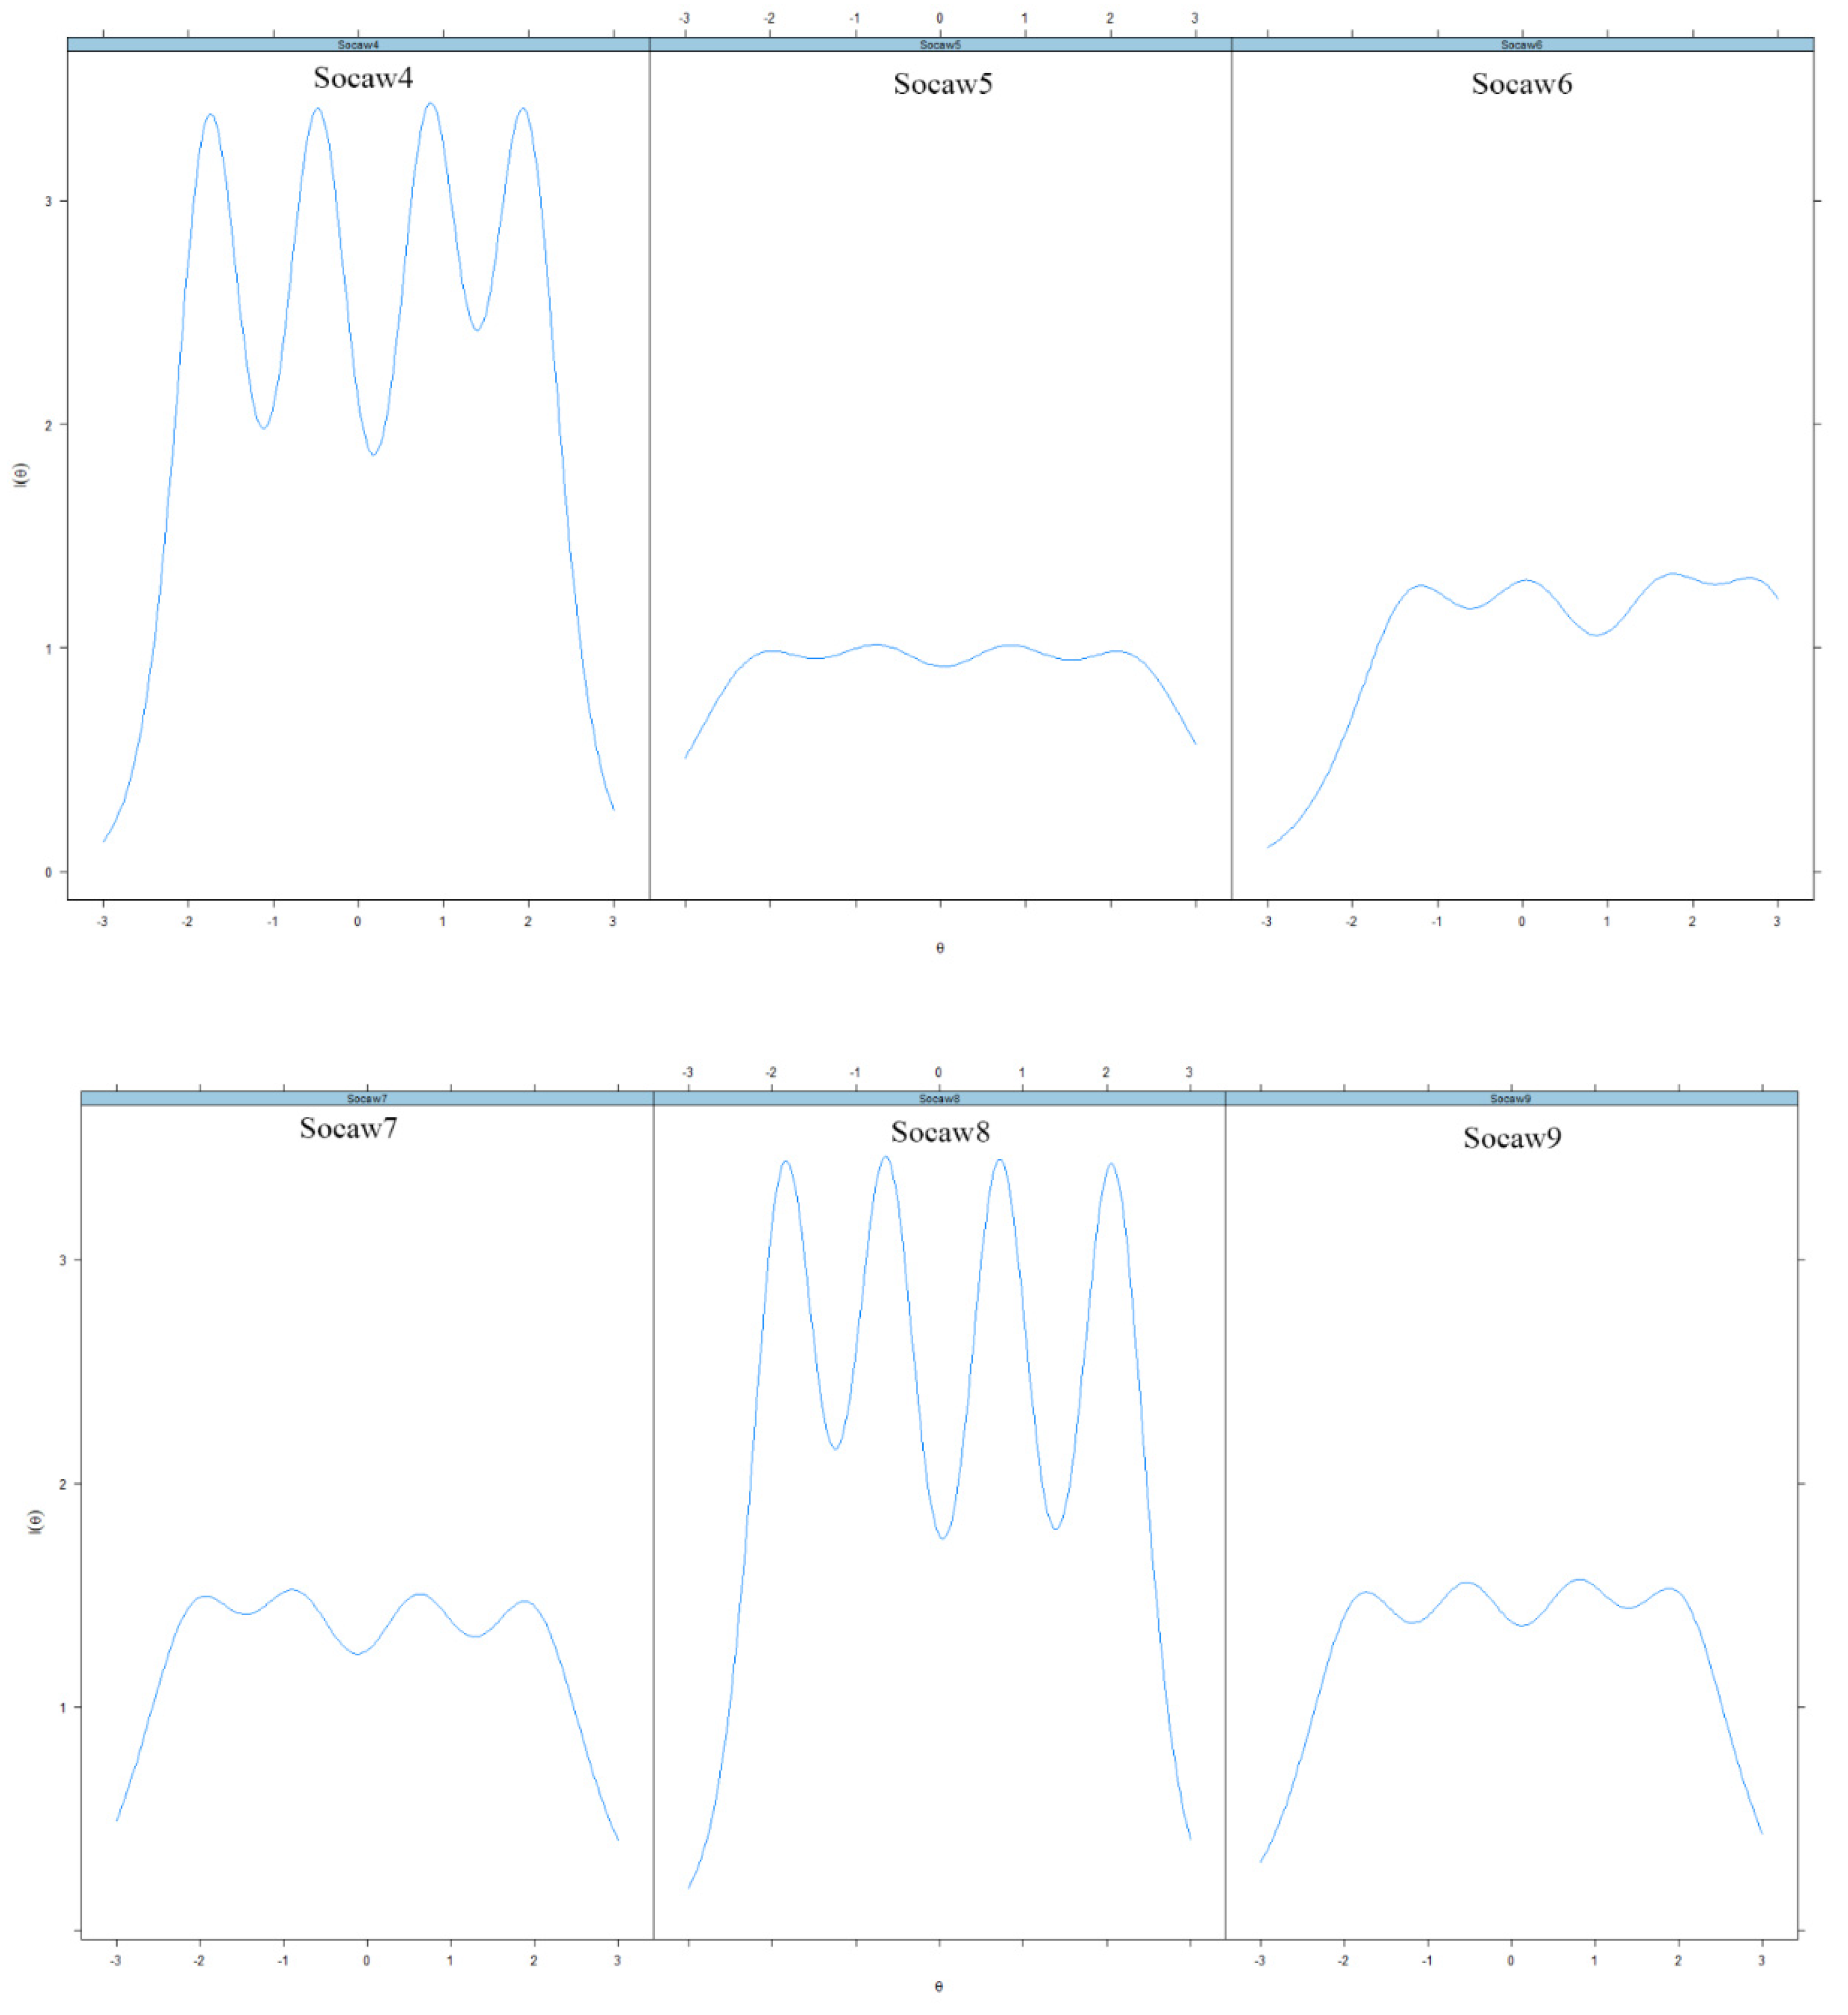
- Socaw 5: Contribute to group efforts
- Socaw 6: Resolve a disagreement
- Socaw 7: Share with others
- Socaw 9: Forgive others who hurt her/him
- Socaw 2: Get along with others
- Socaw 3: Act respectfully when competing
- Socaw 4: Respect another person’s opinion
- Socaw 8: Cooperate with peers or siblings
Limitations
5. Conclusions
Author Contributions
Funding
Institutional Review Board Statement
Informed Consent Statement
Data Availability Statement
Conflicts of Interest
References
- Milsom, A.; Glanville, J.L. Factors Mediating the Relationship Between Social Skills and Academic Grades in a Sample of Students Diagnosed with Learning Disabilities or Emotional Disturbance. Remedial Spec. Educ. 2010, 31, 241–251. [Google Scholar] [CrossRef]
- Adams, D. The application of social-emotional learning principles to a special education environment. KEDI J. Educ. Policy 2013, 10, 103–118. [Google Scholar]
- Espelage, D.L.; Rose, C.; Polanin, J. Social-Emotional Learning Program to Reduce Bullying, Fighting, and Victimization among Middle School Students with Disabilities. Remedial Spec. Educ. 2015, 36, 299–311. [Google Scholar] [CrossRef] [Green Version]
- Espelage, D.L.; Rose, C.; Polanin, J. Social-Emotional Learning Program to Promote Prosocial and Academic Skills among Middle School Students with Disabilities. Remedial Spec. Educ. 2016, 37, 323–332. [Google Scholar] [CrossRef] [Green Version]
- Denham, S. Keeping SEL Developmental: The Importance of a Developmental Lens for Fostering and Assessing SEL Competencies 2018; Social-Emotional Competence Assessments Work Group: Chicago, IL, USA, 2018; pp. 1–13. [Google Scholar]
- Silvia, P.J.; Duval, T.S. Objective Self-Awareness Theory: Recent Progress and Enduring Problems. Pers. Soc. Psychol. Rev. 2001, 5, 230–241. [Google Scholar] [CrossRef]
- Sheldon, K.M.; Johnson, J.T. Forms of Social Awareness: Their Frequency and Correlates. Pers. Soc. Psychol. Bull. 1993, 19, 320–330. [Google Scholar] [CrossRef]
- Ross, K.M.; Tolan, P. Social and Emotional Learning in Adolescence: Testing the CASEL Model in a Normative Sample. J. Early Adolesc. 2017, 38, 1170–1199. [Google Scholar] [CrossRef]
- Denham, S.A.; Bassett, H.H.; Zinsser, K.; Wyatt, T.M. How Preschoolers’ Social-Emotional Learning Predicts Their Early School Success: Developing Theory-Promoting, Competency-Based Assessments. Infant Child Dev. 2014, 23, 426–454. [Google Scholar] [CrossRef]
- Falon, S.L.; Kangas, M.; Crane, M.F. The coping insights involved in strengthening resilience: The Self-Reflection and Coping Insight Framework. Anxiety Stress Coping 2021, 34, 734–750. [Google Scholar] [CrossRef]
- Payton, J.; Roger, W.; Joseph, D. The Positive Impact of Social and Emotional Learning for Kindergarten to Eighth-Grade Students: Findings from Three Scientific Reviews; Technical Report; Collaborative for Academic, Social, and Emotional Learning: Chicago, IL, USA, 2008. [Google Scholar]
- Schonfeld, D.J.; Adams, R.E.; Fredstrom, B.K.; Weissberg, R.P.; Gilman, R.; Voyce, C.; Tomlin, R.; Speese-Linehan, D. Cluster-randomized trial demonstrating impact on academic achievement of elementary social-emotional learning. Sch. Psychol. Q. 2015, 30, 406–420. [Google Scholar] [CrossRef] [Green Version]
- NCSL. Social and Emotional Learning: State Legislation. 2021. Available online: https://www.ncsl.org/research/education/social-emotional-learning.aspx (accessed on 1 January 2021).
- Daley, S.G.; McCarthy, M.F. Students With Disabilities in Social and Emotional Learning Interventions: A Systematic Review. Remedial Spec. Educ. 2020, 42, 384–397. [Google Scholar] [CrossRef]
- Hagarty, I.; Morgan, G. Social-emotional learning for children with learning disabilities: A systematic review. Educ. Psychol. Pract. 2020, 36, 208–222. [Google Scholar] [CrossRef]
- Ura, S.K.; Castro-Olivo, S.M.; D’Abreu, A. Outcome Measurement of School-Based SEL Intervention Follow-Up Studies. Assess. Eff. Interv. 2019, 46, 76–81. [Google Scholar] [CrossRef]
- LeBuffe, P.A.; Shapiro, V.B.; Naglieri, J.A. DESSA Devereux Student Strengths Assessment K-8th Grade; Apperson SEL+: Charlotte, NC, USA, 2014. [Google Scholar]
- Nickerson, A.B.; Fishman, C. Convergent and divergent validity of the Devereux Student Strengths Assessment. Sch. Psychol. Q. 2009, 24, 48–59. [Google Scholar] [CrossRef]
- Haggerty, K.; Elgin, J.; Woolley, A. Social-Emotional Learning Assessment Measures for Middle School Youth; Rakees Foundation: Seattle, WA, USA, 2011. [Google Scholar]
- LeBuffe, P.A.; Shapiro, V.B.; Robitaille, J.L. The Devereux Student Strengths Assessment (DESSA) comprehensive system: Screening, assessing, planning, and monitoring. J. Appl. Dev. Psychol. 2018, 55, 62–70. [Google Scholar] [CrossRef] [Green Version]
- Yang, F.M.; Kao, S.T. Item response theory for measurement validity. Shanghai Arch. Psychiatry 2014, 26, 171–177. [Google Scholar] [CrossRef]
- Nicewander, A. Conditional Reliability Coefficients for Test Scores. Psychol. Methods 2017, 23, 351–362. [Google Scholar] [CrossRef]
- Embretson, S.E.; Reise, P.S. Chapter 5. Polytomous IRT Models. In Item Response Theory; Psychology Press: Mahwah, NJ, USA, 2000. [Google Scholar]
- Susan, E.E.; Steven, P.R. Item Response Theory for Psychologists; Multivariate Applications Book Series; Psychology Press: Mahwah, NJ, USA, 2000. [Google Scholar]
- Zanon, C.; Hutz, C.; Yoo, H.; Hambleton, R.K. An application of item response theory to psychological test development. Psicologia Reflexão e Crítica 2016, 29, 18. [Google Scholar] [CrossRef] [Green Version]
- Reise, S.P.; Ainsworth, A.T.; Haviland, M.G. Item Response Theory: Fundamentals, Applications, and Promise in Psychological Research. Curr. Dir. Psychol. Sci. 2005, 14, 95–101. [Google Scholar] [CrossRef]
- Samejima, F. Chapter 4: The General Graded Response Model; Ostini, R., Nering, M.L., Eds.; Routledge: New York, NY, USA, 2010. [Google Scholar]
- Reise, S.P.; Waller, N.G. Item Response Theory and Clinical Measurement. Annu. Rev. Clin. Psychol. 2009, 5, 27–48. [Google Scholar] [CrossRef] [Green Version]
- Toland, M.D. Practical Guide to Conducting an Item Response Theory Analysis. J. Early Adolesc. 2013, 34, 120–151. [Google Scholar] [CrossRef]
- Bean, G.J.; Bowen, N.K. Item Response Theory and Confirmatory Factor Analysis: Complementary Approaches for Scale Development. J. Evid.-Based Soc. Work 2021, 18, 597–618. [Google Scholar]
- Edelen, M.O.; Reeve, B.B. Applying item response theory (IRT) modeling to questionnaire development, evaluation, and refinement. Qual. Life Res. 2007, 16, 5–18. [Google Scholar] [CrossRef] [PubMed]
- National Center on Birth Defects and Developmental Disabilities. Autism and Developmental Disabilities Monitoring Network—2012. 2012; pp. 1–45. Available online: http://www.cdc.gov/ncbddd/autism/documents/ADDM-2012-Community-Report.pdf (accessed on 13 January 2021).
- IBM Corp. IBM SPSS Statistics for Windows; Verizon 25.0; IBM Corp: Armonk, NY, USA, 2017. [Google Scholar]
- Lorenzo-Seva, U.; Ferrando, V.-C. FACTOR 10.10.03. 2020. Available online: http://psico.fcep.urv.es/utilitats/factor/Download.html (accessed on 2 October 2020).
- R Core Team. R: A Language and Environment for Statistical Computing Computing. 2016. Available online: Https://www.R-project.org/ (accessed on 1 March 2020).
- Desjardins, C.D.; Bulut, O. Handbook of Educational Measurement and Psychometrics Using R; Taylor & Francis Group: Abingdon, UK, 2018. [Google Scholar]
- Forero, C.G.; Maydeu-Olivares, A. Estimation of IRT graded response models: Limited versus full information methods. Psychol. Methods 2009, 14, 275–299. [Google Scholar] [CrossRef] [PubMed] [Green Version]
- Wang, C.; Su, S.; Weiss, D.J. Robustness of Parameter Estimation to Assumptions of Normality in the Multidimensional Graded Response Model. Multivar. Behav. Res. 2018, 53, 403–418. [Google Scholar] [CrossRef]
- Immekus, J.C.; Snyder, K.E.; Ralston, P.A. Multidimensional Item Response Theory for Factor Structure Assessment in Educational Psychology Research. Front. Educ. 2019, 4, 45. [Google Scholar] [CrossRef]
- Nguyen, T.H.; Han, H.-R.; Kim, M.T.; Chan, K.S. An Introduction to Item Response Theory for Patient-Reported Outcome Measurement. Patient Patient-Cent. Outcomes Res. 2014, 7, 23–35. [Google Scholar] [CrossRef] [Green Version]
- Lubbe, D.; Schuster, C. A Graded Response Model Framework for Questionnaires With Uniform Response Formats. Appl. Psychol. Meas. 2018, 43, 290–302. [Google Scholar] [CrossRef]
- Baker, F.B.; Kim, S.H. Chapter 1: The item characteristic curve. In The Basic of Item Response Theory in R; Springer International Publishing: New York, NY, USA, 2017. [Google Scholar]
- Mokken, R.J. A Theory and Procedure of Scale Analysis: With Application in Political Research; The Hague: Mouton: Berlin, Germany, 1971; p. 353. [Google Scholar]
- Ark, L. Mokken scale analysis in R. J. Stat. Softw. 2007, 20, 1–19. [Google Scholar] [CrossRef]
- Timmerman, M.E.; Lorenzo-Seva, U. Dimensionality assessment of ordered polytomous items with parallel analysis. Psychol. Methods 2011, 16, 209–220. [Google Scholar] [CrossRef]
- Ruscio, J.; Roche, B. Determining the number of factors to retain in an exploratory factor analysis using comparison data of known factorial structure. Psychol. Assess. 2012, 24, 282–292. [Google Scholar] [CrossRef] [Green Version]
- Lim, S.; Jahng, S. Determining the number of factors using parallel analysis and its recent variants. Psychol. Methods 2019, 24, 452–467. [Google Scholar] [CrossRef]
- Ferrando, P.J.; Lorenzo-Seva, U. Assessing the quality and appropriateness of factor solutions and factor score estimates in exploratory factor score estimates in exploratory item factor analysis. Educ. Psychol. Meas. 2018, 78, 762–780. [Google Scholar] [CrossRef]
- Shi, D.; Lee, T.; Maydeu-Olivares, A. Understanding the Model Size Effect on SEM Fit Indices. Educ. Psychol. Meas. 2018, 79, 310–334. [Google Scholar] [CrossRef] [PubMed]
- Chen, W.H.; Thissen, D. Local dependence indices for item pairs using item response theory. J. Educ. Behav. Stat. 1997, 22, 265–289. [Google Scholar] [CrossRef]
- Edwards, M.C.; Houts, C.R.; Cai, L. A diagnostic procedure to detect departures from local independence in item response theory models. Psychol. Methods 2018, 23, 138–149. [Google Scholar] [CrossRef] [PubMed]
- Maydeu-Olivares, A. Goodness-of-Fit Assessment of Item Response Theory Models. Meas. Interdiscip. Res. Perspect. 2013, 11, 71–101. [Google Scholar] [CrossRef]
- Hu, L.T.; Bentler, P.M. Cutoff criteria for fit indexes in covariance structure analysis: Conventional criteria versus new alternatives. Struct. Equ. Model. Multidiscip. J. 1999, 6, 1–55. [Google Scholar] [CrossRef]
- Xu, J.; Paek, I.; Xia, Y. Investigating the Behaviors of M2 and RMSEA2 in Fitting a Unidimensional Model to Multidimensional Data. Appl. Psychol. Meas. 2017, 41, 632–644. [Google Scholar] [CrossRef]
- Baker, F.B. The Basics of Item Response Theory; ERIC Clearinghouse on Assessment and Evaluation, University of Marylandl: College Park, MD, USA, 2001. [Google Scholar]
- Andersson, B.; Xin, T. Large Sample Confidence Intervals for Item Response Theory Reliability Coefficients. Educ. Psychol. Meas. 2017, 78, 32–45. [Google Scholar] [CrossRef] [Green Version]
- Schmidt, F.; DeGeest, D.S. A Rigorous Test of the Fit of the Circumplex Model to Big Five Personality Data: Theoretical and Methodological Issues and Two Large Sample Empirical Tests. Multivar. Behav. Res. 2015, 50, 350–364. [Google Scholar] [CrossRef]


| Mean + | SD | Item Total Correlation | F1(h2) ++ | |
|---|---|---|---|---|
| Self-Awareness (α = 0.89) | ||||
| Self 1. Accurately talks about life events? | 1.80 | 0.86 | 0.62 | 0.70 (0.49) |
| Self 2. Teaches others to do something? | 1.63 | 0.98 | 0.70 | 0.82 (0.68) |
| Self 3. Ask questions to clarify | 1.71 | 1.00 | 0.73 | 0.87 (0.76) |
| understanding? | ||||
| Self 4. Is aware of personal strengths? | 1.62 | 0.97 | 0.78 | 0.90 (0.81) |
| Self 5. Ask for feedback? | 1.43 | 0.98 | 0.69 | 0.85 (0.73) |
| Self 6. Describes feelings? | 1.76 | 0.92 | 0.65 | 0.71 (0.50) |
| Self 7. Give an opinion when asked? | 2.18 | 0.92 | 0.59 | 0.71 (0.50) |
| Social Awareness (α = 0.93) | ||||
| Socaw 1. Cope with insults? | 1.20 | 0.93 | 0.65 | 0.74 (0.56) |
| Socaw 2. Get along with others? | 1.95 | 0.90 | 0.75 | 0.86 (0.74) |
| Socaw 3. Act respectfully when competing? | 1.89 | 0.90 | 0.76 | 0.88 (0.77) |
| Socaw 4. Respect another person’s opinion? | 1.77 | 0.89 | 0.81 | 0. 91 (0.82) |
| Socaw 5. Contribute to group efforts? | 1.90 | 0.95 | 0.65 | 0.75 (0.56) |
| Socaw 6. Resolve a disagreement? | 1.27 | 0.89 | 0.69 | 0.80 (0.66) |
| Socaw 7. Share with others? | 1.94 | 0.94 | 0.73 | 0.81 (0.66) |
| Socaw 8. Cooperate with peers or siblings? | 1.84 | 0.85 | 0.80 | 0.91 (0.82) |
| Socaw 9. Forgive others who hurt her/him? | 1.74 | 0.96 | 0.74 | 0.82 (0.67) |
| a | b1 | b2 | b3 | b4 | b4 − b1 | |
|---|---|---|---|---|---|---|
| Self-Awareness + | ||||||
| Self 1. Accurately talks about life events? | 1.818 | −2.125 | −0.534 | 1.215 | 2.861 | 4.986 |
| Self 2. Teaches others to do something? | 2.334 | −1.339 | −0.228 | 1.203 | 2.345 | 3.684 |
| Self 3. Ask questions to clarify understanding? | 2.778 | −1.319 | −0.262 | 0.923 | 2.249 | 3.568 |
| Self 4. Is aware of personal strengths? | 3.466 | −1.243 | −0.124 | 1.021 | 2.226 | 3.469 |
| Self 5. Ask for feedback? | 2.534 | −1.064 | 0.084 | 1.397 | 2.322 | 3.386 |
| Self 6. Describes feelings? | 1.887 | −1.872 | −0.396 | 1.155 | 2.594 | 4.466 |
| Self 7. Give an opinion when asked? | 1.681 | −2.854 | −1.050 | 0.633 | 2.045 | 4.899 |
| Social Awareness ++ | ||||||
| Socaw 1. Cope with insults? | 1.847 | −0.959 | 0.463 | 1.829 | 3.450 | 4.409 |
| Socaw 2. Get along with others? | 2.661 | −1.979 | −0.628 | 0.754 | 2.251 | 4.230 |
| Socaw 3. Act respectfully when competing? | 3.043 | −1.868 | −0.579 | 0.926 | 1.950 | 3.818 |
| Socaw 4. Respect another person’s opinion? | 3.589 | −1.657 | −0.372 | 1.022 | 2.118 | 3.775 |
| Socaw 5. Contribute to group efforts? | 1.874 | −2.058 | −0.583 | 0.928 | 2.329 | 4.388 |
| Socaw 6. Resolve a disagreement? | 2.176 | −1.042 | 0.302 | 1.954 | 3.001 | 4.043 |
| Socaw 7. Share with others? | 2.570 | −1.836 | −0.624 | 0.741 | 2.160 | 3.995 |
| Socaw 8. Cooperate with peers or siblings? | 3.448 | −1.771 | −0.523 | 0.959 | 2.267 | 4.039 |
| Socaw 9. Forgive others who hurt her/him? | 2.417 | −1.591 | −0.315 | 1.011 | 2.377 | 3.968 |
| S-χ2 | P | RMSEA S-χ2 | ||
|---|---|---|---|---|
| Self-Awareness | Self1 | 23.536 | 0.656 | 0.055 |
| Self2 | 37.511 | 0.067 | 0.028 | |
| Self3 | 22.952 | 0.464 | 0.006 | |
| Self4 | 21.743 | 0.475 | 0.022 | |
| Self5 | 16.554 | 0.897 | 0.015 | |
| Self6 | 37.229 | 0.114 | 0.000 | |
| Self7 | 19.282 | 0.420 | 0.040 | |
| Social-Awareness | Socaw1 | 39.440 | 0.405 | 0.028 |
| Socaw2 | 17.725 | 0.886 | 0.000 | |
| Socaw3 | 21.476 | 0.805 | 0.022 | |
| Socaw4 | 25.410 | 0.384 | 0.000 | |
| Socaw5 | 36.481 | 0.672 | 0.011 | |
| Socaw6 | 43.848 | 0.079 | 0.026 | |
| Socaw7 | 24.290 | 0.714 | 0.019 | |
| Socaw8 | 16.051 | 0.886 | 0.000 | |
| Socaw9 | 32.082 | 0.463 | 0.013 | |
Publisher’s Note: MDPI stays neutral with regard to jurisdictional claims in published maps and institutional affiliations. |
© 2022 by the authors. Licensee MDPI, Basel, Switzerland. This article is an open access article distributed under the terms and conditions of the Creative Commons Attribution (CC BY) license (https://creativecommons.org/licenses/by/4.0/).
Share and Cite
Adams, D.; Farmer, G.L. Graded Response Modeling of the DESSA’s Self- and Social Awareness Subscales in a Special Needs Sample. Youth 2022, 2, 98-112. https://doi.org/10.3390/youth2020008
Adams D, Farmer GL. Graded Response Modeling of the DESSA’s Self- and Social Awareness Subscales in a Special Needs Sample. Youth. 2022; 2(2):98-112. https://doi.org/10.3390/youth2020008
Chicago/Turabian StyleAdams, David, and Gregory Lawrence Farmer. 2022. "Graded Response Modeling of the DESSA’s Self- and Social Awareness Subscales in a Special Needs Sample" Youth 2, no. 2: 98-112. https://doi.org/10.3390/youth2020008
APA StyleAdams, D., & Farmer, G. L. (2022). Graded Response Modeling of the DESSA’s Self- and Social Awareness Subscales in a Special Needs Sample. Youth, 2(2), 98-112. https://doi.org/10.3390/youth2020008