Article

Quantification of Yield Gain from Bifacial PV Modules in Multi-Megawatt Plants with Sun-Tracking Systems

1
Dipartimento Energia “Galileo Ferraris”, Politecnico di Torino, 10129 Torino, Italy
2
Engie Energies Italia S.r.l., 20126 Milano, Italy
*
Author to whom correspondence should be addressed.
Solar 2025, 5(4), 49; https://doi.org/10.3390/solar5040049
Submission received: 10 July 2025 / Revised: 7 September 2025 / Accepted: 25 September 2025 / Published: 21 October 2025

Abstract

Nowadays, bifacial photovoltaic (PV) technology has emerged as a key solution to enhance the energy yield of large-scale PV plants, especially when integrated with sun-tracking systems. This study investigates the quantification of bifaciality productivity for two multi-MW PV plants in southern Italy (Sicily) equipped with monocrystalline silicon bifacial modules installed on single-axis east–west tracking systems and aligned in the north–south direction. An optimized energy model was developed at the stringbox level, employing a dedicated procedure including data filtering, clear-sky condition selection, and numerical estimation of bifaciality factors. The model was calibrated using on-field measurements acquired during the first operational months to minimize uncertainties related to degradation phenomena. The application of the model demonstrated that the rear-side contribution to the total energy output is non-negligible, resulting in additional energy gains of approximately 5.3% and 3% for the two plants, respectively.

1. Introduction

In recent years, photovoltaic (PV) technology has become one of the most promising in the energy transition towards carbon neutrality thanks to its reliability, abundance, and absence of polluting emissions. Actual fields of research focus on the manufacturing of modules including crystalline silicon (c-Si) and organic material, with spectral response in different wavelength ranges with respect to c-Si wafers, to improve their global conversion efficiency [1]. Another field of research involves the integration between PV systems and agricultural cultures to maximize the exploitation of terrains [2]. In this context, the bifacial PV modules are gaining importance in the market as they permit the enhancement of the conversion efficiency of PV generators due to the additional contribution on their rear side, unlike monofacial systems [3]. This technology, introduced in the late 1970s for space and terrestrial applications, is expected to become dominant in the market by 2030. According to the ITRPV 2023 report, bifacial modules account for over 35% of new PV installations in 2023, and their market share is expected to exceed 70% by 2030, primarily in large-scale utility applications [4]. Several studies and scientific reports have highlighted the advantages of combining bifacial PV modules with single-axis tracking systems aligned in the north–south direction, which consist of varying the orientation from east to west and the inclination of generators to maximize their electrical power output [4,5,6] In these systems, the energy output for bifacial generators generally offsets the slightly higher system costs, making the investment more attractive than monofacial modules. For installations without sun-tracking systems, the yearly energy production from bifacial modules can increase up to 35% with respect to the conventional monofacial crystalline silicon ones [7], with a reduction in terms of Levelized Cost of Electricity ( L C O E ) up to 16% [8]. This gain due to the tracking system is evident also with respect to monofacial systems. Indeed, the integration of a tracking system provides energy gains up to 15–20%, with additional contributions due to the bifacial technology in the range from 2 to 10% [8]. Despite these advantages, the adoption of this technology is limited by the higher difficulty while estimating the rear production of bifacial PV modules. This is due to the spatial nonuniformity of the solar irradiance reaching the rear surface of the generators, caused by variations in ground albedo and shadowing from support structures [9]. These factors can lead to electrical mismatch between PV modules, affecting the energy production [10]. For these reasons, dedicated energy models are required to accurately assess the yearly PV output, in particular for systems incorporating solar trackers. A key parameter for characterizing the performance of bifacial modules is the bifaciality factor ( B F ), defined as the ratio between the rear and front power outputs [11] under standard test conditions (STC, corresponding to solar irradiance = 1000 W/m2; modules temperature = 25 °C; air mass = 1.5).
The value of B F is strongly affected by the PV technology; this parameter ranges from 65 to 75% for Passivated Emitter and Rear Cell (PERC) modules [12], while it can exceed 90% for Tunnel Oxide Passivated Contacts (TOPCon) and Heterojunction with Intrinsic Thin Layer (HJT) technologies [3,13]. Existing models in the literature are valid for monofacial PV modules, or they require the knowledge of the I-V curves for their training [14]. This work proposes an energy model for two utility-scale PV plants installed in southern Italy with bifacial modules, mono-axis east–west sun-tracking systems, and rated DC power higher than 30 MW. The layout of the PV systems under analysis is as follows. Many PV modules are connected in series to form strings, which are then grouped within stringboxes to facilitate the electrical protection and monitoring. Each stringbox aggregates the DC output of a variable number of PV strings to combine the DC current reaching the inverter input. The protection devices of each stringbox include individual string protection through DC fuses and one Surge Protection Device (SPD), while each inverter is equipped with a DC disconnector switch to ensure safe isolation of the PV array. This modular configuration allows for flexible system design and scalability while ensuring reliable operation and ease of maintenance. The proposed energy model is developed at the stringbox level and is the result of optimisations performed on experimental data acquired in-field during the early operating months of the plants. The optimized model permits evaluating the rear energy output for both systems. The paper is structured as follows. Section 2 presents the state of the art for bifacial PV modules, while Section 3 proposes the methodology used to develop the energy model for the two plants under study. Section 4 describes the PV systems under analysis, and Section 5 includes the results of the study. Finally, Section 6 contains the conclusions.

2. Bifacial Technology: State of the Art

The majority of bifacial PV modules are characterized by PERC technology, with front-side efficiencies in the range of 21–22% and a bifaciality factor between 65% and 75%. Despite their cost-effectiveness and high compatibility with existing manufacturing lines, the bifacial response of PERC modules is limited due to the partial metallization on the rear surface and suboptimal light transmission. Although this technology is currently dominant in utility-scale installations thanks to its low cost and high in-stock availability [4], more advanced architectures, such as Tunnel Oxide Passivated Contact (TOPCon), are gaining increasing market shares thanks to their higher efficiency and better passivation. Indeed, TOPCon modules reach front-side efficiencies in the range of 22–23.5% and bifaciality factors of up to 90%. Their symmetrical cell structure allows for improved rear-side light collection, resulting in increased rear production and making their installation suggested on elevated structures or grounds with high reflectance [15]. On the contrary, the highest bifacial performance is currently offered by Heterojunction (HJT) technology. These modules combine mono-crystalline (m-Si) silicon wafers with thin amorphous silicon (a-Si) layers on both sides, achieving front-side efficiencies of 22.5–24% and bifaciality factors consistently above 90%. The presence of a-Si permits having a low temperature coefficient on maximum power, thus enhancing their performance in hot climates. While production costs are higher compared to PERC and TOPCon, their higher bifacial gain and thermal stability make this technology attractive for high-irradiance environments [16]. Interdigitated Back Contact (IBC) cells are less common in bifacial form due to their complex fabrication process [17] but represent another high-efficiency option, with front-side efficiencies around 24% and BF values between 85% and 95%. To ensure accurate performance evaluation of bifacial modules, the international standards in the following list have been developed:
  • IEC 61215-2:2021 extends conventional qualification testing to bifacial modules by including specific procedures that account for rear-side irradiance response. For instance, in thermal cycling, hot-spot, and mechanical stress tests, a reflective background or controlled rear-side irradiance is introduced to simulate realistic bifacial operating conditions. Typical rear-side irradiance levels used in testing are around 20% of the front-side irradiance (e.g., 200 W/m2 rear on 1000 W/m2 front) [18].
  • IEC TS 60904-1-2:2019 outlines procedures for I–V curve measurements on bifacial PV modules, requiring separate and controlled illumination of both the front and rear surfaces. The standard recommends uniform rear-side irradiance within a representative range—typically between 10% and 30% of the front irradiance—depending on the intended application. The use of bifacial reference cells or dedicated rear irradiance sensors is advised to ensure accurate characterization [19].
  • IEC 61724-1:2021 provides monitoring guidelines for PV systems, including the use of bifacial reference cells and the Bifacial Nameplate Irradiance (BNPI) which is a reference cumulative irradiance defined as the sum of front and rear irradiance under standard test conditions (STC). BNPI is used to predict the rated power of bifacial modules under predefined lighting conditions, generally assuming a 20% rear-to-front irradiance ratio (i.e., 200 W/m2 rear, 1000 W/m2 front) [20].
  • IEC 62804-1:2015 and IEC 62804-2:2019 address potential-induced degradation (PID) under different voltage levels and polarities. For bifacial modules, both sides are exposed to stress conditions that could trigger PID, including elevated system voltages (up to ±1000 V or ±1500 V) in humid and high-temperature environments [21,22].
  • IEC 61853 series (parts 1–4) provides a framework for PV energy rating and performance modeling. For bifacial modules, the standard allows testing under realistic climate conditions, accounting for temperature, solar spectrum, and angle of incidence. Rear-side exposure is ensured by using high-albedo surfaces (typically ≥ 0.3) or mounting configurations that allow unobstructed rear irradiance. The evaluation may include measurement of the bifacial gain and simulation using tools such as PVsyst [23].

3. Proposed Methodology

This section describes the procedure used to develop the optimized energy model applied to the PV plants under study. Specifically, the methodology consists of five steps, presented in the flowchart in Figure 1.

3.1. Step #1: Data Filtering

The first step of the procedure aims to identify a suitable dataset for the optimization process. In this context, ad hoc filters have been developed for this goal, and applied to power profiles with granularity of 1 min. These filters are briefly described in the following list:
  • Selection of diurnal data: The scope of this filter is excluding nightly data or diurnal data with low irradiance, measured by front pyranometers ( G > G 0 ). The choice of G 0 can vary, but this procedure suggests assuming G 0 = 15 W/m2 to remove data with a PV voltage lower than the startup voltage of the inverters.
  • Removal of unrealistic data: This filter aims to exclude measurements affected by unrealistic DC/AC conversion efficiency at the inverter level. In particular, the DC/AC efficiency η DC / AC is computed for each inverter as the ratio between AC and DC power ( P AC and P DC , respectively), and data with η DC / AC 99.5 % (maximum efficiency from the inverter datasheet) are excluded.
  • Removal of unstable conditions: This filter is applied to exclude data affected by abrupt variations of weather conditions in terms of irradiance (G) and ambient temperature ( T a ). Indeed, for each weather quantity acquired at the jth time instant ( x j ), the variations with respect to the jth − 1 and jth + 1 instants are computed as follows:
    Δ x j = x j + 1 x j 2 + x j 1 x j 2 3 x j 3 · 100
    where Δ x j is the global variation of the generic quantity x with respect to previous ( x j 1 ) and next ( x j + 1 ) time instants. The filter excludes data corresponding to Δ G j and Δ T a , j higher than ±20 W/m2 and 3%, respectively.
  • Removal of data affected by clipping: Generally, the owner of the PV plant signs a contract with the Distribution System Operator (DSO) reporting the maximum power that can be injected into the electrical grid. In the time slots of clear sky days with high irradiance (central hours), the PV output might exceed the maximum power the DSO allows to be injected into the grid. In this case, an electronic control of the DC/AC converters shifts the operating point of the PV generators to the optimal condition. As a consequence, the AC power output flattens to meet the global maximum power allowed by the DSO.

3.2. Step #2: Selection of Clear Sky Conditions

This step selects the data corresponding to the optimal operation of the plant. It is known that shadowing and other non-optimal conditions might significantly affect the performance of the energy model. Therefore, optimal data are used to train the optimized energy model in order to numerically determine the related coefficients of the model at stringbox level for the PV plant under study. In this context, the optimal data are selected by following a direct proportionality between front plane-of-array irradiance and current.
Specifically, the following steps have been followed for each string box:
  • Evaluation of current at Maximum Power Point (MPP). For any weather condition (irradiance and ambient temperature), the current at the MPP I M P P is evaluated according to the following equation:
    I MPP = I MPP , STC · G f + B F · G b G STC · 1 + α · Δ T
    where
    I MPP , STC is the MPP current at standard test conditions (STC) for each stringbox;
    G f is the plane-of-array irradiance acquired by SCADA of front pyranometers;
    B F is the bifaciality factor;
    G b is the irradiance acquired by SCADA of rear pyranometers;
    G STC is the irradiance at standard test conditions (STC) (1000 W/m2);
    α is the temperature coefficients related to the short-circuit current;
    Δ T is the temperature difference between module and STC temperatures (°C).
  • For each time instant, the comparison between the MPP current I M P P and the value stored by the SCADA I m e a s is performed, and the following condition is investigated:
    0.05 < Δ I I meas = I MPP , model I meas I meas < 0.05
    If the relative deviation between the two currents is not in the range ± 5%, the data are removed. The value 5% is chosen according to the uncertainties of the measuring instrumentation [24,25,26]. Indeed, for large-scale PV plants, a global uncertainty of ± 5% is reasonable for acquisition systems, taking into account the error contributions due to the measurement of electrical quantities (voltage, current, and power), environmental quantities (front and rear irradiances and ambient temperature), and mechanical quantities (slopes of tracking systems).
  • Construction of the final dataset for the optimal training of the model. The following quantities are provided as inputs to the optimization stage of the procedure:
    Irradiance acquired by on-site pyranometers, installed upward and downward with respect to PV modules;
    Air temperature acquired by a weather station;
    DC Current and power at stringbox level.

3.3. Step #3: Estimation of Bifaciality Factor

The optimization procedure is split into two steps. The model proposed in this work is based on the Osterwald model, which is the most common in the literature; this model is semi-empirical and states a proportional relationship between DC power and incident irradiance, with the temperature contribution modelled using a proper coefficient. However, the formulation of the Osterwald model is not specifically tailored for bifacial photovoltaic technologies. To address this limitation, an improved version of this model has been employed to take into account bifacial performance. This additional contribution is modeled by a coefficient, namely the bifaciality factor, which is defined as the ratio between the rear and the front power outputs of bifacial PV modules. This improved formulation has been subject to an optimization procedure to numerically determine two quantities: the bifaciality factor B F and the efficiency η I taking into account losses due to dirt, reflection, mismatch, MPP tracking, and others. Indeed, an optimization has been carried out for the following equation:
I MPP = I MPP , STC · G front + B F · G back G S T C · 1 + α T · Δ T · η I
To this end, the trust region reflective algorithm has been applied to data with rear irradiance greater than 10 W/m2.
This algorithm is a well-established method for solving nonlinear least-squares problems subject to simple bound constraints. Its implementation relies on the trust-region framework, in which the nonlinear objective function is locally approximated by a quadratic model. At each iteration, a trial step is computed by minimizing this quadratic model within a neighborhood (the trust region) whose size is adaptively adjusted according to the agreement between the predicted and actual reduction in the objective function. If the trial step remains within the feasible region, it is accepted; otherwise, a reflective strategy is employed, in which the step is projected back onto the boundary defined by the variable constraints. The algorithm exhibits high robustness in constrained problems like complex nonlinear equations. In the present work, the optimization procedure was carried out by setting the constraint tolerance to 1 · 10 8 , the step tolerance to 1 · 10 12 , the maximum number of iterations to 200, and the maximum number of function evaluations to 2 · 10 4 .
The objective function is the sum of the ith squares of the differences between the MPP current estimated by the proportionality law and the experimental value:
min i N I MPP , i I meas , i 2
where N is the number of measurements. In addition, the lower and upper boundaries of the optimization are as follows: 0.65 and 0.75 for the BF; 0 and 1 for the efficiency η I . The starting values are 0.7 (BF) and 90% ( η I ). The choice of performing the optimization for evaluating the B F on current data rather than using power data was done to avoid the higher temperature effects on power data.

3.4. Step #4: Estimation of Temperature Coefficient and Global Efficiency

After the numerical determination of the B F , a second optimization has been carried out to assess the temperature coefficients related to the maximum power γ P and the global efficiency of the stringboxes η P , which quantifies losses due to Joule effect in the cables, dirt, reflection, mismatch, MPP tracking, and others. In particular, an additional filter has been included to select data with values of front irradiance higher than 600 W/m2. The optimization is performed by applying the trust region reflective algorithm to the following formulation:
P DC = P STC · G f + B F · G b G STC · 1 + γ P · Δ T · η P
where P DC is the DC maximum power at any weather condition for each stringbox and P STC is the DC maximum power at standard test conditions (STC) for each stringbox.
In this case, the goal of the algorithm is minimizing the sum of the ith squares of the differences between the DC power P DC estimated by the proportionality law and the experimental value P meas :
min i P DC , i P meas , i 2
Similarly, the optimization algorithm requires defining the upper and lower bounds for each variable subjected to optimization, being −0.50%/°C and −0.35%/°C for γ P and 80% and 100% for the efficiency η P . The initial values are −0.35%/°C ( γ P ) and 90% ( η P ).
The quality of the optimization is investigated by evaluating the Normalized Root Mean Square Error ( N R M S E ), which is defined according to the following equation:
N R M S E X = X meas , i X i 2 N X meas , i N · 100
where
  • N R M S E X is the normalized error for the assessment of the generic X quantity;
  • X meas , i is the ith measurement stored by the SCADA system;
  • X i is the ith value calculated with models;
  • N is the number of data.

3.5. Step #5: Evaluation of Bifacial Contribution

The goal of the previous section is the identification of the optimal set of coefficients ( BF , γ P and η P ) for all the stringboxes of the PV system under analysis. These sets of coefficients are used to build the optimized energy model, which estimates the AC power at plant level P AC as the sum of the power of each kth stringbox P AC , k in the following way:
P AC = k = 1 N s b P AC , k = k = 1 N s b P STC , k · G f , k + B F k · G b , k G STC · 1 + γ P , k · Δ T k · η P , k · η w , k
where
  • P STC , k is the DC power at STC for the kth stringbox;
  • G f , k is the plane-of-array irradiance acquired by SCADA of front pyranometers installed in area including the kth stringbox;
  • G b , k is the irradiance acquired by SCADA of rear pyranometers installed in area including the kth stringbox;
  • B F k is the bifaciality factor for the kth stringbox;
  • G STC is the irradiance at standard test conditions (STC) (1000 W/m2);
  • γ P , k is the temperature coefficient related to the maximum power for the kth stringbox;
  • Δ T k is the temperature difference between module and STC temperatures for the kth stringbox;
  • η P , k is the efficiency, taking into account losses due to dirt, reflection, mismatch, and MPP tracking;
  • η w , k is the efficiency, taking into account Joule losses.
The energy generated by the plant under analysis E AC is computed as the integration of the power data P AC . The front and rear contributions ( P AC , f and P AC , r ) are evaluated according to the following simplified versions of Equation (9):
P AC , f = k = 1 N s b P AC , k , f = k = 1 N s b P STC , k · G b , f G STC · 1 + γ P , k · Δ T k · η P , k · η w , k
P AC , r = k = 1 N s b P AC , k , r = k = 1 N s b P STC , k · B F k · G b , k G STC · 1 + γ P , k · Δ T k · η P , k · η w , k
Finally, the bifacial energy E AC , r and the front energy E AC , f are evaluated as the integration of P AC , r and P AC , f , respectively.

4. PV Plants Under Study

This paper defines an optimized energy model for two PV plants installed in southern Italy (Sicily) owned by the company Engie Energies Italia S.r.l. (Milano, Italy).

4.1. PV Plant #1

The PV plant #1 occupies an area of approximately 115 hectares. The system has a rated power of 66 MW and is subject to a regulatory restriction that limits the maximum power injected into the electrical grid (50 MW). The plant includes bifacial PV modules with monocrystalline silicon and half-cell technologies; the modules are installed on mono-axial east–west sun-tracking systems, with a tracking range of 120° (60° E–60° W) and aligned in the north–south direction.

4.2. PV Plant #2

The PV plant #2 covers an area of about 80 hectares. The main difference between the plants regards the size and the layout in terms of the number of stringboxes. Indeed, this plant includes a lower number of PV generators, resulting in a nominal power of 39 MW. Moreover, the plant is equipped with the same PV modules, solar trackers, and DC/AC converters installed in the plant #1.
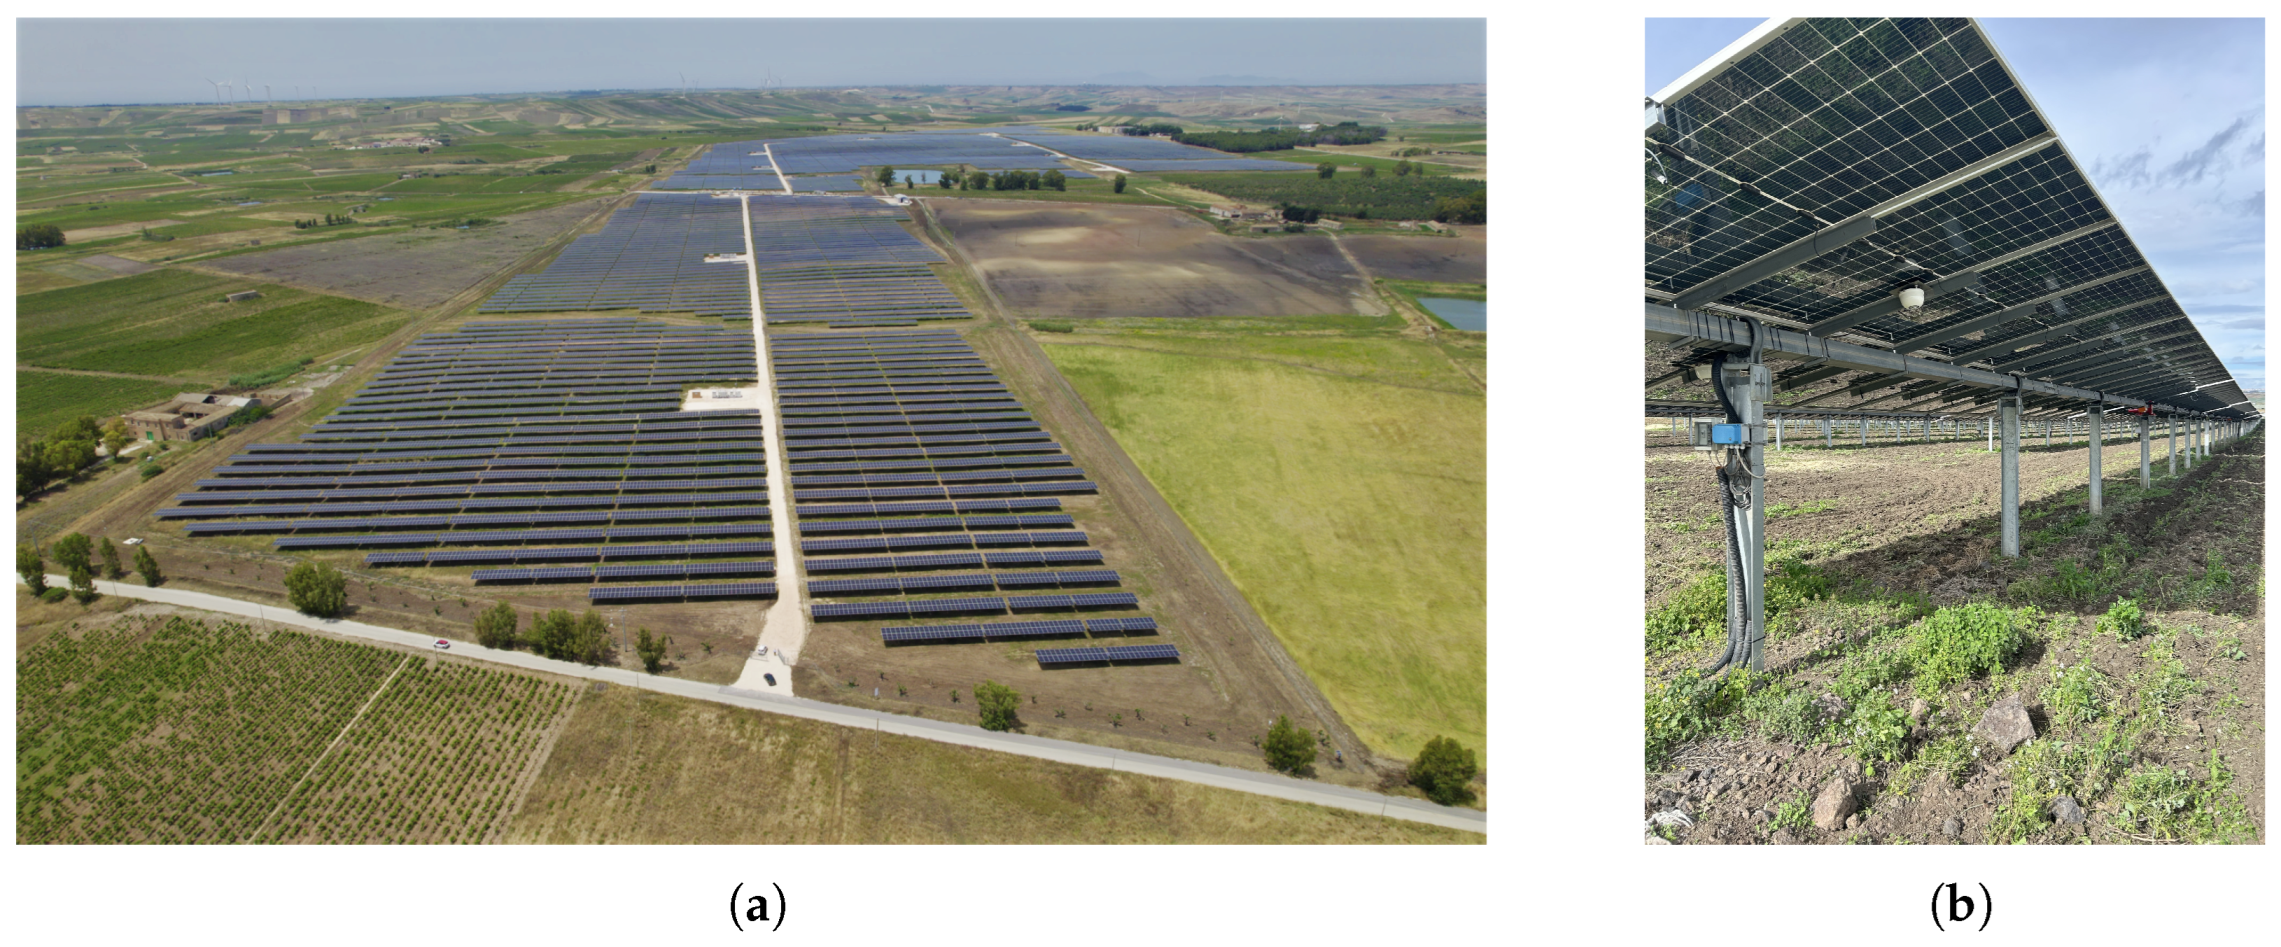
Table 1 presents the other most important specifications of the two plants, while Figure 2 proposes a view of the plants and of the installed PV modules.
The measurement of the electrical quantities of the plants is entrusted to inverters. On the contrary, the acquisition of environmental parameters is achieved thanks to front and rear secondary standard (class A) pyranometers, acquiring solar irradiance with an uncertainty ≤ ±3%, and one weather station for each plant, which measures the ambient temperature with an uncertainty of ±0.1 °C.

5. Results

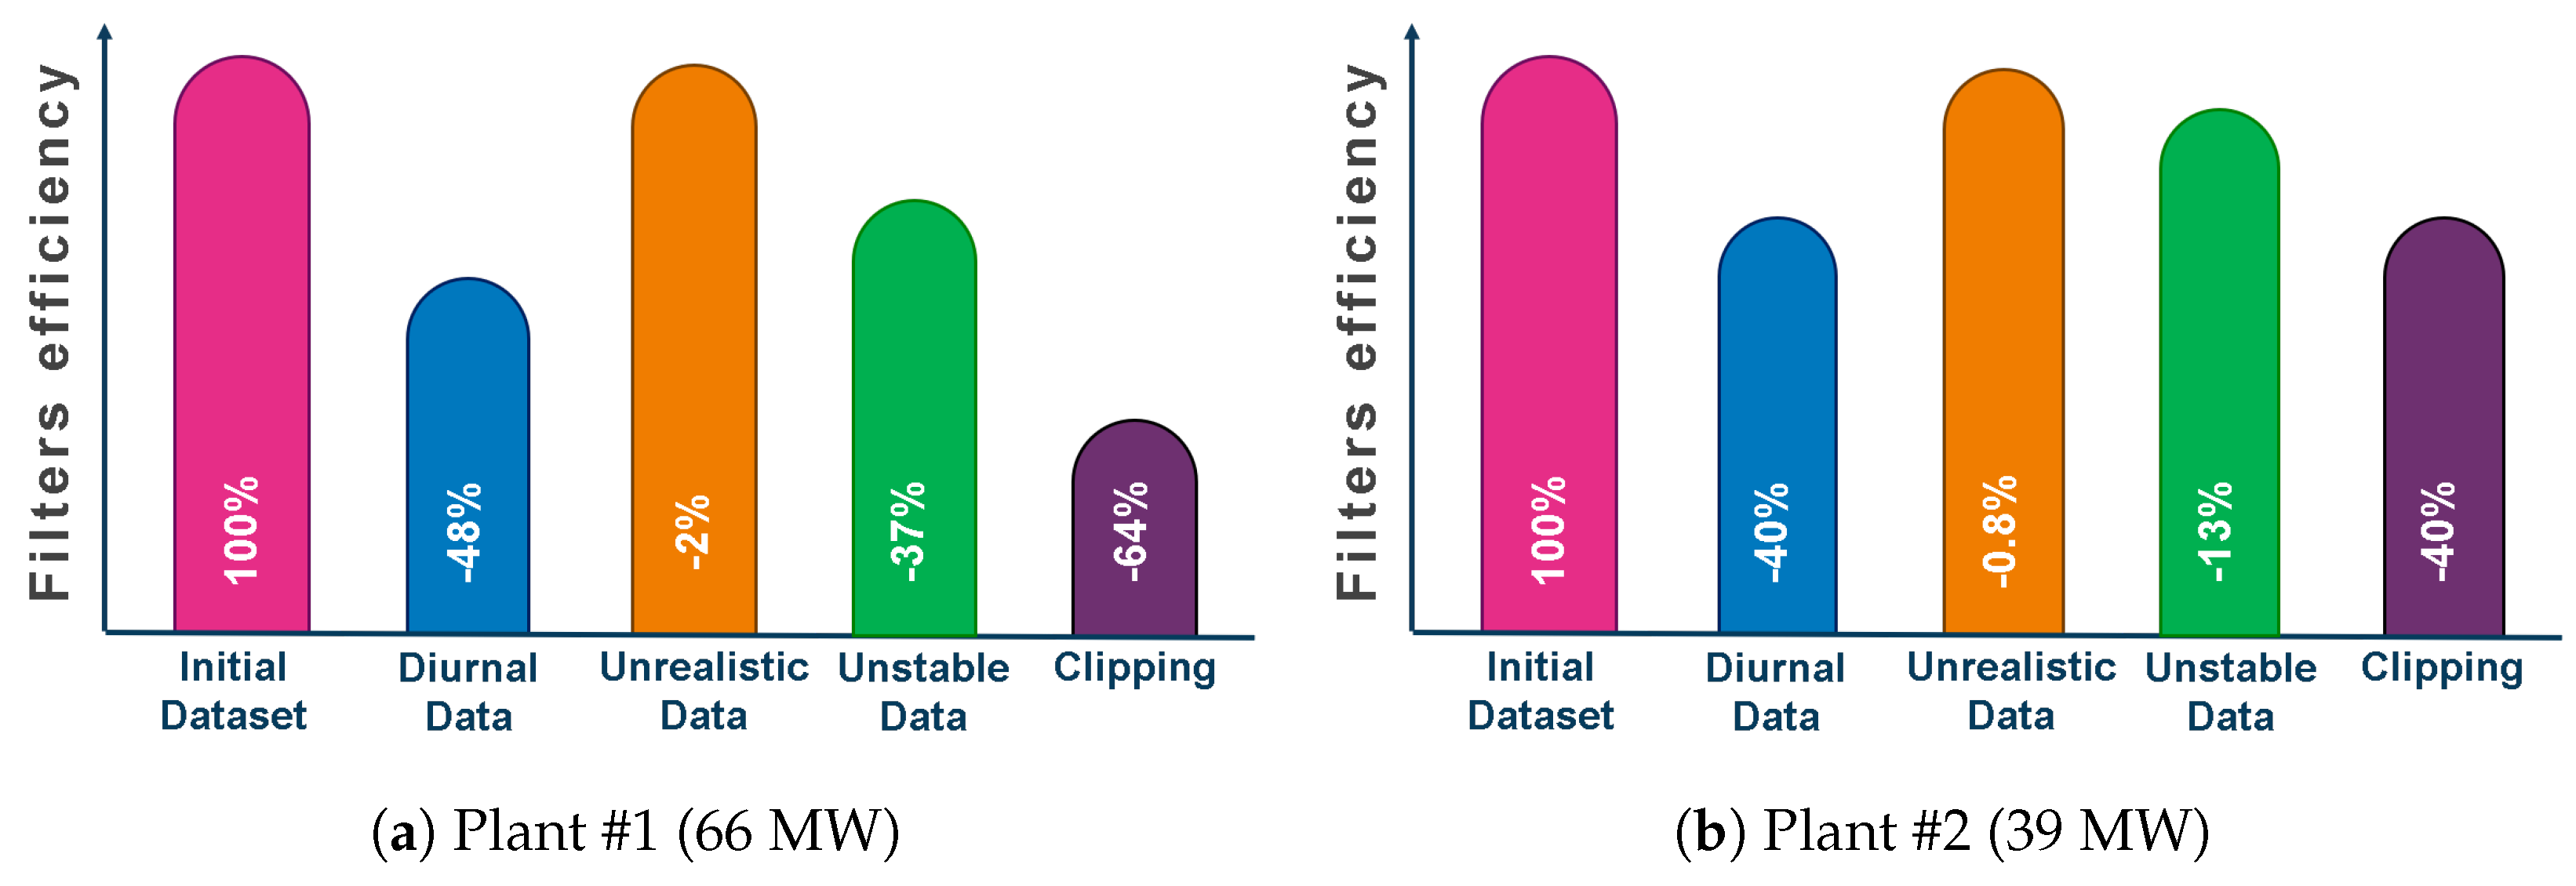
This section presents the results of the analysis. The operation of the two systems began in January 2023 and June 2023, respectively, and the model should be optimized on data acquired in the first operation months to exclude degradation and underperformance phenomena. However, in this work, the energy model has been optimized on data acquired in April 2023 (PV plant #1) and July 2023 (PV plant #2), which were not the first operation months. This decision was made because the operation of plant #1 started in winter months, without favorable weather conditions, while the operation of plant #2 began at the end of June 2023, without a complete set of data for June. Regarding step #1 of the methodology, Figure 3 presents the amount of data removed after the application of each filter individually with respect to the full dataset for the two plants.
Globally, the efficiency of the filters was about 9% and 48% for PV plants #1 (66 MW) and #2 (39 MW), respectively.
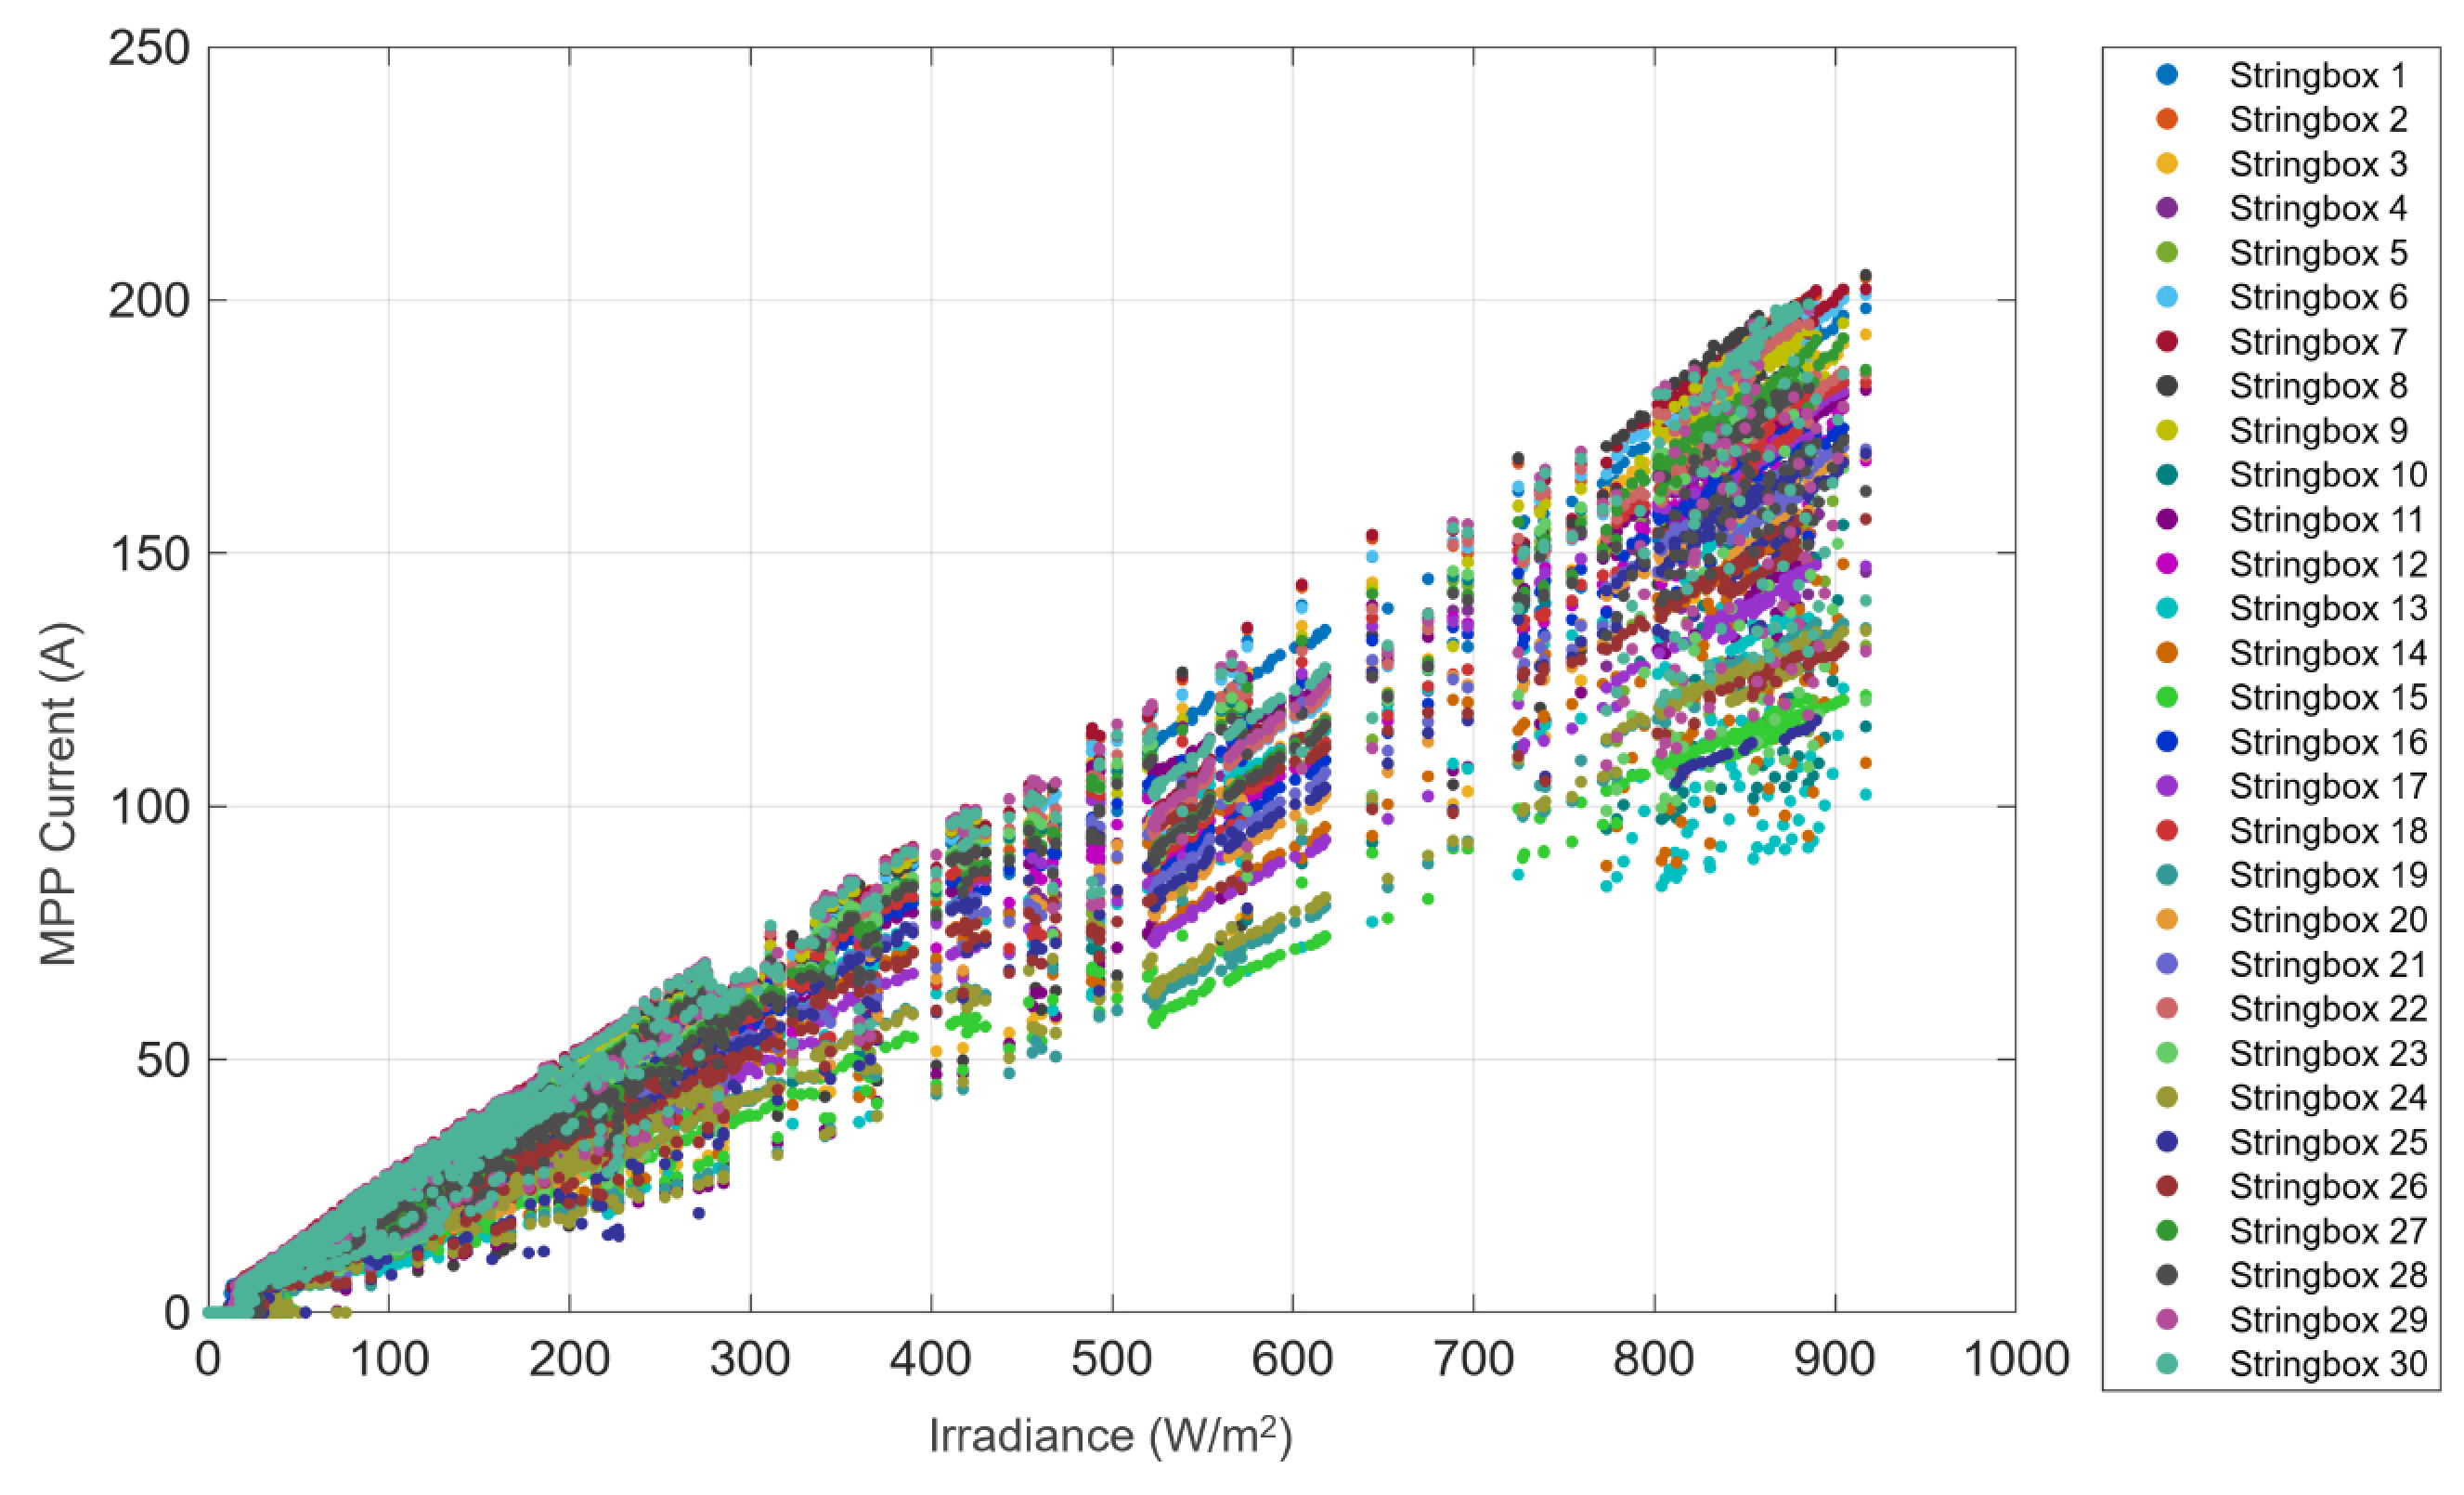
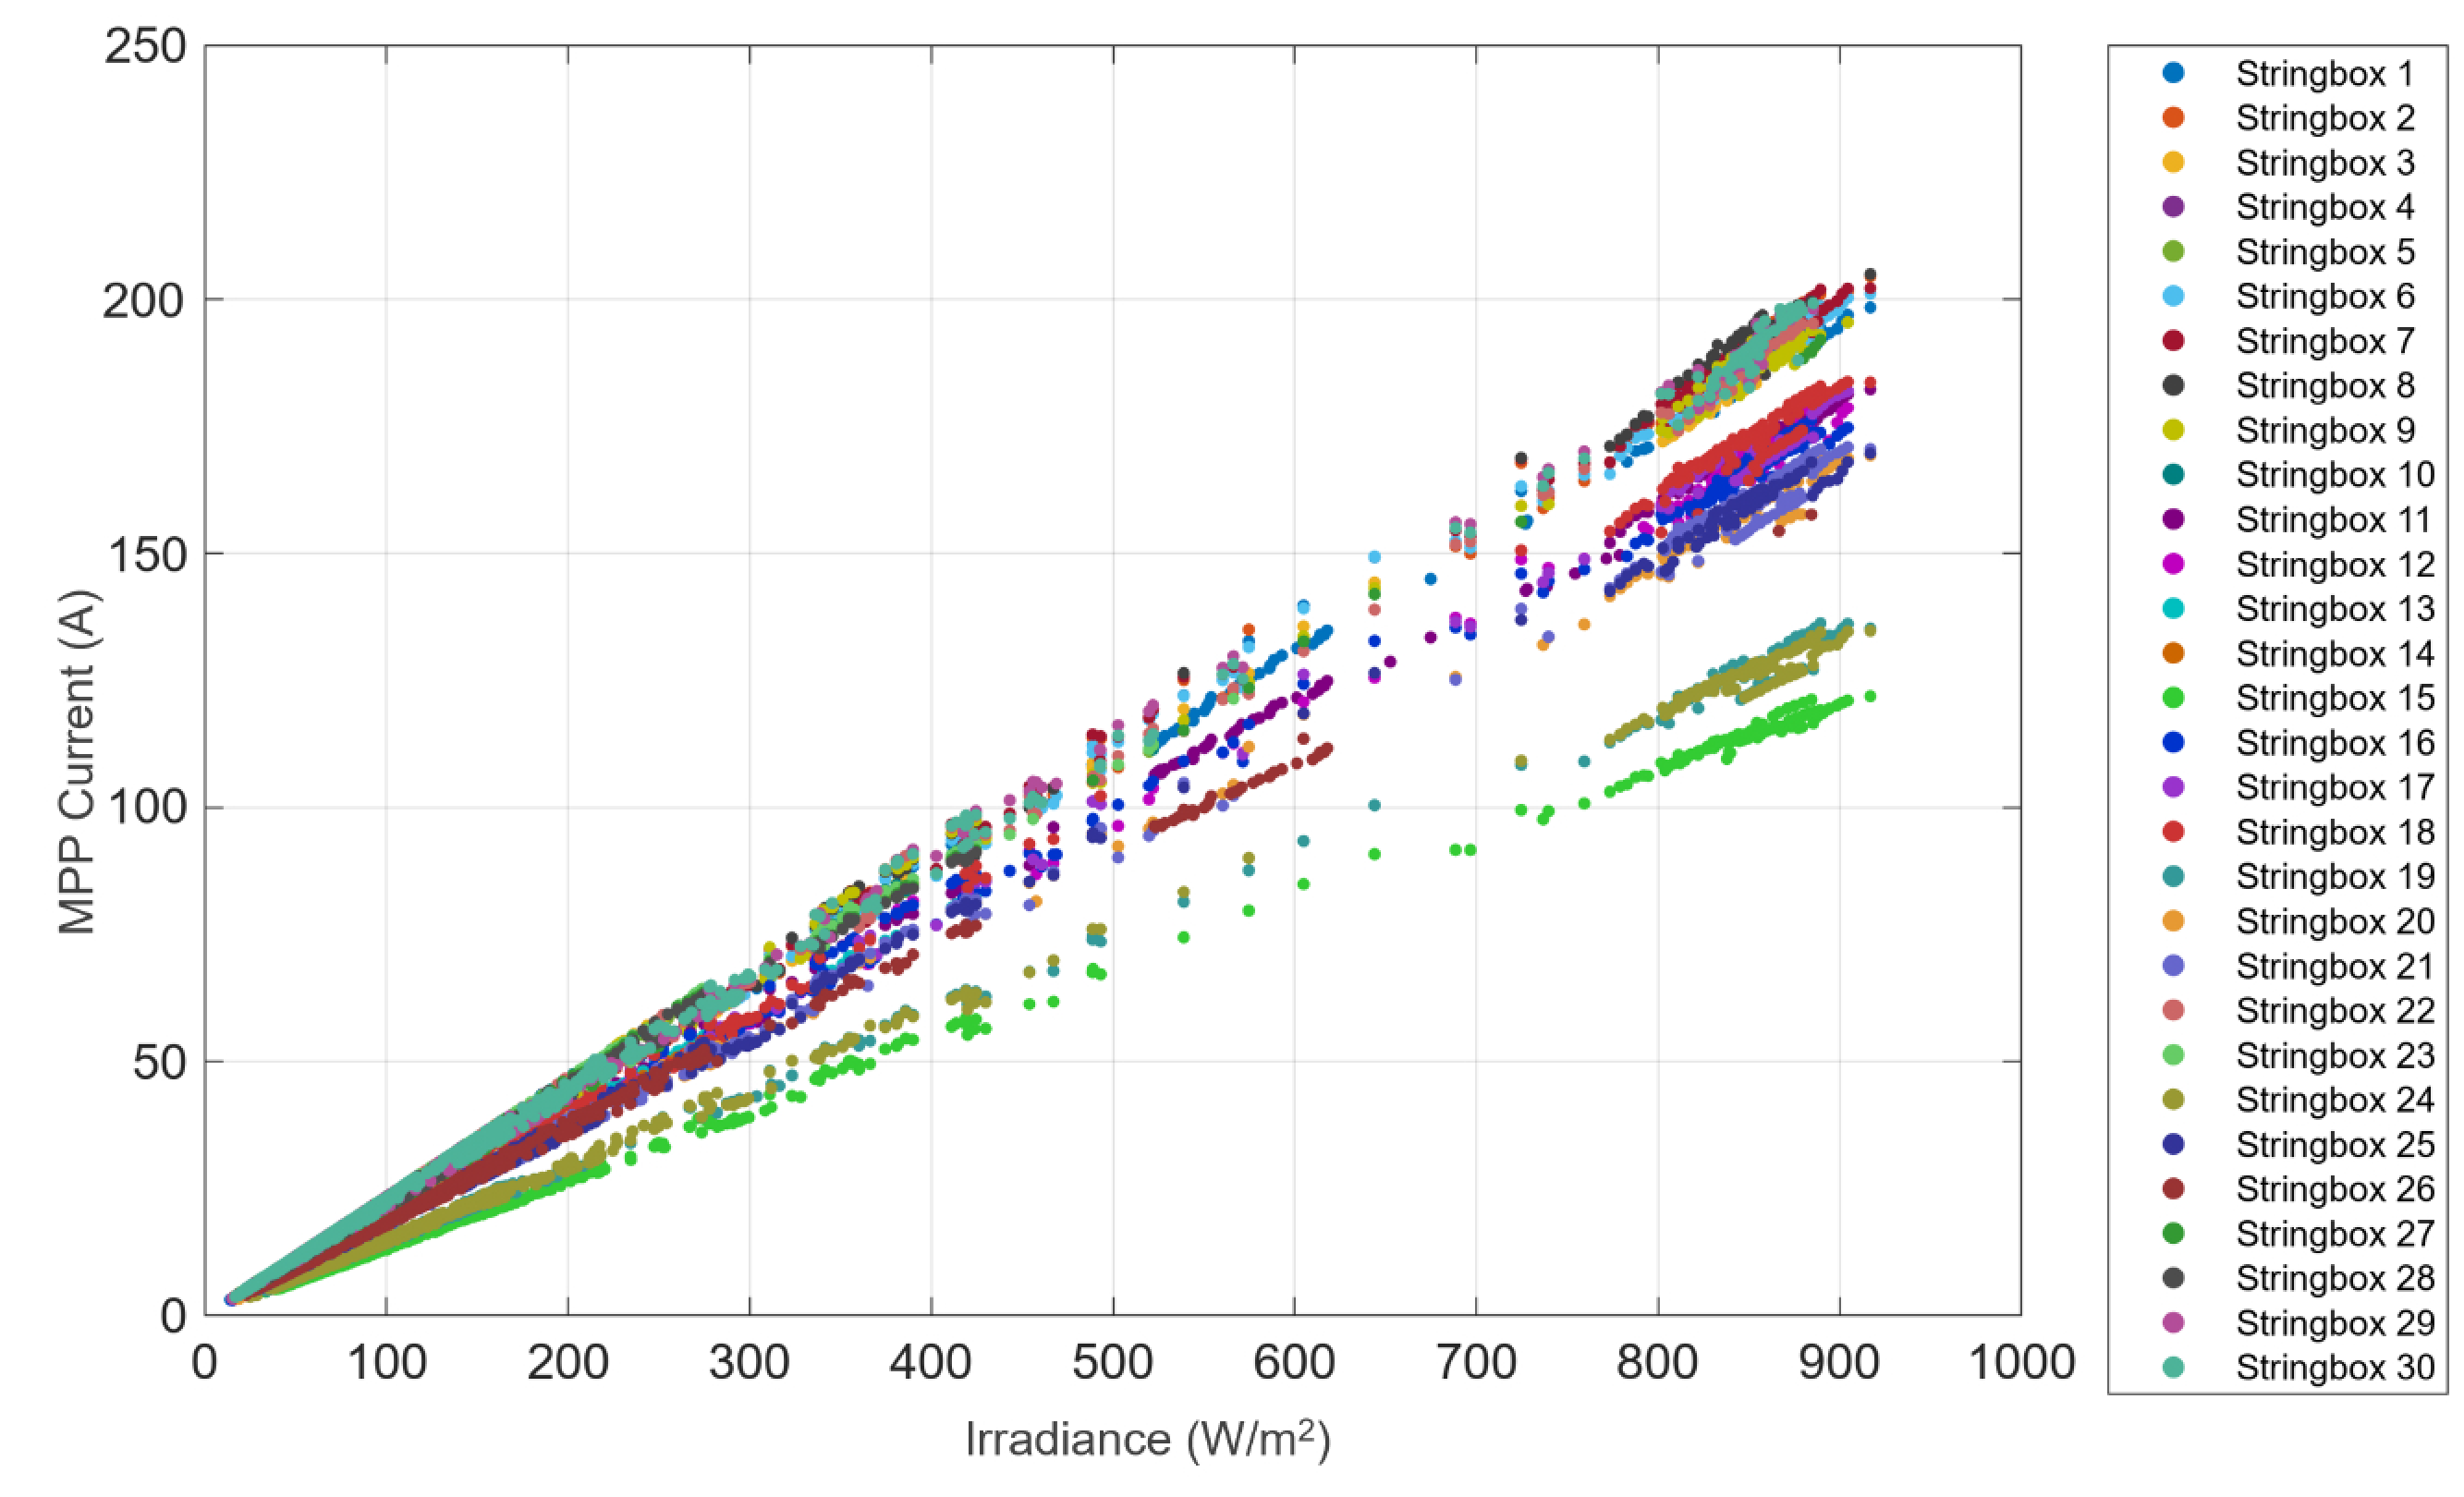
Regarding step #2, the selection of reference conditions was performed to exclude data affected by shadowing and underperformance. Figure 4 presents the relationship between DC current at the maximum power point and the front irradiance for the stringboxes of one inverter in plant #1. Figure 4 exhibits a strongly nonlinear correlation between the two quantities, and this is due to non-optimal operation. After the selection of the reference conditions, Figure 5 exhibits a clearly linear trend between the two quantities.
Regarding the optimizations performed in steps #3 and #4, the median optimized coefficients for the inverters of the two plants are presented in Table 2 and Table 3. These results correspond to values lower than 3.5% for 90% of data subject to the optimization procedures. These results are comparable with those presented in other papers. The work [27] proposes an optimized single-diode-based model for estimating the PV energy of bifacial modules, achieving normalised root mean square errors of 5%. The paper [28] adopts an integrated opto-electrical model for bifacial modules, demonstrating good accuracy (NRMSE errors between 3% and 5%) with reduced computational cost. Moreover, data-driven models [29] report similar values in terms of simulation accuracy (lower than 4%), and other works quantify the techno-economic competitiveness of bifacial configurations by obtaining an NRMSE value between 3% and 5% [7].
Finally, the energy estimation was performed using the coefficients at the stringbox level in Equation (9) and the bifacial contribution was assessed using Equation (11) for both the plants in the period of April 2023 (plant #1) and July 2023 (plant #2). In particular, the ratio between the rear and the front energy production was equal to 5.3% (plant #1) and 3% (plant #2), confirming that the energy surplus due to the bifacial contribution is not negligible. The grounds of the two installation sites present a different composition and albedo. In particular, plant #2 is close to a volcanic site and is characterized by a darker ground with a reasonably lower albedo compared to plant #1. This aspect justifies the different bifacial gain between the plants. Hence, this work proposes a methodology aiming to determine the bifacial gain for PV plants with any ground composition.

6. Conclusions

This paper presents a comprehensive approach for the quantification of bifacial productivity in utility-scale PV plants equipped with monocrystalline silicon modules installed on single-axis east–west tracking systems. An optimized energy model was developed and validated on experimental data acquired in the first operational month for two multi-MW PV plants in southern Italy, with a rated power of 66 MW and 39 MW. The energy model was trained on about 20% of the initial datasets, identifying optimized values for bifaciality factors at the stringbox level in the range between 65% and 75%, depending on the analysed stringbox. The effectiveness of the optimization was investigated by evaluating the Normalized Root Mean Square Errors, which resulted lower than 3.5% for the 90% of data. The results highlight that, despite site-specific conditions such as ground albedo and layout constraints, the bifacial gain is remarkable, reaching values of up to 5.3% and 3% of the total energy output for the studied plants. These findings confirm the potential of bifacial technology combined with tracking systems to enhance the annual energy yield and reduce the Levelized Cost of Electricity. Future developments will extend the monitoring period considering years of data to assess the long-term PV performance. Such an analysis will be performed taking into account additional phenomena such as the degradation rate (by means of an additional time-dependent efficiency) and the seasonal impact by achieving sets of coefficients specifically defined for each season. Nevertheless, future works will investigate the difference of ground composition and albedo and will correlate this aspect with the different bifacial gain. The final goal of this research activity will be the determination of a model to estimate the bifacial gain as a function of the ground albedo as well. This will be achieved, for example, by including a comparison of PV production from plants with different albedo and quantifying coefficients, correlating the albedo with normalized bifacial gain. These aspects will also provide more robust estimates for investors and stakeholders interested in large-scale bifacial PV systems.

Author Contributions

Conceptualization, G.M. and F.S.; methodology, G.M. and F.M.; formal analysis, G.M., F.M. and A.C. (Andrea Cagnetti); investigation, G.M., F.M. and A.C. (Andrea Cagnetti); resources, A.V. and L.T.; data curation, A.C. (Andrea Cagnetti); writing—original draft preparation, G.M. and F.M.; writing—review and editing, G.M., F.M., A.C. (Alessandro Ciocia) and F.S.; visualization, G.M. and F.M.; supervision, G.M., A.C. (Alessandro Ciocia) and F.S. All authors have read and agreed to the published version of the manuscript.

Funding

This research received no external funding.

Data Availability Statement

The data underlying this study are not available publicly or upon request because they are subject to confidentiality agreements and industrial/commercial proprietary restrictions with Engie Energies Italia S.r.l.

Acknowledgments

The authors would like to acknowledge the company Engie Energies S.r.l. for providing support in the in-field activities, revision of the work, and access to experimental datasets of the PV plants under study.

Conflicts of Interest

Author Aleandro Vivino and Ludovico Terzi were employed by the company Engie Energies S.r.l. The remaining authors declare that the research was conducted in the absence of any commercial or financial relationships that could be construed as a potential conflict of interest.

References

  1. Aime, G.; Ciocia, A.; Malgaroli, G.; Narbey, S.; Saglietti, L.; Spertino, F. Degradation Assessment for Prototypal Perovskite Photovoltaic Modules in Long Term Outdoor Experimental Campaign. In Proceedings of the 2023 IEEE International Conference on Environment and Electrical Engineering and 2023 IEEE Industrial and Commercial Power Systems Europe (EEEIC/I and CPS Europe 2023), Madrid, Spain, 6–9 June 2023. [Google Scholar] [CrossRef]
  2. Ciocia, A.; Enescu, D.; Amato, A.; Malgaroli, G.; Polacco, R.; Amico, F.; Spertino, F. Agrivoltaic System: A Case Study of PV Production and Olive Cultivation in Southern Italy. In Proceedings of the 2022 57th International Universities Power Engineering Conference: Big Data and Smart Grids (UPEC 2022), Istanbul, Turkey, 30 August–2 September 2022. [Google Scholar] [CrossRef]
  3. Stein, J.S.; Reise, C.; Bonilla Castro, J.; Friesen, G.; Maugeri, G.; Urrejola, E.; Ranta, S. Bifacial Photovoltaic Modules and Systems: Experience and Results from International Research and Pilot Applications; Technical Report IEA-PVPS T13-14:2021; International Energy Agency Photovoltaic Power Systems Programme (IEA PVPS) Task 13: Paris, France, 2021. [Google Scholar]
  4. International Technology Roadmap for Photovoltaics (ITRPV). 2023. Available online: https://www.itrpv.org (accessed on 30 May 2025).
  5. IEA PVPS Task 13. Best Practices for the Optimization of Bifacial Photovoltaic Tracking Systems; Technical Report; International Energy Agency: Paris, France, 2023. [Google Scholar]
  6. Wikipedia Contributors. Inseguitore Solare. 2025. Available online: https://it.wikipedia.org/wiki/Inseguitore_solare (accessed on 30 June 2025).
  7. Rodríguez-Gallegos, C.D.; Liu, H.; Gandhi, O.; Singh, J.P.; Krishnamurthy, V.; Kumar, A.; Stein, J.S.; Wang, S.; Li, L.; Reindl, T.; et al. Global Techno-Economic Performance of Bifacial and Tracking Photovoltaic Systems. Joule 2020, 4, 1514–1541. [Google Scholar] [CrossRef]
  8. IEA PVPS Task 13. Best Practices for the Optimization of Bifacial Photovoltaic Tracking Systems; Technical Report IEA-PVPS T13-22:2024; International Energy Agency Photovoltaic Power Systems Programme (IEA PVPS): Paris, France, 2024; Available online: https://iea-pvps.org (accessed on 8 June 2025).
  9. Nygård, M.M.; Wiig, M.S.; Roosloot, N.; Otnes, G.; Øgaard, M.B.; Riise, H.N.; Marstein, E.S. Elucidating Uncertainty in Bifacial Photovoltaic Gain Estimation. Sol. Energy 2025, 292, 113469. [Google Scholar] [CrossRef]
  10. Ayala Peláez, S.; Deline, C.; MacAlpine, S.; Olalla, C. Estimating and Parameterizing Mismatch Power Loss in Bifacial Photovoltaic Systems. Prog. Photovolt. Res. Appl. 2020, 28, 691–703. Available online: https://www.osti.gov/servlets/purl/1606308 (accessed on 13 October 2025).
  11. PVMet Wiki. 2025. Available online: https://wiki.pvmet.org (accessed on 30 May 2025).
  12. Gu, W.; Ma, T.; Ahmed, S.; Zhang, Y.; Peng, J. A comprehensive review and outlook of bifacial photovoltaic (bPV) technology. Energy Convers. Manag. 2020, 223, 113283. Available online: https://www.sciencedirect.com/science/article/pii/S0196890420308220 (accessed on 9 July 2025). [CrossRef]
  13. Zhang, X.; Liu, Y.; Chen, J.; Li, Q. Enabling 95% bifaciality of efficient TOPCon solar cells by rear-side selective sunken pyramid structure and zebra-crossing passivation contact. Sol. Energy Mater. Sol. Cells 2025, 292, 113809. Available online: https://www.sciencedirect.com/science/article/abs/pii/S0927024825004106 (accessed on 9 July 2025). [CrossRef]
  14. Spertino, F.; Malgaroli, G.; Amato, A.; Qureshi, M.A.E.; Ciocia, A.; Siddiqi, H. An Innovative Technique for Energy Assessment of a Highly Efficient Photovoltaic Module. Solar 2022, 2, 321–333. [Google Scholar] [CrossRef]
  15. Jinko Solar. Tiger Neo N-Type TOPCon Series Datasheet. 2024. Available online: https://jinkosolarcdn.shwebspace.com/uploads/JKM565-585N-72HL4-(V)-F3-EN.pdf (accessed on 5 June 2025).
  16. Meyer Burger. HJT Technology Overview, Technical Brief. 2023. Available online: https://www.meyerburger.com/fileadmin/user_upload/Investors/Meyer-Burger-Corporate-Presentation-April-2024.pdf (accessed on 5 June 2025).
  17. National Renewable Energy Laboratory (NREL). Best Research-Cell Efficiency Chart. 2024. Available online: https://www.nrel.gov/pv/cell-efficiency.html (accessed on 8 June 2025).
  18. IEC 61215-2:2021; Terrestrial Photovoltaic (PV) Modules—Design Qualification and Type Approval—Part 2: Test Procedures. IEC: Geneva, Switzerland, 2021. Available online: https://webstore.iec.ch/en/publication/61350 (accessed on 7 June 2025).
  19. IEC TS 60904-1-2:2019; Photovoltaic Devices—Part 1–2: Measurement of Current-Voltage Characteristics of Bifacial Photovoltaic Devices. IEC: Geneva, Switzerland, 2019. Available online: https://webstore.iec.ch/en/publication/34357 (accessed on 5 June 2025).
  20. IEC 61724-1:2021; Photovoltaic System Performance—Part 1: Monitoring. IEC: Geneva, Switzerland, 2021. Available online: https://webstore.iec.ch/en/publication/65561 (accessed on 5 June 2025).
  21. IEC 62804-1:2015; Photovoltaic (PV) Modules—Test Methods for the Detection of Potential-Induced Degradation—Part 1: Crystalline Silicon. IEC: Geneva, Switzerland, 2015. Available online: https://cdn.standards.iteh.ai/samples/19927/18b6fe079c364496b423791b0284280c/IEC-TS-62804-1-2015.pdf (accessed on 5 June 2025).
  22. IEC TS 62804-2:2022; Photovoltaic (PV) Modules—Test Methods for the Detection of Potential-Induced Degradation—Part 2: Thin-Film. IEC: Geneva, Switzerland, 2022. Available online: https://webstore.iec.ch/en/publication/33260 (accessed on 7 June 2025).
  23. IEC 61853-1:2011; Photovoltaic (PV) Module Performance Testing and Energy Rating—Part 1: Irradiance and Temperature Performance Measurements and Power Rating. IEC: Geneva, Switzerland, 2011. Available online: https://webstore.iec.ch/publication/6035 (accessed on 7 June 2025).
  24. Carstens, H.; Xia, X.; Yadavalli, S. Measurement uncertainty in energy monitoring: Present state of the art. Renew. Sustain. Energy Rev. 2018, 82, 2791–2805. [Google Scholar] [CrossRef]
  25. Habte, A.; Sengupta, M.; Andreas, A.; Dooraghi, M.; Reda, I.; Kutchenreiter, M. Evaluating the Sources of Uncertainties in the Measurements from Multiple Pyranometers and Pyrheliometers; Technical Report NREL/PO-5D00-68065; National Renewable Energy Laboratory (NREL): Golden, CO, USA, 2017. Available online: https://www.nrel.gov/docs/fy17osti/68065.pdf (accessed on 13 October 2025).
  26. Mihaylov, B.; Betts, T.R.; Pozza, A.; Mullejans, H.; Gottschalg, R. Uncertainty Estimation of Temperature Coefficient Measurements of PV Modules. IEEE J. Photovoltaics 2016, 6, 1554–1563. [Google Scholar] [CrossRef]
  27. Valdivia, C.E.; Tuli, C.; Russell, A.; Haysom, J.E.; Li, R.; Lekx, D.; Sepehr, M.M.; Hennessy, D.; Hinzer, K.; Schriemer, H.P. Bifacial Photovoltaic Module Energy Yield Calculation and Analysis. In Proceedings of the 2017 IEEE 44th Photovoltaic Specialist Conference (PVSC), Washington, DC, USA, 25–30 June 2017; pp. 1094–1099. Available online: https://ieeexplore.ieee.org/document/8366206 (accessed on 9 July 2025).
  28. Keiner, D.; Walter, L.; Bogdanov, D.; Peters, I.M.; Breyer, C. Assessing the impact of bifacial solar photovoltaics on future power systems based on capacity-density-optimised power plant yield modelling. Sol. Energy 2025, 295, 113543. [Google Scholar] [CrossRef]
  29. Sohani, A.; Pierro, M.; Moser, D.; Cornaro, C. Comparison of physical models for bifacial PV power estimation. Energy Convers. Manag. 2025, 327, 119515. [Google Scholar] [CrossRef]
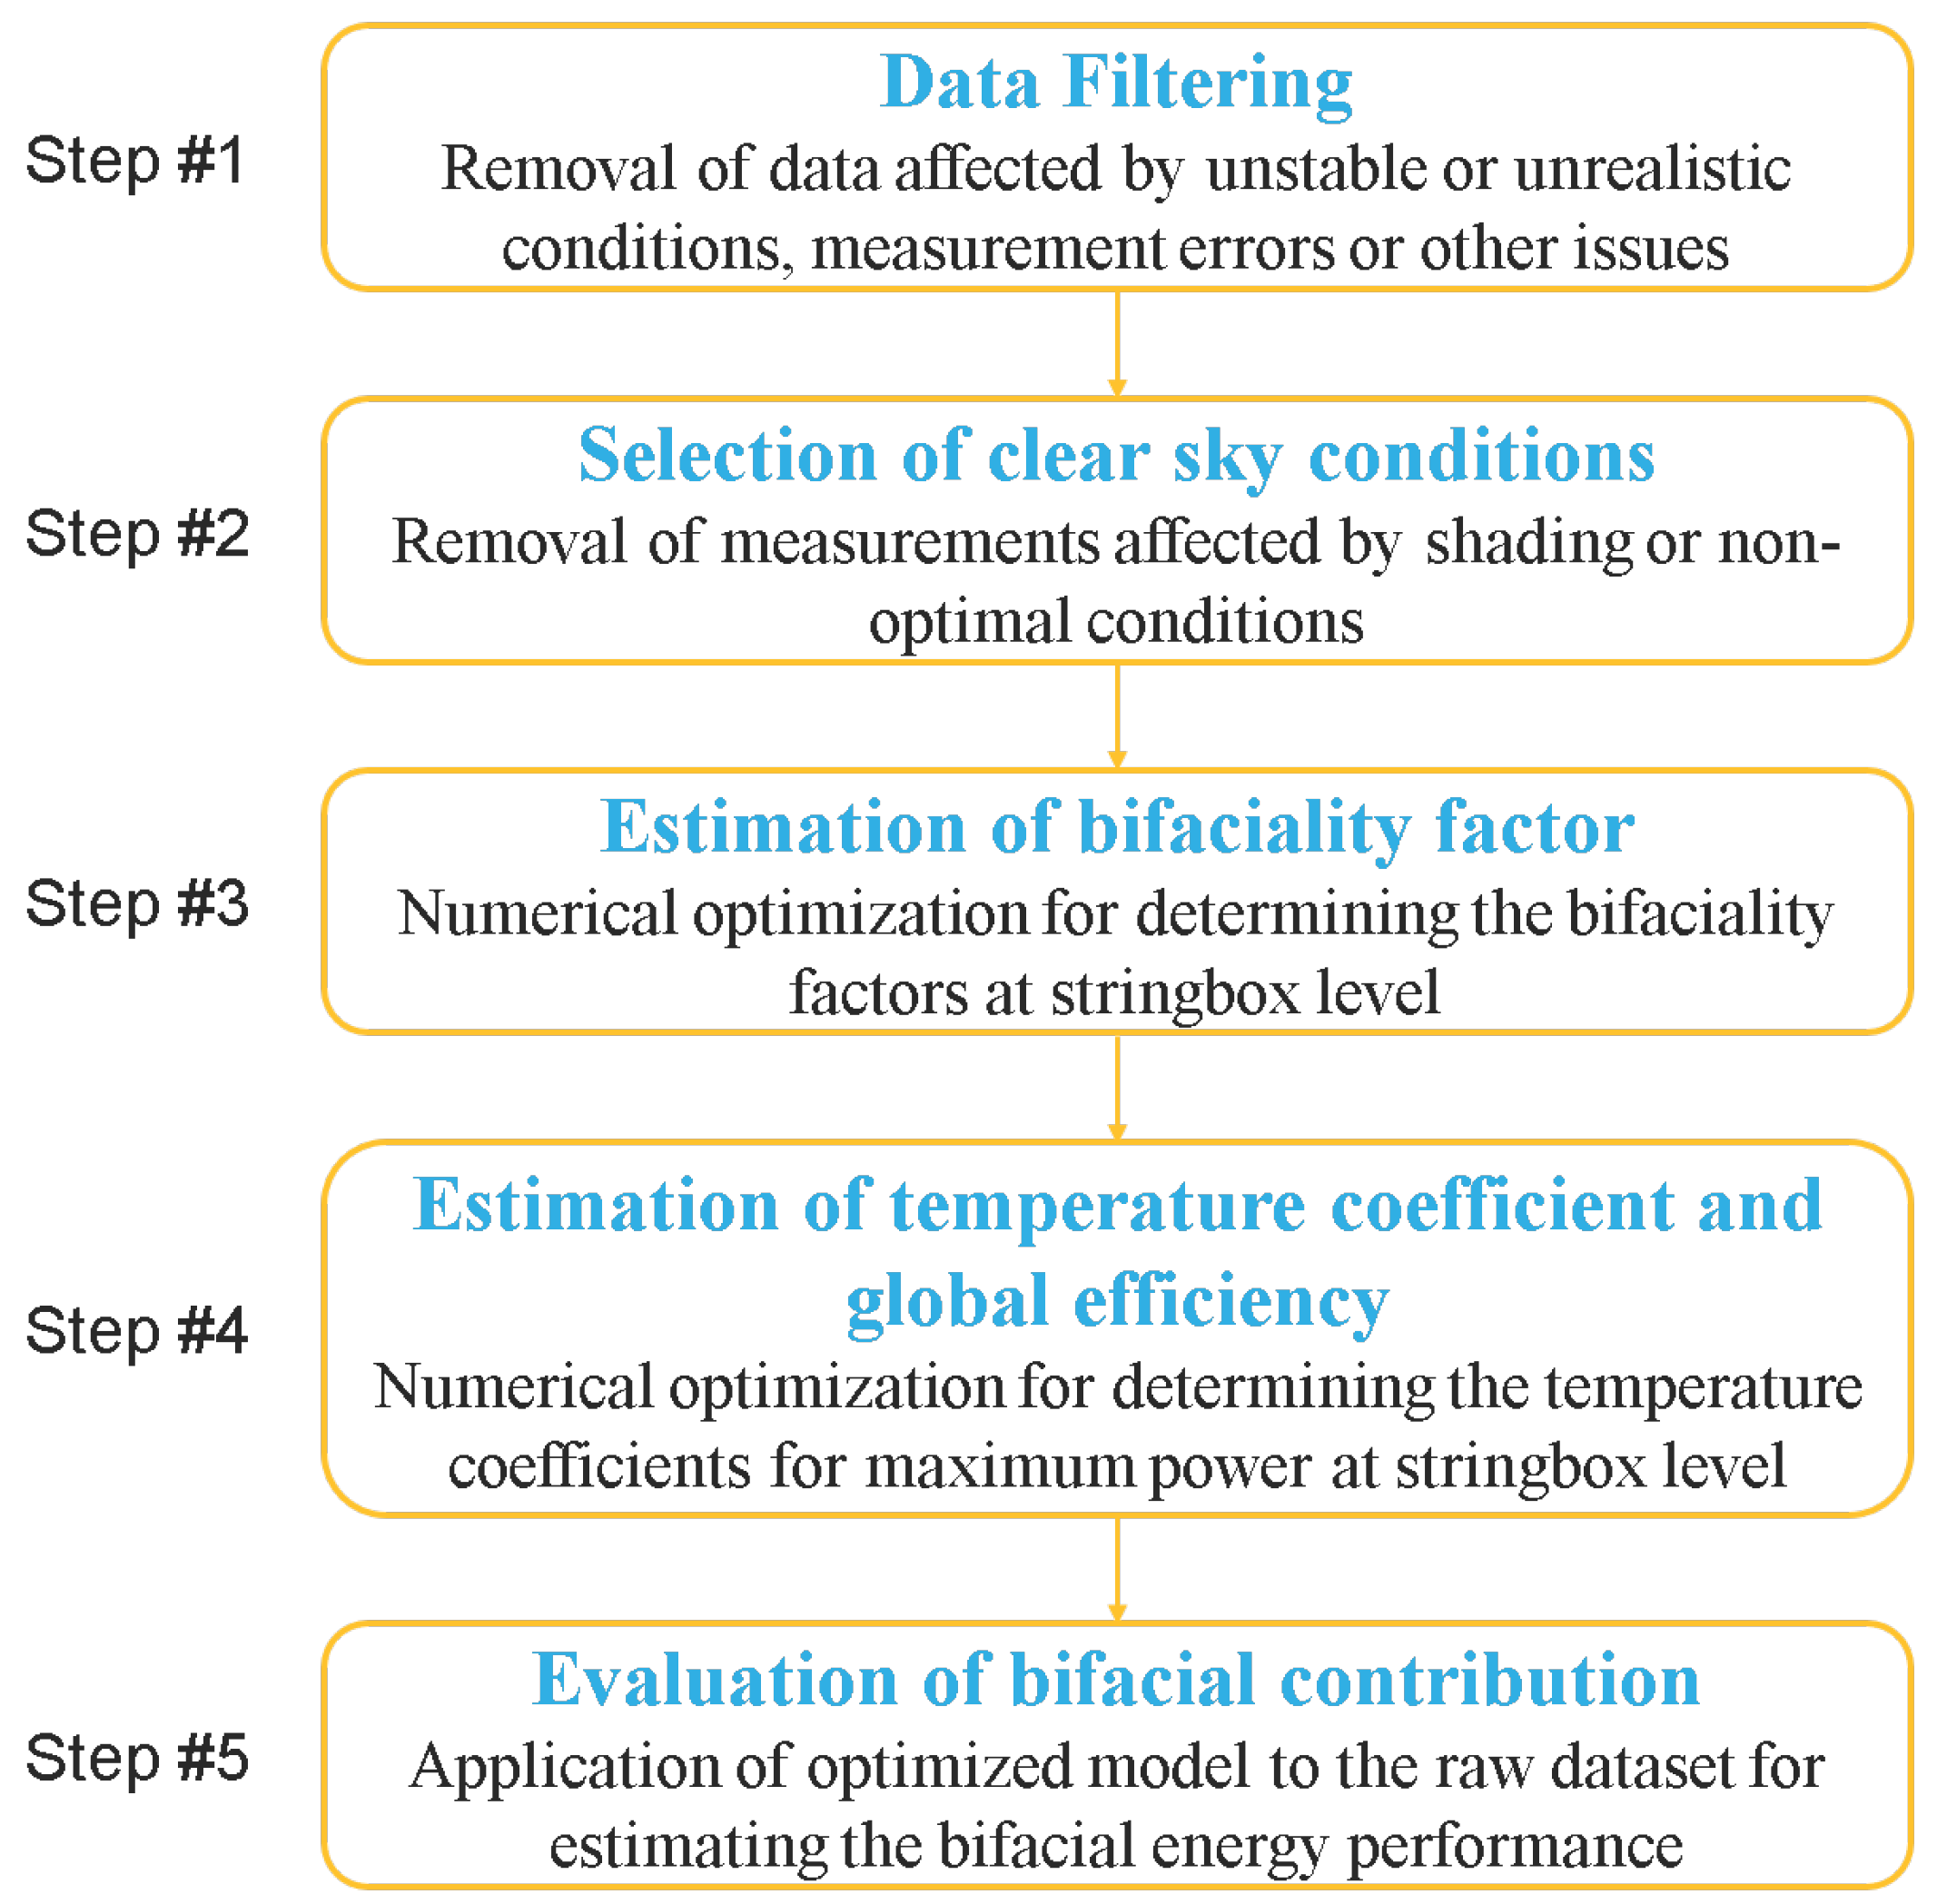
Figure 1. Flowchart of the procedure for determining the optimized energy model.
Solar 05 00049 g001
Figure 2. Aerial view and bifacial modules in the PV plants under study. (a) Aerial view of plant #1 (66 MW). (b) Bifacial PV modules in plant #2 (39 MW).
Solar 05 00049 g002
Figure 3. Comparison of the efficiency of filters applied to the PV plants under study.
Solar 05 00049 g003
Figure 4. Current–irradiance correlation for the stringboxes of one inverter (plant #1).
Solar 05 00049 g004
Figure 5. Current–irradiance correlation for the stringboxes of one inverter (plant #1) after selection of reference conditions.
Solar 05 00049 g005
Table 1. Specifications of the PV plants.
PV Plant#1#2
PV module specifications
Rated power535 W and 540 W
Efficiency21.5%
γ P −0.35%/°C
Inverter specifications
Rated power3.437 MW
DC/AC Efficiency99.0%
PV layout
# of modules per string28
# of strings per stringbox15–1912–20
# of stringboxes272155
Table 2. Median optimized coefficients of PV plant #1 (66 MW).
Inv. ID#1#2#3#4#5
B F 75%75%65%75%75%
η P 100%100%100%99%98%
γ P −0.35%/°C−0.35%/°C−0.35%/°C−0.35%/°C−0.35%/°C
Inv. ID#6#7#8#9#10
B F 73%65%75%73%70%
η P 99%100%100%100%99%
γ P −0.35%/°C−0.35%/°C−0.35%/°C−0.35%/°C−0.35%/°C
Table 3. Median optimized coefficients of PV plant #2 (39 MW).
Inv. ID#1#2#3#4#5#6
B F 75%75%75%65%65%75%
η P 100%100%98%98%100%100%
γ P −0.35%/°C−0.35%/°C−0.35%/°C−0.35%/°C−0.35%/°C−0.35%/°C
Disclaimer/Publisher’s Note: The statements, opinions and data contained in all publications are solely those of the individual author(s) and contributor(s) and not of MDPI and/or the editor(s). MDPI and/or the editor(s) disclaim responsibility for any injury to people or property resulting from any ideas, methods, instructions or products referred to in the content.