1. Introduction
1.1. Renewable Energy and Industry
The global push toward decarbonization has triggered a significant expansion in renewable energy capacity, which increased from 1850 GW in 2015 to 4450 GW in 2024, as shown in
Table 1. Conventional renewable sources experienced modest growth: Hydropower increased from 1200 GW to around 1425 GW, bioenergy from 95 GW to around 150 GW, and geothermal energy from around 12 GW to 15 GW. Conversely, solar photovoltaic (PV) capacity grew from around 220 GW to roughly 1860 GW, and wind capacity from 420 GW to around 1130 GW. The share of wind in global renewable capacity increased from 23% to 26% while solar PV grew from 12% to around 42%, thereby becoming the most extensively deployed renewable energy technology worldwide.
Within the industrial sector, the varying degrees of progress in renewable energy integration can be attributed to the varying magnitude and temperature levels of process thermal energy demand [
2]. Three distinct clusters can be identified: a group of highly electrified sectors, a group of sectors with a high share of renewables, and a group of sectors with both low electrification and renewable integration rates. The group of highly electrified sectors includes the mining, quarrying, and non-ferrous metals industries. Among these, aluminum smelting is the most electricity-intensive process, contributing to about 8% of the total electricity demand of the industrial sector [
3]. The group of sectors with a large share of renewables includes the food and paper industries. In these sectors, a significant share of renewable energy is provided by bioenergy. The paper industry leverages biomass as both a feedstock and an energy source [
4], while the food industry recovers energy from organic waste streams [
5]. The group of hard-to-abate sectors includes the most energy-intensive sectors. Decarbonization in these sectors is very challenging and has been investigated thoroughly, including studies focused on the chemical and petrochemical [
6], iron and steel [
7], cement [
8], and glass industries [
9].
1.2. Decarbonization of High-Temperature Process Heating
Decarbonization of high-temperature process heating can primarily be achieved through biomass, electrification, and carbon capture, utilization, and storage (CCUS).
Biomass-based solutions require low-to-moderate modifications to existing industrial equipment, particularly when gasification is employed to enable a direct switch from natural gas. The sustainable and long-term availability of biomass resources is the main constraint on its large-scale industrial adoption [
10]. CCUS represents an end-of-pipe solution capable of addressing both energy- and process-related emissions [
11]. Despite its potential, the deployment of CCUS is hindered by substantial capital and operational costs, as well as by the critical challenge of identifying and securing long-term CO
2 storage sites.
Electrification can be categorized into direct and indirect approaches [
12]. Direct electrification encompasses a variety of technologies applicable across sectors, such as process industry, materials production, materials fabrication (both metals and nonmetals), and industrial wastewater treatment [
13]. These include electromagnetic induction technologies, which use a changing magnetic field to heat electrically conductive materials, dielectric heating technologies, which use high-frequency electromagnetic radiation to heat materials, and resistive heating technologies, which use either a heating element or the resistance of the material to be heated. Other direct methods include electric arc heating, infrared radiation, electron beam, and plasma heating technologies. Indirect electrification involves producing energy carriers, such as hydrogen or alternatives, from electricity generated by renewable sources. This approach is known as Power-to-X and belongs to the family of fuel switching solutions. Among the main challenges hindering the uptake of different electrification technologies are several technical constraints, such as equipment availability, infrastructure reliability, and operational flexibility, economic constraints, including operational and capital costs in low-margin sectors, and social factors, such as risk aversion [
14].
In the recent literature, several works have addressed the combination of renewable electricity and hydrogen integration for the decarbonization of hard-to-abate industrial sectors [
15]. Compared to direct electrification, this requires minor changes to existing equipment and facilitates the complex matching between intermittent renewable electricity generation and the continuous thermal energy demands of industrial plants due to the intrinsic storage capability of hydrogen [
16]. For example, relevant applications using either commercial or in-house energy simulation tools include the assessment of solar energy in the paper industry [
17], wind energy in the steel industry [
18], and their combination in the ceramic industry [
19] or broader heavy industry contexts [
20].
1.3. Motivation and Novelty
With an estimated annual energy consumption of 500–800 PJ [
21] and carbon emissions exceeding 85 MtCO
2,eq [
22], the glass industry represents a significant hard-to-abate sector. A distinctive feature of this industry is the technological maturity of hybrid furnaces, which combine fuel burners positioned above the glass surface with electrodes immersed in the glass melt to meet thermal energy demands. These furnaces can be designed to operate over a wide range of electrical inputs, up to 80%, although typical values range from 5% to 20%. Their hybrid nature provides an interesting context for analyzing the trade-offs between direct and indirect electrification through hydrogen and assessing the constraints relevant to the integration of solar energy.
Previous studies on these decarbonization pathways have primarily focused on economic comparisons based on specific melting costs without explicitly accounting for renewable energy integration [
23]. Where renewable energy availability is considered, it is typically modeled as a generic grid-level penetration rate [
24] or through existing local renewable generation plants [
25]. To the authors’ knowledge, no prior work has systematically investigated the optimization of the energy supply in the glass industry while incorporating different levels of renewable energy availability alongside furnace and energy system design considerations. This study addresses this gap by developing a mixed-integer linear programming (MILP) formulation to optimize the energy supply for a representative 300 t/d oxyfuel container glass furnace, explicitly integrating varying solar energy availability and furnace boosting levels. The choice of an oxyfuel furnace stems from its demonstrated compatibility with hydrogen, supported by both computational fluid dynamics evaluations [
26] and experimental investigations [
27].
The MILP framework is used to define the optimal operation of three different integration configurations: direct coupling of the furnace and a solar PV plant, integration of battery storage, and integration of a hydrogen infrastructure consisting of a proton exchange membrane (PEM) electrolyzer with a dedicated hydrogen compressor and storage tank. These are defined in order to provide a comprehensive evaluation of the most promising large-scale energy storage solutions [
28]. This analysis enables the identification of capacity requirements for PV modules, battery storage, hydrogen electrolyzer, and furnace boosting needed to decarbonize the energy supply of a representative glass production plant through either direct or indirect electrification via hydrogen. The resulting sizing guidelines represent an important original contribution that can support the design of low-carbon glass melting furnaces while minimizing burdens on the broader energy system. These findings are intended to serve as a shared foundation for industrial actors and policymakers to support strategic energy and decarbonization planning through targeted renewable energy investments and incentive design.
2. Decarbonizing Thermal Energy in the Glass Industry
The glass industry is among the industrial sectors with the highest share of energy costs in total production costs. These can account for between 20% and 35% of the total [
29], reaching up to 23% for container glass [
30]. This has led glass manufacturers to target energy efficiency improvements, thereby approaching the physical limits of conventional furnace performance [
31]. A large portion of the energy consumption is met by fossil fuels, with thermal energy demand accounting for 85% of total energy demand in the EU [
32] and 75% in the US [
33]. Melting is the most energy-intensive process in the glass industry, and it consists of batch heating to melting temperature, fusion reactions to form the melt, dissolution of sand grains, removal of glass bubbles, and chemical and thermal homogenization. The melting temperature is around 1500 °C, with most of the enthalpy input required in the initial batch-to-melt conversion phase. The temperature profile in a glass furnace is a critical parameter influencing the quality of final products [
34].
2.1. Furnace Types in the Glass Industry
Several types of glass furnaces are available for the various types of glass products, including recuperative, regenerative cross-fired and end-port, oxyfuel, and all-electric furnaces [
35]. Hybrid furnaces consist of a variation of typical regenerative furnaces, where electrodes immersed in the glass melt supply a certain share of the energy input, primarily to increase pull rates and minimize the specific energy consumption (SEC) [
24]. While regenerative furnaces are horizontal melters, all-electric furnaces are mostly vertical melters.
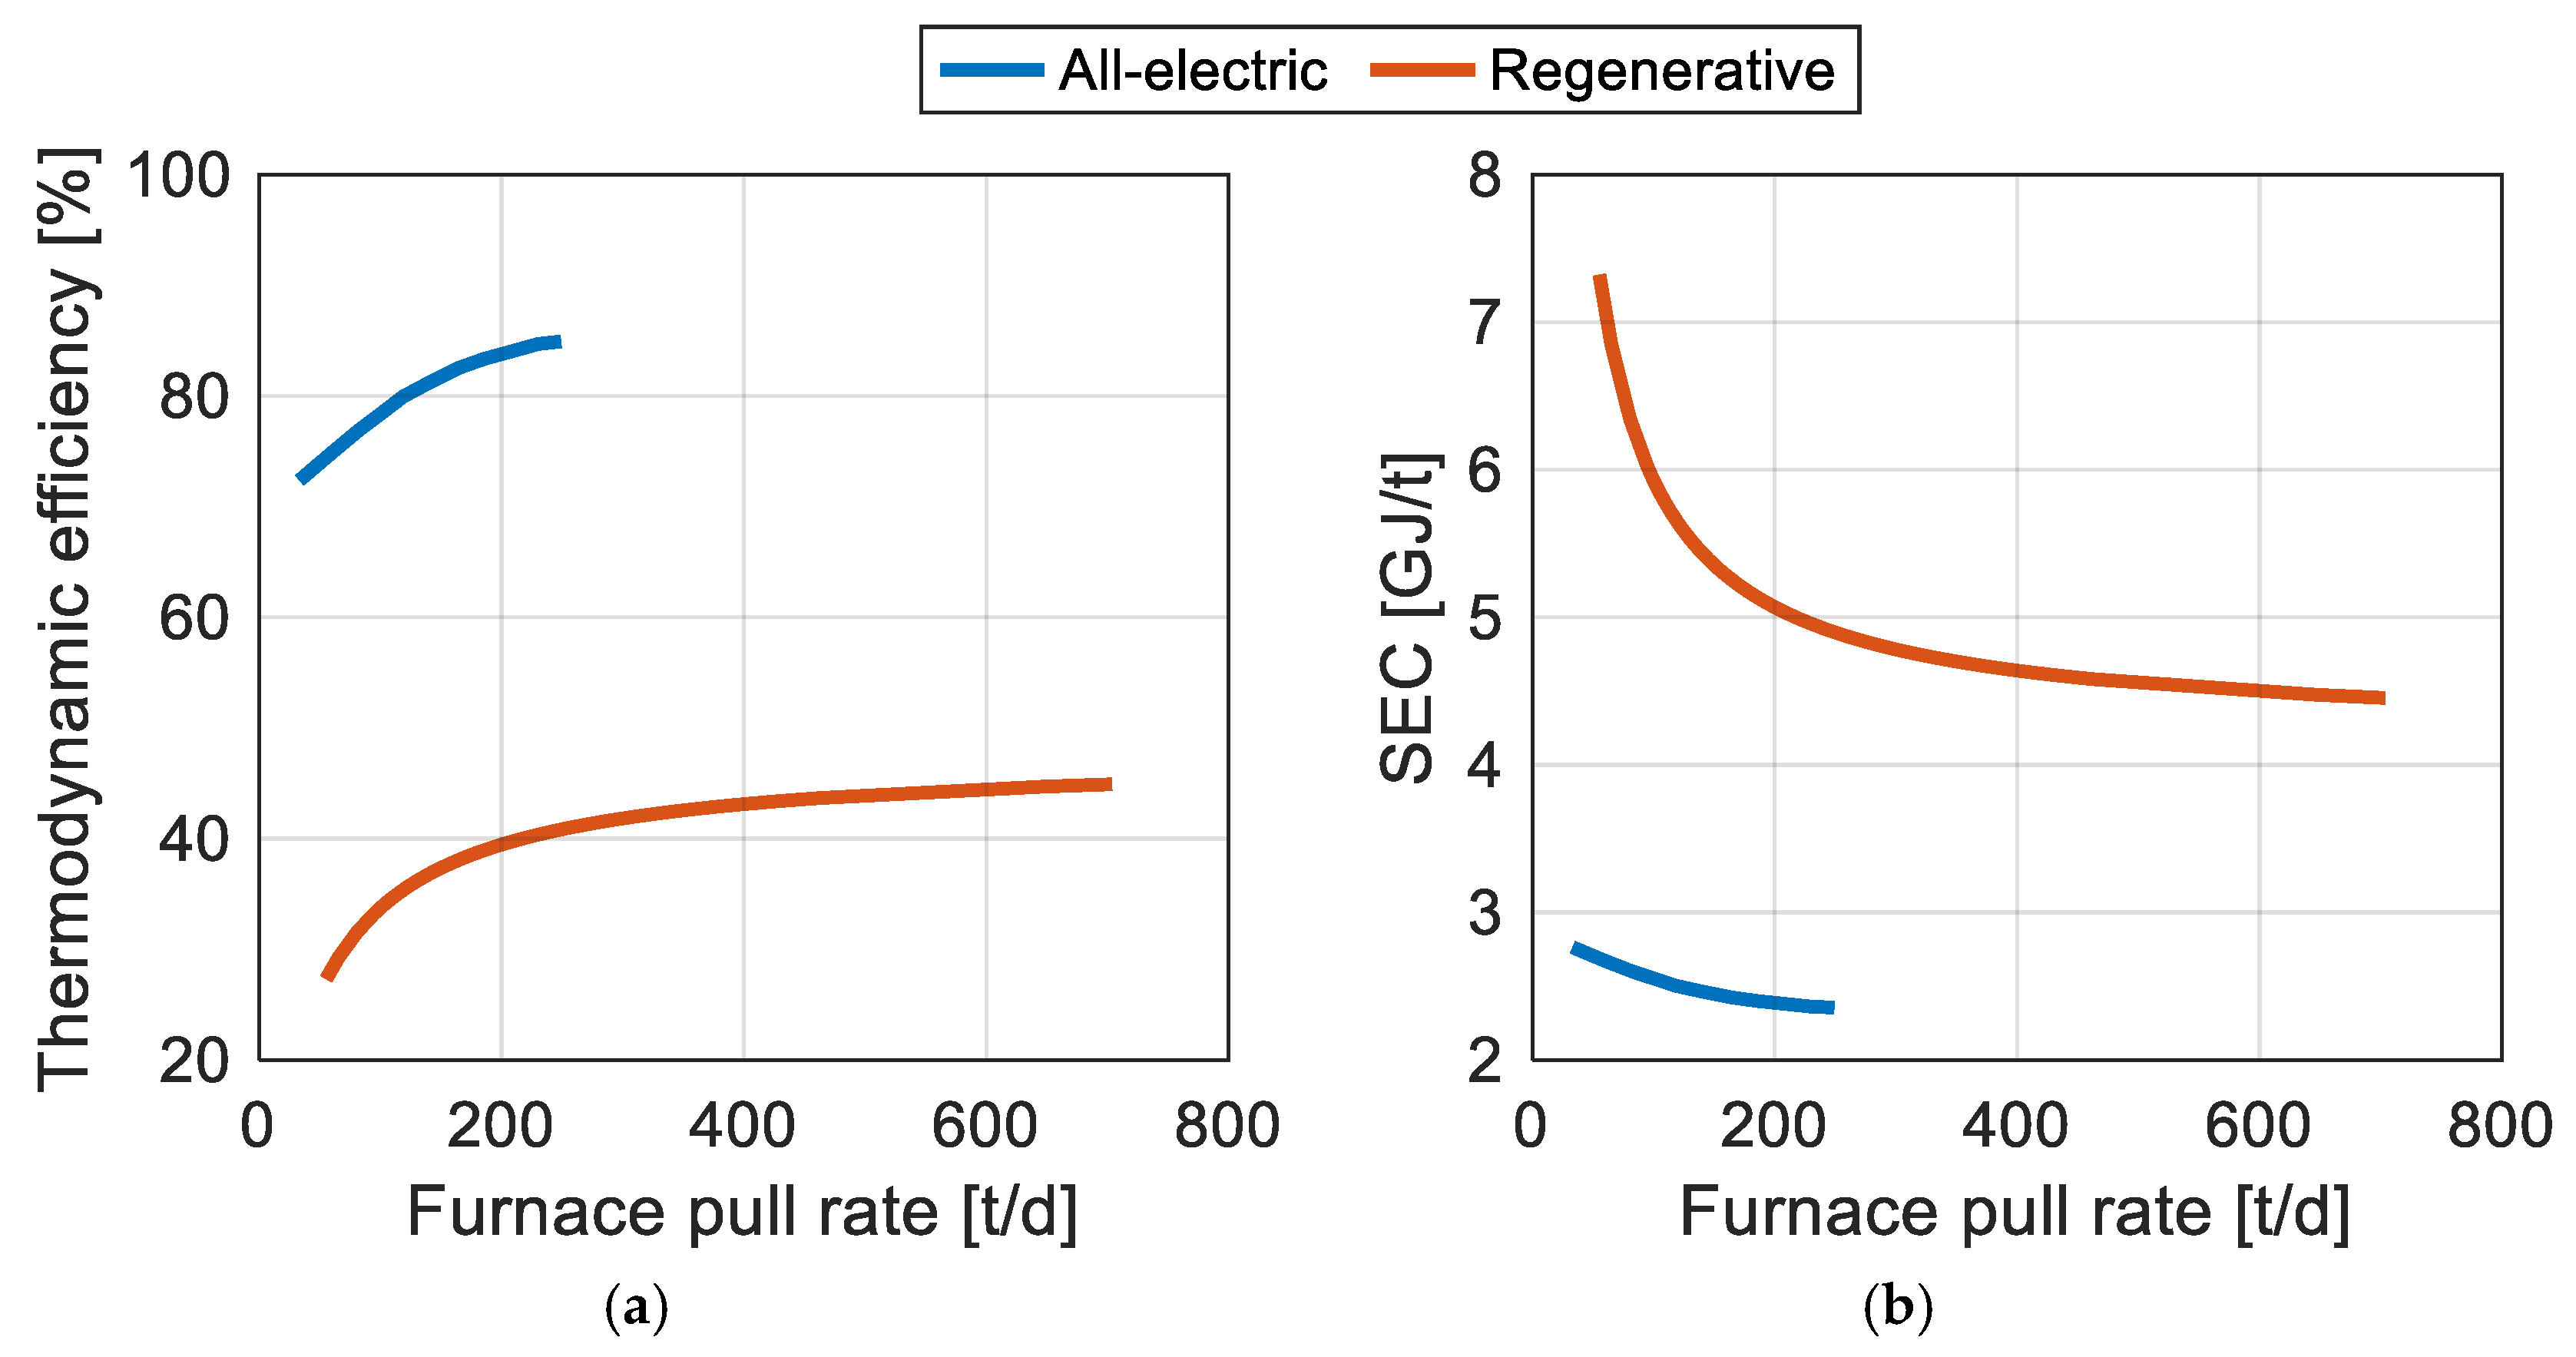
Figure 1 shows the thermodynamic efficiencies and SECs for all-electric and regenerative furnaces, assuming an exploited heat of around 2 GJ/t [
31]. As can be seen, all-electric melting is more efficient as it eliminates energy losses with the flue gases, but it is limited to nominal pull rates below 250 t/d. Other main drawbacks of all-electric melting are higher energy electricity prices compared to natural gas, restrictions in cullet use, lower furnace flexibility, shorter furnace lifetime, and less-experienced operators [
23].
Hybrid furnaces can solve most of the disadvantages of all-electric furnaces regarding production size, furnace lifetime, etc. Nonetheless, when aiming to operate hybrid furnaces at high boosting levels, several technical problems arise [
37]. These include a reduction in the heat flux above the melt surface and a consequent decrease in the combustion space temperature, which affects the mechanical stability and lifetime of the crown. Simultaneously, the heat flux below the surface increases, resulting in a higher temperature in the melt, which may lead to reaching chemical fining conditions below the batch blanket. Additionally, a significant modification of the convection patterns inside the glass melt arises, which can influence glass residence time inside the furnace.
2.2. Case Study and System Layout
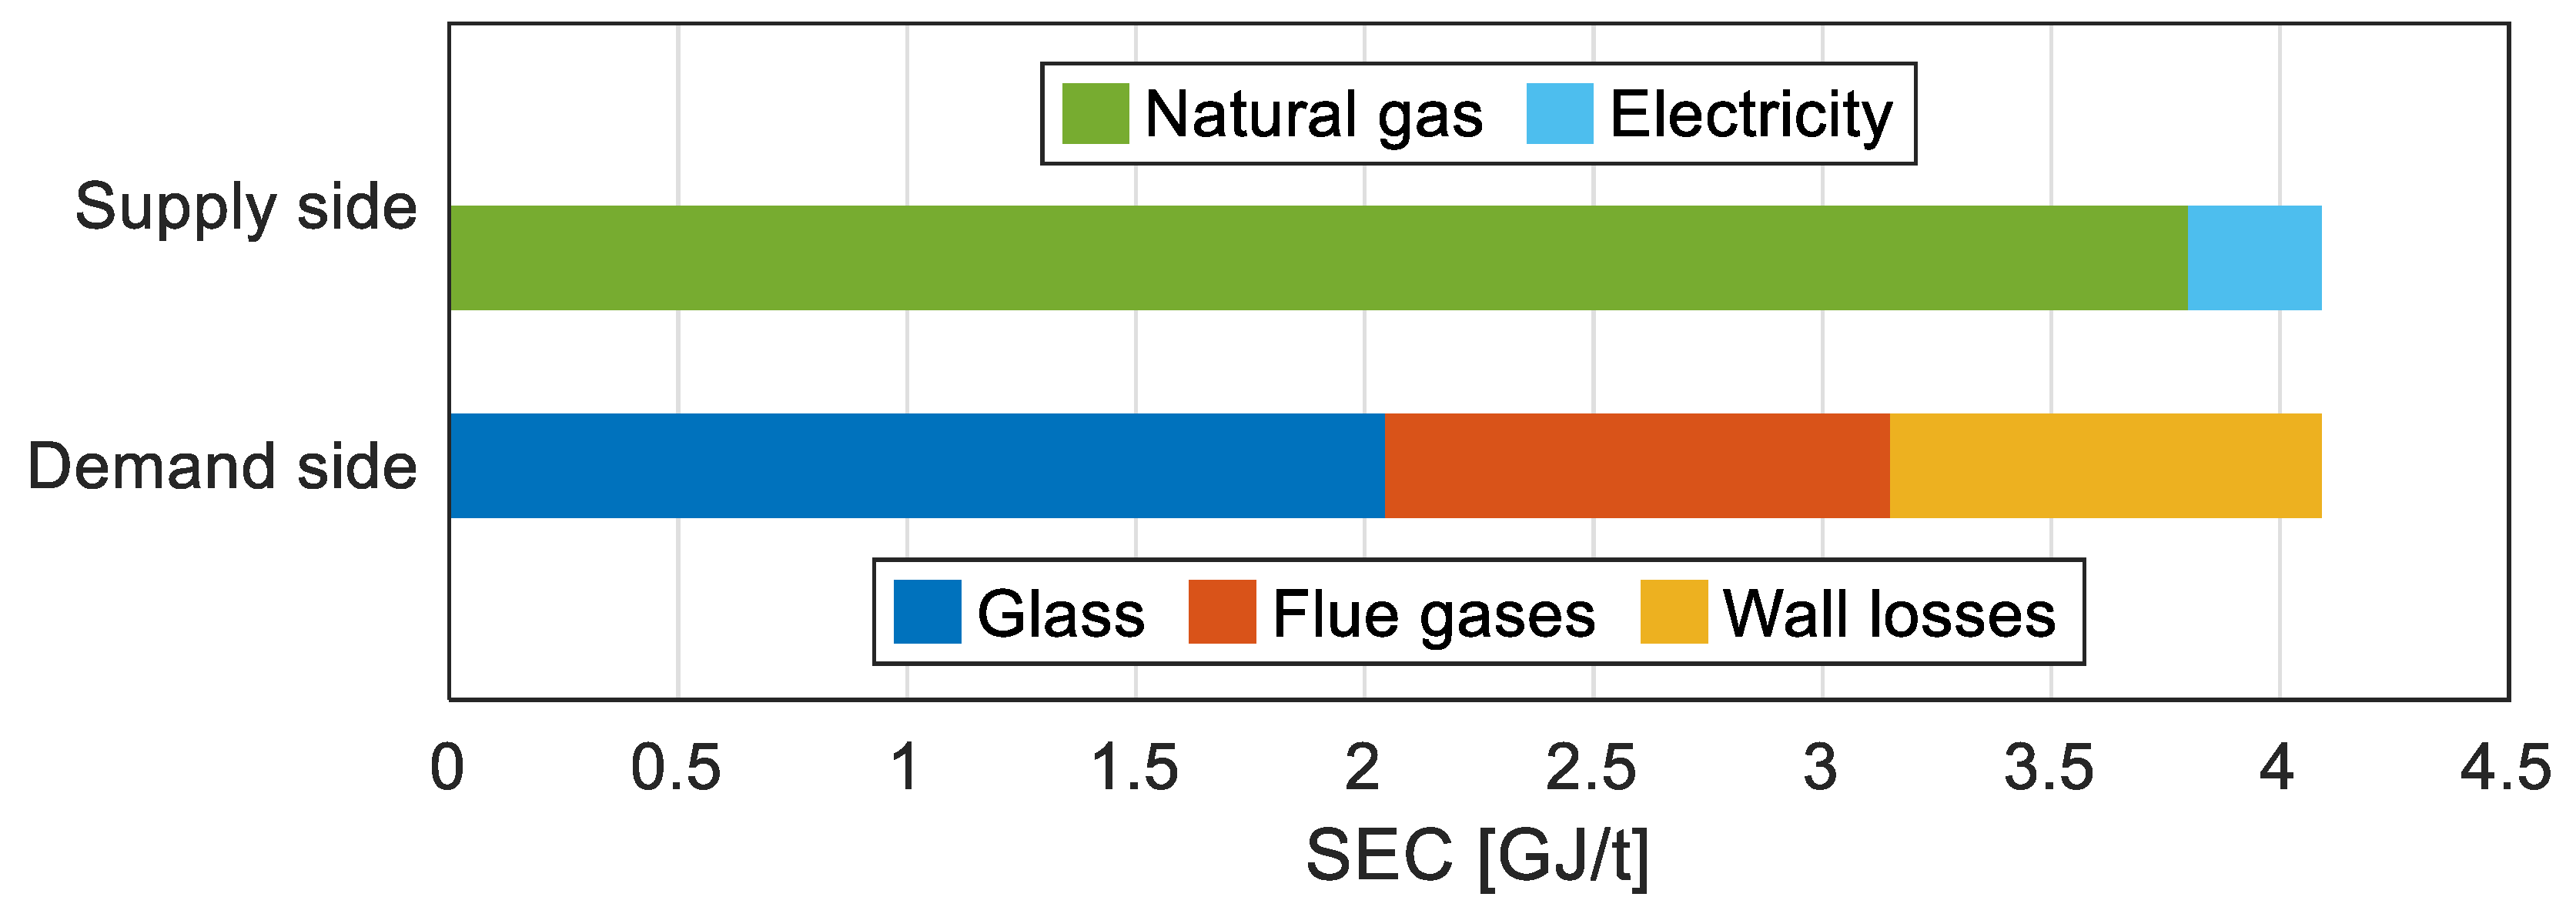
This study considers a 300 t/d oxyfuel container glass furnace with a nominal boosting power of 1 MW as a case study. As illustrated in
Figure 2, the SEC is equal to 4.35 GJ/t, consisting of 3.8 GJ/t of fuel input, 0.29 GJ/t of electric input, and 0.26 GJ/t required for oxygen generation (assuming electricity consumption equal to 250 kWh/tO
2) [
38]. The furnace has a thermodynamic efficiency of about 50%, with 27% energy losses due to flue gases and 23% due to wall losses. These values are in line with those presented in
Figure 1, considering that modern oxyfuel furnaces can be slightly more efficient than typical regenerative furnaces [
25].
The layout of the overall system under consideration is shown in
Figure 3 for four different configurations. The pink elements represent the conventional configuration of a hybrid glass furnace, where the fuel burners and boosting electrodes are fed from the natural gas and electricity grids, respectively. In green, a basic integration configuration consists of the furnace’s direct integration with a renewable energy plant consisting of PV modules. In yellow, the battery storage integration scenario implements energy storage to shift surplus energy during peak hours to hours where generation decreases. In blue, the hydrogen integration scenario includes a PEM electrolyzer to produce hydrogen and a pressurized hydrogen tank equipped with a hydrogen compressor. In this case, the electricity produced by the renewable plant can be streamlined to the furnace electrodes, sent to the electrolyzer to avoid excess renewable generation, or sent to the electricity grid.
3. Glass Furnace Energy Optimization Model
For the energy modeling of the overall system considered, a MILP optimization framework is proposed, which allows for the optimal operation of the battery and hydrogen storage systems considered. This section describes the main component modeling choices, the MILP formulation, and the definition of the key performance indicators (KPIs) that are used to compare different integration configurations.
3.1. Component Modeling
3.1.1. Glass Furnace
To simplify the modeling of the furnace under different boosting ratios, SEC variations are linearized between the nominal condition, corresponding to around 7% boosting, and the condition of 100% boosting, with the latter corresponding to a direct SEC of 2.98 GJ/t due to the absence of energy losses with flue gases. The resulting SECs under varying boosting ratios are reported in
Table 2. The results are conservative with respect to a 320 t/d oxyfuel furnace that is estimated to reach 2.6 GJ/t for a boosting ratio of around 67% [
19]. The pull rate is assumed to remain constant throughout the year, as most container glass furnaces are continuously operated under nominal conditions without seasonal variations.
3.1.2. Solar Plant
To investigate the integration of renewable energy into the glass industry, this paper considers different sizes of solar PV plants. The energy coverage is assumed to vary between 25%, 50%, 75%, 100%, 125%, and 150% of the nominal annual energy demand in the conventional configuration, including the generation of oxygen, which is around 132 GWh/y. This approach enables the evaluation of different scenarios of renewable energy integration in the glass industry.
The nominal power of the solar plant
can be expressed as shown in Equation (1), where
is the nominal SEC expressed in MWh/t,
is the nominal production capacity equal to 300 t/d,
is the energy coverage varying between 0.25 and 1.5, and
is the capacity factor of PV modules, expressed in equivalent hours.
Due to the energy-intensive nature of glassmaking, a single renewable energy plant installed at or near the furnace site can hardly cover a significant proportion of the energy demand. However, a systemic approach to the decarbonization of energy-intensive industries can be based on the aggregation of renewable electricity generation plants at locations other than the industrial customer’s [
39]. Accordingly, rather than using the output profile of a single plant that represents a specific location, this study considers national-level nominal generation profiles and capacity factors based on data from ENTSO-E [
40].
The furnace is assumed to be located in Italy, so the capacity factor for solar is equal to 1122 h [
41]. The rated powers of the solar plant across different energy coverage levels are summarized in
Table 3. For a 1:1 ratio between energy generation and energy demand, the corresponding rated power is equal to 110.82 MW. It is important to note that even at a boosting ratio of 80%, the furnace electrical nominal power reaches only 8.95 MW, implying that a large oversizing of the solar plant is required due to its intermittent nature.
The daily energy generation profile is illustrated in
Figure 4, together with the energy demand, showing the seasonal and daily imbalance between energy supply and demand. On a daily scale, excess energy is observed only when renewable energy coverage is at least 75%. However, it should be noted that, on an hourly scale, a small energy surplus occurs during the hot season, even at an energy coverage level as low as 25%.
3.1.3. Storage Options
In the battery configuration scenario, 4 h of storage are considered typical of grid-scale batteries. The charging capacity of the battery is assumed to vary between 10% and 100% of the solar energy availability. The sizing of a PEM electrolyzer depends on the trade-off between overall operational efficiency and total hydrogen production. To derive general guidelines, it can be parametrized depending on renewable energy availability [
42]. In most studies, hydrogen allocation is fixed to a certain threshold in order to promote economic viability [
43]. However, to ensure a fair comparison between battery and hydrogen storage, it is essential that no arbitrary prioritization is performed. In this study, the size of the PEM electrolyzer is assumed to vary between 10% and 100% of the solar rated power for each of the different solar coverage levels.
The electrolyzer is modeled to operate in the range of 15–100% of nominal input power
, with an efficiency expressed as Equation (2), adapted from the relation proposed in [
44], where
is the electrolyzer efficiency,
is the electrolyzer input power, and
is the nominal input power. In this study, no degradation has been considered, although it is relevant when evaluating lifetime performance [
45].
In the hydrogen configuration, a hot standby battery is assumed to be installed to maintain the electrolyzer ready to resume operation without delays, estimating a power consumption equal to 1.5% of the electrolyzer’s nominal power during nonproductive hours [
43]. For the sizing of the hydrogen tank, a storage capacity of 1 day is considered. For a hydrogen compressor up to 200 bar, a specific energy consumption of 4 MJ/kg is assumed [
46]. It is considered that 9 kg of water is required to produce 1 kg of hydrogen, with a lower heating value (LHV) of 120 MJ/kg. The oxygen required is assumed to be entirely available from electrolysis, thus reducing the electricity consumption for oxygen generation.
3.2. MILP Formulation
An optimization problem is formulated to determine the optimal hourly energy supply of the hybrid glass furnace, with the objective of minimizing melting costs. A MILP approach is chosen as it is well-suited to the problem’s linear objective function and constraints, ensuring the identification of the global optimum. The optimization is solved with an hourly time resolution considering a 7-day horizon in order to account for the variability of renewable energy generation and leverage the presence of the hydrogen tank. The optimization problem is defined in Equation (3), where
is the objective function,
is the weekly optimization horizon,
is the vector of N optimization variables, and Ω is the feasible space delimited by the set of constraints.
Glass melting costs are chosen as the objective function (Equation (4)), including the costs of natural gas and electricity purchases obtained by multiplying the purchase volumes
and
by their specific prices
and
, the costs of direct carbon emissions obtained by multiplying the natural gas input by the CO
2 emission factor
and the price of CO
2 , and the cost of water obtained by multiplying the purchase volume
by its price
. Oxygen is assumed to be produced locally rather than purchased, whereas surplus electricity is directed toward the grid without economic incentive.
The optimization problem is constrained by a set of rules that ensure proper energy supply to the furnace. The constraint on the electric bus is expressed in Equation (5), where
is the hourly solar power generation,
and
are the charge and discharge of the battery storage,
is the power consumption of the electrolyzer,
is the power consumption of the electrolyzer due to the hot-standby during non-working hours,
is the power consumption of the hydrogen compressor,
and
are the power imported or exported from the electricity grid,
represents the furnace electrical input, and
represents the energy demand for oxygen generation.
The constraint on the thermal bus is expressed as in Equation (6), where
is the energy content of PEM hydrogen generation,
and
represent the charge and discharge of the hydrogen tank,
is the purchase from the natural gas grid, and
represents the furnace thermal input.
The operation of the hydrogen storage is modeled as suggested in [
47] by imposing some constraints built with integer optimization variables that control the on–off status of the storage and the mutually exclusive charging or discharging mode. One single value is assumed for both the efficiency of charge and discharge, equal to 0.98 for battery and 1 for hydrogen storage. The state of charge is constrained to be equal at the beginning and end of the optimization horizon. An additional constraint is used to ensure that hydrogen storage is charged only by the PEM electrolyzer.
3.3. Key Performance Indicators
The three different configurations are compared in terms of a set of KPIs that assess economic and environmental performance as well as the degree of renewable energy integration.
Specific melting costs , defined as a yearly average of natural gas and electricity purchase and , CO2 quotas from the carbon market , and water purchase (Equation (7)), are used as a first economic KPI. Specific emissions , defined as a yearly average of natural gas direct emissions and electricity indirect emissions , are used as the environmental KPI (Equation (8)).
For renewable energy integration, two indicators are considered, namely, the self-consumption and self-production rates
and
. Self-consumption rates
measure the share of energy used within the designed system and are defined as the ratio of annual solar energy generation
minus the electricity purchase
over the solar energy generation
(Equation (9)). Self-production rates
measure the share of energy produced by the solar plant on the total energy supply and are defined as the ratio of annual solar energy generation
minus the electricity purchase
over the solar energy generation
plus the natural gas and electricity purchase
and
(Equation (10)).
These indicators enable the comparison of operational costs and emissions across different integration configurations. However, a comprehensive techno-economic assessment requires the inclusion of capital investment costs, which allows for a more accurate evaluation of the economic viability of each solution. To this purpose, cost premiums
are defined as the ratio between the sum of capital investments
and operational costs
of the various components (PV, furnace boosting, batteries, PEM electrolyzer, hydrogen compressor, and hydrogen storage tank) plus the actualized sum of energy costs of melting
over the actualized sum of energy costs of melting in the conventional configuration
(Equation (11)). This KPI does not actually represent a levelized cost of melting because it does not include the capital investments for the base case furnace. It can be used to determine the premium costs associated with the realization of a certain decarbonization target.
The main economic data for the techno-economic assessment are shown in
Table 4. The electricity and natural gas prices are those of the first semester of 2024 for the corresponding band of industrial consumers and are equal to 167.7 EUR/MWh and 51.4 EUR/MWh, respectively [
48,
49]. The cost of water is assumed to be 3.58 EUR/m
3 [
43], while the cost of CO2 is assumed to be 75 EUR/t, in line with forecasts for 2025. The discount rate
is assumed to be equal to 4%.
4. Techno-Economic Assessment of Solar Integration
For clarity, weekly and yearly patterns of energy flows are provided in the
Supplementary Material for two representative battery and hydrogen configurations, while the results are here analyzed in terms of the KPIs.
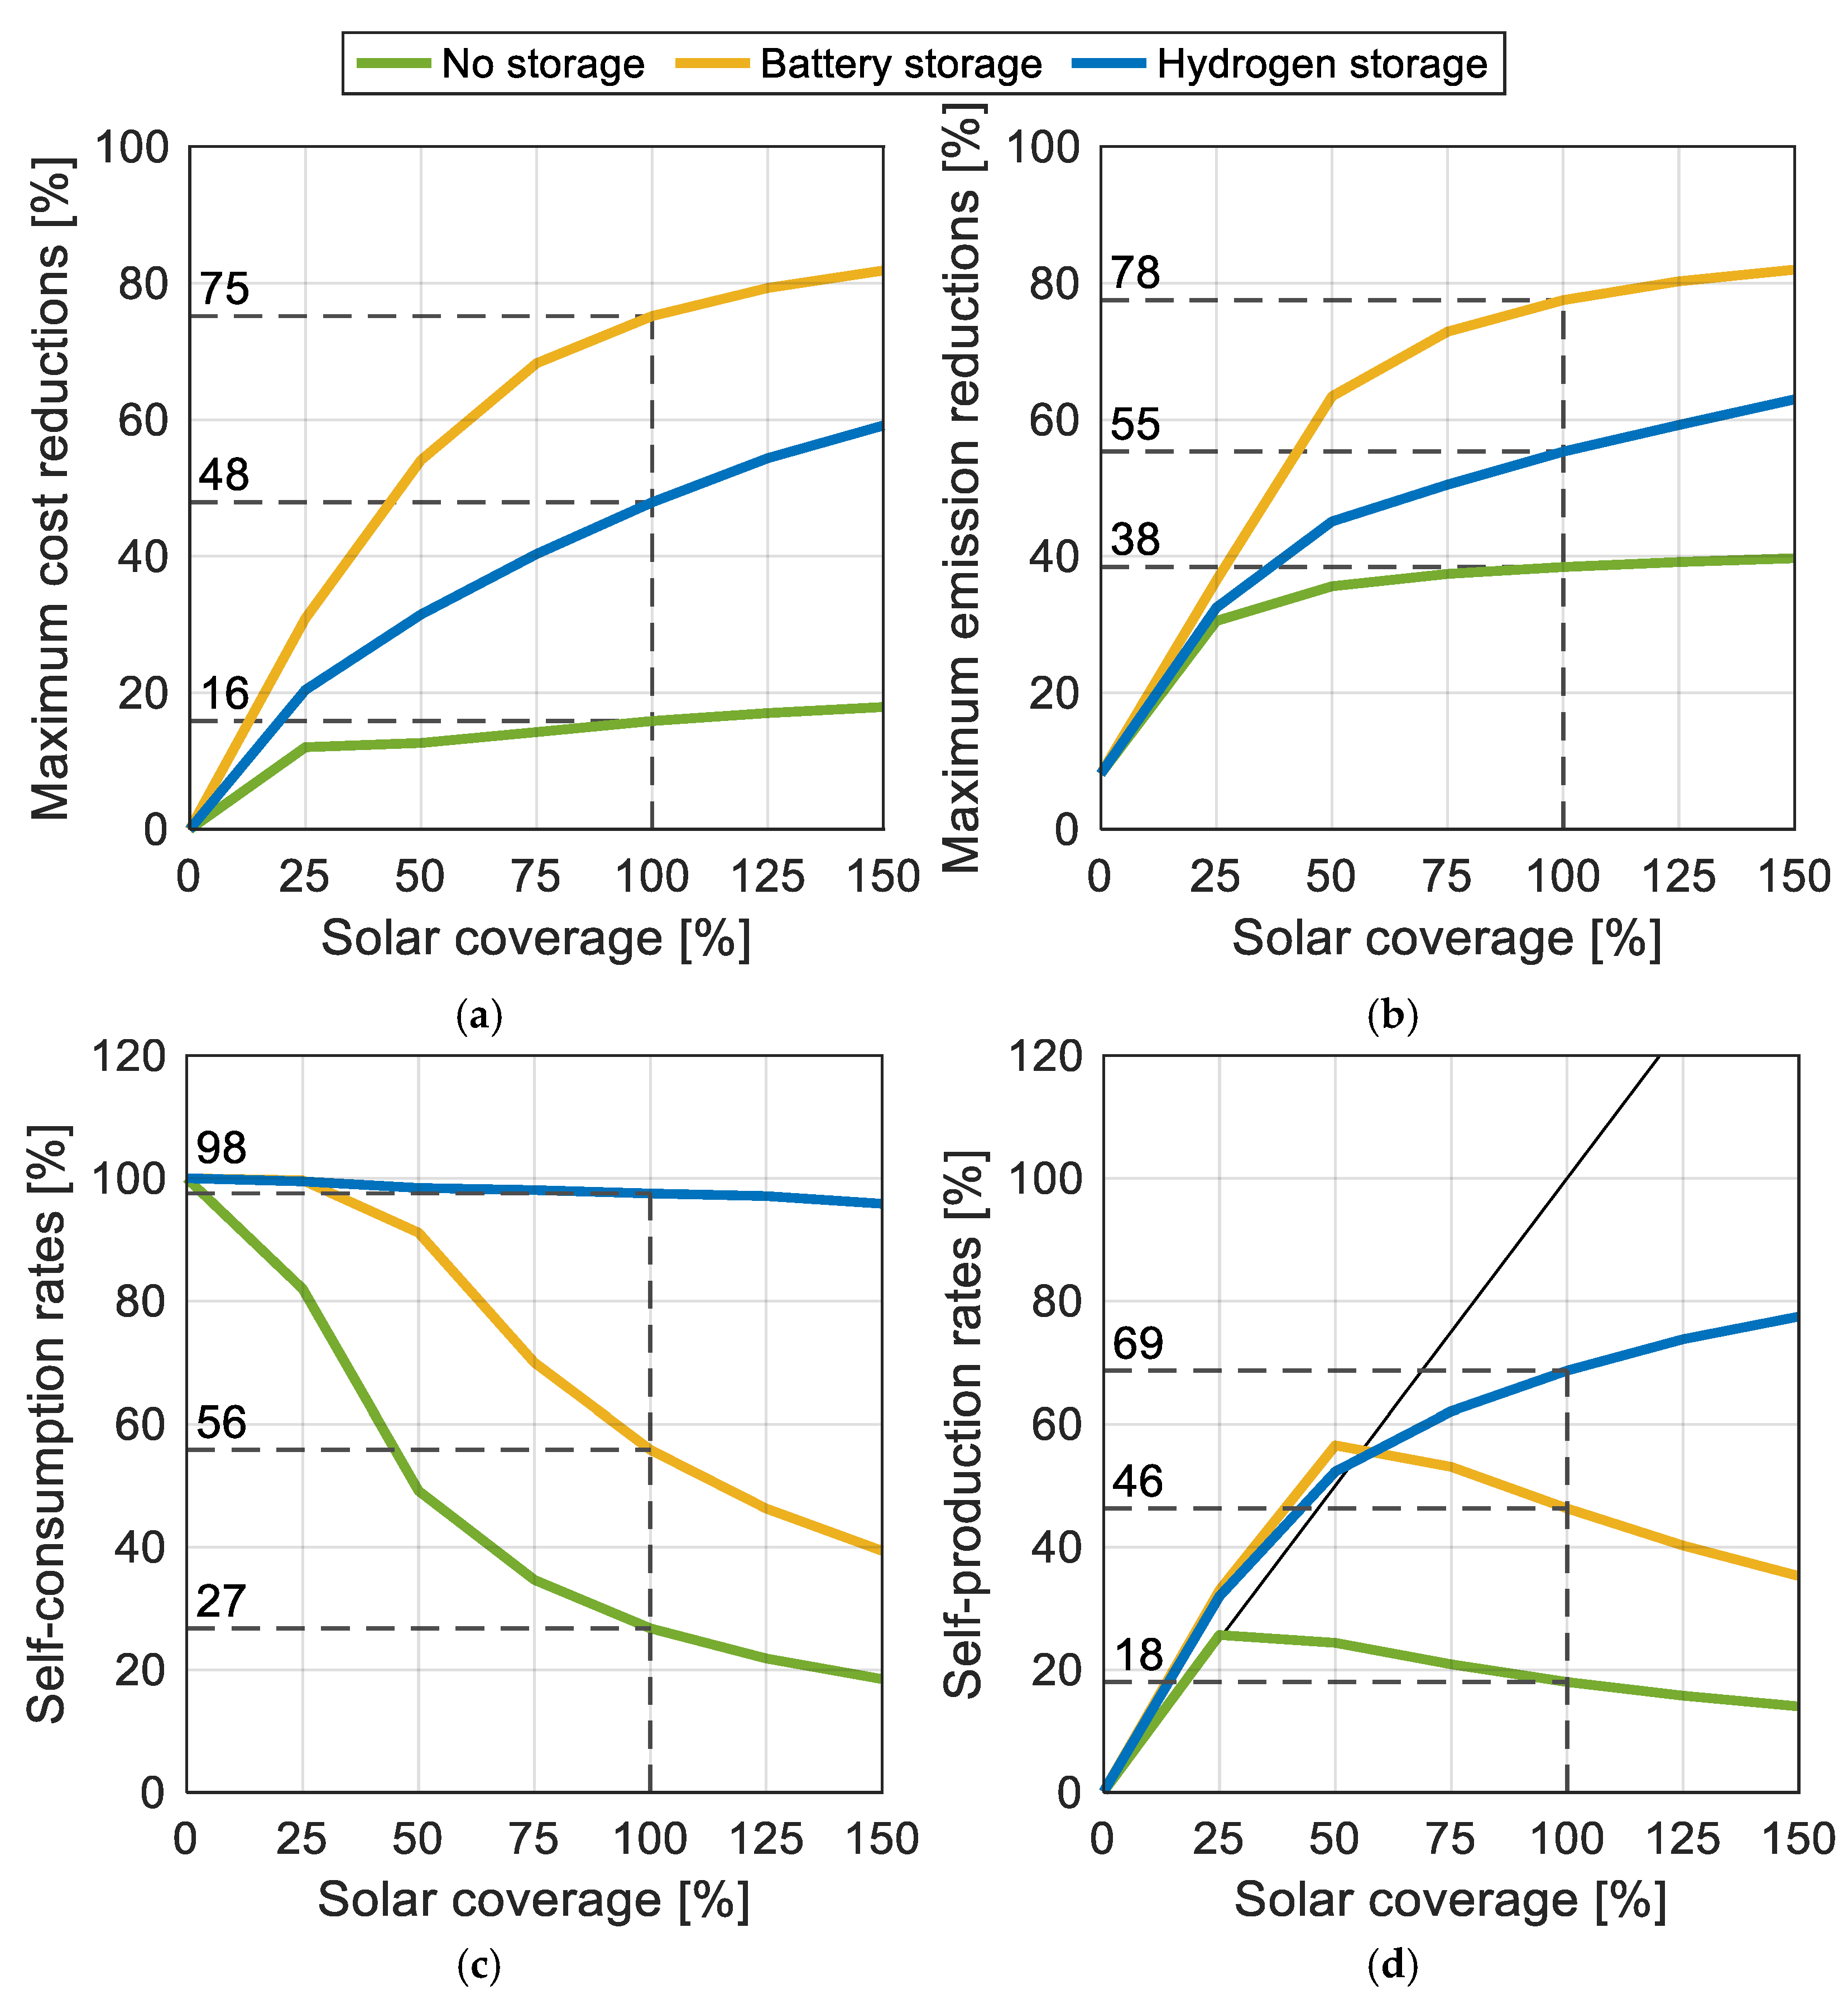
Figure 5 illustrates the economic, environmental, and renewable integration KPIs of the three different solar integration strategies under optimal boosting conditions. These optimal levels vary depending on the system configuration, solar energy coverage, and the specific KPI considered. Direct solar coupling and battery storage benefit from higher boosting levels: maximum emissions reduction and renewable integration are achieved at 80% boosting across all solar coverage levels, while specific melting costs are minimized at this level provided that solar coverage is at least 75% for direct coupling and 50% for battery storage. In contrast, hydrogen integration favors lower boosting levels: cost reductions peak at 7% across all solar coverage levels, while the optimal boosting levels for emissions reduction and renewable integration decline as solar coverage increases.
At a solar energy coverage level of 100%, direct solar integration is able to reduce melting costs and carbon emissions by only 16% and 38%, respectively. This demonstrates the need for advanced integration configurations in order to favor solar penetration in the glass industry. Battery storage achieves 75% cost reductions and 78% emission reductions, whereas hydrogen storage contribution is limited to 48% and 55% cost and emission reductions. From a renewable integration standpoint, direct solar integration achieves only 27% and 18% self-consumption and self-production rates, due to the relevant hourly and seasonal variability of solar electricity generation. The inclusion of a battery increases self-consumption and self-production rates to only 56% and 46%, respectively, due to seasonal variability. The hydrogen configuration allows for self-consumption rates of 98% and self-production rates of 69%. It is worth noting that for low solar coverage levels, both battery and hydrogen yield self-production rates higher than the solar coverage levels, thanks to the additional effect of improved overall efficiency due to higher boosting levels.
Battery configurations leverage the increased energy efficiency of electric melting, also enabling solar energy to displace larger amounts of grid electricity, which is more expensive than natural gas. Conversely, hydrogen-based solutions introduce additional conversion losses through electrolysis while retaining the less efficient combustion-based melting process. The higher overall energy demand is offset by reduced electricity exports to the grid, enabling greater self-sufficiency. However, substituting natural gas demands leads to smaller economic savings due to its low price.
These findings demonstrate that, in the case study considered, increased electrification combined with battery storage offers a more economical and environmentally favorable solution than hydrogen combustion. However, for the purposes of energy planning, hydrogen integration would allow for modest modifications to current glass furnaces and electricity grids, which becomes a crucial aspect for planning in energy systems with a large penetration of renewables.
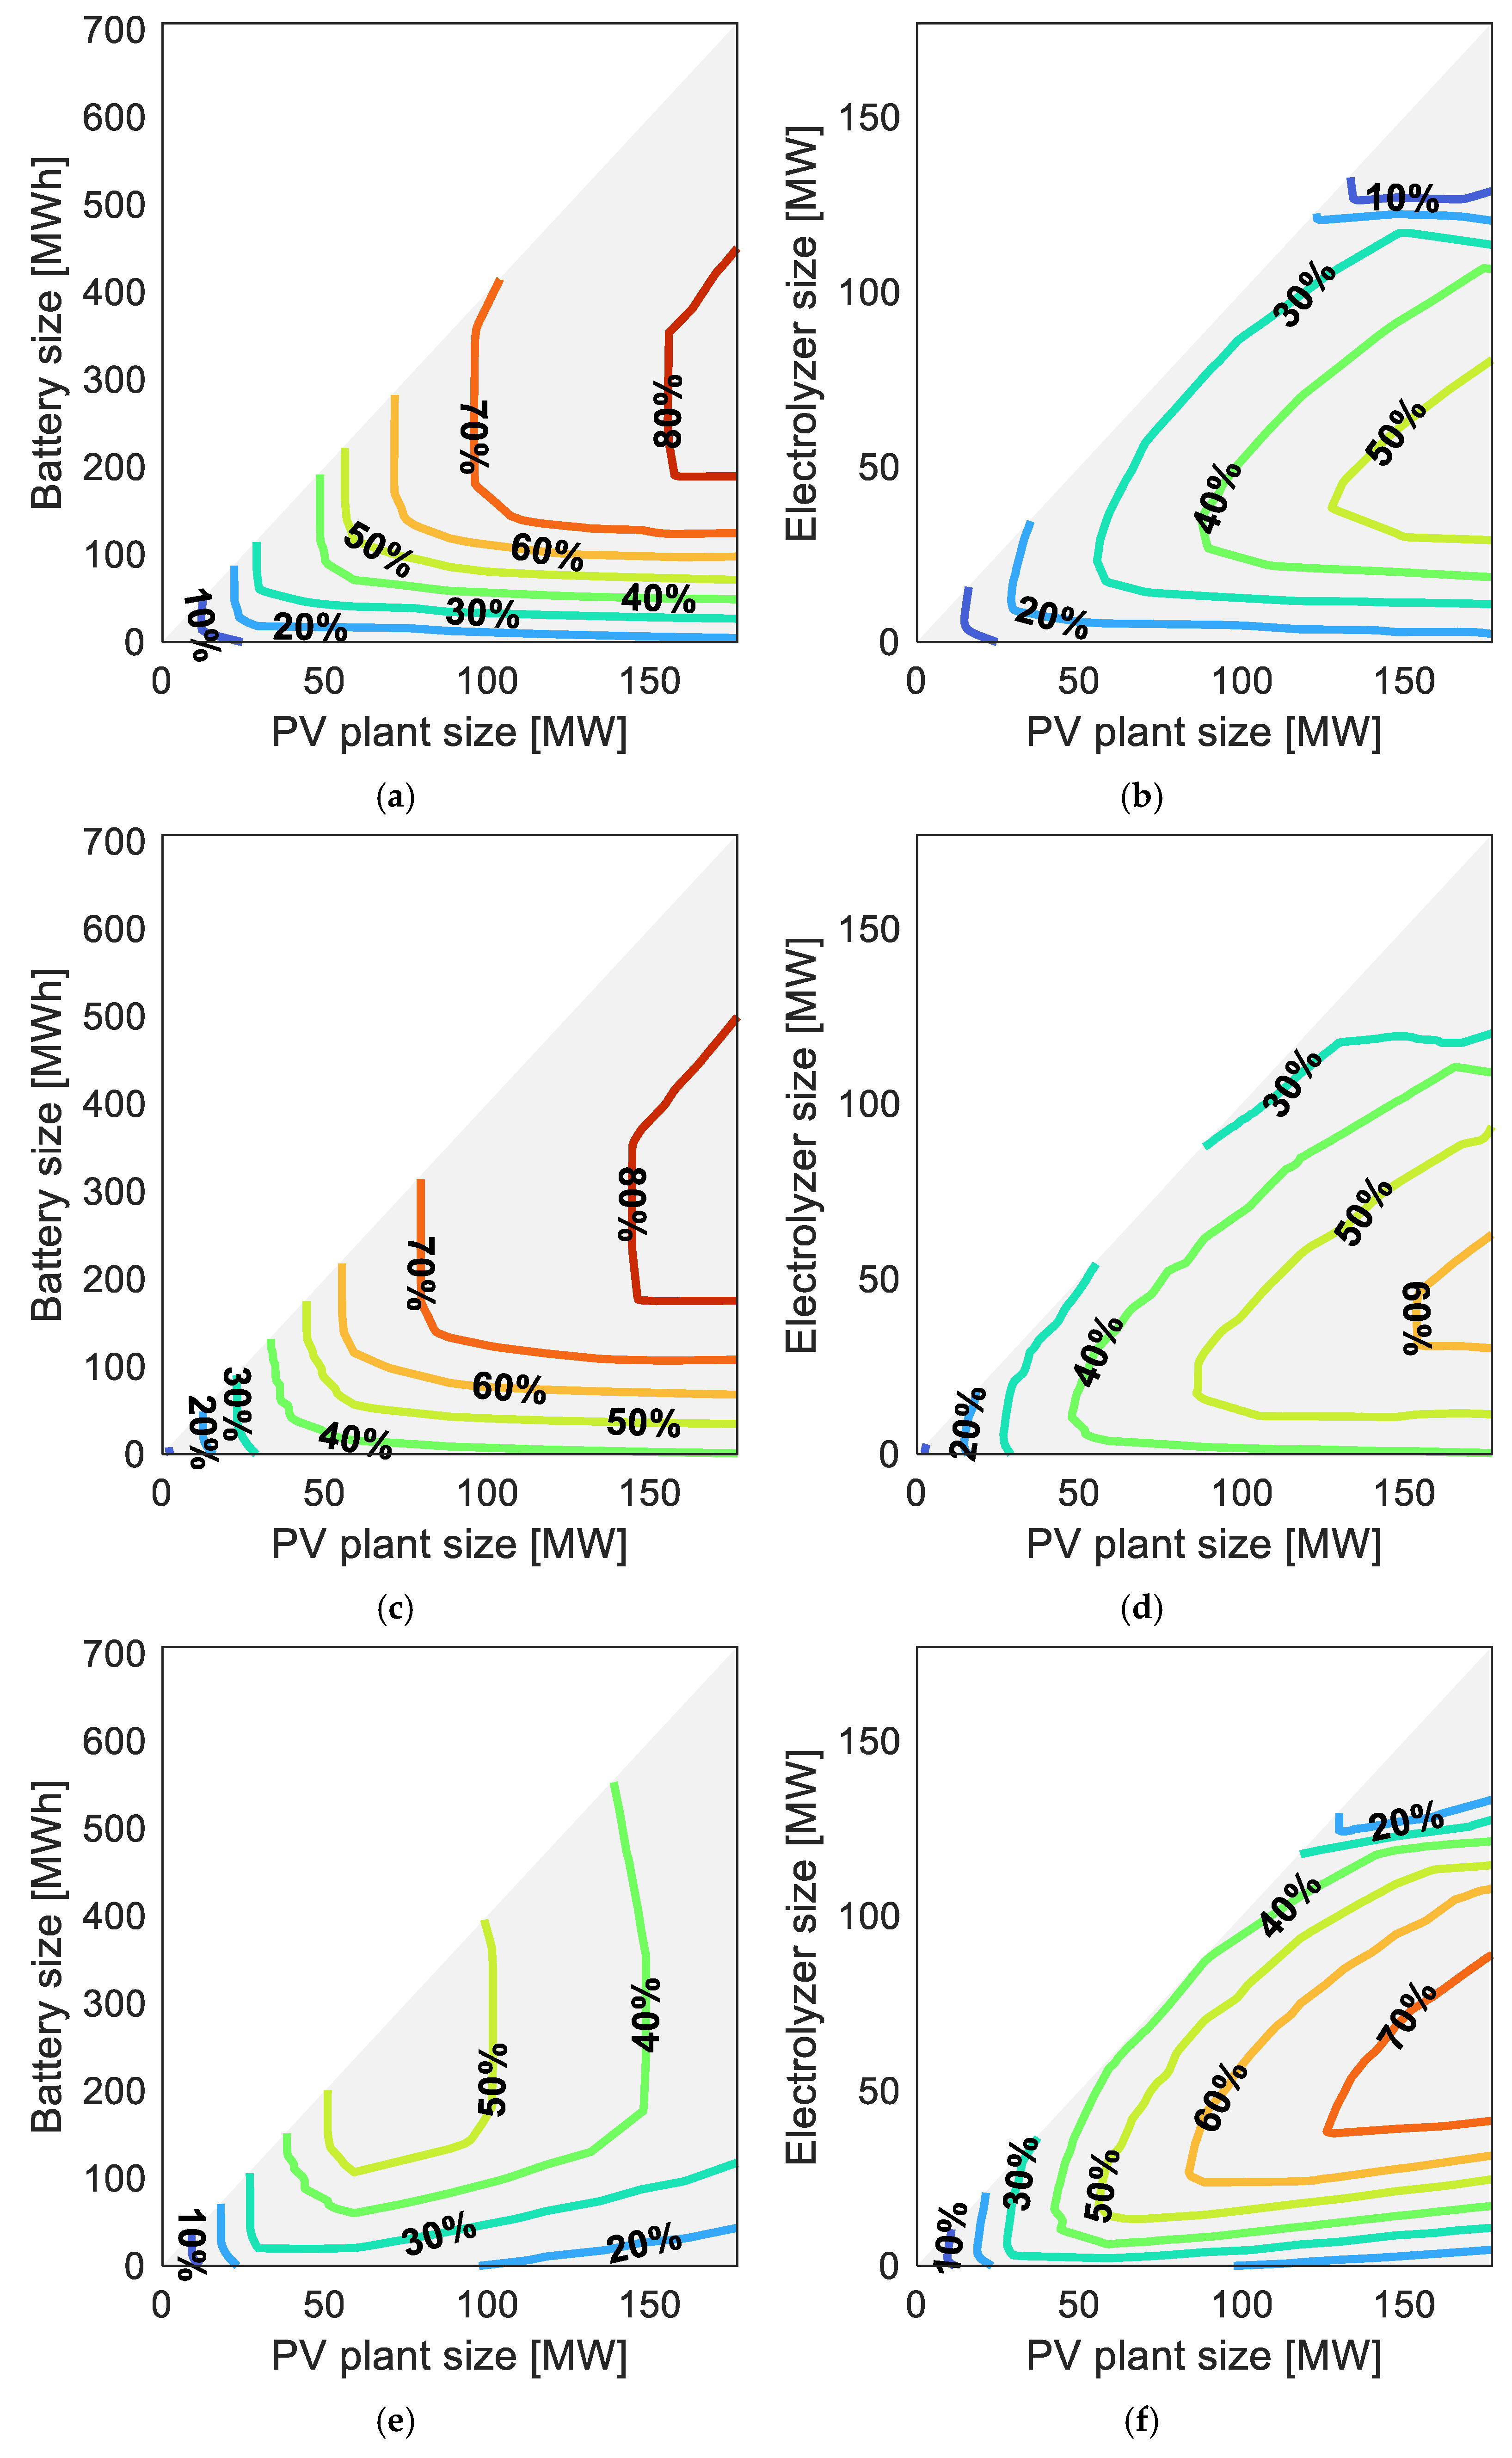
Figure 6 illustrates iso-curves of cost and emission reductions and renewable self-production rates under varying sizes of solar PV plants, battery storage, and PEM electrolyzers. It is important to note that these figures do not show the different boosting levels that undermine the maximum reductions or self-sufficiency levels. As can be seen, increasing the size of the battery storage or of the PEM electrolyzer is not always beneficial. Indeed, while undersized equipment cannot exploit the entire electricity excess, oversized equipment would operate for a limited number of equivalent hours. Cost and emission reductions patterns in the battery configuration are similar to cost and emission reductions and self-consumption rate patterns in the hydrogen configuration, which increase with the size of the PV plant. Conversely, in the battery configuration, self-production rates may decrease as the size of the solar plant increases, due to greater electricity surpluses.
Shifting from operational considerations to more comprehensive technoeconomic evaluations,
Figure 7 shows the variation of cost premiums and capacity requirements for PV plants, furnace boosting, battery storage, and PEM electrolyzers. It is worth noting that furnace boosting refers to additional values with respect to the nominal conditions of 1 MW.
Direct coupling shows good decarbonization potential for decarbonization targets, up to around 30%. Initial investment is associated with an increase in PV plants up to around 30 MW. Then, this is kept constant while boosting is increased to the highest level. The positive effect of increasing PV size without storage decreases significantly, with energy costs for glass melting almost doubling at decarbonization targets of around 40%.
The hydrogen configuration is cost-effective for decarbonization targets below 10% but becomes less competitive than direct coupling at targets up to around 35%, beyond which the performance of direct coupling declines. Nevertheless, the hydrogen pathway can extend the achievable decarbonization potential from approximately 40% to 60%, albeit at a cost premium of about 75% when targeting a 50% decarbonization level.
The battery configuration is the solution that allows the achievement of a wider range of decarbonization targets while minimizing cost premiums. Indeed, it represents a valid solution for decarbonization targets up to 80%, with moderate cost premiums for decarbonization targets up to 50%. For 35% carbon reductions, cost premiums amount to only 25% at around 25 MW of PV plant and 65 MWh of batteries. This represents a value that may be further reduced with the continuous decrease in the capital costs of PV technology as well as targeted incentives aimed at increasing the penetration of solar energy in the glass industry.
5. Conclusions
Although several decarbonization initiatives are currently in progress in the glass industry [
50], the need for a large penetration of renewable energy sources requires a systematic evaluation of alternative strategies. To this purpose, this study explored the potential of direct and hydrogen-based electrification for solar integration in the glass industry. Focusing on a representative 300 t/d oxyfuel furnace, it assesses optimal solar integration by comparing economic, environmental, and renewable integration performance across key design parameters, including solar energy availability, furnace electric boosting levels, and the sizing of battery storage and hydrogen infrastructure components.
Direct solar integration enables moderate improvements due to the large mismatch between intermittent energy generation and the continuous energy demand of glass furnaces. The implementation of battery storage favors the further electrification of the glass industry, allowing for maximum melting costs and specific emission reductions equal to 75% and 78%, respectively, under conditions of solar energy availability matching nominal demand. From an economic and environmental standpoint, hydrogen use achieves more modest results, only 55% and 48%, respectively, due to the lower overall energy efficiency. Nonetheless, it enables increased self-sufficiency of the integrated system by yielding significant reductions in grid electricity exports.
Cost premiums and capacity requirements across varying carbon reduction targets were determined through a comprehensive techno-economic assessment. Direct coupling demonstrated strong performance for moderate decarbonization efforts. As a rule of thumb, for the 300 t/d furnace considered, deploying 30 MW of PV plants combined with increased boosting up to nearly 9 MW can achieve a 30% emission reduction at a cost premium of about 25% compared to the conventional configuration. At the same cost premium, battery integration can yield an additional 5% emission reduction, resulting in a total reduction of 35%. Hydrogen integration appears as a suitable solution to extend the decarbonization target limits of direct solar coupling, but the current large investment costs do not make it a cost-effective solution.
This study provides general guidelines for renewable integration to inform decarbonization strategies in the glass industry. Its practical implementation in industrial contexts may benefit from improved component modeling, including accounting for degradation of PEM electrolyzers and more accurate furnace behavior. Additionally, comprehensive consideration of local technical and economic constraints is required, including grid interconnection limitations, power quality requirements, electricity, natural gas, and carbon prices, as well as the availability of solar and wind resources.
Supplementary Materials
The following supporting information can be downloaded at:
https://www.mdpi.com/article/10.3390/solar5030035/s1, Figure S1: Weekly energy flows for a representative battery storage configuration: (a) electric, (b) thermal; Figure S2: Yearly balances for a representative battery storage configuration: (a) inputs, (b) outputs; Figure S3: Weekly energy flows for a representative hydrogen storage configuration: (a) electric, (b) thermal; Figure S4: Yearly balances for a representative hydrogen storage configuration: (a) inputs, (b) outputs.
Author Contributions
Conceptualization, L.M. and A.F.; methodology, L.M.; software, L.M.; validation, L.M.; formal analysis, L.M.; investigation, L.M.; resources, L.M.; data curation, L.M.; writing—original draft preparation, L.M.; writing—review and editing, L.M. and A.F.; visualization, L.M.; supervision, A.F.; project administration, A.F.; funding acquisition, A.F. All authors have read and agreed to the published version of the manuscript.
Funding
This work was supported by the National Recovery and Resilience Plan (NRRP), Mission 4 Component 2 Investment 1.3—Call for tender No. 1561 of 11.10.2022 of Ministero dell’Università e della Ricerca (MUR), and by the European Union—NextGenerationEU. Award Number: Project code PE0000021, Concession Decree No. 1561 of 11.10.2022 adopted by Ministero dell’Università e della Ricerca (MUR), CUP I53C22001450006, according to attachment E of Decree No. 1561/2022, Project title “Network 4 Energy Sustainable Transition—NEST”.
Data Availability Statement
Data will be made available on request.
Conflicts of Interest
The authors declare no conflicts of interest.
Nomenclature
| Abbreviations | |
| CCUS | Carbon Capture, Utilization, and Storage |
| LHV | Lower Heating Value |
| KPI | Key Performance Indicator |
| MILP | Mixed Integer Linear Programming |
| PEM | Proton Exchange Membrane |
| PV | Photovoltaics |
| SEC | Specific Energy Consumption |
| Symbols | |
| Cost [EUR] |
| Specific cost [EUR/MWh] or [EUR/t] or [EUR/m3] |
| Capacity factor [h] |
| Discount rate [%] |
| Energy coverage [%] |
| CO2 emission factor [t/MWh] |
| Objective function [EUR] |
| Water purchase [m3] |
| Generic component [-] |
| Key performance indicator [variable] |
| Generic year [-] |
| Number of components [-] |
| Number of days [-] |
| Number of years [-] |
| Hourly-averaged thermal power [MWh] |
| Specific energy consumption [GJ/t] |
| Optimization time horizon [d] |
| Generic hour [-] |
| Furnace pull rate [t/d] |
| Hourly-averaged electrical power [MWh/h] |
| Optimization timestep [h] |
| Efficiency [%] |
| Subscripts | |
| Battery storage |
| Capital expenditures |
| Storage charge |
| Carbon dioxide |
| Storage discharge |
| Economic |
| Electricity |
| Environmental |
| Furnace |
| Grid import |
| Grid export |
| Hydrogen compressor |
| Water |
| Hydrogen storage |
| Melting |
| Natural gas |
| Nominal value |
| Oxygen |
| Operational expenditure |
| PEM electrolyzer |
| Solar plant |
| Renewable |
| Standby |
| Self-consumption |
| Self-production |
| Specific |
| Total |
References
- IRENA. Renewable Capacity Statistics; International Renewable Energy Agency: Abu Dhabi, United Arab Emirates, 2025; ISBN 978-92-9260-652-7. Available online: https://www.irena.org/Publications/2025/Mar/Renewable-capacity-statistics-2025 (accessed on 27 July 2025).
- Franco, A.; Miserocchi, L.; Testi, D. Energy Indicators for Enabling Energy Transition in Industry. Energies 2023, 16, 581. [Google Scholar] [CrossRef]
- Kermeli, K.; Ter Weer, P.-H.; Crijns-Graus, W.; Worrell, E. Energy Efficiency Improvement and GHG Abatement in the Global Production of Primary Aluminium. Energy Effic. 2015, 8, 629–666. [Google Scholar] [CrossRef]
- Laurijssen, J.; Marsidi, M.; Westenbroek, A.; Worrell, E.; Faaij, A. Paper and Biomass for Energy? Resour. Conserv. Recycl. 2010, 54, 1208–1218. [Google Scholar] [CrossRef]
- Hall, G.M.; Howe, J. Energy from Waste and the Food Processing Industry. Process Saf. Environ. Prot. 2012, 90, 203–212. [Google Scholar] [CrossRef]
- Saygin, D.; Worrell, E.; Patel, M.K.; Gielen, D.J. Benchmarking the Energy Use of Energy-Intensive Industries in Industrialized and in Developing Countries. Energy 2011, 36, 6661–6673. [Google Scholar] [CrossRef]
- He, K.; Wang, L. A Review of Energy Use and Energy-Efficient Technologies for the Iron and Steel Industry. Renew. Sustain. Energy Rev. 2017, 70, 1022–1039. [Google Scholar] [CrossRef]
- Habert, G.; Miller, S.A.; John, V.M.; Provis, J.L.; Favier, A.; Horvath, A.; Scrivener, K.L. Environmental Impacts and Decarbonization Strategies in the Cement and Concrete Industries. Nat. Rev. Earth Environ. 2020, 1, 559–573. [Google Scholar] [CrossRef]
- Zier, M.; Stenzel, P.; Kotzur, L.; Stolten, D. A Review of Decarbonization Options for the Glass Industry. Energy Convers. Manag. X 2021, 10, 100083. [Google Scholar] [CrossRef]
- Malico, I.; Nepomuceno Pereira, R.; Gonçalves, A.C.; Sousa, A.M.O. Current Status and Future Perspectives for Energy Production from Solid Biomass in the European Industry. Renew. Sustain. Energy Rev. 2019, 112, 960–977. [Google Scholar] [CrossRef]
- Paltsev, S.; Morris, J.; Kheshgi, H.; Herzog, H. Hard-to-Abate Sectors: The Role of Industrial Carbon Capture and Storage (CCS) in Emission Mitigation. Appl. Energy 2021, 300, 117322. [Google Scholar] [CrossRef]
- Philibert, C. Direct and Indirect Electrification of Industry and Beyond. Oxf. Rev. Econ. Policy 2019, 35, 197–217. [Google Scholar] [CrossRef]
- Electric Power Research Institute. Electrotechnology Reference Guide; Electric Power Research Institute: Palo Alto, CA, USA, 2011; Available online: https://www.epri.com/research/products/000000000001022334 (accessed on 27 July 2025).
- Wei, M.; McMillan, C.A.; De La Rue Du Can, S. Electrification of Industry: Potential, Challenges and Outlook. Curr. Sustain. Renew. Energy Rep. 2019, 6, 140–148. [Google Scholar] [CrossRef]
- Franco, A.; Rocca, M. Renewable Electricity and Green Hydrogen Integration for Decarbonization of “Hard-to-Abate” Industrial Sectors. Electricity 2024, 5, 471–490. [Google Scholar] [CrossRef]
- Voglar, J.; Likozar, B. Critical Perspective on Green Hydrogen-Based Seasonal Operation of Energy-Intensive Industry Sectors with Solid Products. Int. J. Hydrogen Energy 2024, 93, 910–924. [Google Scholar] [CrossRef]
- Mati, A.; Ademollo, A.; Carcasci, C. Assessment of Paper Industry Decarbonization Potential via Hydrogen in a Multi-Energy System Scenario: A Case Study. Smart Energy 2023, 11, 100114. [Google Scholar] [CrossRef]
- Superchi, F.; Mati, A.; Carcasci, C.; Bianchini, A. Techno-Economic Analysis of Wind-Powered Green Hydrogen Production to Facilitate the Decarbonization of Hard-to-Abate Sectors: A Case Study on Steelmaking. Appl. Energy 2023, 342, 121198. [Google Scholar] [CrossRef]
- Sousa, J.; Azevedo, I.; Camus, C.; Mendes, L.; Viveiros, C.; Barata, F. Decarbonizing Hard-to-Abate Sectors with Renewable Hydrogen: A Real Case Application to the Ceramics Industry. Energies 2024, 17, 3661. [Google Scholar] [CrossRef]
- Stolte, M.; Minuto, F.D.; Lanzini, A. Optimizing Green Hydrogen Production from Wind and Solar for Hard-to-Abate Industrial Sectors across Multiple Sites in Europe. Int. J. Hydrogen Energy 2024, 79, 1201–1214. [Google Scholar] [CrossRef]
- International Energy Agency. Tracking Industrial Energy Efficiency and CO2 Emissions; International Energy Agency: Paris, France, 2007; Available online: https://www.iea.org/reports/tracking-industrial-energy-efficiency-and-co2-emissions (accessed on 27 July 2025).
- Eid, J.O. Glass Is the Hidden Gem in a Carbon-Neutral Future. Nature 2021, 599, 7–8. [Google Scholar] [CrossRef]
- Muijsenberg, H.P.H.; Mahrenholtz, H.; Jandacek, P.; Hakes, S.; Jatzwauk, C. Carbon Reduction with Super Boosting and Advanced Energy Management Using Renewable Resources. In Proceedings of the 80th Conference on Glass Problems, Columbus, OH, USA, 28–31 October 2019; Sundaram, S.K., Ed.; Ceramic Transactions Series. Wiley: Hoboken, NJ, USA, 2021; pp. 71–93, ISBN 978-1-119-74490-0. [Google Scholar] [CrossRef]
- Miserocchi, L.; Franco, A.; Testi, D. Status and Prospects of Energy Efficiency in the Glass Industry: Measuring, Assessing and Improving Energy Performance. Energy Convers. Manag. X 2024, 24, 100720. [Google Scholar] [CrossRef]
- Gärtner, S.; Rank, D.; Heberl, M.; Gaderer, M.; Dawoud, B.; Haumer, A.; Sterner, M. Simulation and Techno-Economic Analysis of a Power-to-Hydrogen Process for Oxyfuel Glass Melting. Energies 2021, 14, 8603. [Google Scholar] [CrossRef]
- Daurer, G.; Schwarz, S.; Demuth, M.; Gaber, C.; Hochenauer, C. On the Use of Hydrogen in Oxy-Fuel Glass Melting Furnaces: An Extensive Numerical Study of the Fuel Switching Effects Based on Coupled CFD Simulations. Fuel 2025, 380, 133576. [Google Scholar] [CrossRef]
- Schwarz, S.; Daurer, G.; Gaber, C.; Demuth, M.; Prieler, R.; Hochenauer, C. Experimental Investigation of the Combustion Characteristics in Oxy-Fuel Combustion of Hydrogen-Enriched Natural Gas on a Semi-Industrial Scale. Int. J. Hydrogen Energy 2024, 49, 323–337. [Google Scholar] [CrossRef]
- Li, L.; Wang, B.; Jiao, K.; Ni, M.; Du, Q.; Liu, Y.; Li, B.; Ling, G.; Wang, C. Comparative Techno-Economic Analysis of Large-Scale Renewable Energy Storage Technologies. Energy AI 2023, 14, 100282. [Google Scholar] [CrossRef]
- Glass Alliance Europe. Glass Industry Calls for Urgent and Robust EU Support Measures for the Glass Sector to Face the On-Going Energy Crisis; Glass for Europe: Brussels, Belgium, 2022; Available online: https://glassforeurope.com/wp-content/uploads/2022/11/Glass-Alliance-Europe-Position-paper-on-energy-crisis-20221115.pdf (accessed on 27 July 2025).
- European Commission. Report on Energy Prices and Costs in Europe; European Commission: Brussels, Belgium, 2024; Available online: https://eur-lex.europa.eu/legal-content/EN/TXT/?uri=CELEX:52025DC0072 (accessed on 27 July 2025).
- Conradt, R. Prospects and Physical Limits of Processes and Technologies in Glass Melting. J. Asian Ceram. Soc. 2019, 7, 377–396. [Google Scholar] [CrossRef]
- Schmitz, A.; Kamiński, J.; Maria Scalet, B.; Soria, A. Energy Consumption and CO2 Emissions of the European Glass Industry. Energy Policy 2011, 39, 142–155. [Google Scholar] [CrossRef]
- U.S. Department of Energy Manufacturing Energy and Carbon Footprints 2018. Available online: https://www.energy.gov/eere/iedo/manufacturing-energy-and-carbon-footprints-2018-mecs (accessed on 27 July 2025).
- Sardeshpande, V.; Gaitonde, U.N.; Banerjee, R. Model Based Energy Benchmarking for Glass Furnace. Energy Convers. Manag. 2007, 48, 2718–2738. [Google Scholar] [CrossRef]
- Jatzwauk, C. Design and Operation of Glass Furnaces. In Encyclopedia of Glass Science, Technology, History, and Culture; Richet, P., Conradt, R., Takada, A., Dyon, J., Eds.; Wiley: Hoboken, NJ, USA, 2021; pp. 1147–1164. ISBN 978-1-118-79942-0. [Google Scholar] [CrossRef]
- Stormont, R. Electricity in Glass Making. Often the Low-Cost Option. In Proceedings of the 39th ASEAN Glass Conference of the ASEAN Federation of Glass Manufacturers (AFGM), Cebu, Philippines, 19–22 October 2015; Available online: http://www.aseanglass.org/wp-content/uploads/2017/08/39th-ASEAN-Glass-5.-Electricity-in-Glass-Making-...-often-the-Low-Cost-Option-Electroglass-Ltd-by-Mr.-Richard-Stormont.pdf (accessed on 27 July 2025).
- Kuhn, W.; Reynolds, A.; Molcan, P.; Malphettes, B. Electric Boosting and Hybrid Furnaces (Practical Application of Higher Levels of Electric Heat Input). In Proceedings of the 80th Conference on Glass Problems, Columbus, OH, USA, 28–31 October 2019; Ceramic Transactions Series. Wiley: Hoboken, NJ, USA, 2019; Volume 268. [Google Scholar] [CrossRef]
- Kobayashi, H. Future of Oxy-fuel Glass Melting: Oxygen Production, Energy Efficiency, Emissions and CO2 Neutral Glass Melting. In Proceedings of the 80th Conference on Glass Problems, Columbus, OH, USA, 28–31 October 2019; Sundaram, S.K., Ed.; Ceramic Transactions Series. Wiley: Hoboken, NJ, USA, 2021; pp. 1–12, ISBN 978-1-119-74490-0. [Google Scholar] [CrossRef]
- Franco, A.; Giovannini, C. Recent and Future Advances in Water Electrolysis for Green Hydrogen Generation: Critical Analysis and Perspectives. Sustainability 2023, 15, 16917. [Google Scholar] [CrossRef]
- ENTSO-E (European Network of Transmission System Operators for Electricity) Transparency Platform 2025. Available online: https://newtransparency.entsoe.eu/ (accessed on 27 July 2025).
- TERNA Sistema Elettrico-Dati Statistici 2024. Available online: https://www.terna.it/it/sistema-elettrico/statistiche/pubblicazioni-statistiche (accessed on 27 July 2025).
- Marocco, P.; Gandiglio, M.; Cianella, R.; Capra, M.; Santarelli, M. Design of Hydrogen Production Systems Powered by Solar and Wind Energy: An Insight into the Optimal Size Ratios. Energy Convers. Manag. 2024, 314, 118646. [Google Scholar] [CrossRef]
- Franco, A.; Carcasci, C.; Ademollo, A.; Calabrese, M.; Giovannini, C. Integrated Plant Design for Green Hydrogen Production and Power Generation in Photovoltaic Systems: Balancing Electrolyzer Sizing and Storage. Hydrogen 2025, 6, 7. [Google Scholar] [CrossRef]
- Hofrichter, A.; Rank, D.; Heberl, M.; Sterner, M. Determination of the Optimal Power Ratio between Electrolysis and Renewable Energy to Investigate the Effects on the Hydrogen Production Costs. Int. J. Hydrogen Energy 2023, 48, 1651–1663. [Google Scholar] [CrossRef]
- Wallnöfer-Ogris, E.; Grimmer, I.; Ranz, M.; Höglinger, M.; Kartusch, S.; Rauh, J.; Macherhammer, M.-G.; Grabner, B.; Trattner, A. A Review on Understanding and Identifying Degradation Mechanisms in PEM Water Electrolysis Cells: Insights for Stack Application, Development, and Research. Int. J. Hydrogen Energy 2024, 65, 381–397. [Google Scholar] [CrossRef]
- Marocco, P.; Gandiglio, M.; Audisio, D.; Santarelli, M. Assessment of the Role of Hydrogen to Produce High-Temperature Heat in the Steel Industry. J. Clean. Prod. 2023, 388, 135969. [Google Scholar] [CrossRef]
- Ghilardi, A.; Frate, G.F.; Kyprianidis, K.; Tucci, M.; Ferrari, L. Brayton Pumped Thermal Energy Storage: Optimal Dispatchment in Multi-Energy Districts. Energy Convers. Manag. 2024, 314, 118650. [Google Scholar] [CrossRef]
- European Commission, Eurostat. Electricity Prices for Non-Household Consumers—Bi-Annual Data; Publication Office of the European Union: Luxembourg, 2025. [Google Scholar] [CrossRef]
- European Commission, Eurostat. Gas Prices for Non-Household Consumers—Bi-Annual Data; Publication Office of the European Union: Luxembourg, 2025. [Google Scholar] [CrossRef]
- European Container Glass Federation. One Destination, Multiple Pathways: How the European Container Glass Industry Is Decarbonising Glassmaking; European Container Glass Federation: Brussels, Belgium, 2024; Available online: https://feve.org/wp-content/uploads/2024/10/FEVE-Decarbonisation-Report-2024-1.pdf (accessed on 27 July 2025).
| Disclaimer/Publisher’s Note: The statements, opinions and data contained in all publications are solely those of the individual author(s) and contributor(s) and not of MDPI and/or the editor(s). MDPI and/or the editor(s) disclaim responsibility for any injury to people or property resulting from any ideas, methods, instructions or products referred to in the content. |
© 2025 by the authors. Licensee MDPI, Basel, Switzerland. This article is an open access article distributed under the terms and conditions of the Creative Commons Attribution (CC BY) license (https://creativecommons.org/licenses/by/4.0/).


