Abstract
This study analyzes the impact of powder-blasted surface modification on the performance of non-imaging solar concentrators and evaluates a ray-tracing simulation approach to virtual solar power measurements. Powder blasting was applied to poly(methyl methacrylate) (PMMA) sheets to create a rough, Lambertian-like scattering surface, enhancing light trapping and total internal reflection. The effects of this modification were systematically assessed using optical transmission spectroscopy, angular scattering measurements, and solar cell efficiency characterization under standard AM1.5 illumination. The results show that surface roughening significantly improves light redirection toward the concentrator’s edge, enhancing solar cell performance. OptisWorks ray-tracing simulations were employed to model the concentrator’s optical behavior, demonstrating strong agreement (within 5–10% deviation) with experimental data. These findings confirm that surface modification is crucial in optimizing concentrator efficiency and establishing ray tracing as a reliable tool for virtual performance evaluation in photovoltaic applications.
1. Introduction
1.1. Background and Motivation
The global transition toward decarbonization and energy resilience has accelerated the widespread deployment of renewable energy technologies, with solar photovoltaics (PV) playing a central role. In recent years, PV has become increasingly cost-competitive. According to the International Renewable Energy Agency (IRENA), the levelized cost of electricity (LCOE) from utility-scale solar PV declined by more than 90% between 2010 and 2023 [1]. At the same time, advancements in photovoltaic materials and device architecture have pushed performance boundaries, particularly with the emergence of multi-junction, perovskite, and tandem solar cells [2,3,4]. Recent solar efficiency tables indicate that multi-junction concentrator cells can exceed 47% efficiency under concentrated illumination, well beyond that of conventional flat-plate silicon modules [5]. These developments underscore the growing potential of high-efficiency systems in delivering more energy per unit area, a particularly relevant metric as PV expands the range of integration scenarios.
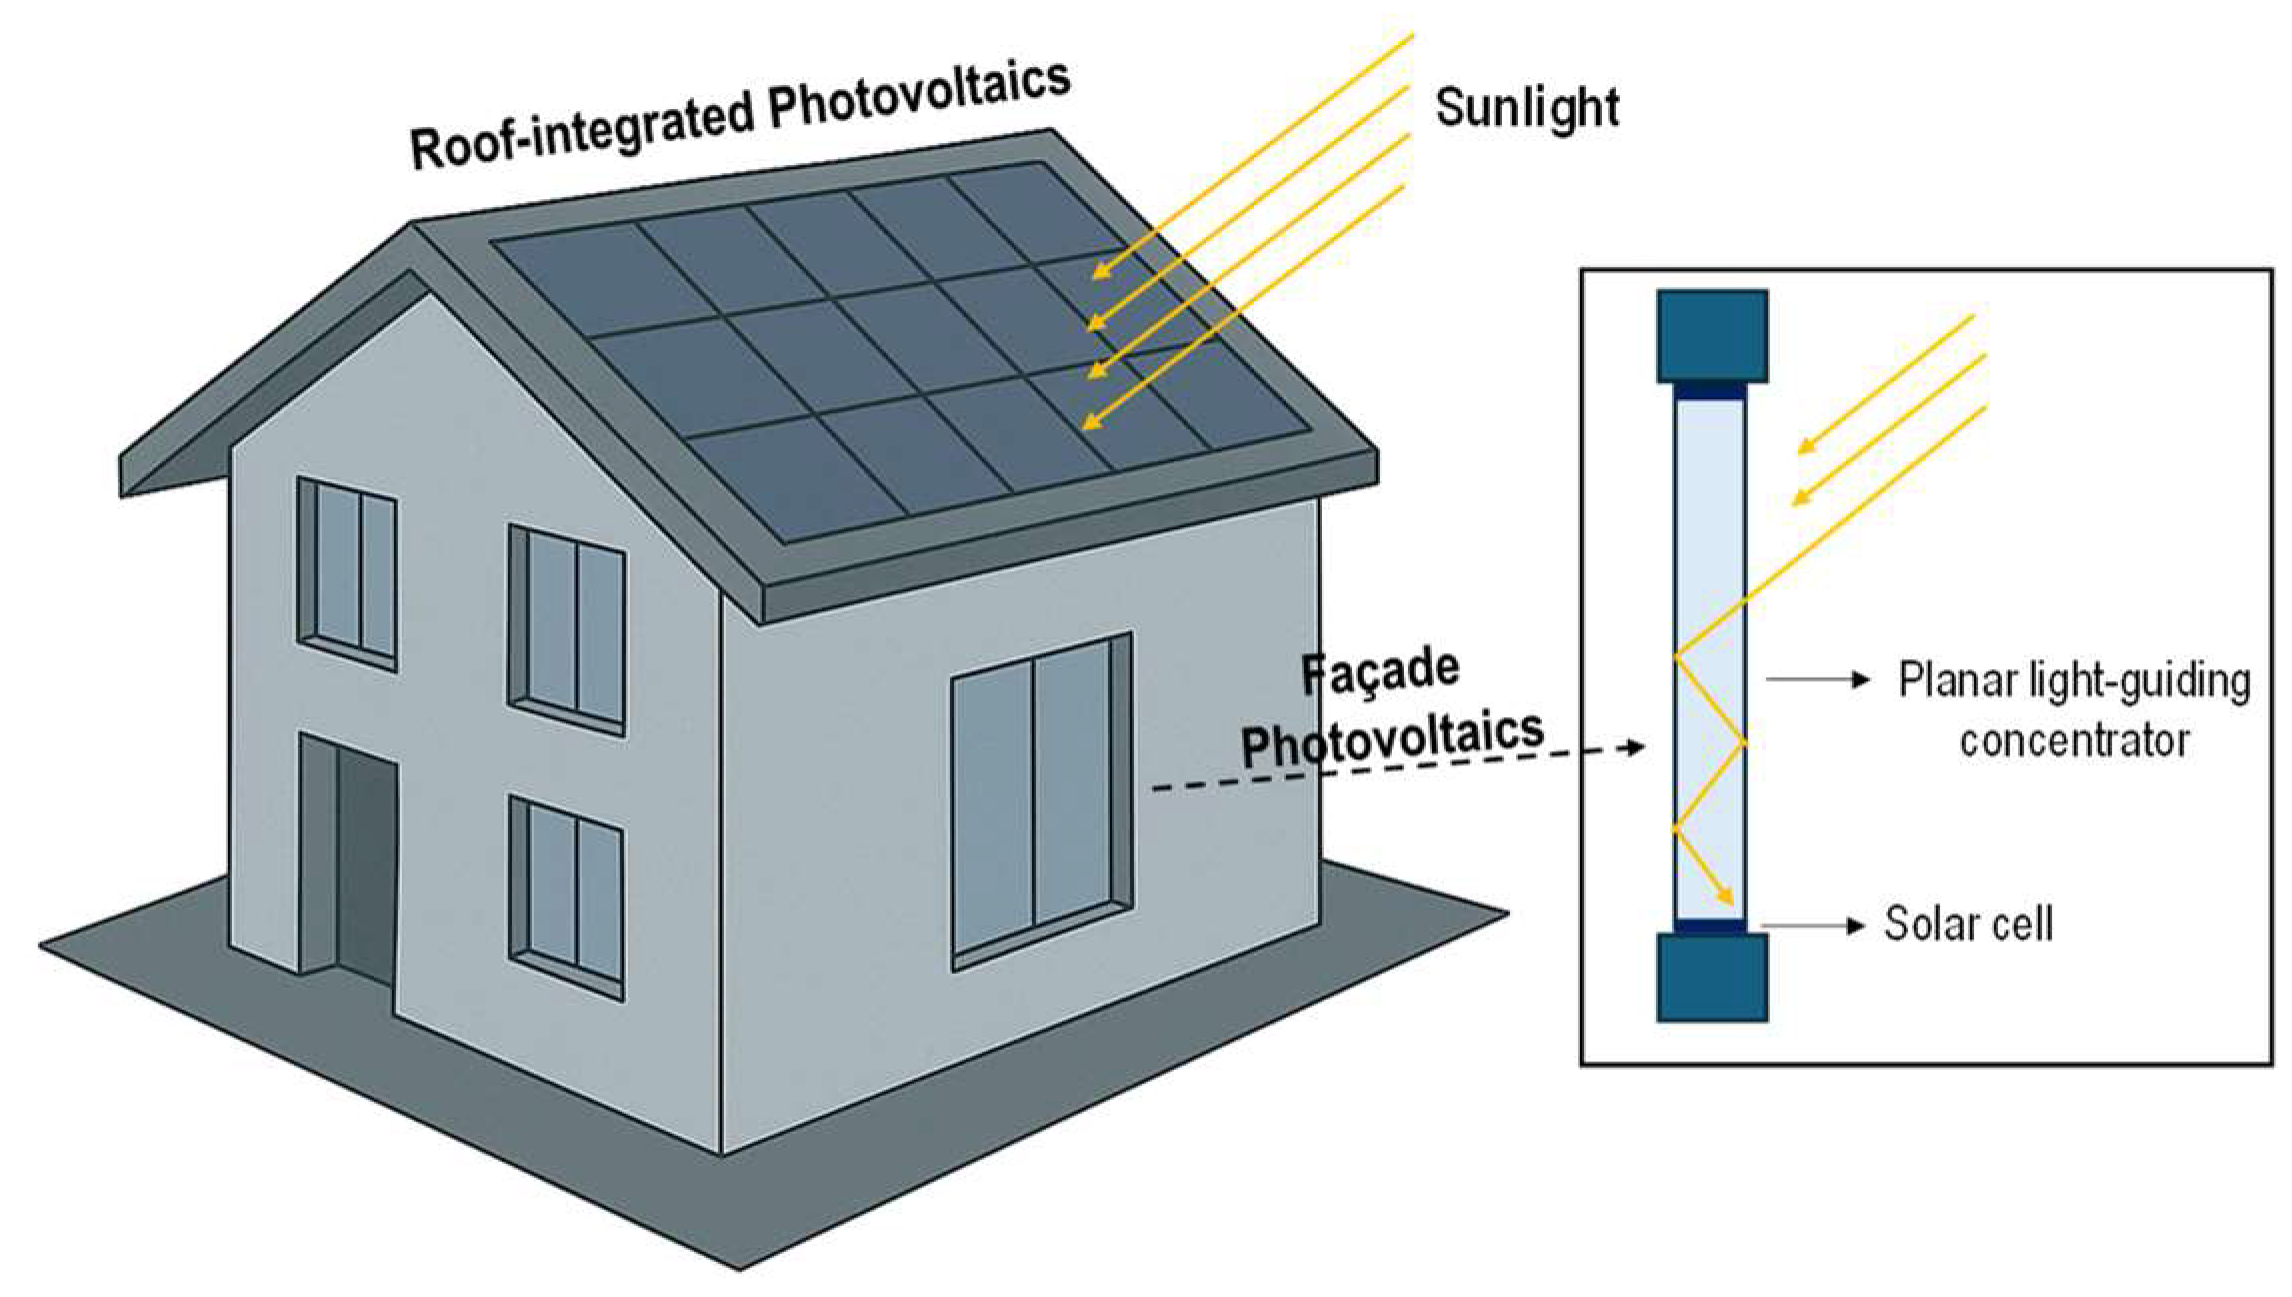
One of the most promising applications for such expansion is building-integrated photovoltaics (BIPV), where PV modules are embedded directly into architectural elements such as façades, roofs, and windows [6,7]. A schematic overview of a BIPV system integrating planar concentrators is shown in Figure 1. BIPV systems provide architectural and spatial benefits, enabling clean energy generation without occupying additional land. However, BIPV modules often operate at suboptimal orientations and tilts due to building constraints, resulting in lower solar capture. For example, vertical south-facing façades typically receive only 50–70% of the irradiance captured by optimally tilted modules [8].

Figure 1.
A schematic representation of a building-integrated photovoltaic (BIPV) system featuring roof-mounted PV panels and window-integrated planar light-guiding concentrators.
Additionally, BIPV systems cannot typically accommodate bulky tracking mechanisms or large reflective structures used in traditional concentrator designs due to space, cost, and esthetic limitations [9]. This limitation has spurred interest in passive optical strategies that can enhance energy capture without altering the module form factor or compromising visual integration.
One such approach is using non-imaging solar concentrators, which accept light over a wide angular range and redirect it toward edge-mounted PV cells. This allows them to operate effectively under direct and diffuse sunlight without solar tracking, making them highly compatible with static BIPV applications [10]. This principle was first established by Winston [11], who introduced compound parabolic concentrators (CPCs), demonstrating the theoretical limit of geometric concentration in non-imaging systems. A recent review by Madala and Boehm [10] further emphasized the advantages of such devices in stationary solar applications, particularly in architectural contexts.
In practical BIPV applications, planar non-imaging concentrators based on transparent waveguides have shown particular promise. These devices use materials such as polymethylmethacrylate (PMMA) to trap light via total internal reflection (TIR) and guide it to the panel’s edges, where solar cells are placed. However, maximizing the amount of light coupled to the waveguide remains a challenge. This motivates the development of surface modification techniques to enhance angular scattering at the surface input.
According to Yablonovitch and Cody [12], a surface with Lambertian (diffuse) scattering properties can increase the effective optical path length by a factor of up to 4n2, where n is the refractive index of the material. Achieving such scattering in practice involves creating a controlled rough surface that approximates a Lambertian profile. Techniques such as laser ablation [13], micro-etching [14], and nano-imprinting [15] have been explored but often involve complex, costly, or slow fabrication steps.
A promising alternative is powder blasting, a mask-free, scalable surface texturing method that uses high-speed abrasive particles to roughen the surface of PMMA or similar substrates. Although widely used in microfluidics and optics, powder blasting has been underutilized in solar applications, particularly for concentrator surfaces. As shown by Hodgson et al. [13], similar surface treatments can drastically increase angular scattering (haze) and internal light trapping. Moreover, scattering surfaces also help reduce glare, a valuable benefit for BIPV esthetics and building safety [16].
This study explores the use of powder-blasted PMMA as a light-guiding and concentrating medium for BIPV. The goal is to create a passive, low-profile concentrator that improves solar capture in static installations without compromising architectural design. Combining surface-engineered waveguides with ray-tracing simulations and experimental validation, we aim to establish a scalable pathway for high-efficiency, building-friendly solar concentrators.
1.2. Literature Review
The concept of non-imaging solar concentrators has evolved significantly since the foundational work of Winston [11], who introduced the concept of compound parabolic concentrators (CPCs), which served as a bedrock for subsequent designs incorporating reflective and refractive techniques [17]. Later research extended these principles to luminescent (LSC) [18] and planar photonic concentrators (PPCs) [19], exploring both dye-based and nano-structured materials to redirect light internally without the need for precise external focusing.
Recent studies have demonstrated promising outcomes using low-profile concentrator geometries. CPCs use reflective geometries to direct sunlight toward a focal region with wide angular acceptance and are already used in some stationary PV systems. For example, Hadavinia and Singh [20] modeled and tested truncated CPCs in BIPV settings and found a 60% increase in energy output with a 2× concentrator under static conditions. These results validate the potential of non-imaging concentrators for boosting performance in architectural applications. LSCs incorporate luminophores into transparent plates, which absorb and re-emit light that is then waveguided to the edges by TIR [9]. However, reabsorption losses [21,22,23] and long-term dye degradation limit their stability [24,25,26]. PPCs avoid these drawbacks by using nano- or micro-structured surfaces to scatter incoming light into the waveguide. For example, Kocher-Oberlehner et al. [19] demonstrated the use of a PPC made by depositing colloidal silica photonic crystals onto PMMA, achieving a threefold increase in edge-coupled light collection. These studies underscore the value of surface engineering in enhancing the performance of planar concentrators.
Various light-trapping strategies have also been explored in the context of PV. These include micro/nano-textured surfaces [27], embedded scattering particles (e.g., TiO2 or SiO2 nanoparticles [28]), and refractive index engineering (e.g., AR coatings or gradient-index layers) [29]. Biomimetic textures [30], microlens arrays [31], and surface haze films [32] have all shown promise in increasing angular scattering while maintaining transparency. However, many of these approaches require cleanroom fabrication, photolithography, or precision molding, which may limit scalability [33,34].
One promising but underexplored method is powder blasting, a form of abrasive surface texturing that can produce diffusive roughness over large areas quickly and without masks. This method has been extensively used in glass micromachining and microfluidics because it is fast and inexpensive for creating features or roughness over large areas [35]. While commonly used in microfluidics and optical calibration plates, its application to solar concentrators remains limited. This presents an opportunity to assess powder-blasted PMMA as a simple, mask-free, and scalable light management layer for non-imaging concentrators.
A major theme in the evolution of solar concentrator technology is the quest to reduce scattering losses and enhance optical confinement. The powder blasting of polymeric substrates, especially PMMA, has emerged as a viable technique for achieving this. By controlling parameters such as particle size, blasting pressure, and scanning speed, researchers can tailor a rough surface profile that scatters incoming light in a near-Lambertian manner [36]. This randomized scattering can significantly increase the path length of photons within the material, raising the probability of total internal reflection and thus channeling more light to the solar cell edge [29].
At the same time, optical simulation tools have become essential in concentrator development. Platforms like OptisWorks, which integrate ray-tracing with CAD modeling, enable the accurate prediction of how light behaves inside complex optical systems [37,38]. These simulations can expedite design iterations and provide deep insights into the critical parameters governing concentrator performance. Notably, previous studies have shown that ray-trace models can accurately predict the performance of LSCs [39] and CPCs [40] when properly calibrated.
1.3. Contributions
Despite progress in optical concentrator designs and light-trapping techniques, there remains a need for cost-effective, scalable, and passive solutions that are compatible with BIPV applications. High-performance concentrators like LSCs and PPCs demonstrate what is optically possible, but they often rely on complex materials, unstable dyes, or fabrication techniques unsuitable for large-area deployment.
This study addresses this gap by presenting a comprehensive experimental and simulation-based evaluation of non-imaging concentrators fabricated from powder-blasted polymethylmethacrylate (PMMA) with a sοlar cell attached to the edge (see Figure 2). The key innovation lies in using powder blasting as a one-step, mask-free, and scalable surface modification technique to introduce random roughness that mimics Lambertian scattering. This roughened surface increases the probability that incoming light will enter angular modes within the TIR acceptance cone, thus enhancing photon confinement and improving the optical path length within the waveguide. Since abrasive blasting is industrially scalable and requires minimal equipment, it holds promise for real-world BIPV integration, especially in static, vertically mounted applications where passive light enhancement is critical.

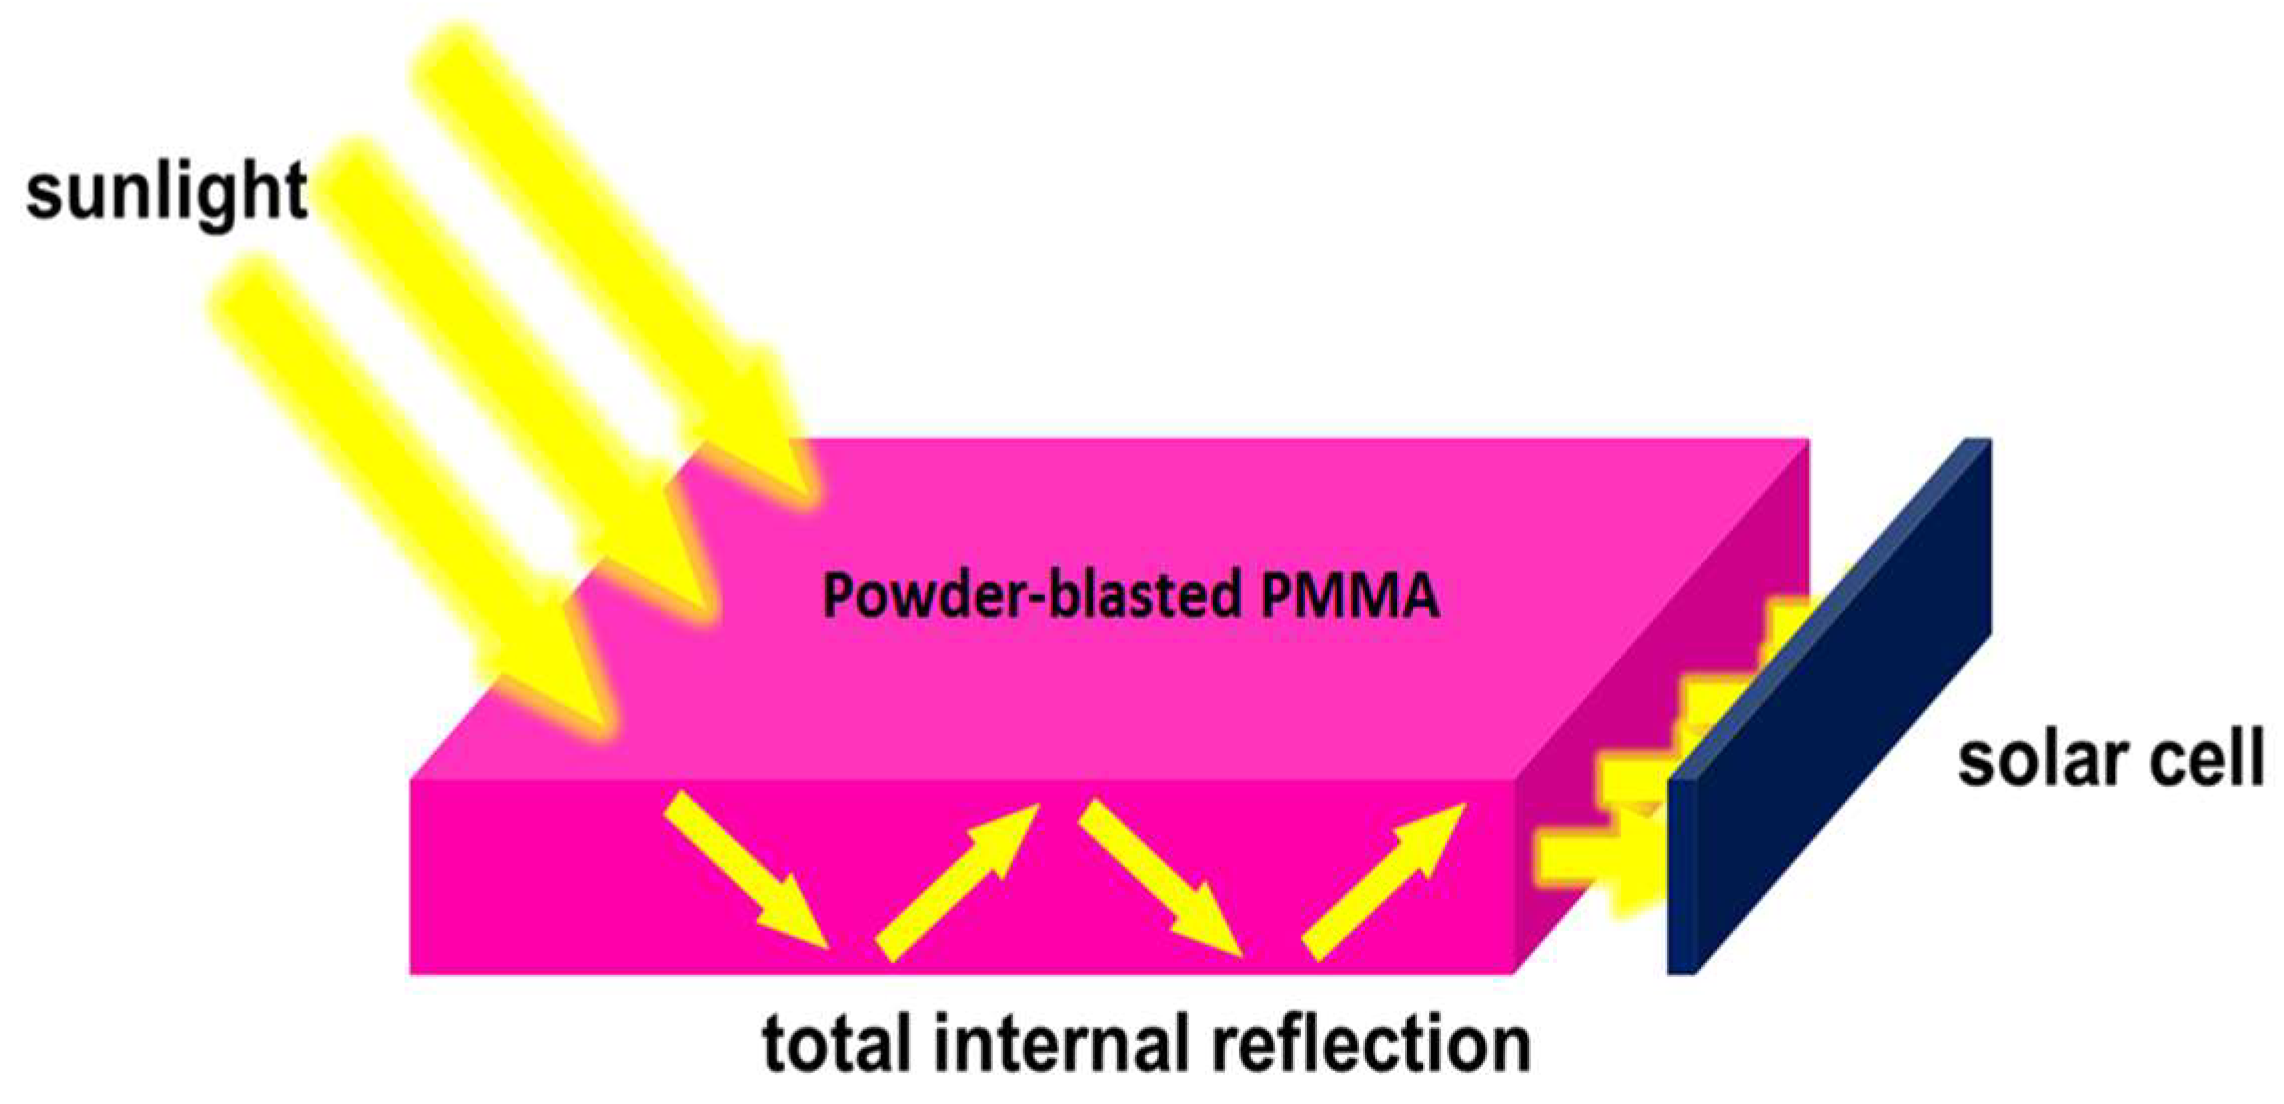
Figure 2.
The light-guiding mechanism in powder-blasted PMMA concentrators. A portion of the incident sunlight is scattered by the roughened surface and enters the waveguide at angles that satisfy the conditions for total internal reflection (TIR), enabling efficient light transport toward the concentrator’s edge, where the solar cell is located.
This study combines optical spectroscopy, solar cell I–V characterization under calibrated AM1.5 illumination, and ray-tracing simulations using OptisWorks, a CAD-integrated software for optical modeling. Simulations are used to predict irradiance distributions, assess scattering effects, and evaluate how surface roughness and concentrator dimensions influence performance. By comparing experimental measurements with simulation results, this research aims to validate the accuracy of virtual modeling tools in predicting the optical behavior of these systems and to identify the optimal design parameters for maximizing efficiency in BIPV applications. The study objectives are as follows:
- -
- To investigate how powder-blasted surface modifications on PMMA influence light scattering and total internal reflection.
- -
- To characterize the optical (transmission and angular scattering) and electrical (photovoltaic output) performance of the concentrators using laboratory measurements.
- -
- To compare the experimental results with ray-tracing simulations conducted in OptisWorks, assessing the software’s ability to model non-imaging concentrators accurately.
- -
- To determine the optimal concentrator size for maximizing efficiency while minimizing optical losses.
2. Materials and Methods
2.1. Sample Preparation
To generate a diffusely scattering surface, powder blasting was applied to commercially available, optically clear poly(methyl methacrylate) (PMMA) sheets. Compared to glass or silicon, PMMA is less brittle, making it more challenging to process via powder blasting due to its lower fracture susceptibility and narrower error margins. PMMA sheets with a uniform thickness of 4 mm were cut into three distinct sample sizes: 100 × 100 mm2 (large), 25 × 75 mm2 (medium), and 25 × 50 mm2 (small). All sample edges were subsequently polished to eliminate edge roughness and ensure consistency across specimens.
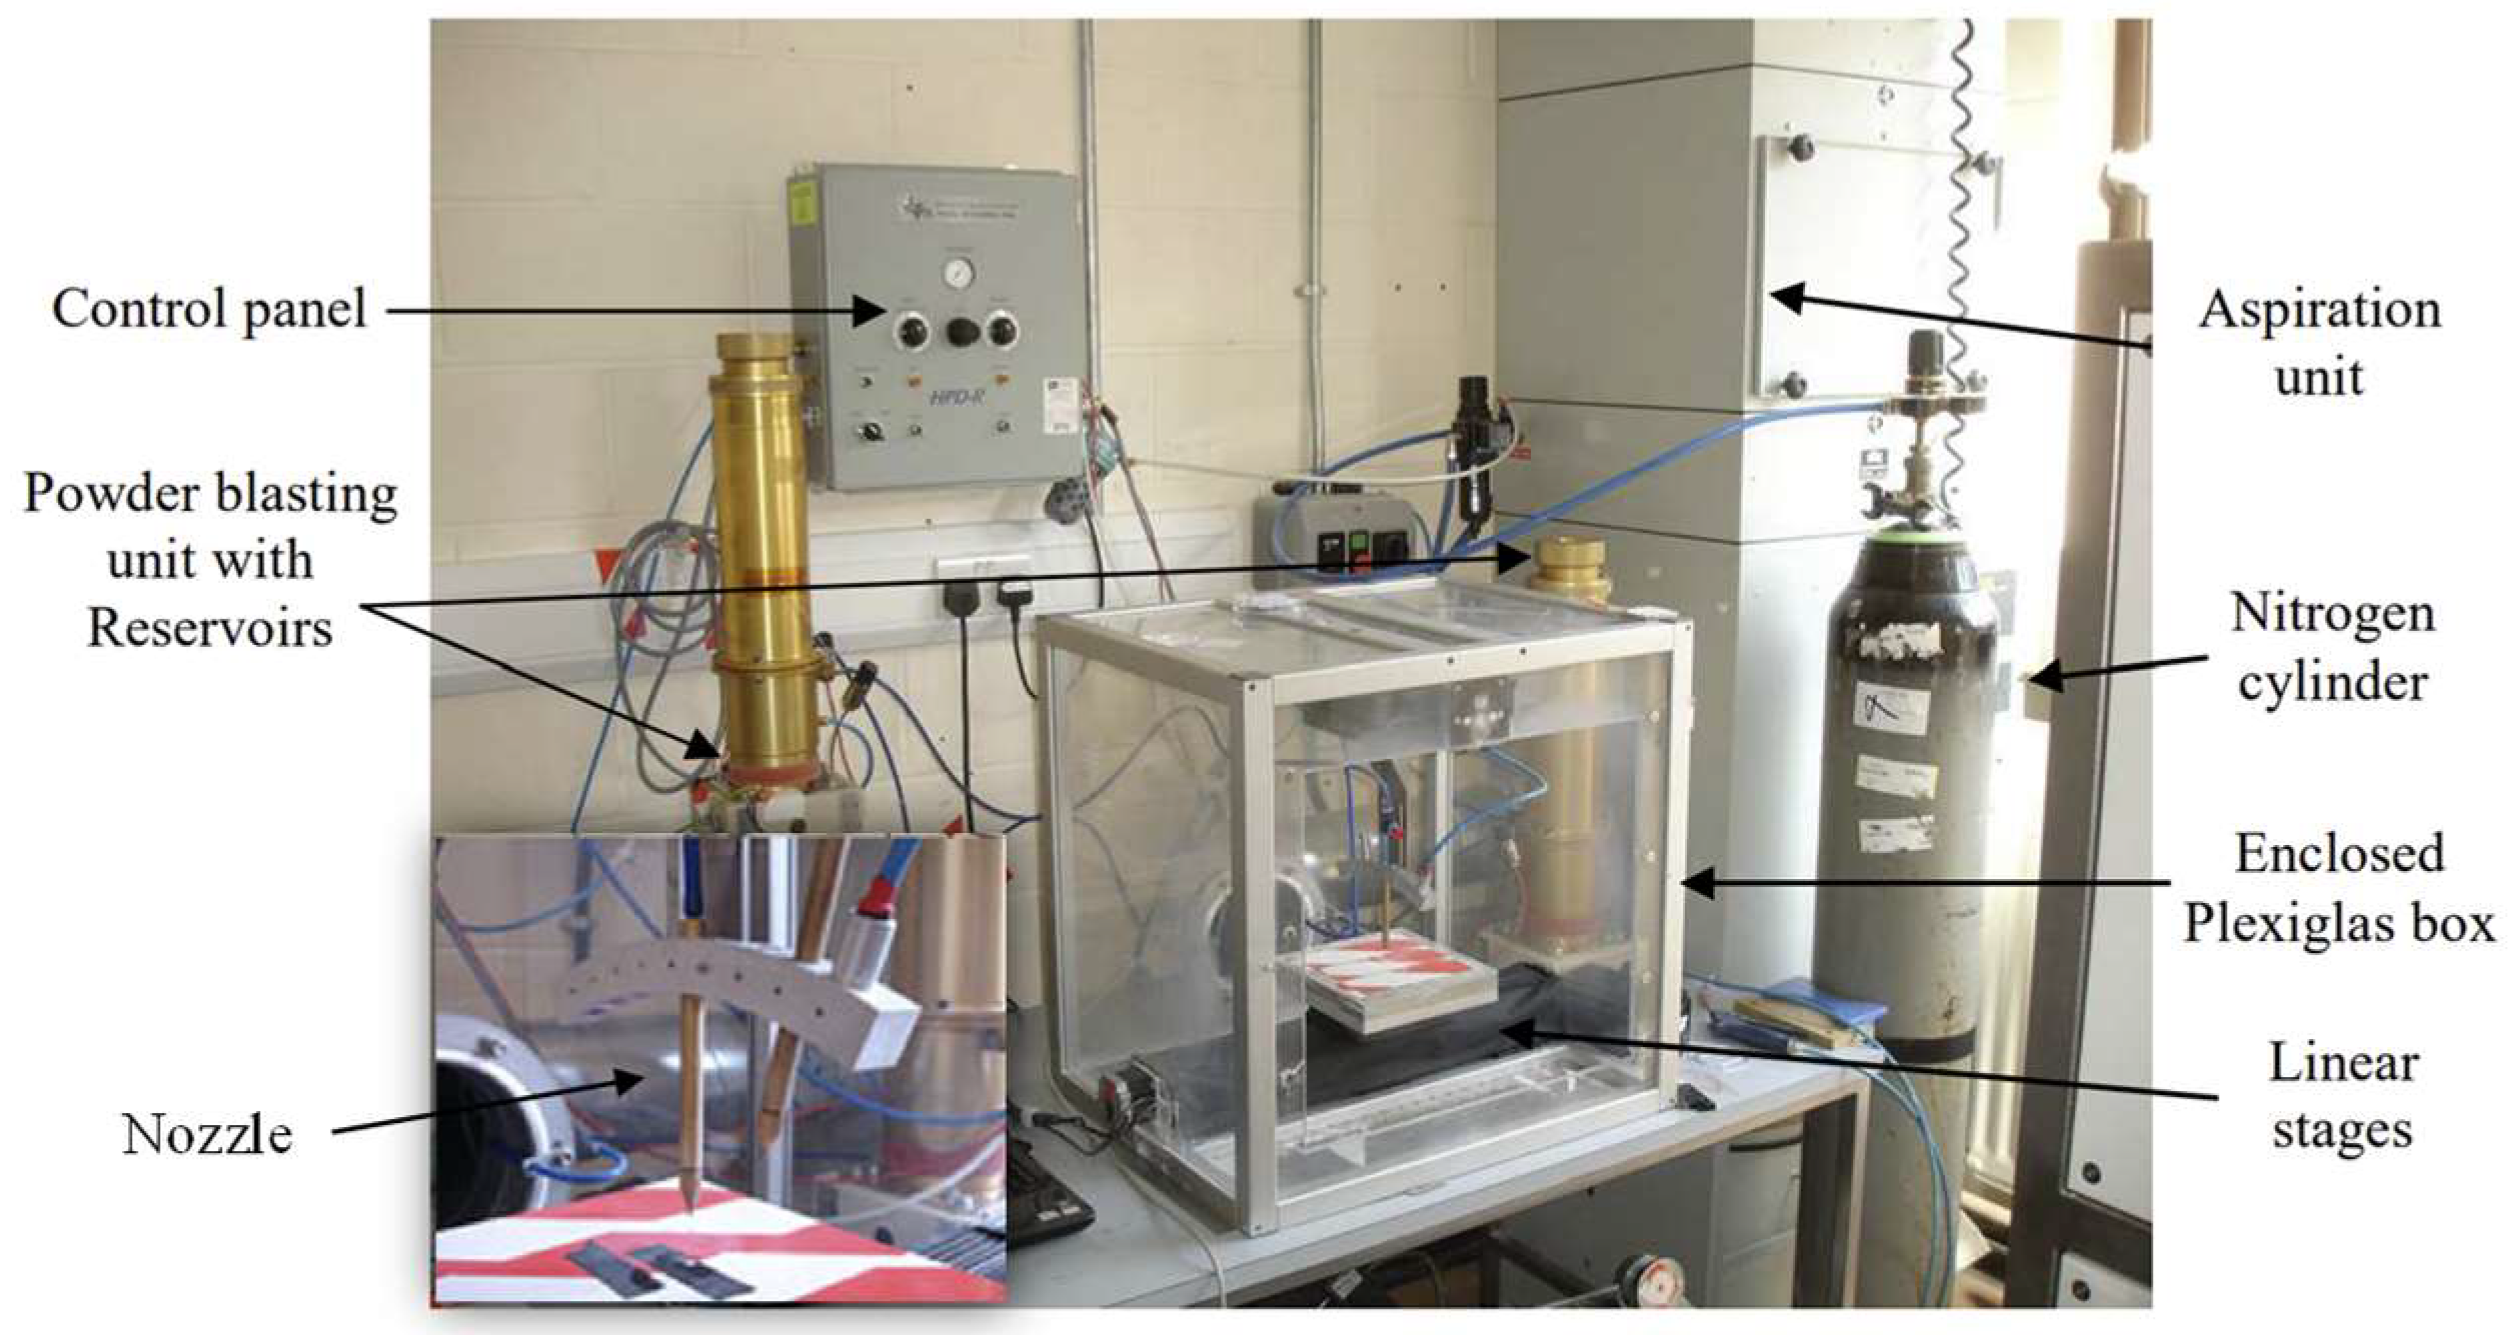
A modified Texas Airsonics powder-blasting system was used to modify the surface. The system consists of two 3 L reservoirs, a control panel for regulating blasting parameters, a sealed Plexiglas enclosure, an aspiration (dust extraction) unit, and dual-axis linear motion stages (see Figure 3). The control panel allows for the adjustment of the blasting pressure and alumina flow rate, with flow rates up to 0.2 g/s and pressures ranging from 85 psi to 195 psi. The system can operate using either compressed air or nitrogen gas; however, nitrogen is preferred for fine alumina particles (e.g., 9 μm) due to its low moisture content. The alumina particle size range spans from 5 to 350 μm.
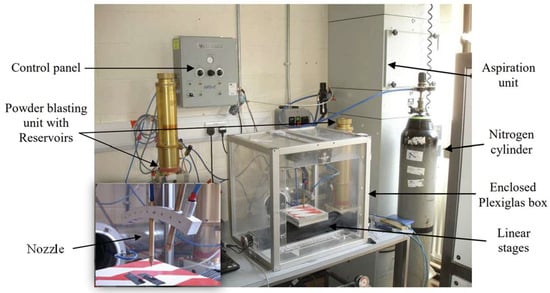
Figure 3.
Powder-blasting system used for surface modification of PMMA sheets. Main chamber includes dual linear stages, control panel, and enclosed work area. Inset (bottom left) provides close-up view of nozzle and stage arrangement used to deliver abrasive particles to PMMA surface [adapted from [41]].
Gravity moves the powder from the reservoir to the chamber. Afterward, a vibrating mechanism transports alumina to the nozzle [42]. The vibration causes the particles to rotate along a spiral ramp with a 5° incline before reaching the top of the chamber. The exit tube guides the particles to the nozzle. From there, the particles are directed through an 800 μm diameter cylindrical nozzle. Altering the vibration intensity influences the number of particles and the nozzle’s flow rate.
Inside the enclosure, a dust extractor collects airborne particles and debris produced during blasting. Two computer-controlled linear stages allow for precise sample scanning: one stage controls nozzle motion (top axis), and the other controls substrate positioning (bottom axis). The scanning routine operates sequentially, first along the x-axis and then along the y-axis. This causes a brief (~0.2 s) pause when switching axes, potentially leading to slight overexposure and non-uniform surface treatment. To address this, axis-switching was configured to occur beyond the boundaries of the sample area, ensuring uniformity across the active surface [43].
All PMMA samples were processed using identical blasting parameters to maintain experimental consistency. For each of the three geometries studied (100 × 100 mm2, 25 × 75 mm2, and 25 × 50 mm2), a single powder-blasted PMMA sample was fabricated and characterized. Prior to this, several processing trials were conducted to optimize blasting conditions. Although performance data reflect single samples, all measurements were repeated multiple times to ensure internal consistency.
Alumina powder with an average particle diameter of 30 μm was selected to produce a well-defined scattering texture. Since the entire surface was targeted for modification, no masking was required. The pressure was set at 50 psi with a flow rate of approximately 0.1 g/s, and the scanning speed was fixed at 5 mm/s. One of the most critical process parameters is the standoff distance (the distance between the nozzle tip and the substrate), which directly influences the impact energy and the resulting surface roughness. A standoff distance of 60 mm combined with a 5 mm overlap between adjacent scanning passes produced the most homogeneous and reproducible results (see Figure 4). After blasting, any remaining particles were removed using an air dust blow gun directed inside the enclosed Plexiglas chamber, ensuring clean surfaces prior to optical measurements and solar cell mounting. This cleaning step minimized residual alumina that might interfere with transmission or surface scattering characterization.
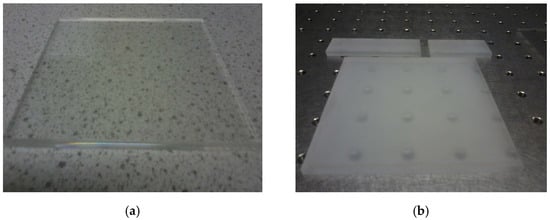
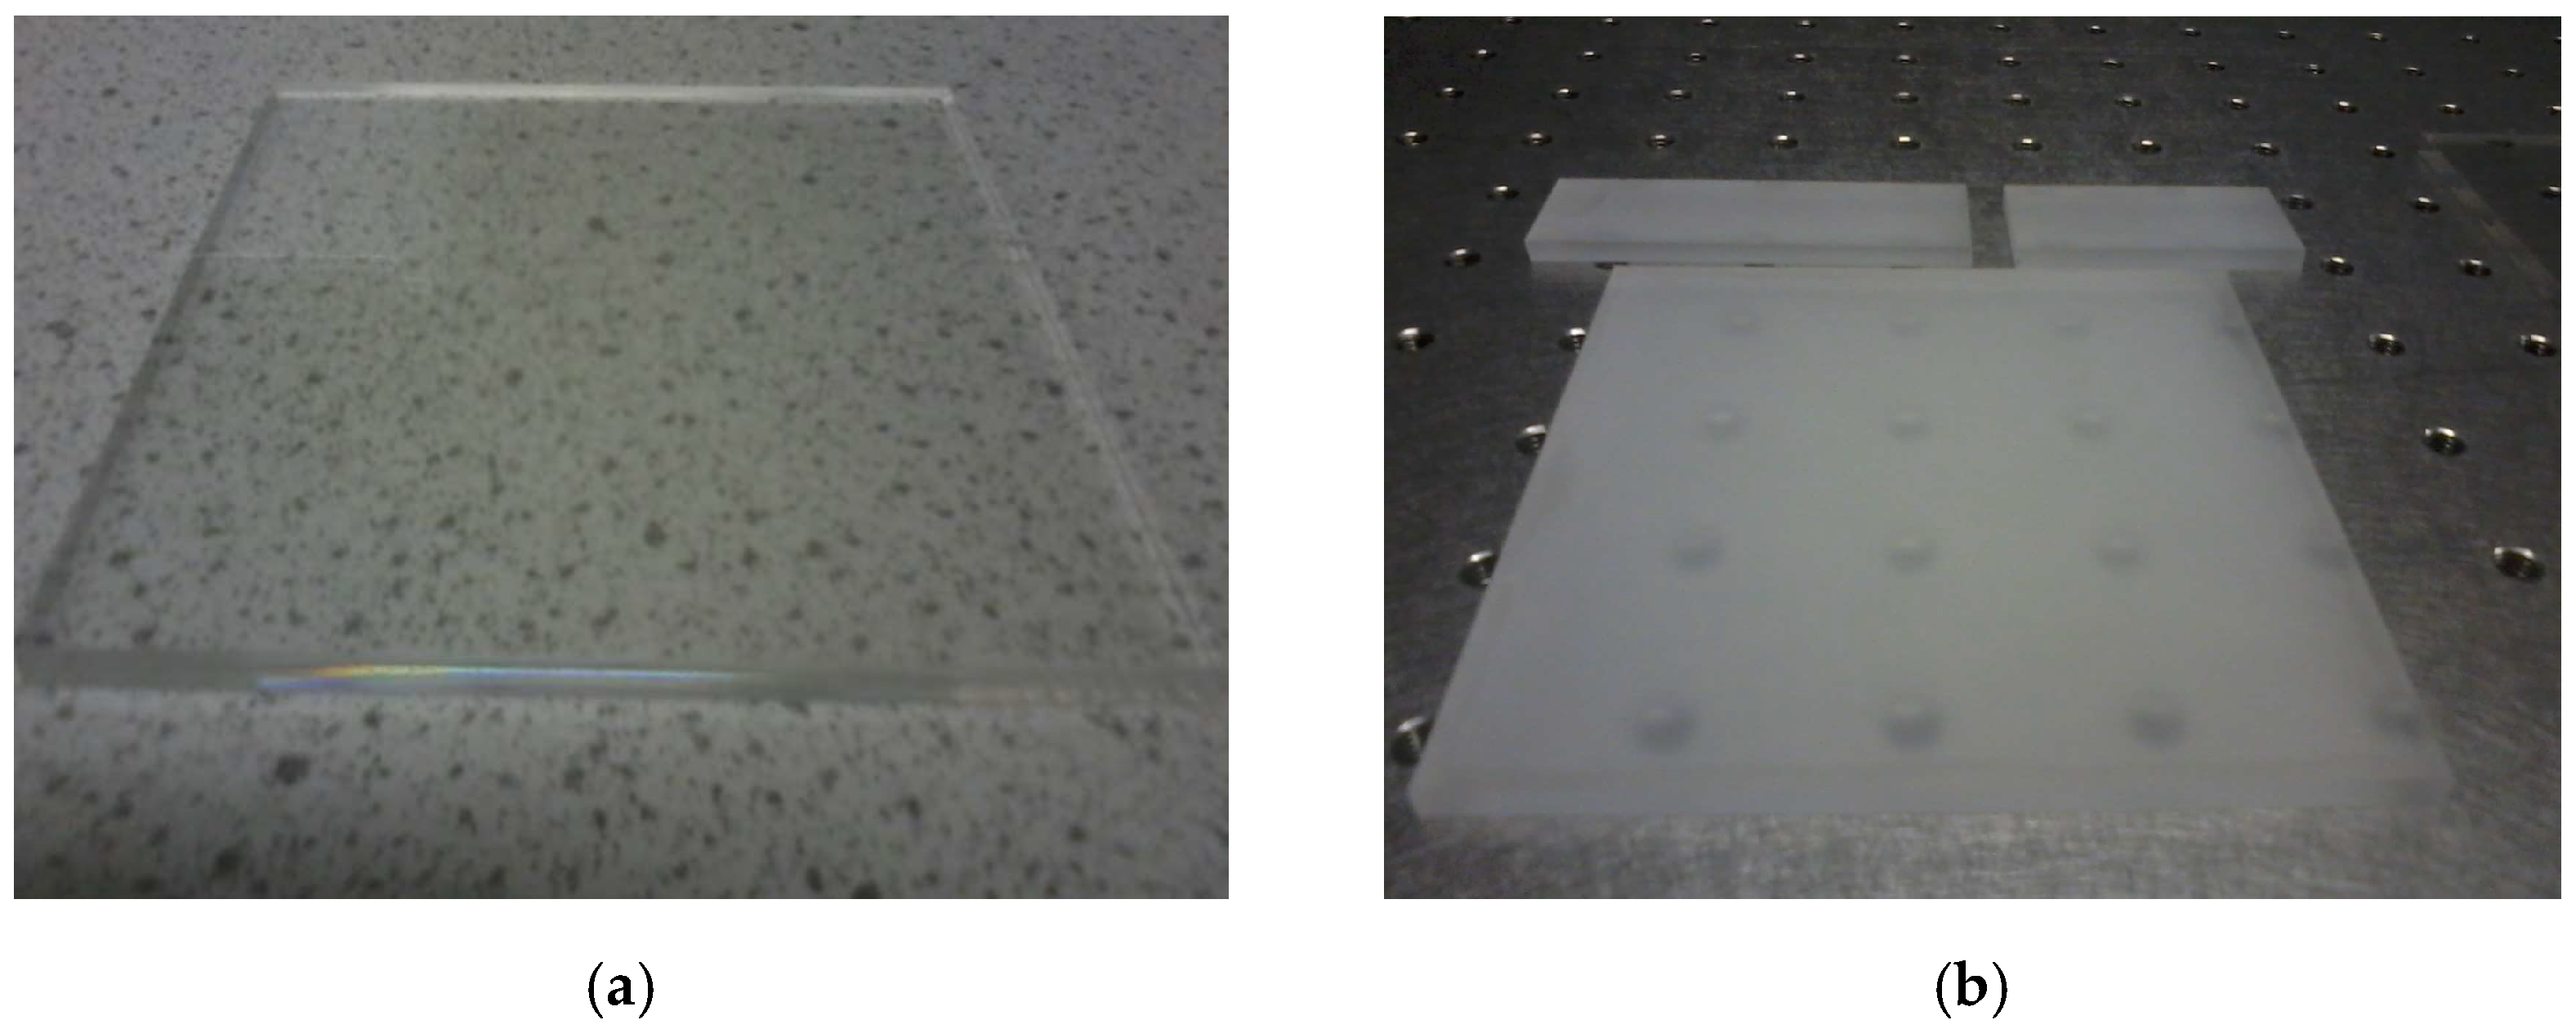
Figure 4.
A visual comparison of PMMA surfaces: (a) unmodified (clear) PMMA and (b) powder-blasted PMMA. The reduced transparency in (b) highlights the surface roughening effect introduced by the powder-blasting process.
2.2. Transmission Measurements
Following surface modification, optical transmission measurements were conducted to assess the impact of powder-blasted roughness on light transmission through the PMMA samples. Before measurement, all samples were visually and optically inspected to confirm uniform surface treatment and evaluate differences relative to unmodified (clear) PMMA (see Figure 4).
Spectral transmission was measured using a PerkinElmer Lambda 950 UV/VIS/NIR spectrophotometer (PerkinElmer, Waltham, MA, USA) over the wavelength range of 300–1500 nm. This instrument employs a gridless R6872 photomultiplier tube (PMT) detector (Hamamatsu Photonics K.K., Hamamatsu City, 430-8587, Japan), with sensitivity extending down to 160 nm; however, its efficiency declines significantly above 800 nm. Consequently, a lead sulfide (PbS) detector (Hamamatsu Photonics, Hamamatsu City, Japan) was utilized for measurements beyond the detector switching threshold, set at 860 nm. Two light sources were used to cover the full spectral range: a deuterium lamp for ultraviolet wavelengths (300–319 nm) and a tungsten-halogen lamp for the visible to near-infrared region (319–1500 nm).
Transmission was measured using two distinct configurations:
- Direct (collimated) geometry: The sample was placed perpendicular to the incident beam and aligned along the same optical axis as the detector, allowing for the measurement of specular (zero-angle) transmission.
- Integrating sphere geometry: To account for scattered light at non-zero angles, the sample was positioned in front of an integrating sphere, capturing the total transmitted light over all angles within the acceptance range of the sphere.
It is important to note that no residual alumina particles were present on the PMMA surfaces post-processing. Therefore, any observed absorption or scattering effects are attributed solely to the modifications of the PMMA matrix rather than to the presence of surface contaminants.
2.3. Scattering Measurements
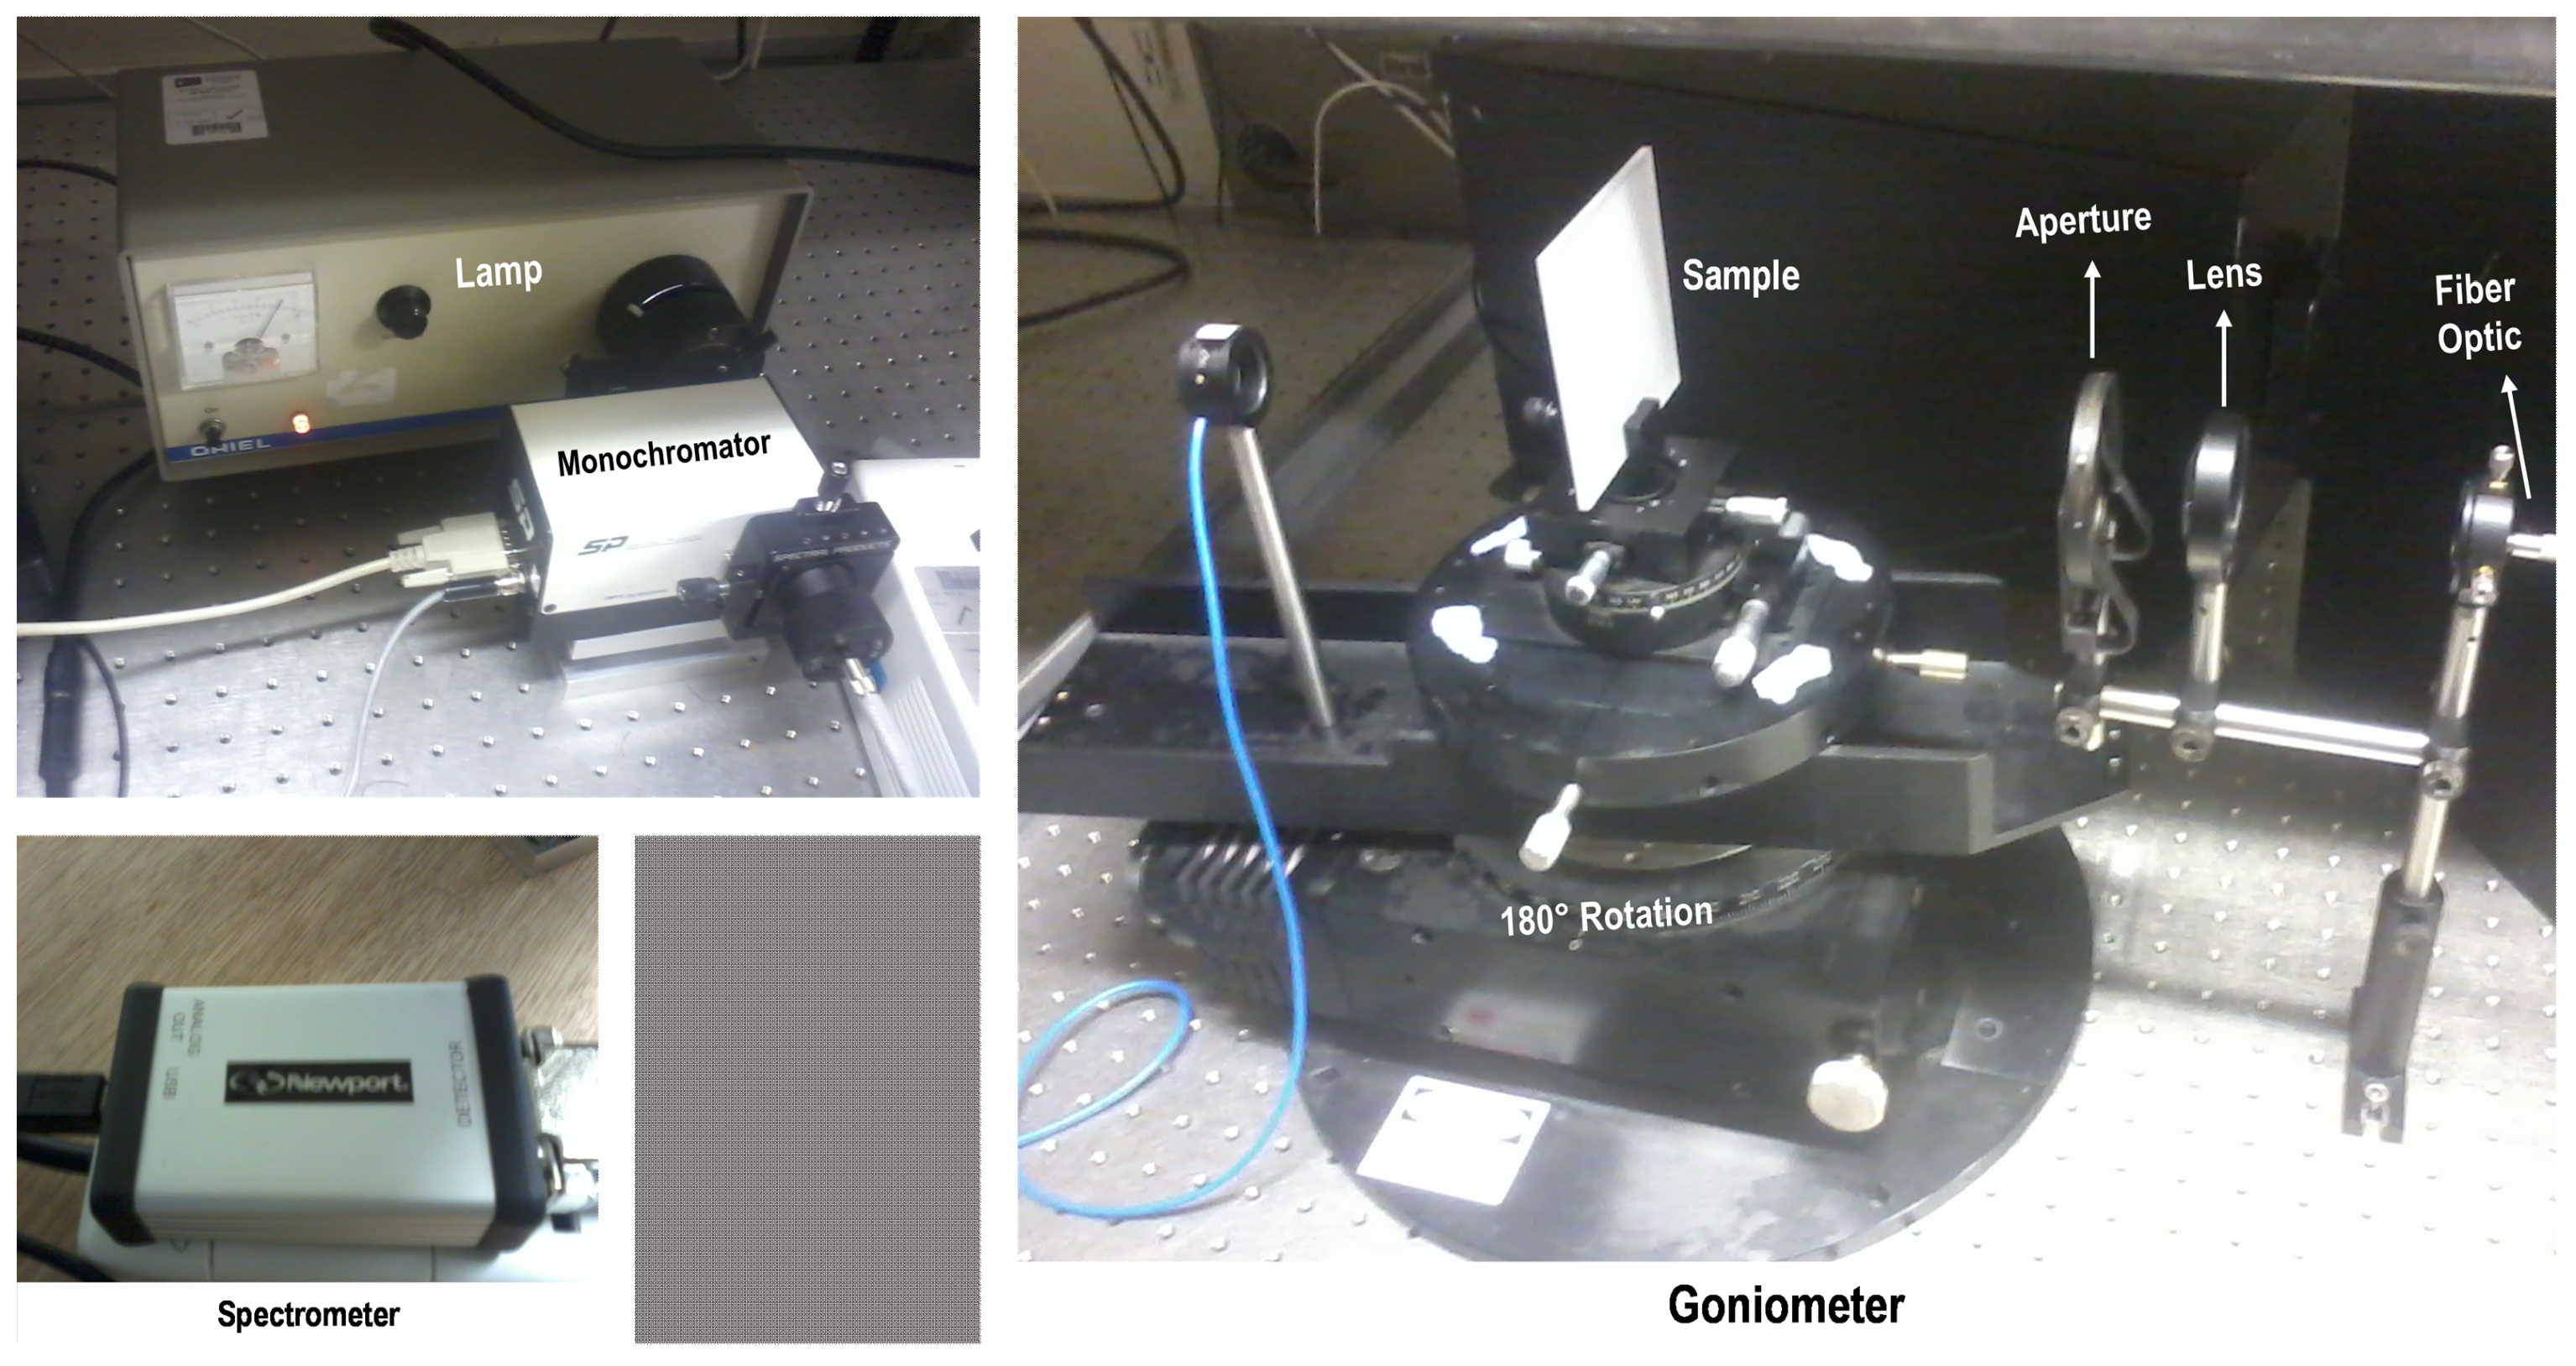
The angular scattering characteristics of the powder-blasted PMMA samples were evaluated using the experimental set-up illustrated in Figure 5. The system consists of an Oriel 77501 radiometric fiber optic illuminator (Newport Corporation, Irvine, CA, USA), a CM110 1/8 m monochromator, an optical fiber, a collimating lens, an aperture, a circular goniometer stage, and a photodetector.
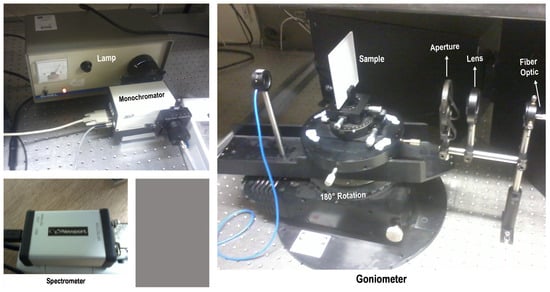
Figure 5.
The experimental set-up for angular scattering measurements. The PMMA sample is positioned at the center of a circular goniometer, while a rotating detector measures the transmitted intensity at various angles along the arc.
Illumination was provided by a tungsten-halogen lamp, spectrally filtered by the monochromator. The output beam was delivered through an optical fiber, passed through a collimating lens and aperture, and directed perpendicularly onto the front surface of the sample. The sample was mounted at the center of the goniometer table. At the same time, a photodetector was positioned along the arc of the table to measure the intensity of transmitted light scattered at various angles. The system was controlled using a custom LabVIEW interface.
Scattering measurements were recorded over an angular range of 0° to 90°, in 5° increments, at wavelengths from 380 to 1100 nm. Total darkness was maintained throughout the measurements to minimize background noise. Due to the low signal intensities (on the order of nanowatts), no optical filter was used to maximize the detector’s sensitivity.
The distance between the sample and the detector was fixed at 14 cm, while the distance between the optical fiber and the aperture was set at 10 cm. Prior to data acquisition, a reference measurement was taken at 0° without the sample in place to normalize the recorded intensities. Since the samples were prepared to produce homogeneous scattering, it is expected that the angular scattering profile would be symmetric across the 0° axis, with the intensity profile from 0° to –90° mirroring that from 0° to +90°.
2.4. Solar Cell Characterization
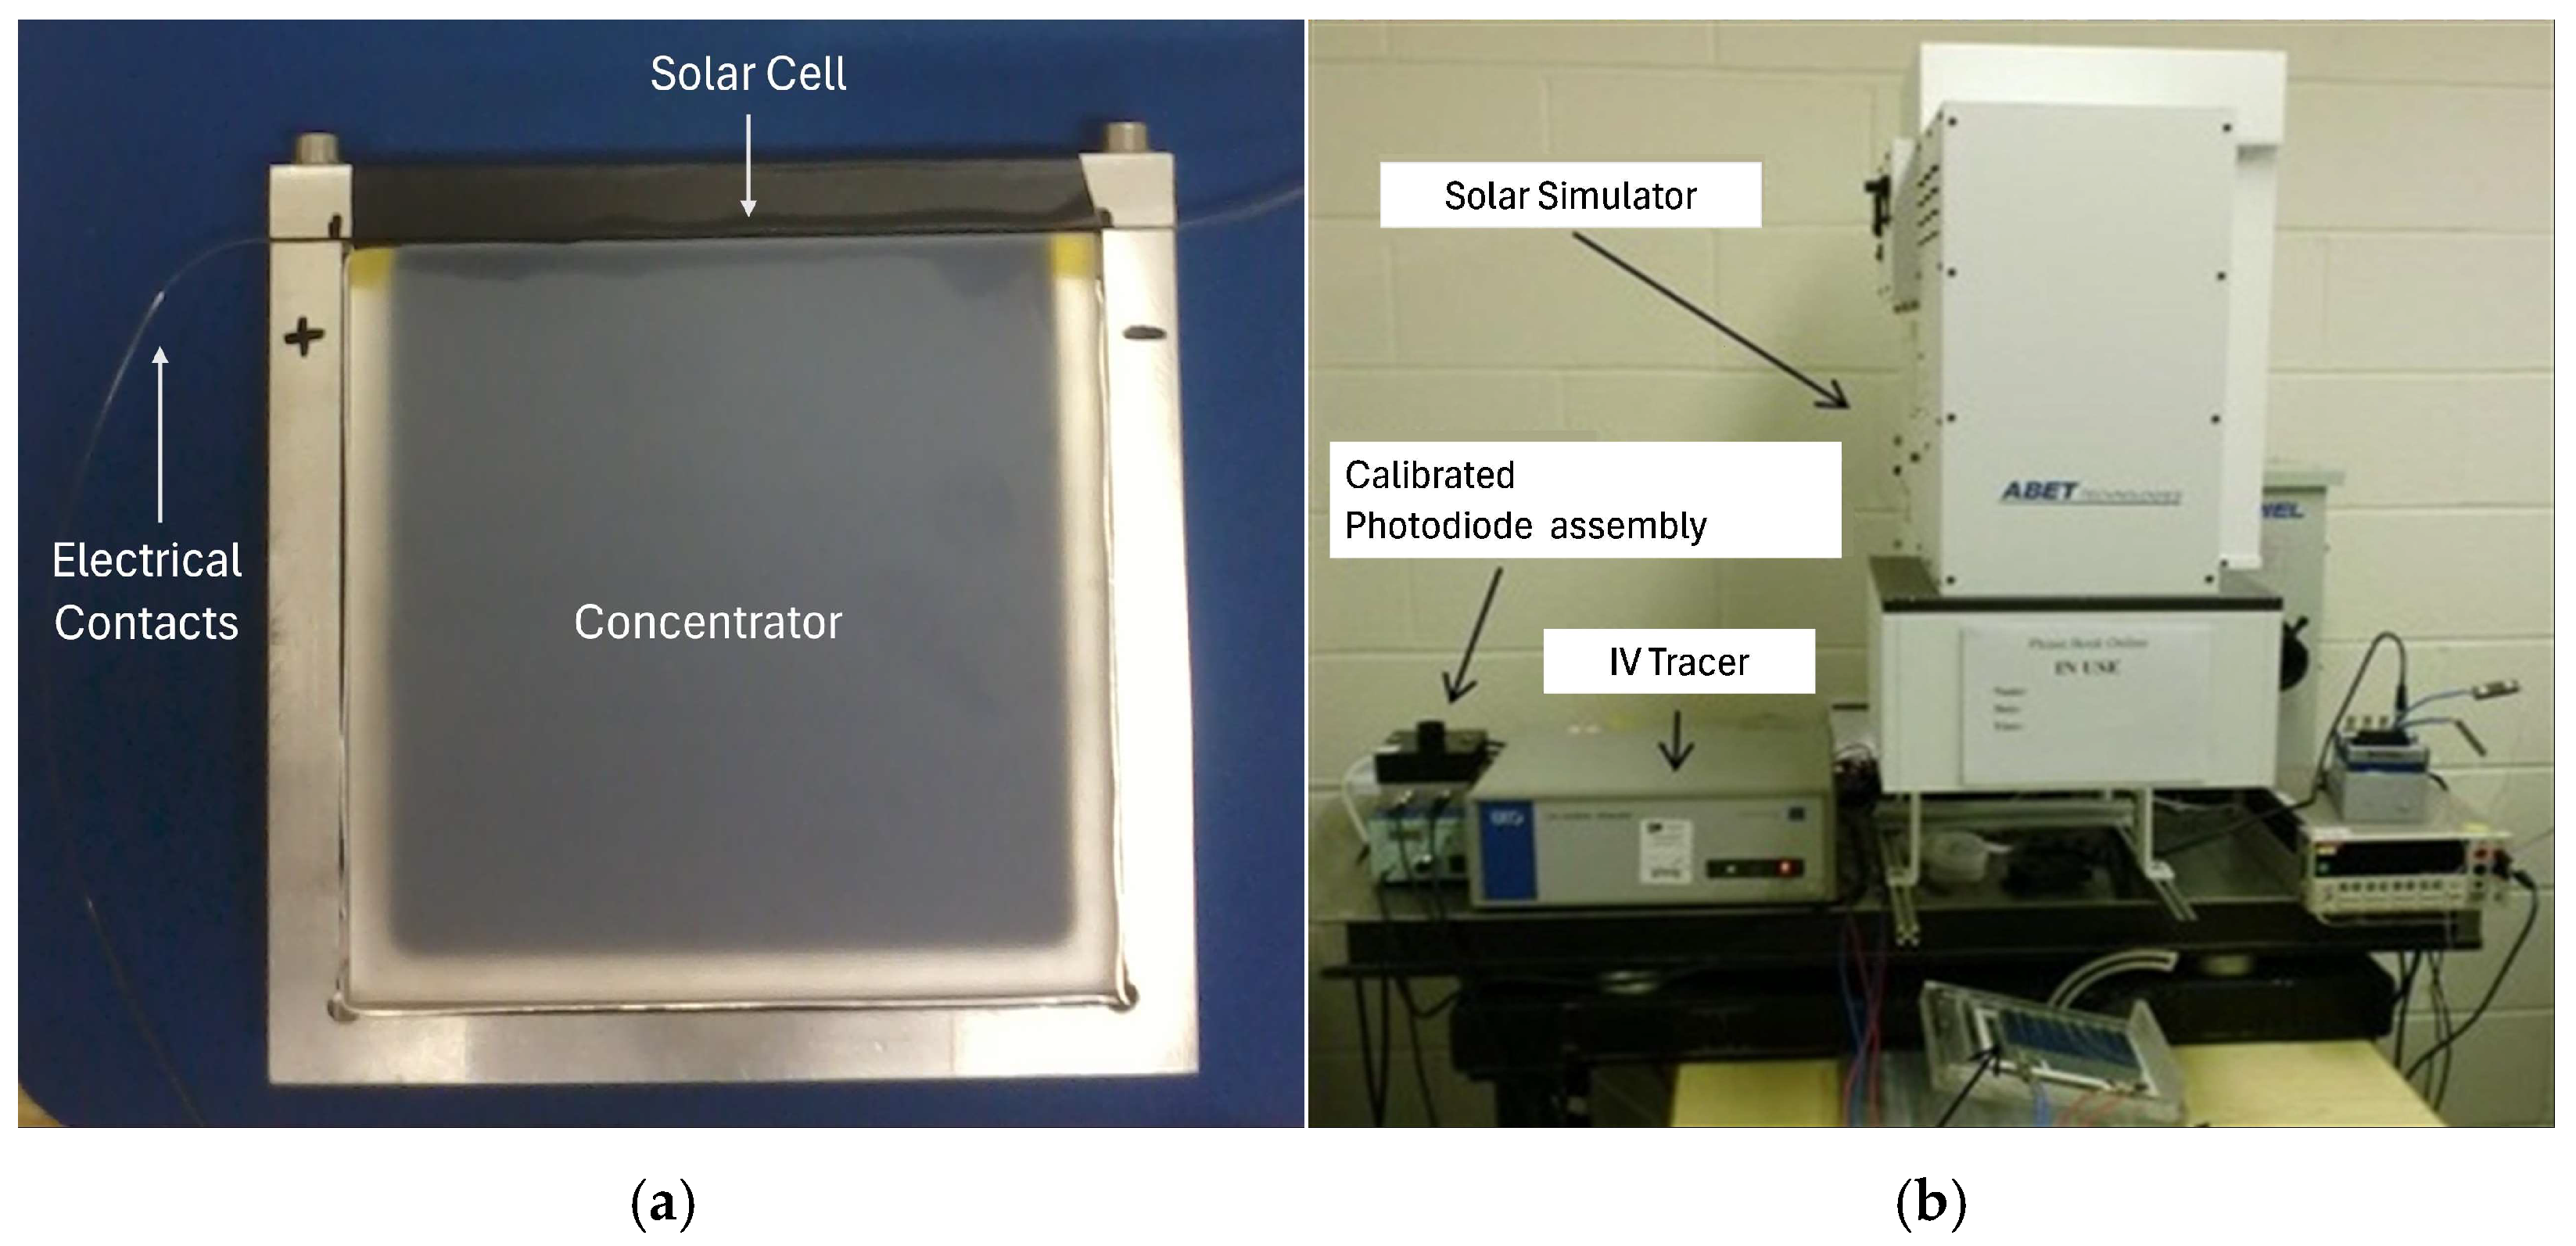
To assess the photovoltaic performance of the concentrators, each PMMA sample was mounted in a custom-fabricated aluminum frame with a multi-crystalline silicon solar cell attached to the edge of the concentrator, as shown in Figure 6a. The dimensions of the frames were matched to those of the corresponding concentrator samples to ensure consistent and reproducible testing conditions.
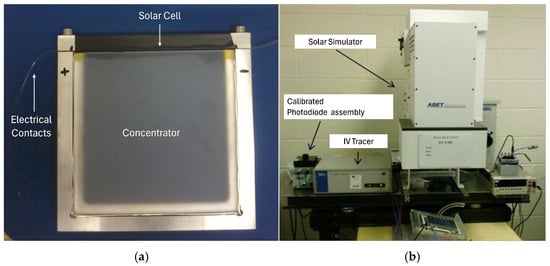
Figure 6.
(a) The experimental set-up for I–V characterization: the planar concentrator is mounted in an aluminum frame with a silicon solar cell attached at the edge; (b) the solar simulator configuration used to evaluate concentrator performance under standard test conditions.
The multi-crystalline silicon solar cells used had a nominal efficiency of approximately 15% under standard test conditions (AM1.5 spectrum, 1000 W/m2, 25 °C). These were selected due to their commercial availability, long-term stability, and mechanical robustness—key factors for ensuring reliable optical coupling and consistent performance across all concentrator sizes. Additionally, the use of standard silicon technology enabled the accurate benchmarking of the light-trapping effect introduced by the powder-blasted PMMA waveguides. Although newer technologies such as perovskite and thin-film photovoltaics present advantages in certain BIPV applications, this study focused on assessing the efficacy of the concentrator design itself using a well-established, reproducible photovoltaic platform.
A minimal air gap of 0.1 mm was maintained between PMMA and the solar cell to reduce optical losses while avoiding physical stress. No index-matching fluid was applied. The active area of the solar cells was tailored to the concentrator size: 100 × 4 mm2 (large), 72 × 4 mm2 (medium), and 43 × 4 mm2 (small). A 2 mm margin, including the cell’s main busbar, was masked with black tape to prevent unwanted light absorption and electrical contact with the concentrator.
Electrical contacts were carefully soldered to the solar cell terminals using a Weller soldering station and insulated with duct tape to avoid grounding to the aluminum frame. The I–V characterization was conducted under standard test conditions (AM1.5 illumination, 1000 W/m2) using a calibrated solar simulator (Abet Technologies, Milford, CT, USA) and a Keithley IV curve tracer (Figure 6b). A temperature sensor was attached to the back of the solar cell to ensure thermal consistency during testing, with temperature limits maintained between 25 °C and 26 °C via LabVIEW control.
Measurements were carried out for all powder-blasted concentrator samples, as well as unmodified (clear) PMMA of the same dimensions. The current–voltage (I–V) data obtained were used to calculate key photovoltaic parameters: short-circuit current (Isc), open-circuit voltage (Voc), maximum power point voltage and current (Vmpp, Impp), fill factor (FF), and power conversion efficiency (η). The fill factor was computed according to Equation (1), and the efficiency of each device was determined using Equation (2), where Pin is the incident optical power on the active area. By comparing the performance metrics of the powder-blasted samples to their clear PMMA counterparts, the impact of surface modification on light redirection, trapping, and overall photovoltaic efficiency was systematically assessed.
2.5. Simulations in OptisWorks Software
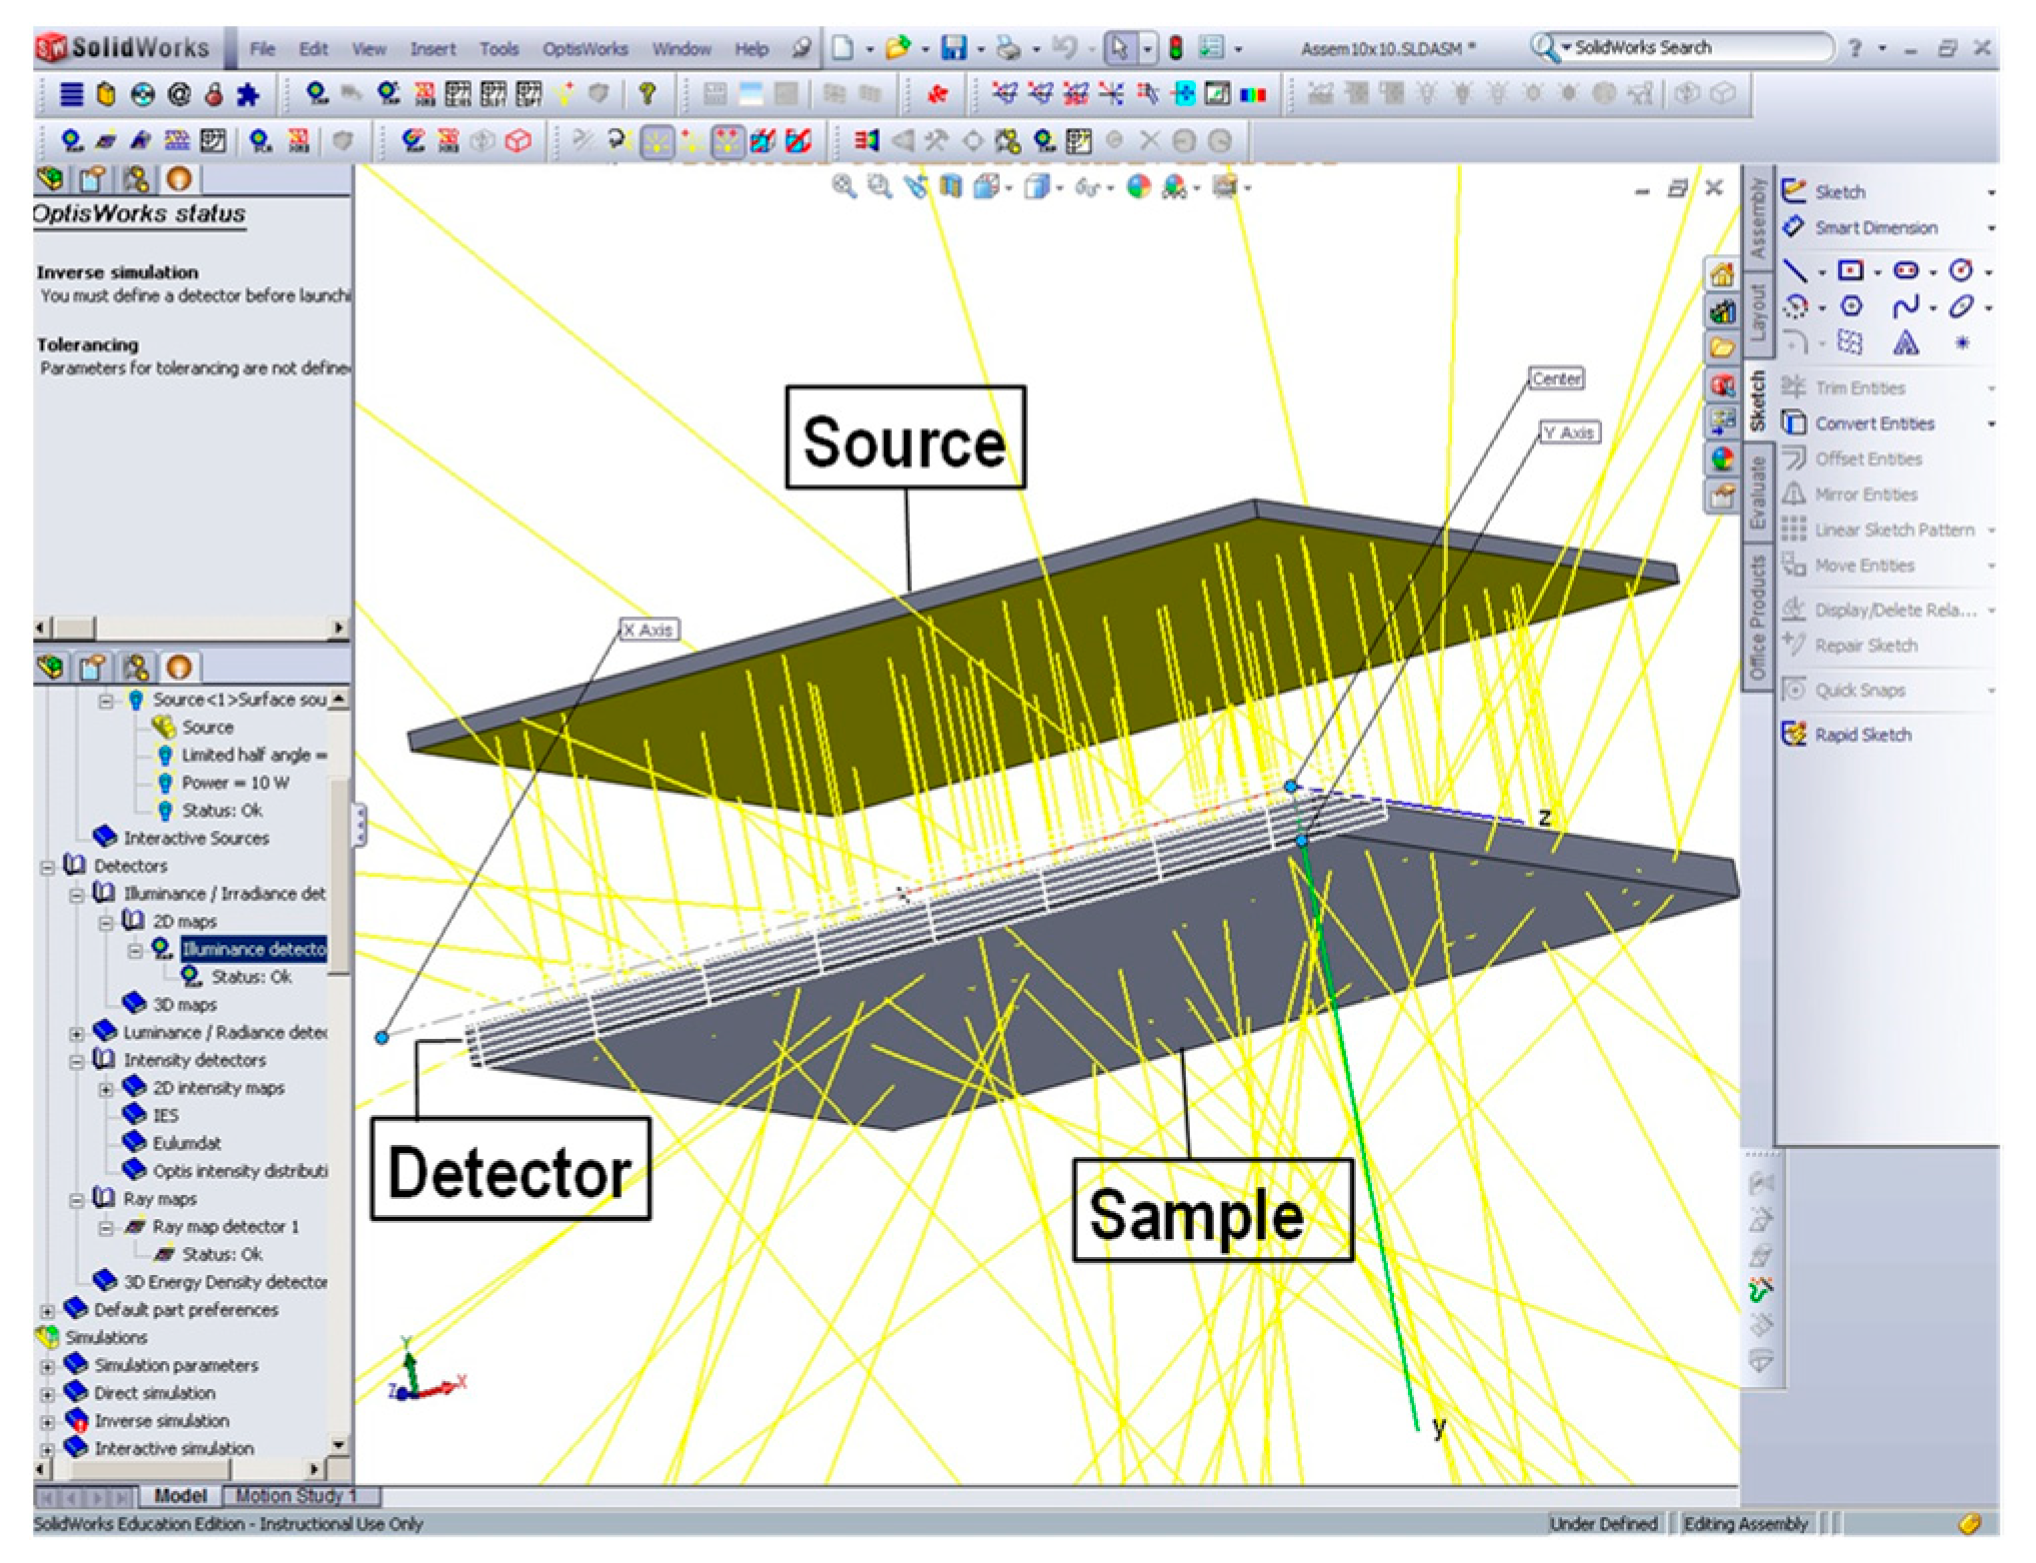
OptisWorks® 2012 simulation software was employed to model the optical behavior of the solar concentrators and evaluate their performance through ray-tracing analysis. The simulation workflow involved geometric modeling, material definition, source configuration, and irradiance detection. Geometry creation and source placement were carried out in SolidWorks® 2013, while optical parameters were defined and simulations were conducted within the OptisWorks environment.
Initially, 3D models of the concentrators were generated by sweeping 2D profiles along their respective aperture contours in SolidWorks® 2013, replicating the actual sample dimensions. The light source was modeled as a planar surface positioned parallel to the top face of the concentrator at a fixed distance, simulating the incident solar illumination from a calibrated solar simulator. The source surface area was selected to fully encompass the optical footprint of the concentrator to ensure accurate ray coverage (see Figure 7).
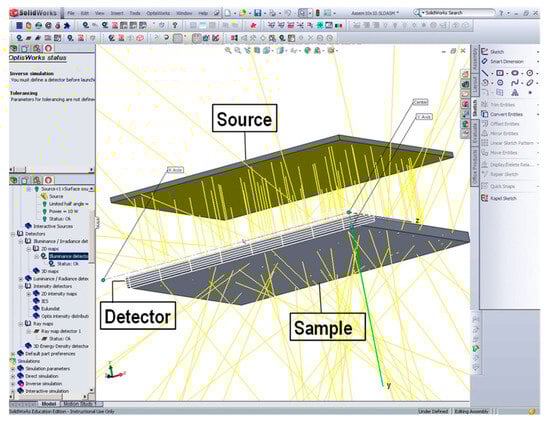
Figure 7.
The OptisWorks simulation environment used for modeling the solar concentrator. This figure shows ray tracing from a planar light source onto the concentrator surface, with a virtual detector positioned at the edge to capture transmitted light.
The optical properties of the materials were then defined. PMMA was modeled using wavelength-dependent transmission and reflection values measured experimentally. Although no explicit absorption coefficient was defined, any losses not captured by transmission or reflection were treated implicitly as absorption. This approach enabled the model to capture spectral attenuation effects, particularly in the NIR region. The scattering surface—representing the powder-blasted PMMA—was configured using OptisWorks’ scattering editor since no predefined surface models could accurately describe the empirical behavior. The scattering surface was parameterized based on angular and spectral dependencies derived from experimental measurements. A 100% Lambertian transmission profile was assumed to simulate diffuse angle-dependent light redistribution, with transmission and reflection coefficients set to 75% and 25%, respectively.
A photometric surface source was defined using the AM1.5 Global solar spectrum to simulate solar illumination. The irradiance spectrum was implemented via the solar spectrum editor, assigning relative power values at each wavelength. Since OptisWorks requires power input in watts rather than irradiance (W/m2), a conversion was applied using the following equation:
where Φ is the total emitted power (W), Ε is the irradiance (W/m2), and A is the area of the source surface (m2). Assuming a solar irradiance of 1000 W/m2, the resulting emitted powers for the large, medium, and small concentrator models were calculated as 10 W, 1.875 W, and 0.125 W, respectively. The source was configured with a Lambertian angular intensity distribution and a divergence half-angle of 0.25°, corresponding to the sun’s apparent angular diameter (~0.5°).
An irradiance detector was placed adjacent to the output aperture of the PMMA concentrator to measure the total flux reaching the solar cell, replicating the experimental set-up. The remaining three edges were assumed to be covered by an aluminum frame, preventing light escape. The detector area was matched to the solar cell’s active surface area and defined using a two-line configuration with axis dimensions specified accordingly. A sampling resolution of 999 was selected to ensure spectral consistency between the source and the detector.
Ray tracing was then performed to simulate light propagation, scattering, and trapping within the concentrator. A collimated line source was used in a 2D cross-sectional model to simplify the computational requirements. The simulations produced irradiance distribution maps (see Figure 8), which were analyzed to extract key metrics such as total optical flux and average irradiance at the output surface. These outputs were used to assess concentrator performance and validate the experimental observations for each of the three concentrator sizes.
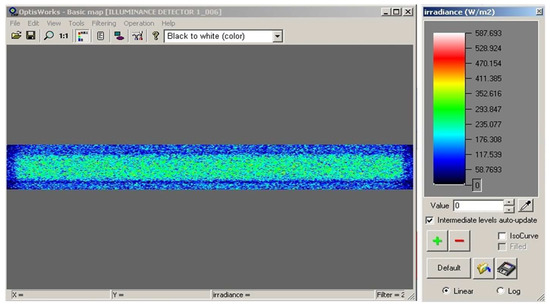
Figure 8.
A simulated 2D irradiance map for the 10 × 10 cm powder-blasted PMMA concentrator, illustrating the spatial distribution of light intensity across the selected detector area.
3. Results and Discussion
3.1. Optical Transmission
When light encounters the boundary between two optically homogeneous media, scattering primarily occurs at the surface interface, particularly if the boundary features micro- or nano-scale imperfections [44]. In this study, alumina particles were delivered onto the surface of optically clear PMMA via powder blasting, resulting in a roughened surface characterized by random, Lambertian-like scattering behavior. This surface treatment is expected to enhance internal reflection and increase the amount of light redirected toward the edge of the concentrator compared to unmodified PMMA.
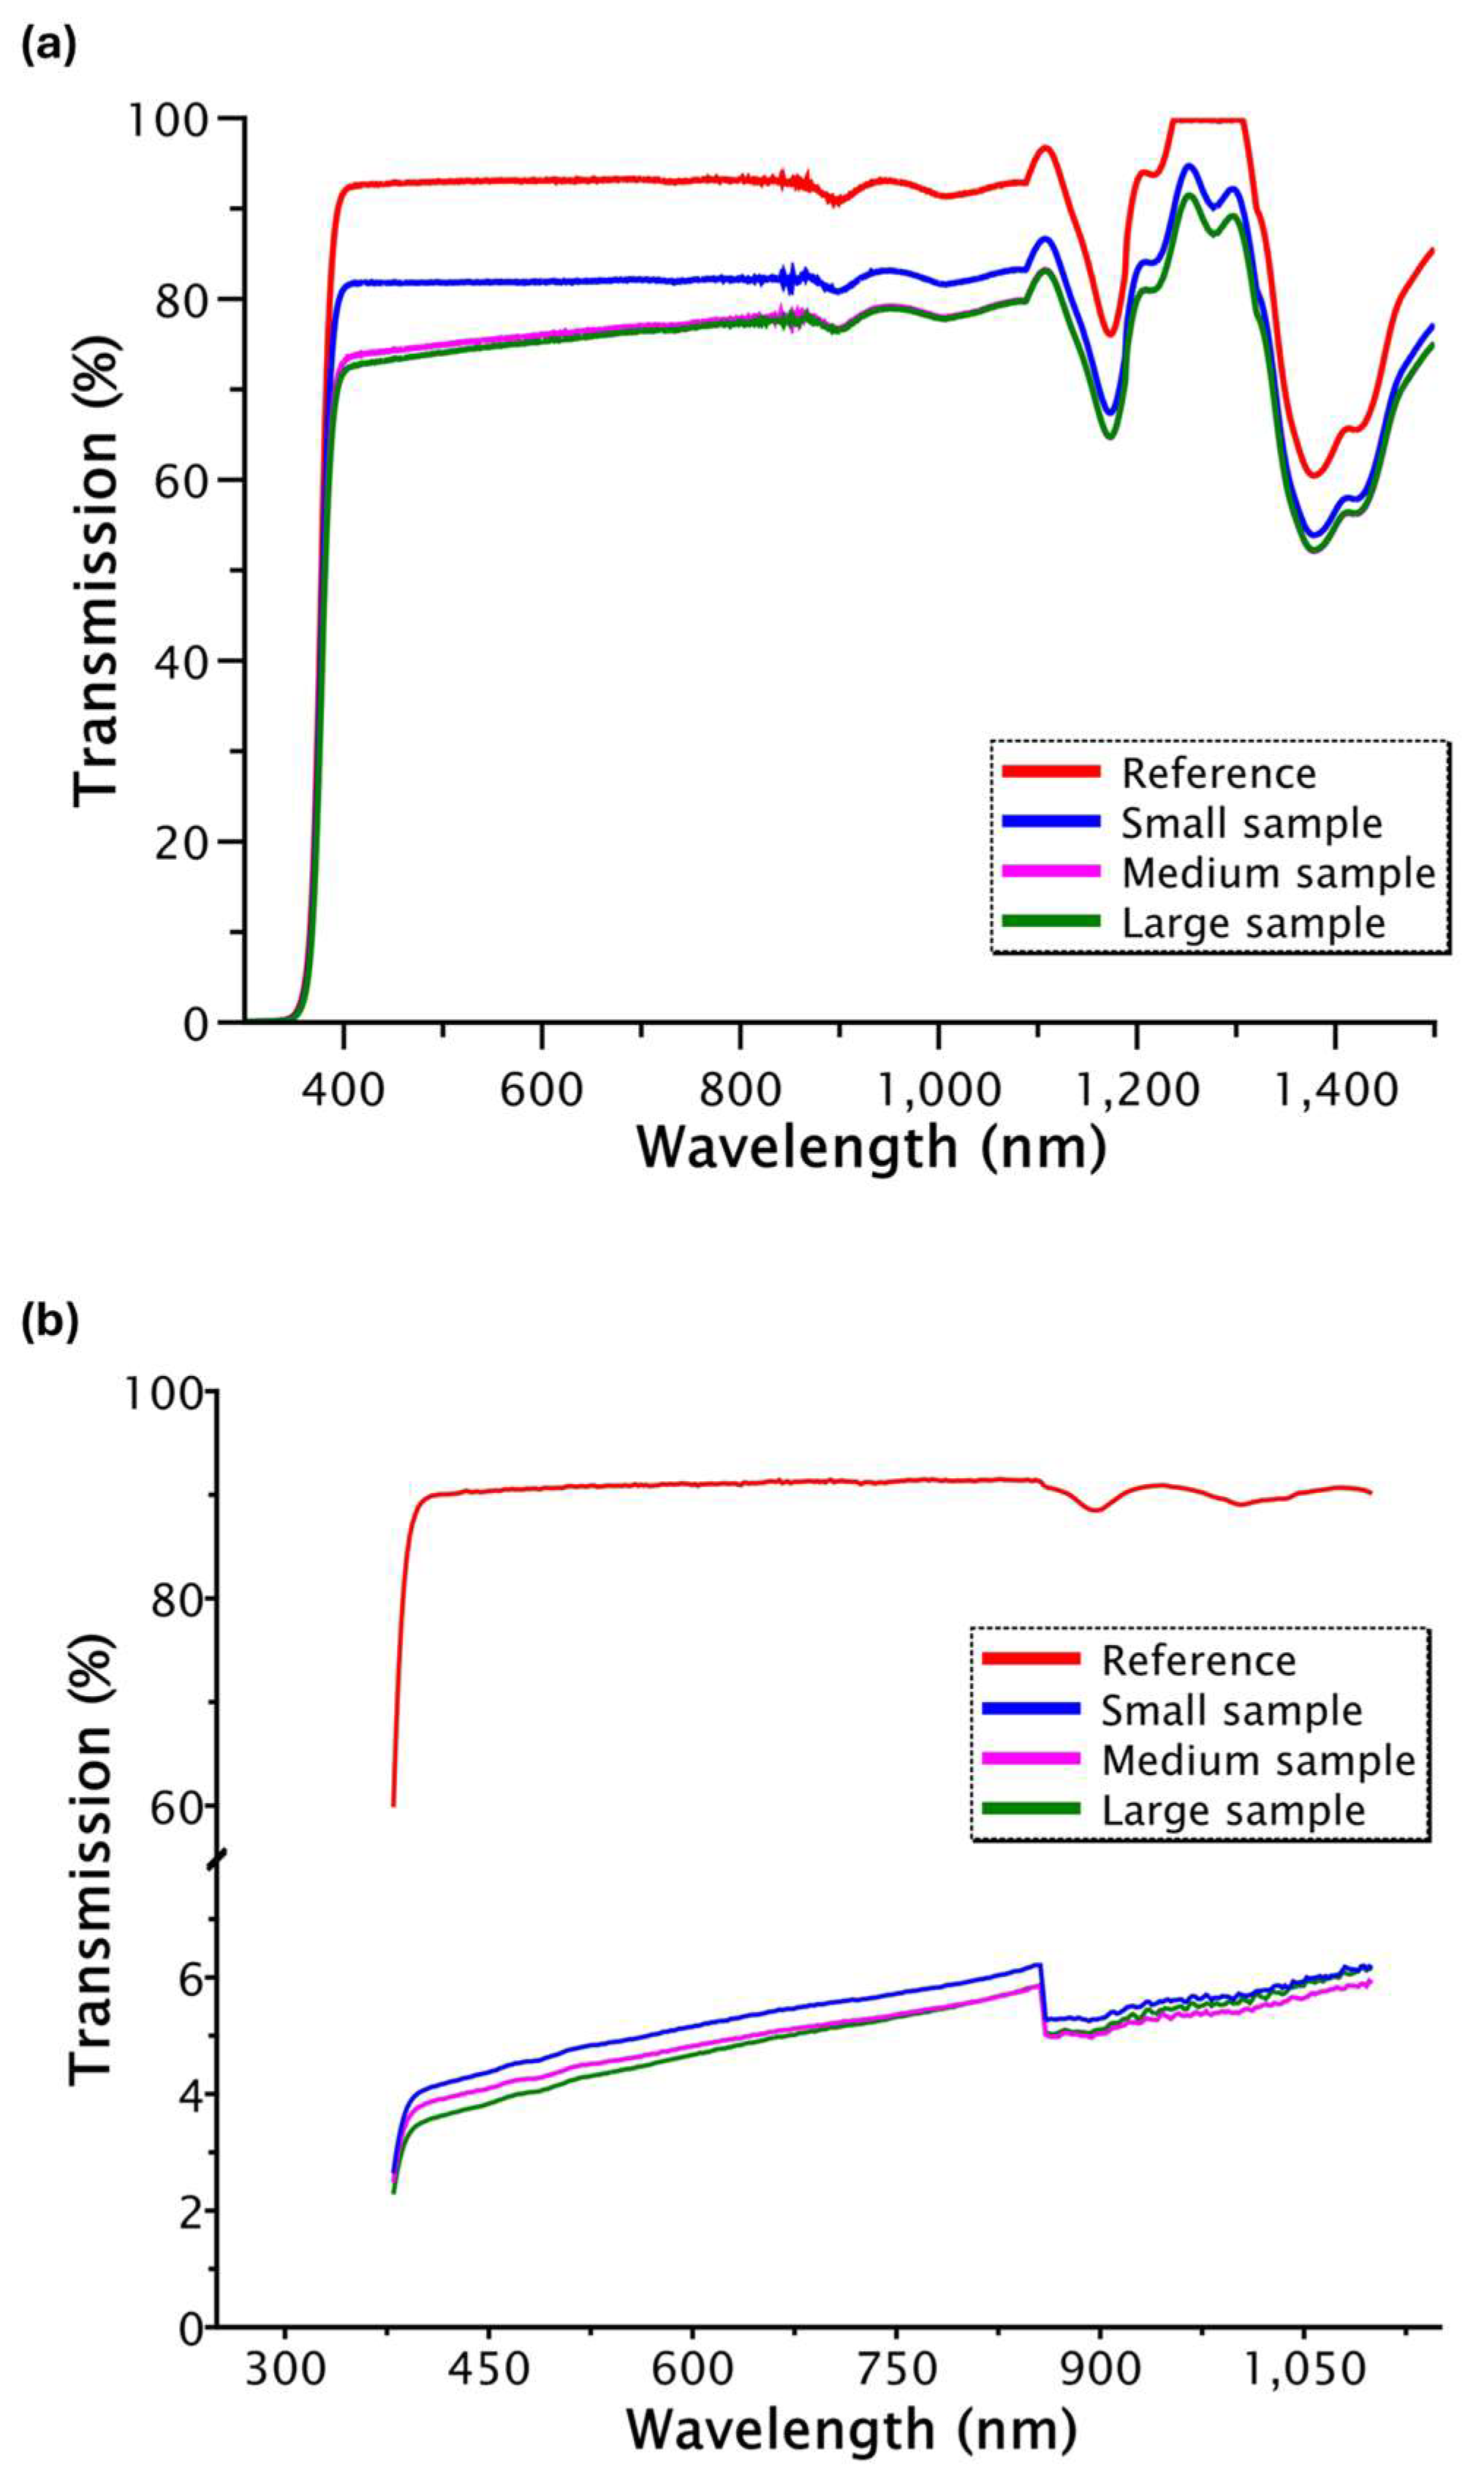
The transmission measurements conducted using a PerkinElmer Lambda 950 spectrophotometer confirmed a reduction in overall transmission through the powder-blasted samples relative to the clear PMMA reference. In the integrating sphere configuration, which captures diffuse transmission across a broad angular range, all modified samples exhibited an approximate 13% decrease in total transmitted intensity compared to clear PMMA (see Figure 9a). This reduction is attributed to increased surface scattering, which redirects part of the incident light laterally rather than allowing it to exit perpendicularly.
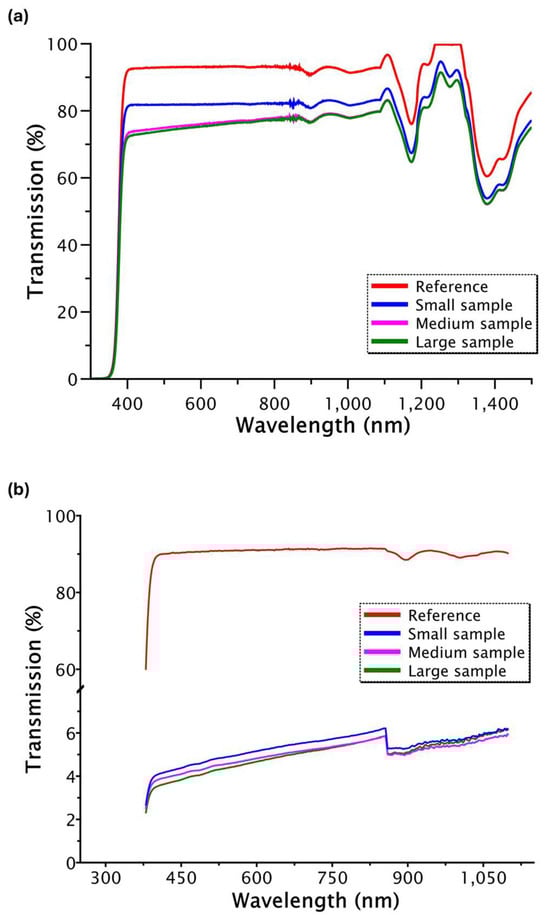
Figure 9.
Transmission spectra of clear PMMA and powder-blasted samples. (a) Total transmission measured with integrating sphere; (b) direct transmission measured in collimated (straight-line) geometry.
In contrast, measurements in direct (collimated) transmission geometry, where only forward-directed light is captured, revealed a far more pronounced effect. The powder-blasted samples demonstrated an 83% reduction in transmitted intensity at 0° relative to clear PMMA (see Figure 9b). This significant decrease further supports the hypothesis that surface roughening leads to a substantial angular redistribution of the incident light.
The transmission spectra of all three sample sizes exhibited nearly identical spectral profiles, indicating consistent surface modification across all specimens. This uniformity is critical for a comparative analysis of size-dependent optical and electrical performance. The sharp discontinuity observed at 860 nm corresponds to the transition between the spectrometer’s detectors (photomultiplier tube and PbS), as discussed in Section 2.2.
These results confirm that powder blasting effectively introduces strong angular scattering, a prerequisite for enhancing total internal reflection and light guiding within the concentrator body. The subsequent sections of this paper will explore the implications of this behavior on angular scattering distributions, solar cell performance, and simulation validation.
3.2. Angular Scattering Characterization
Angle-resolved scattering measurements were performed using the goniometer set-up to investigate the angular distribution of transmitted light. This configuration enables a precise evaluation of how the powder-blasted surface influences the angular scattering profile, which is essential for understanding light-trapping mechanisms within the waveguide.
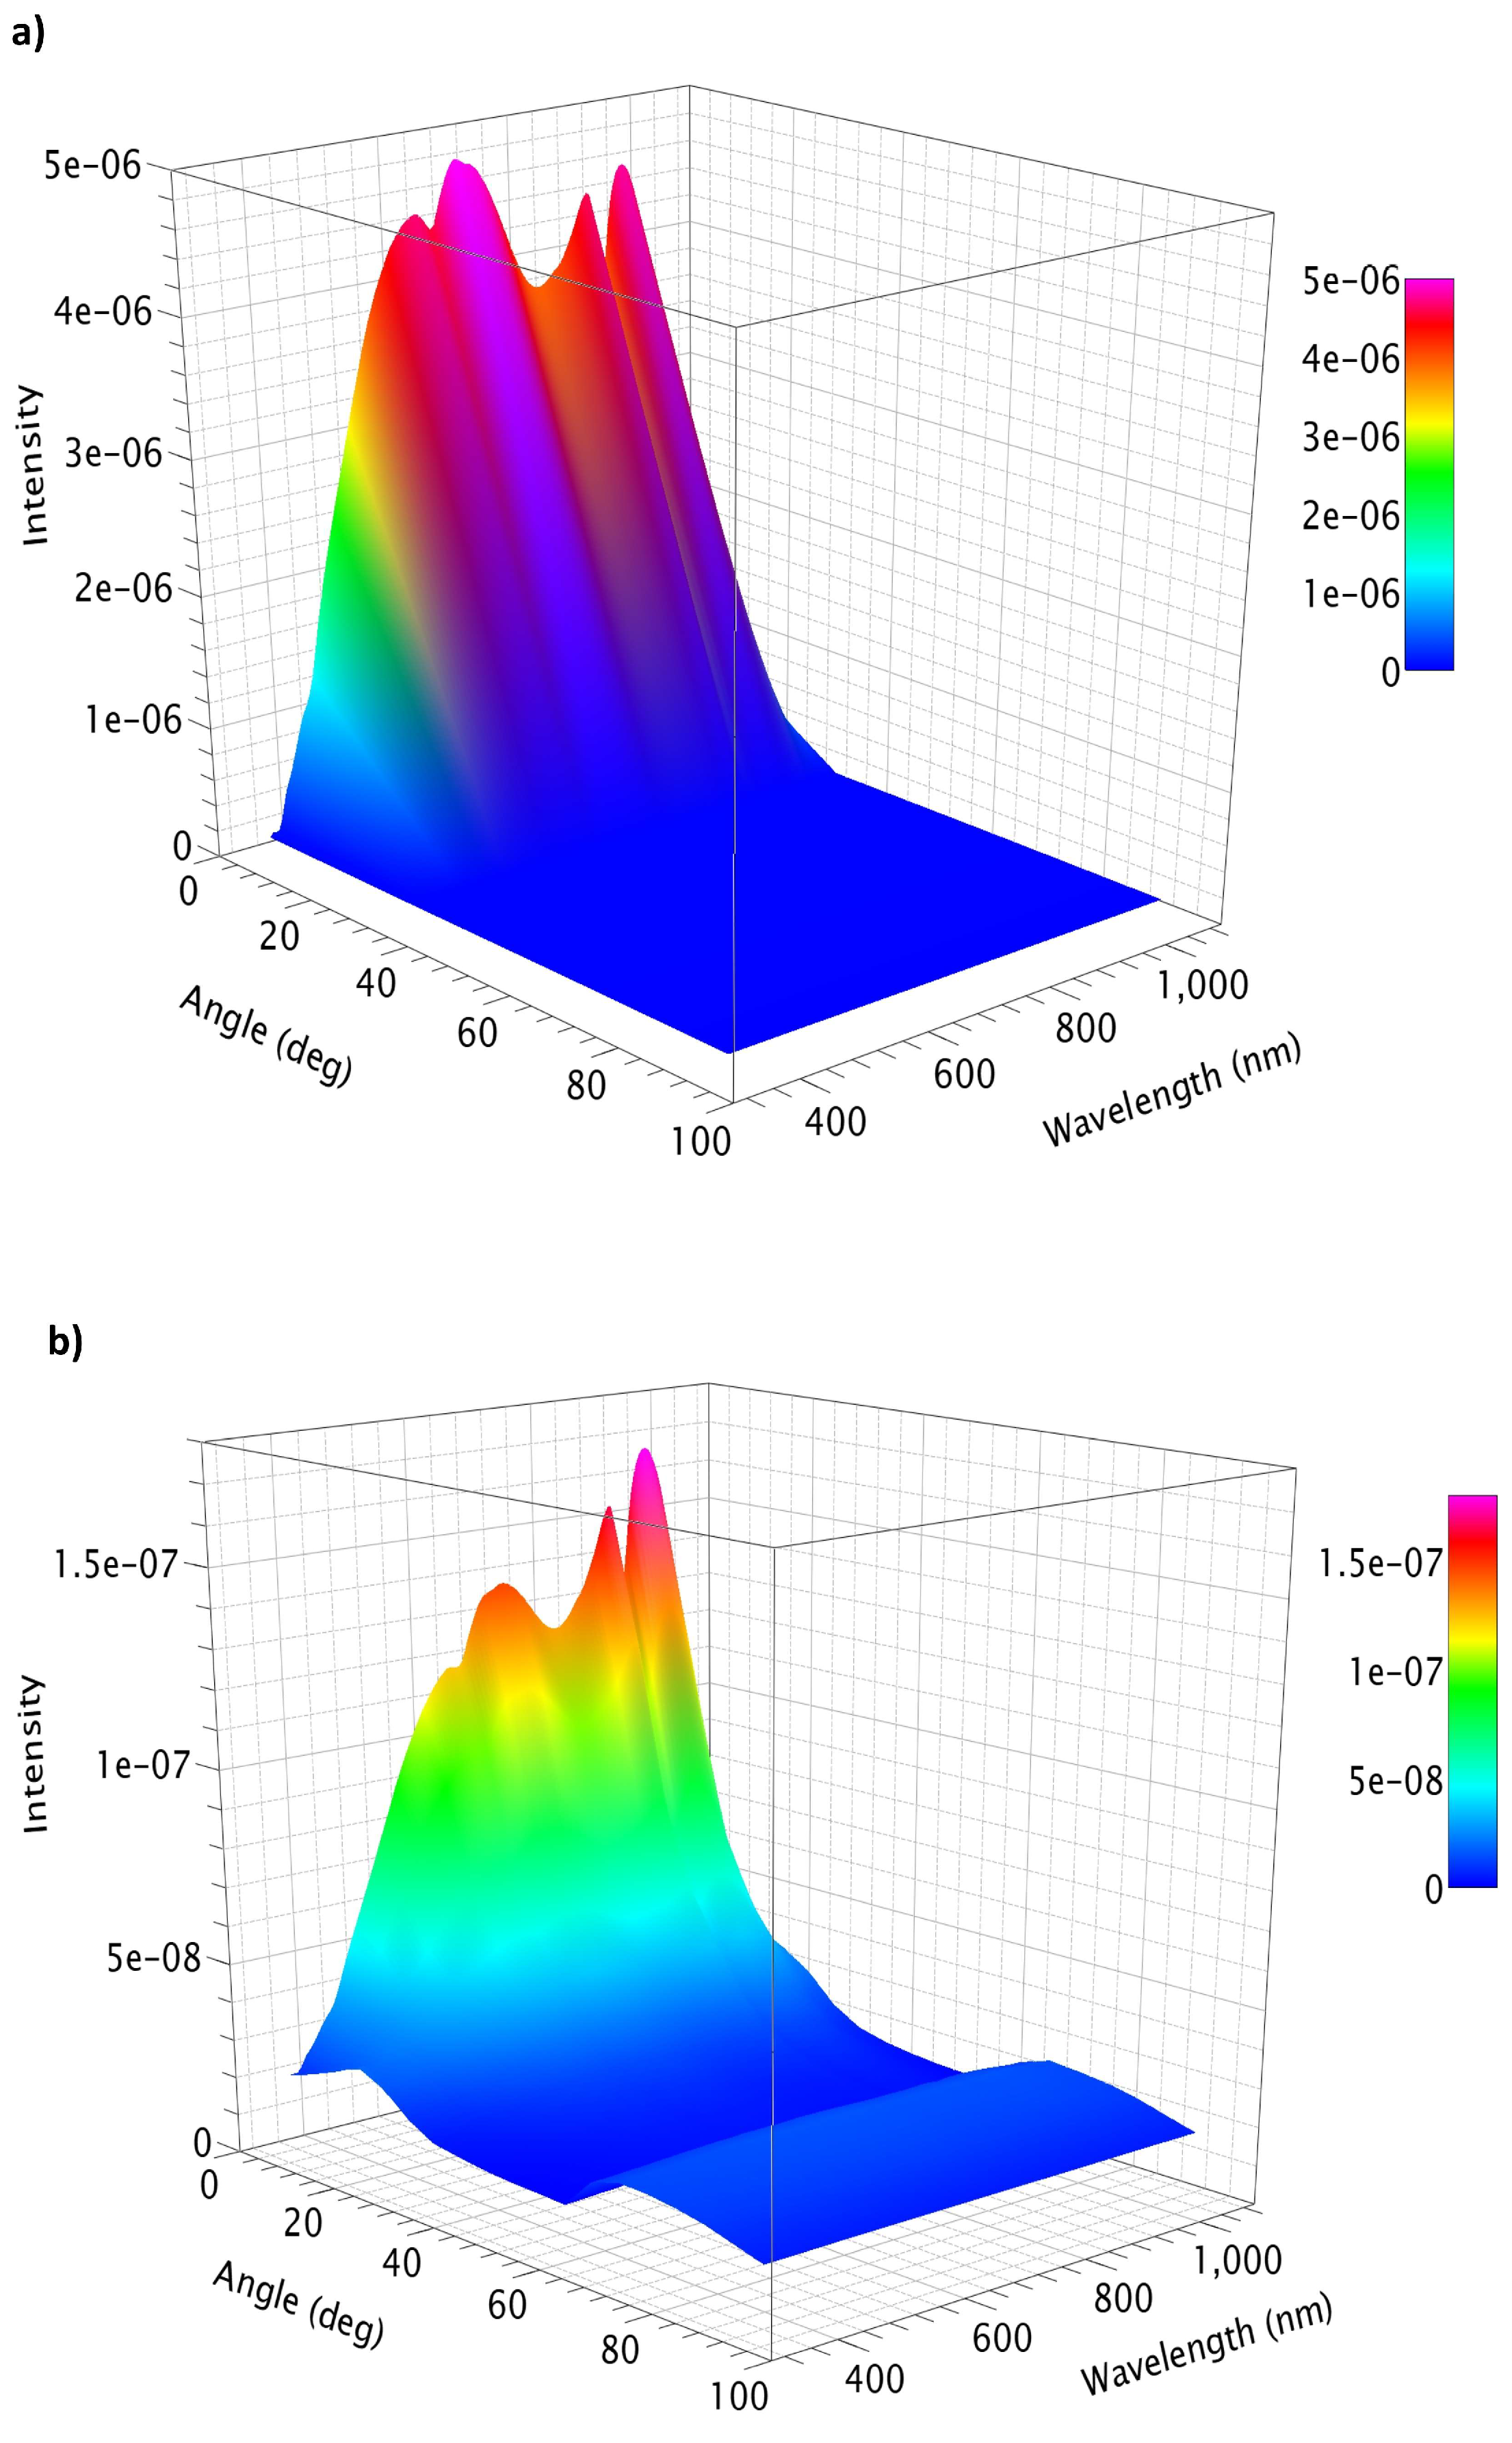
Measurements were conducted over an angular range from 0° to 90°, with the incident light fixed at normal incidence (0°) to the front surface of the sample. The resulting intensity profiles for both the clear and modified PMMA samples are presented in Figure 10. A significant difference is observed between the two: while clear PMMA exhibits relatively low and uniform transmission beyond 30°, the powder-blasted sample shows a pronounced angular dependence.
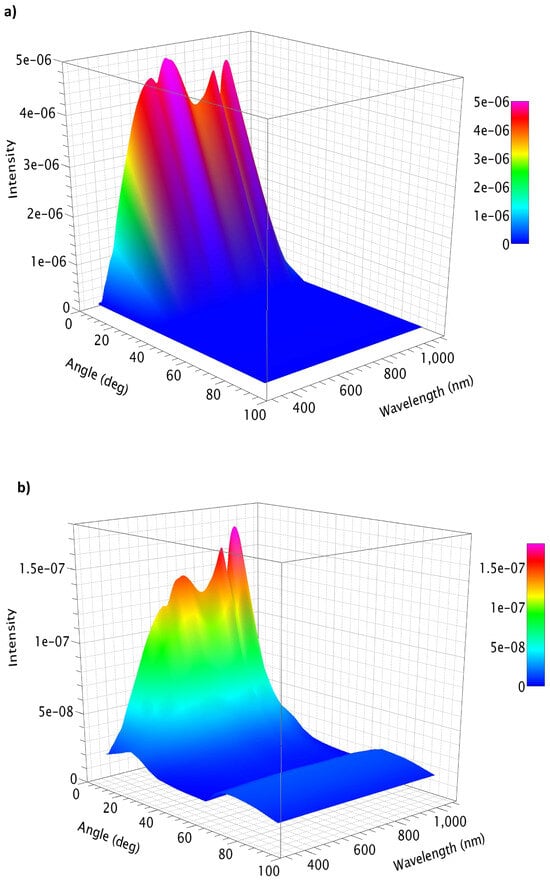
Figure 10.
Angular scattering intensity comparison between (a) clear and (b) powder-blasted PMMA samples for wavelengths between 380 and 1100 nm. Powder-blasted sample shows enhanced high-angle scattering, facilitating total internal reflection.
Notably, the intensity for the modified sample decreases up to approximately 60°, reaching a local minimum, followed by a secondary increase to higher angles. This upturn at large scattering angles is not present in the clear PMMA and can be attributed to the redistribution of light into angles exceeding the critical angle for total internal reflection in PMMA (≈42°). Light scattered into these angles becomes confined within the slab via TIR and is guided laterally toward the sample edges, where photovoltaic cells are positioned.
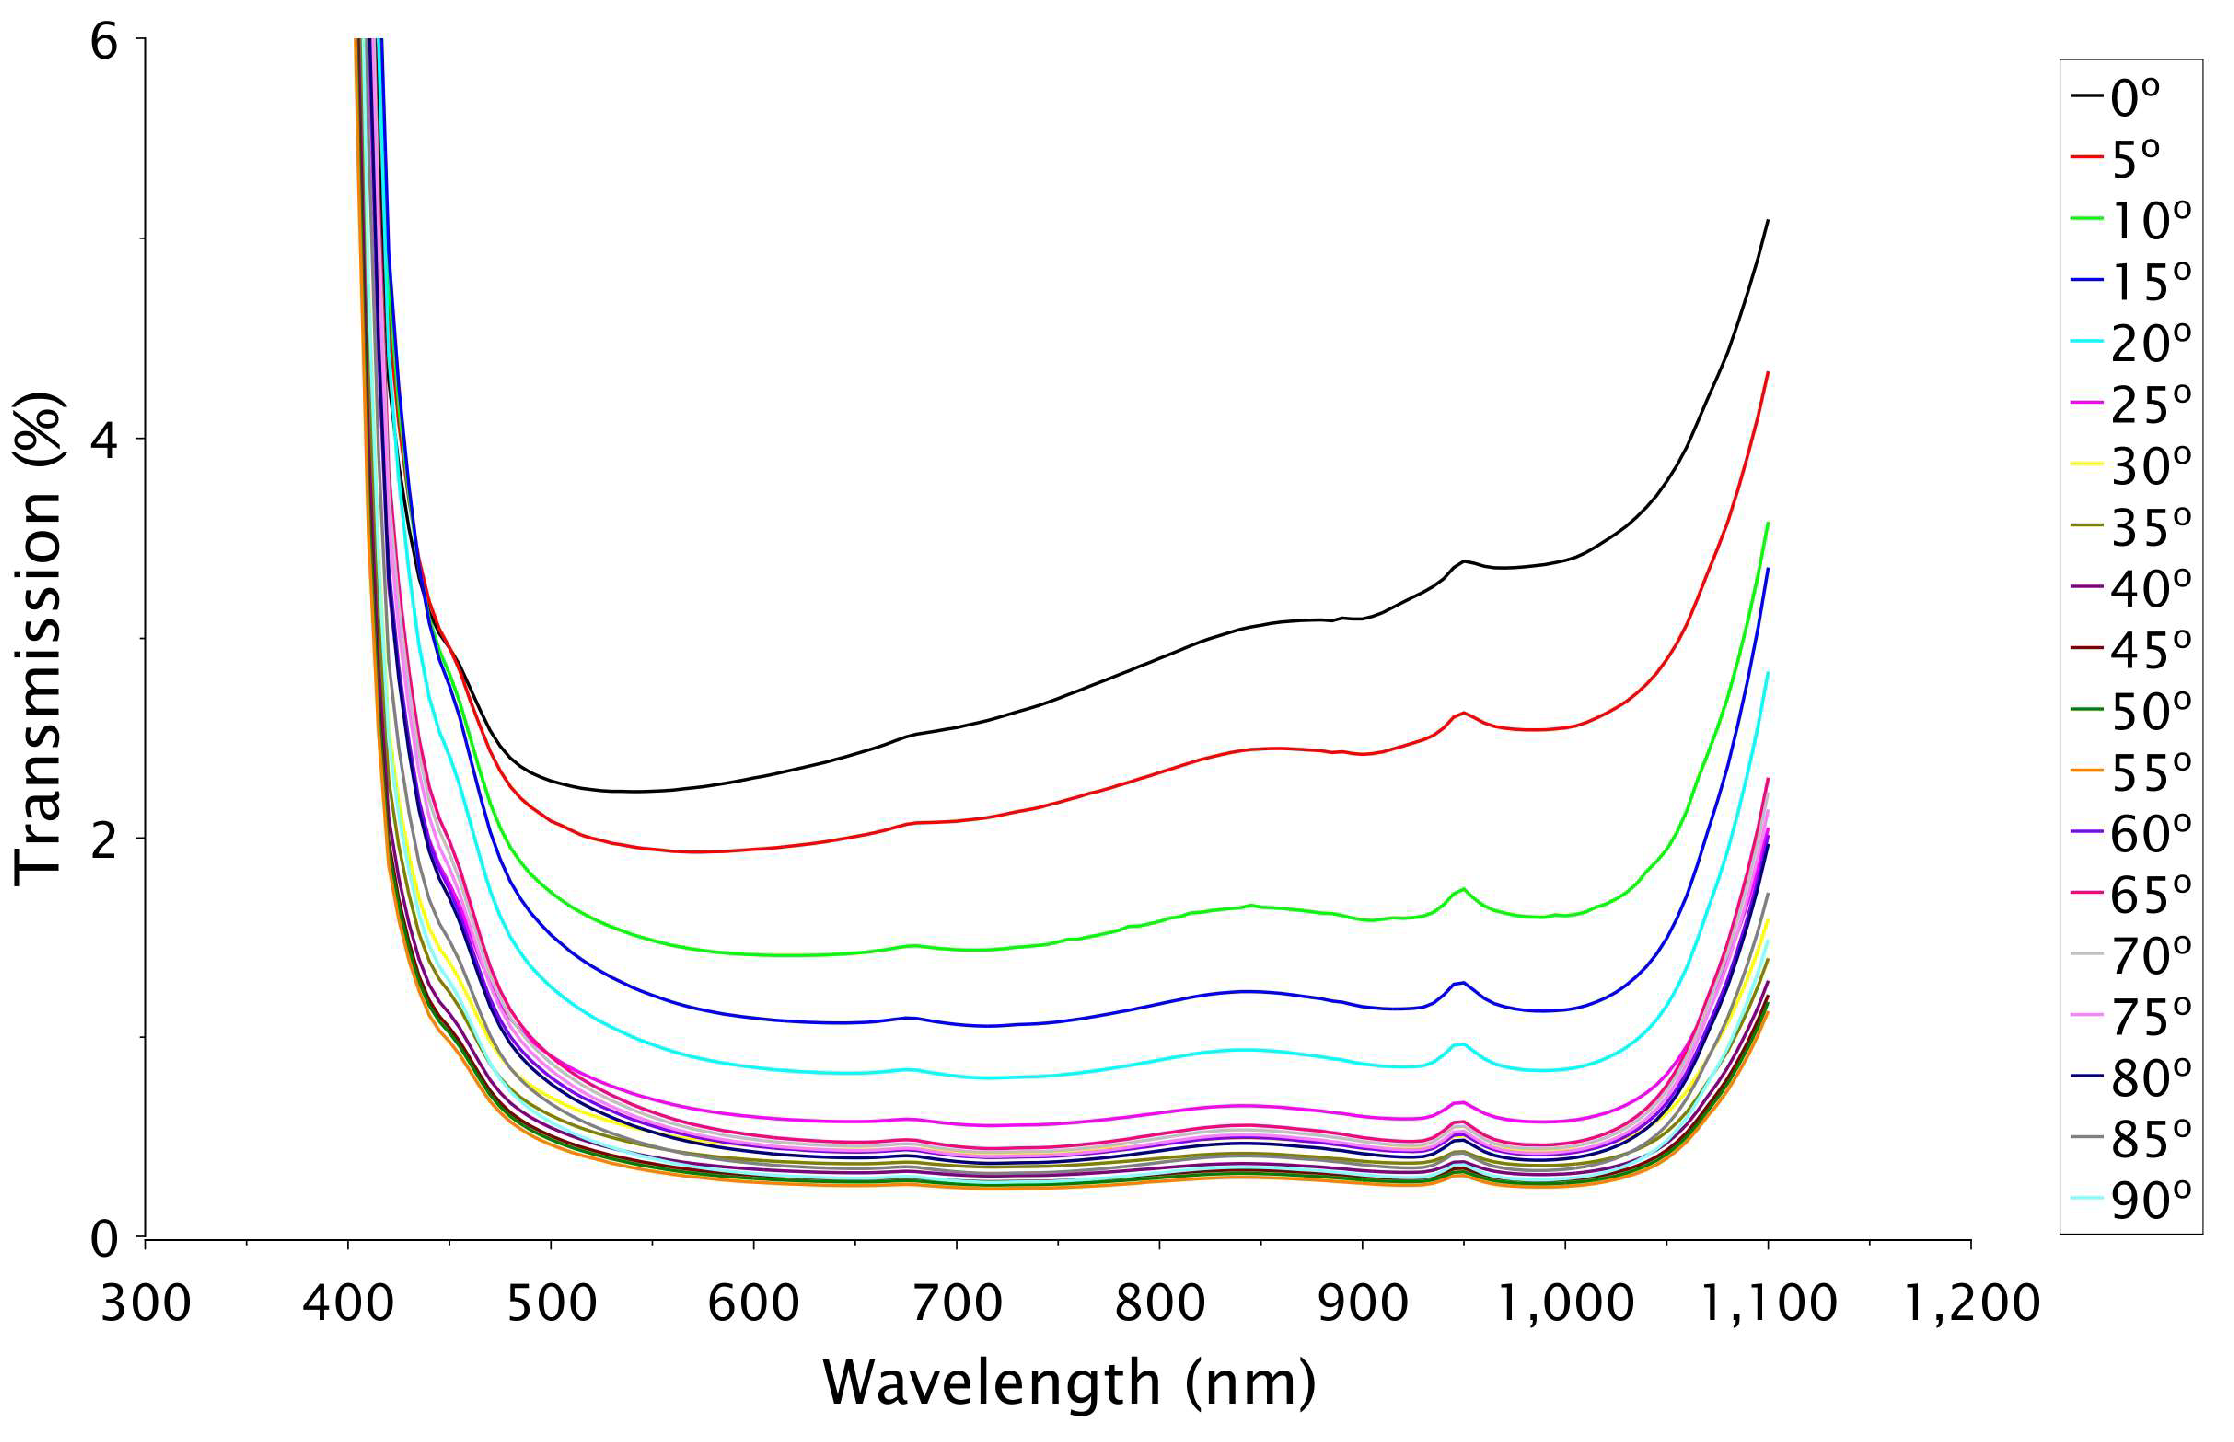
This behavior is further emphasized in the normalized scattering plots shown in Figure 11, where the measured angular intensity is divided by the corresponding transmission values to account for baseline losses. The data clearly indicate that the powder-blasted surface enhances scattering into high-angle modes by nearly an order of magnitude compared to unmodified PMMA. This supports the hypothesis that surface roughening improves light trapping by increasing the fraction of rays redirected into wave-guided paths.
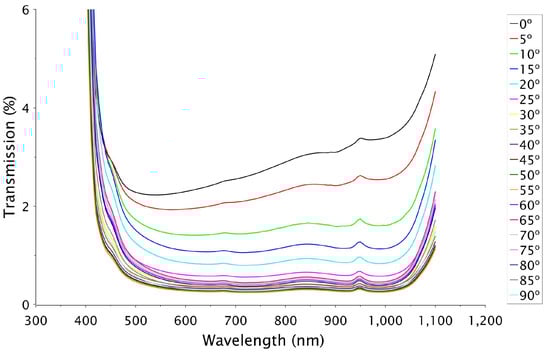
Figure 11.
The normalized scattering intensity of powder-blasted PMMA as a function of angle (0° to 90°), referenced to the total transmission. The profile illustrates the angular redistribution of light due to surface roughening.
Importantly, the normalized intensity appears largely wavelength-independent across the measured range (380–1100 nm), suggesting that the powder-blasted surface approximates Lambertian scattering, where the angular distribution is governed predominantly by geometry rather than wavelength. Minor deviations in the spectra, such as narrow peaks or fluctuations, can be attributed to residual forward- or backscattered components and measurement artifacts.
One such artifact is likely due to the spectrometer’s stabilization lag between scans. Specifically, it was observed that the instrument occasionally recorded intensity values from the previous scan at the beginning of a new measurement cycle, introducing artificial peaks at low angles. These anomalies were accounted for during data interpretation.
3.3. Photovoltaic Performance
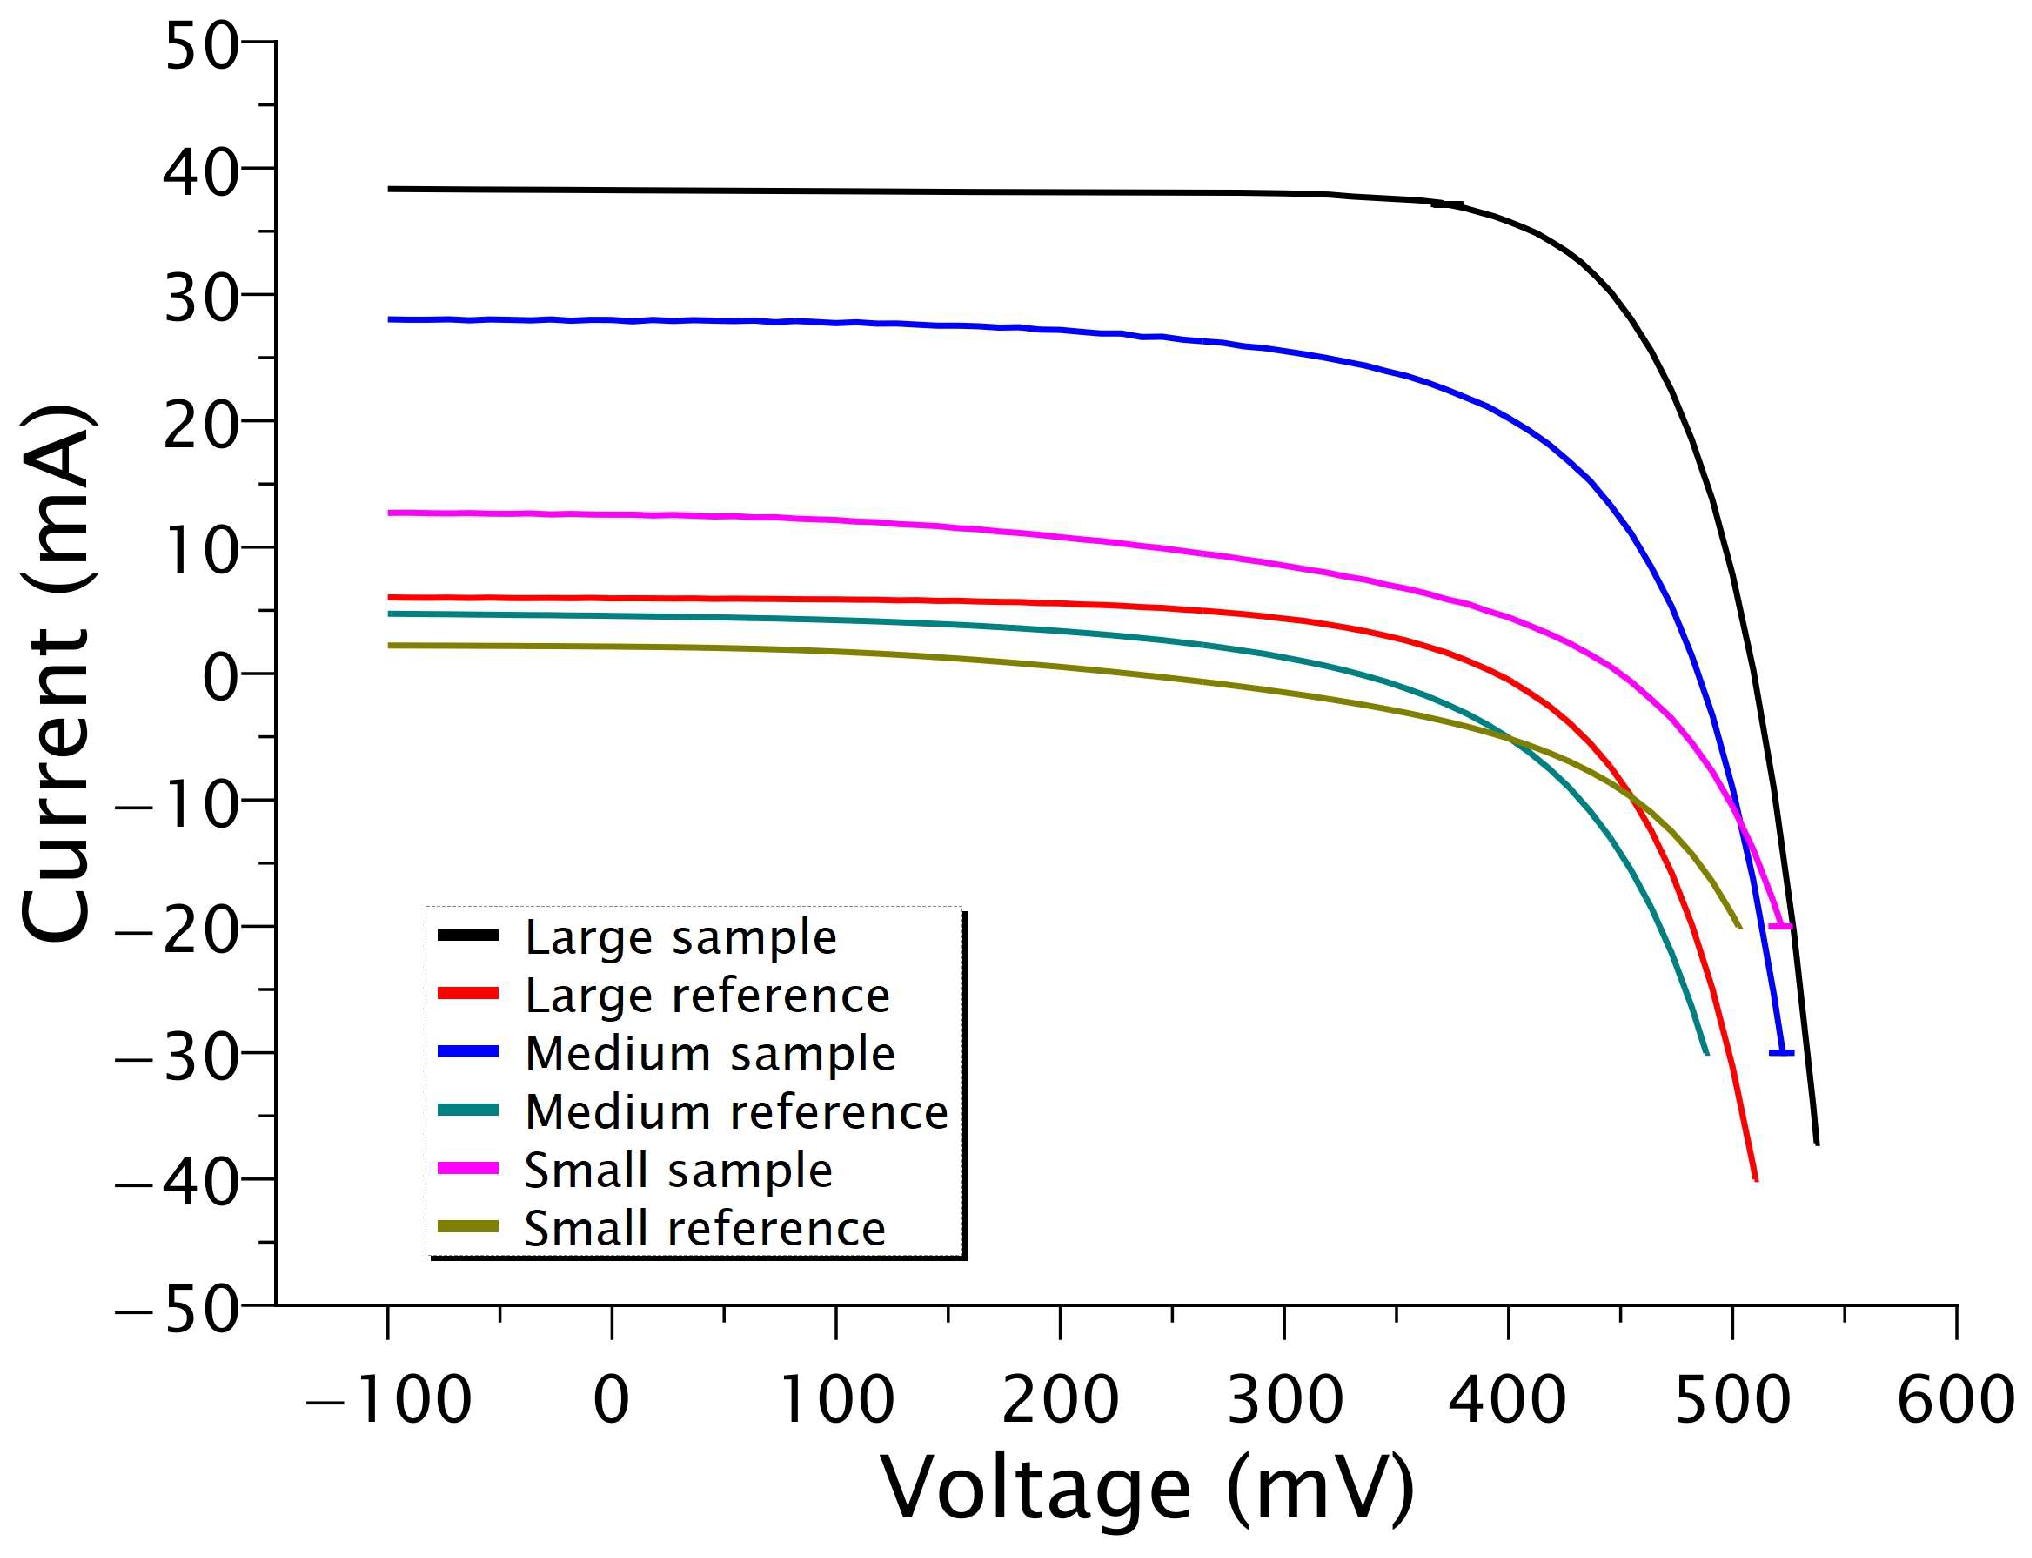
The photovoltaic performance of the concentrator systems was evaluated by measuring the current–voltage (I–V) characteristics of silicon solar cells attached to the edge of each PMMA sample. The I–V curve represents the electrical response of a PV cell under illumination and provides key parameters such as the short-circuit current (Isc), open-circuit voltage (Voc), maximum power point (Pmax), and fill factor (FF). These metrics collectively define the energy conversion efficiency of the cell and are influenced by both the total irradiance incident on the cell and its spatial distribution.
In this study, each concentrator was coupled to a commercial multi-crystalline silicon solar cell and illuminated under standard test conditions (AM1.5 spectrum, ~1000 W/m2, 26 °C). Performance was benchmarked against control samples consisting of unmodified (clear) PMMA sheets of identical size and geometry. The powder-blasted surface improved light coupling into the waveguide, enhancing light redirection to the solar cells and increasing Isc across all sample sizes (see Figure 12). The increase in current confirms the effectiveness of surface roughening in improving light trapping and energy transfer.
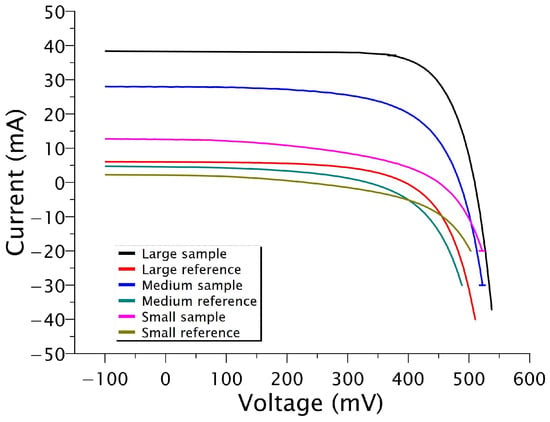
Figure 12.
Current–voltage (I–V) curves for silicon solar cells attached to one edge of the concentrator samples. An increase in short-circuit current (Isc) is observed for all powder-blasted PMMA samples compared to their clear PMMA counterparts of equal dimensions, indicating enhanced light delivery to the cell.
The fill factor (Equation (1)) is influenced by how uniformly light is distributed over the active cell area. It was observed that the fill factor decreased with sample size reduction, ranging from 66.1% for the large sample to 45.8% for the smallest one. This reduction is attributed to highly non-uniform irradiation across smaller cell surfaces, which is consistent with the findings in earlier studies on non-imaging CPCs and V-trough concentrators [10,20].
A summary of the I–V characteristics for each sample and its corresponding reference (clear PMMA) is provided in Table 1. The enhancements observed in Isc, Pmax, and FF underscore the effectiveness of surface roughening in improving light trapping and delivery to the cell.

Table 1.
Photovoltaic parameters (Impp, Isc, Vmpp, Voc, and fill factor) of silicon solar cells as a function of concentrator size. Values are compared to corresponding reference cells coupled with unmodified PMMA.
Efficiency calculations were based on the active area of each solar cell and the input power delivered by the corresponding concentrator (10 W, 1.875 W, and 1.25 W for large, medium, and small samples, respectively). As shown in Table 2, the active area efficiency increased markedly across all concentrator sizes, with the medium-sized sample achieving the highest efficiency of 0.44%, a notable improvement over the reference and comparable to the values reported for planar photonic concentrators (PPCs) in similar configurations [19]. Compared to the corresponding reference samples, the power output improved by factors ranging from 10.5× to 13.5× (over an order of magnitude).
Table 2.
Maximum power output (Pmax) and active area efficiency of solar cells as a function of concentrator size. This table also reports enhancement ratios in power and efficiency relative to unmodified (clear) PMMA samples of same size.
To place these results in context, several studies have explored similar planar concentrator architectures. Meinardi et al. [45] reported an optical conversion efficiency of 2.85% for a 12 × 12 cm2 luminescent solar concentrator embedded with Si quantum dots in PMMA. Similarly, Cao et al. [46] demonstrated efficiencies from 1 to 6% for various nano-crystal- or carbon-dot-based LSCs. These systems typically rely on luminescence, high-quantum-yield materials, and multi-edge light extraction strategies. In contrast, the powder-blasted PMMA concentrators in this study operate via passive surface scattering alone, with no active dopants or multilayer coatings, offering a scalable and fabrication-friendly approach suitable for building-integrated photovoltaics.
Interestingly, after an initial increase in efficiency with sample size, a decline was observed for the largest concentrator. This trend suggests a trade-off: as the concentrator size increases, the average optical path length also increases, raising the probability of light escape through surface losses. Forward and backward scattering, combined with the long transport distance to the edge, can limit collection efficiency. These findings are consistent with previous simulation studies on LSC and PPC systems that highlight size-dependent escape probabilities [24].
Although the absolute efficiencies are modest due to the small-area cells used, the relative improvements are significant. The results support the potential of powder-blasted PMMA as a passive concentrator for BIPV applications, where scalability, simplicity, and durability are essential.
Temperature effects, though present, were minimal under the controlled experimental conditions. Although Isc typically increases with temperature at ~0.06%/K [47], this variation was negligible within the operating range (25–26 °C). However, elevated temperatures that are typical in real-world BIPV applications can influence both optical and electrical performance. PMMA exhibits a temperature-dependent refractive index, decreasing at higher temperatures and potentially reducing TIR efficiency. Additionally, the efficiency of multi-crystalline silicon solar cells typically decreases at a rate of approximately −0.45% per °C, mainly due to voltage drops. These considerations underline the importance of future thermal modeling and field testing, particularly for BIPV systems subject to sustained high-temperature exposure.
3.4. Ray-Tracing Simulation Results and Comparison with Experimental Data
To complement the experimental characterization, ray-tracing simulations were performed using OptisWorks software for all three concentrator sizes. The simulations replicated the experimental conditions as closely as possible, including the optical properties of the PMMA material, the geometry of the waveguides, and the characteristics of the light source. Each simulation was conducted with a high ray count (100 million rays) to ensure statistically robust and spatially resolved irradiance maps.
Following the completion of each simulation, two-dimensional (2D) irradiance maps were generated, depicting the spatial distribution of light intensity over the output surface (Figure 8). From these maps, key optical parameters were extracted, including average irradiance, total collected flux, and the minimum and maximum irradiance values across the active region.
The detectors in the simulation were dimensioned and positioned to replicate the active area of the corresponding solar cells used in the experimental set-up, placed 0.5 mm from the concentrator edge. This alignment allowed for a direct comparison between simulated optical output and the experimentally measured photovoltaic power (normalized by assuming a 15% cell efficiency). The simulation results and comparative analysis are presented in Table 3.
Table 3.
Simulated and experimental flux measurements for each concentrator size.
As expected, the total simulated optical flux increased with the size of the concentrator, reflecting the larger collection area. Among the three samples, the best agreement between the simulation and experiment was observed for the medium-sized concentrator, with only a 5% deviation. The largest discrepancy, 23%, was found for the smallest sample. These results suggest that while the simulation model captures the key trends and order of magnitude, certain assumptions may introduce inaccuracies at smaller scales. Several factors could contribute to the observed deviations:
- -
- Surface model simplification: The powder-blasted surface was modeled as a perfect Lambertian scatterer with 100% diffuse transmission. Although this approach captures the general angular dependence, it does not fully account for the complex, random microstructure of the actual surface.
- -
- Scattering anisotropy: While the surface was modeled as an ideal Lambertian scatterer, real powder-blasted textures may exhibit non-uniform angular distributions. Slight directional biases—e.g., toward forward or backward scattering—can reduce the fraction of light confined by TIR, especially in small waveguides where path length is limited. This may partly explain the higher simulation–experiment discrepancy (23%) observed in the smallest sample.
- -
- Material and environmental variability: Small fluctuations in PMMA properties, solar simulator alignment, and environmental conditions (e.g., slight variations in temperature or air gap) may also affect the experimental outcomes.
- -
- Solar cell efficiency assumptions: The conversion from optical to electrical power assumes a constant 15% cell efficiency, which may not accurately reflect the true behavior under low-flux edge illumination conditions.
Despite these limitations, the results demonstrate that OptisWorks can be a valuable tool for simulating and optimizing non-imaging solar concentrators. With further refinement, particularly through the use of the advanced scattering editor to define wavelength- and angle-dependent surface properties, simulation accuracy could be significantly improved. This editor allows the user to specify up to eleven scattering parameters, offering a more precise description of how light interacts with textured surfaces.
Future work should focus on a detailed experimental characterization of angular scattering as a function of incident angle and wavelength to inform more realistic scattering models. Such improvements will enhance the predictive capabilities of ray-tracing tools and support the design of more efficient surface-engineered concentrators for BIPV applications.
4. Conclusions
This study demonstrates that powder blasting can significantly enhance the optical performance of non-imaging solar concentrators by increasing light scattering and promoting total internal reflection within PMMA substrates. Scattering measurements and photovoltaic characterization confirm that surface roughening leads to increased light redirection toward the concentrator’s edge, resulting in improved solar cell performance.
Among the tested geometries, the medium-sized sample exhibited the highest relative efficiency gain, over an order of magnitude, compared to the unmodified (clear) PMMA reference. These findings indicate that the active area efficiency is strongly size-dependent, with an optimal concentrator size balancing light trapping against propagation losses. Beyond this optimal point, increased optical path lengths result in diminished returns due to light escape and repeated backscattering.
In addition, ray-tracing simulations performed using OptisWorks showed strong agreement with the experimental results, with the best-case deviation limited to 5%. This validates the use of OptisWorks as a reliable tool for modeling light behavior in planar concentrators. However, improved accuracy is expected through enhanced surface modeling, particularly by incorporating more detailed angular and spectral scattering profiles.
Overall, this work highlights the potential of powder-blasted surfaces for efficient, low-cost solar concentration and underscores the importance of combining experimental validation with optical simulation for the development of optimized concentrator designs in building-integrated photovoltaic (BIPV) systems and related applications.
Author Contributions
Conceptualization and Methodology, N.S. and G.K.-O.; Investigation, N.S.; Formal analysis, N.S.; Software, N.S.; Validation, N.S. and G.K.-O.; Writing—original draft, N.S.; Writing—review and editing, N.S. and G.K.-O. All authors have read and agreed to the published version of the manuscript.
Funding
This research received no external funding.
Data Availability Statement
Data available upon request.
Acknowledgments
The authors would like to thank Georgios E. Arnaoutakis for his assistance in configuring the optical measurement set-up and Yves Lacrotte for his support and expertise in the powder-blasting process.
Conflicts of Interest
The authors declare no conflicts of interest.
Abbreviations
The following abbreviations are used in this manuscript:
| PV | Photovoltaics |
| BIPV | Building-integrated photovoltaics |
| PMMA | Poly(methyl methacrylate) |
| CPC | Compound parabolic concentrator |
| LSC | Luminescent solar concentrator |
| PPC | Planar photonic concentrator |
| TIR | Total internal reflection |
| I–V | Current–voltage |
| Isc | Short-circuit current |
| Voc | Open-circuit voltage |
| FF | Fill factor |
| η | Efficiency |
| AM1.5 | Air Mass 1.5 (solar spectrum standard) |
| LCOE | Levelized cost of electricity |
| CAD | Computer-Aided Design |
| UV/VIS/NIR | Ultraviolet–visible–near-infrared |
References
- IRENA. Renewable Power Generation Costs in 2023; International Renewable Energy Agency: Abu Dhabi, United Arab Emirates, 2024; Available online: https://www.irena.org/Publications (accessed on 15 February 2025).
- Skandalos, N.; Kapsalis, V.; Ma, T.; Karamanis, D. Towards 2030 of Eco-Designed Building Integrated Photovoltaics. Solar 2023, 3, 434–457. [Google Scholar] [CrossRef]
- Zhou, Q.; Liu, X.; Liu, Z.; Zhu, Y.; Lu, J.; Chen, Z.; Li, C.; Wang, J.; Xue, Q.; He, F.; et al. Annual research review of perovskite solar cells in 2023. Mater. Futures 2024, 3, 022102. [Google Scholar] [CrossRef]
- Zhang, L.; Li, H.; Zhang, K.; Li, W.; Zuo, C.; Odunmbaku, G.O.; Chen, J.; Chen, C.; Zhang, L.; Li, R.; et al. Major strategies for improving the performance of perovskite solar cells. iEnergy 2023, 2, 172–199. [Google Scholar] [CrossRef]
- Green, M.A.; Dunlop, E.D.; Yoshita, M.; Kopidakis, N.; Bothe, K.; Siefer, G.; Hao, X. Solar cell efficiency tables (version 62). Prog. Photovolt. Res. Appl. 2023, 31, 651–663. [Google Scholar] [CrossRef]
- Skandalos, N.; Wang, M.; Kapsalis, V.; D’Agostino, D.; Parker, D.; Bhuvad, S.S.; Udayraj; Peng, J.; Karamanis, D. Building PV integration according to regional climate conditions: BIPV regional adaptability extending Köppen-Geiger climate classification against urban and climate-related temperature increases. Renew. Sustain. Energy Rev. 2022, 169, 112950. [Google Scholar] [CrossRef]
- Corti, P.; Bonomo, P.; Frontini, F.; Mace, P.; Bosch, E. BIPV Status Report 2020. In Building Integrated Photovoltaics: A Practical Handbook for Solar Buildings’ Stakeholders; SUPSI—Swiss BIPV Competence Centre and Becquerel Institute: Brussels, Belgium, 2020. [Google Scholar]
- Bonomo, P.; Frontini, F.; Loonen, R.; Reinders, A.H.M.E. Comprehensive review and state of play in the use of photovoltaics in buildings. Energy Build. 2024, 323, 114737. [Google Scholar] [CrossRef]
- Sun, Y.; Zhang, Y.; Li, Y. Mapping the Surface Heat of Luminescent Solar Concentrators. Optics 2021, 2, 259–265. [Google Scholar] [CrossRef]
- Madala, S.; Boehm, R.F. A review of nonimaging solar concentrators for stationary and passive tracking applications. Renew. Sustain. Energy Rev. 2017, 71, 309–322. [Google Scholar] [CrossRef]
- Winston, R. Principles of solar concentrators of a novel design. Sol. Energy 1974, 16, 89–95. [Google Scholar] [CrossRef]
- Yablonovitch, E.; Cody, G.D. Intensity enhancement in textured optical sheets for solar cells. IEEE Trans. Electron Devices 1982, 29, 300–305. [Google Scholar] [CrossRef]
- Hodgson, S.D.; Gillett, A.R. Rapid, Chemical-Free Generation of Optically Scattering Structures in Poly(ethylene terephthalate) Using a CO2 Laser for Lightweight and Flexible Photovoltaic Applications. Int. J. Photoenergy 2018, 2018, 1308381. [Google Scholar] [CrossRef]
- Zaidi, S.H.; Ruby, D.S.; Gee, J.M. Characterization of random reactive ion etched-textured silicon solar cells. IEEE Trans. Electron Devices 2001, 48, 1200–1206. [Google Scholar] [CrossRef]
- Meier, M.; Paetzold, U.W.; Ghosh, M.; Zhang, W.; Merdzhanova, T.; Jost, G.; Sommer, N.; Michard, S.; Gordijn, A. Fabrication of Light-Scattering Multiscale Textures by Nanoimprinting for the Application to Thin-Film Silicon Solar Cells. IEEE J. Photovolt. 2014, 4, 772–777. [Google Scholar] [CrossRef]
- Wilson, H.R.; Bueno, B.; Eisenlohr, J.; Kuhn, T.E. Evaluating BIPV Modules with Respect to Textural Appearance, Glare, Colour and Electricity Yield. In Symposium Photovoltaische Solarenergie (PV) 2021. 2021. Available online: https://publica-rest.fraunhofer.de/server/api/core/bitstreams/c03aee12-2c77-48ca-8e7d-405cec5fe492/content (accessed on 9 April 2025).
- Mallick, T.K.; Eames, P.C. Electrical performance evaluation of low-concentrating non-imaging photovoltaic concentrator. Prog. Photovolt. Res. Appl. 2008, 16, 389–398. [Google Scholar] [CrossRef]
- Currie, M.J.; Mapel, J.K.; Heidel, T.D.; Goffri, S.; Baldo, M.A. High-efficiency organic solar concentrators for photovoltaics. Science 2008, 321, 226–228. [Google Scholar] [CrossRef]
- Kocher-Oberlehner, G.; Bardosova, M.; Pemble, M.; Richards, B.S. Planar photonic solar concentrators for building-integrated photovoltaics. Sol. Energy Mater. Sol. Cells 2012, 104, 53–57. [Google Scholar] [CrossRef]
- Hadavinia, H.; Singh, H. Modelling and experimental analysis of low concentrating solar panels for use in building integrated and applied photovoltaic (BIPV/BAPV) systems. Renew. Energy 2019, 139, 815–829. [Google Scholar] [CrossRef]
- Goetzberger, A.; Wittwer, V. Fluorescent planar collector-concentrators for solar energy conversion. In Festkörperprobleme 19: Plenary Lectures of the Divisions “Semiconductor Physics” “Metal Physics” “Low Temperature Physics” “Thermodynamics and Statistical Physics” “Thin Films” “Surface Physics” “Surface Physics” “Magnetism” of the German Physical Society (DPG) Freudenstadt, March 21–25, 1983; Treusch, J., Ed.; Springer: Berlin/Heidelberg, Germany, 1979; pp. 427–451. [Google Scholar]
- Shurcliff, W.; Jones, R.C. The trapping of fluorescent light produced within objects of high geometrical symmetry. J. Opt. Soc. Am. 1949, 39, 912–916. [Google Scholar] [CrossRef]
- Batchelder, J.; Zewai, A.; Cole, T. Luminescent solar concentrators. 1: Theory of operation and techniques for performance evaluation. Appl. Opt. 1979, 18, 3090–3110. [Google Scholar] [CrossRef]
- Debije, M.G.; Verbunt, P.P. Thirty years of luminescent solar concentrator research: Solar energy for the built environment. Adv. Energy Mater. 2012, 2, 12–35. [Google Scholar] [CrossRef]
- Meinardi, F.; Colombo, A.; Velizhanin, K.A.; Simonutti, R.; Lorenzon, M.; Beverina, L.; Viswanatha, R.; Klimov, V.I.; Brovelli, S. Large-area luminescent solar concentrators based on ‘Stokes-shift-engineered’ nanocrystals in a mass-polymerized PMMA matrix. Nat. Photonics 2014, 8, 392–399. [Google Scholar] [CrossRef]
- Delgado-Sanchez, J.-M. Luminescent solar concentrators: Photo-stability analysis and long-term perspectives. Sol. Energy Mater. Sol. Cells 2019, 202, 110134. [Google Scholar] [CrossRef]
- Yadav, A.; Pillai, S.R. Effect of Texture Thickness and Angles on Performance Output of a Solar Cell. Eng. Proc. 2024, 61, 43. [Google Scholar] [CrossRef]
- Polché, M.; Miguel, B.F.J.; González, C.A.G.; Contreras, G.G.; Arellano, V.H.R. Study of the Scattering Effect by SiO(2) Nanoparticles, in a Luminescent Solar Concentrator Sensitized with Carbon Dots. Nanomaterials 2023, 13, 2480. [Google Scholar] [CrossRef]
- Chen, B.-M.; Fu, H.-Y.; Ying, S.-P.; Hsu, T.-W. Performance of Luminescent Solar Concentrators Integrated with Negative Replica Layers of Leaf Surface Microstructures. Materials 2022, 15, 2353. [Google Scholar] [CrossRef]
- Li, K.; Wu, R.; Ruan, Y.; Zhang, L.; Zhen, H. Numerical analysis of the angular insensitive photovoltaic light harvesting with the biomimetic scattering film inspired by the rose petal epidermal topography. Sol. Energy 2018, 170, 800–806. [Google Scholar] [CrossRef]
- Song, H.; Huang, L.; Li, F.; Zhao, S.; Liu, Y.; Liu, Y.; Zhai, R.; Dong, Y.; Feng, Z.; Liu, H. Design of random microlens arrays with large scattering angles. Opt. Laser Technol. 2025, 182, 112176. [Google Scholar] [CrossRef]
- Chu, W.-P.; Lin, J.-S.; Lin, T.-C.; Tsai, Y.-S.; Kuo, C.-W.; Chung, M.-H.; Hsieh, T.-E.; Liu, L.-C.; Juang, F.-S.; Chen, N.-P. Using high haze (>90%) light-trapping film to enhance the efficiency of a-Si:H solar cells. Opt. Commun. 2012, 285, 3325–3328. [Google Scholar] [CrossRef]
- Kato, K.; Sugawara, H.; Taniguchi, J. Large-Scale Moth-Eye-Structured Roll Mold Fabrication Using Sputtered Glassy Carbon Layer and Transferred Moth-Eye Film Characterization. Nanomaterials 2023, 13, 1591. [Google Scholar] [CrossRef]
- Jost, N.; Jacobo-Martín, A.; Vallerotto, G.; Hernández, J.J.; Garcia-Sanchez, A.; Domínguez, C.; Rodríguez, I.; Antón, I. Fabrication of high-performance lens arrays for micro-concentrator photovoltaics using ultraviolet imprinting. Int. J. Adv. Manuf. Technol. 2024, 131, 5961–5970. [Google Scholar] [CrossRef]
- Wensink, H.; Schlautmann, S.; Goedbloed, M.H.; El Wenspoek, M.C. Fine Tuning the Surface Roughness of Powder Blasted Glass Surfaces. In Sensor Technology 2001; Elwenspoek, M., Ed.; Springer: Dordrecht, The Netherlands, 2001; pp. 101–106. [Google Scholar]
- Min, C.H.; Kang, Y.S.; Kim, T.S. Modeling and Recipe Optimization of Anti-Glare Process Using Sandblasting for Electronic Display Glass. Electronics 2020, 9, 2048. [Google Scholar] [CrossRef]
- Daabo, A.M.; Bellos, E.; Pavlovic, S.; Bashir, M.A.; Mahmoud, S.; Al-Dadah, R.K. Characterization of a micro thermal cavity receiver—Experimental and analytical investigation. Therm. Sci. Eng. Prog. 2020, 18, 100554. [Google Scholar] [CrossRef]
- Pavlovic, S.; Daabo, A.M.; Bellos, E.; Stefanovic, V.; Mahmoud, S.; Al-Dadah, R.K. Experimental and numerical investigation on the optical and thermal performance of solar parabolic dish and corrugated spiral cavity receiver. J. Clean. Prod. 2017, 150, 75–92. [Google Scholar] [CrossRef]
- Kerrouche, A.; Hardy, D.A.; Ross, D.; Richards, B.S. Luminescent solar concentrators: From experimental validation of 3D ray-tracing simulations to coloured stained-glass windows for BIPV. Sol. Energy Mater. Sol. Cells 2014, 122, 99–106. [Google Scholar] [CrossRef]
- Sarmah, N.; Richards, B.S.; Mallick, T.K. Evaluation and optimization of the optical performance of low-concentrating dielectric compound parabolic concentrator using ray-tracing methods. Appl. Opt. 2011, 50, 3303–3310. [Google Scholar] [CrossRef]
- Lacrotte, Y. Novel Patterning Technology for the LTCC Based Packaging of an Optical Encoder, Microsystems Engineering Centre; School of Engineering & Physical Sciences, Heriot-Watt University: Edinburgh, UK, 2013. [Google Scholar]
- Powell, R.C.; Gray, A.K.; Coleman, T.A. Material Supply System and Method. U.S. Patent US20110211920A1, 1 September 2011. Available online: https://patents.google.com/patent/US20110211920A1/en (accessed on 9 April 2025).
- Lacrotte, Y.; Carr, J.P.; Kay, R.W.; Desmulliez, M.P. Fabrication of a low temperature co-fired ceramic package using powder blasting technology. Microsyst. Technol. 2013, 19, 791–799. [Google Scholar] [CrossRef]
- Ticconi, F.; Pulvirenti, L.; Pierdicca, N.; Zhurbenko, V. Models for scattering from rough surfaces. Electromagn. Waves 2011, 10, 203–226. [Google Scholar]
- Meinardi, F.; Ehrenberg, S.; Dhamo, L.; Carulli, F.; Mauri, M.; Bruni, F.; Simonutti, R.; Kortshagen, U.; Brovelli, S. Highly efficient luminescent solar concentrators based on earth-abundant indirect-bandgap silicon quantum dots. Nat. Photonics 2017, 11, 177–185. [Google Scholar] [CrossRef]
- Cao, M.; Zhao, X.; Gong, X. Achieving High-Efficiency Large-Area Luminescent Solar Concentrators. JACS Au 2023, 3, 25–35. [Google Scholar] [CrossRef]
- Wenham, S.R.; Green, M.A.; Watt, M.E.; Corkish, R.; Sproul, A. Applied Photovoltaics; Routledge: London, UK, 2013. [Google Scholar]

Disclaimer/Publisher’s Note: The statements, opinions and data contained in all publications are solely those of the individual author(s) and contributor(s) and not of MDPI and/or the editor(s). MDPI and/or the editor(s) disclaim responsibility for any injury to people or property resulting from any ideas, methods, instructions or products referred to in the content. |
© 2025 by the authors. Licensee MDPI, Basel, Switzerland. This article is an open access article distributed under the terms and conditions of the Creative Commons Attribution (CC BY) license (https://creativecommons.org/licenses/by/4.0/).