Article

Optimized E-Mobility and Portable Storage Integration in an Isolated Rural Solar Microgrid in Uganda

by
Josephine Nakato Kakande
1,2,*,
Godiana Hagile Philipo
1,3 and
Stefan Krauter
1
1
Electrical Energy Technology—Sustainable Energy Concepts (EET-NEK), Faculty of Computer Science, Electrical Engineering and Mathematics, Paderborn University, Pohlweg 55, 33098 Paderborn, Germany
2
Department of Electrical and Computer Engineering, Makerere University, Kampala P.O. Box 7062, Uganda
3
Department of Material, Energy, Water and Environmental Sciences, The Nelson Mandela African Institution of Science and Technology, Arusha P.O. Box 447, Tanzania
*
Author to whom correspondence should be addressed.
Solar 2024, 4(4), 694-727; https://doi.org/10.3390/solar4040033
Submission received: 19 September 2024 / Revised: 26 November 2024 / Accepted: 28 November 2024 / Published: 5 December 2024

Abstract

:
This work analyses load profiles for East African microgrids, and then investigates the integration of electric two-wheelers and portable storage into a solar PV with battery microgrid in Uganda, East Africa. By introducing e-mobility and portable storage, demand side management strategic load growth can thus be achieved and electricity access can be expanded. Battery degradation is also considered. The results showed a 98.5% reduction in PV energy curtailment and a 57% reduction in the levelized cost of energy (LCOE) from 0.808 USD/kWh to 0.350 USD/kWh when the electric two-wheeler and portable storage loads were introduced. Such reductions are important enablers of financial viability and sustainability of microgrids. It is possible to avoid emissions of up to 73.27 tons of CO2/year with the proposed e-bikes, and an average of 160 customers could be served annually as off-microgrid consumers without requiring an investment in additional distribution infrastructure. Annual revenue could be increased by 135% by incorporating the additional loads. Sensitivity analyses were conducted by varying component costs, the battery lifetime, the interest rate, and the priority weighting of the additional loads. The battery costs were found to be a major contributor to lifecycle costs (LCC) and also have a big impact on the LCOE. The interest rate significantly affects the LCC as well.

1. Introduction

600 million people in Sub-Saharan Africa (SSA) lack electricity access, which equates to about three-quarters of the unelectrified population worldwide. It has been projected that by 2030, 685 million people will be unelectrified worldwide [1]. Microgrids are gaining prominence as a suitable option for electricity access in unserved and underserved communities. They, along with solar home systems, were identified by the International Energy Agency (IEA) as the best method of bridging the energy gap for 55% of Africa’s mostly rural unelectrified population by 2030 [2]. Microgrids are also popular in more developed economies due to their resilience, cost reduction, and emissions-lowering benefits. Therefore, they are an important contributor to the achievement of the Sustainable Development Goal 7 (SDG7) targets.
Renewable-based systems using solar technology have maximum production during the day, and thus, increasing daytime demand would ensure optimal use of the solar generation resources and help lower reliance on battery storage or gensets during evening peak periods.
Electric mobility is gaining prominence due to the global focus on renewable energy uptake, emissions and pollution reduction, and the diminishing costs of battery storage. Both developed and developing countries are increasingly promoting sustainable e-mobility and clean transportation solutions. In East Africa, Rwanda has made significant strides in the e-mobility space, and the Ugandan, Kenyan, and Tanzanian governments in 2023 added policy provisions, such as tax incentives and VAT exemptions, to support the e-mobility sector [3]. Uganda also has an e-bus manufacturing company [4]. The Global North, particularly China, Europe, and the USA have registered significant strides in the electrification of transport due to factors such as incentives, favourable national policies, energy security considerations, and increases in oil costs due to geopolitical and market forces [5,6]. However, in emerging and developing economies, e-mobility is still in its nascent stages, with electric vehicles comprising under 1% of car sales in 2023 in Eurasia, the Middle East, and Africa [7]. Challenges to the widespread adoption of e-mobility in emerging and developing economies include distance limitations, lack of charging infrastructure, weak grids, relatively high upfront costs, limited battery life, lengthy charging times compared to petrol/diesel top-up, and limited maximum speeds [5,8].
The majority of rural inhabitants in Africa, exceeding 650 million people, predominantly utilise walking, cycling, or public transportation that is typically in the form of imported two- and three-wheeler vehicles [9]. Two- and three-wheelers are also major sources of employment in the East African region [10,11]. Thus, electric two- and three-wheelers (E2&3Ws) present a relatively low-hanging entry point for emerging and developing economies in Africa to electrify transport. Africa has about 20% of the registered motorcycles worldwide, but only 0.2% of them are electric [8]. The proportions of two- and three-wheelers in the national fleet(s) of some African countries are 70% in Uganda, 53% in Rwanda [8], 37% in Kenya, 34% in Tanzania, and 23% in Ghana [12].
Several companies are introducing e-mobility on the continent and in the East African region, but the limited availability of charging infrastructure is a big challenge, so they largely remain restricted to urban areas.
The microgrid distribution network is often confined to about a 1 km radius [13] and, thus, even when there is surplus electricity production, unconnected households, businesses or institutions in the area that desire an electric connection, and potential customers outside that radius, are unable to access the microgrid electricity services.
On the other hand, there are companies that provide portable batteries in addition to swappable batteries for their e-motorbikes but are challenged by the cost of setting up off-grid charging infrastructure which is usually solar-based. There is thus an untapped opportunity for microgrids to supply charging stations and unconnected potential customers using what would otherwise be curtailed PV energy.
Demand side management (DSM) aims to align electricity supply with demand to avoid problems such as system overloading, over discharge of battery storage, brown-outs, unplanned outages, and reduced equipment lifetime. The common DSM approaches [14,15,16,17,18,19,20] are load shifting, peak shaving, strategic load conservation, valley filling, flexible load shape, which enables customers to modify their consumption patterns by purchasing power at reduced reliability or quality of service levels, and strategic load growth.
The curtailment of renewable energy production and demand response through load shifting and load shedding have been critiqued for lowering economic viability and system reliability [21] and impacting user comfort [22,23]. In contrast to valley filling which has as its main goal increasing energy consumption during off-peak periods without increasing the maximum power, strategic load growth aims at raising energy consumption and peak demand over a given extended period, such as a year or season.
Rural microgrids are typically characterised by low daytime consumption and a poor load factor, which is the average to peak demand ratio, resulting in a high levelized cost of energy and sustainability challenges due to insufficient income generation for financial viability [18].
To overcome the microgrid sustainability, electricity access, and e-mobility rollout challenges highlighted above, this work proposes strategic load growth as a DSM strategy for rural East African microgrids through integrating electric mobility and portable storage loads and limiting PV energy curtailment. Strategic load growth aims to increase not only valley demand but also peak demand for lengthy periods. It is the method best suited for our approach, as our focus is on driving up demand by supplying e-mobility loads and portable batteries using the excess PV power. The proposed approach can be applied in other countries and regions around the world, particularly in countries with many two- and three-wheelers.
The general outline of the paper is as follows. Data from operational microgrids in Uganda and Tanzania is analysed to provide insights into rural microgrid energy consumption and load profiles in the East African context. An overview of electric mobility and the two- and three-wheeler sector is presented next. Then, modelling and simulation of a microgrid in Uganda with e-mobility and portable storage including consideration of the findings from the microgrids’ load profile analysis is described. Finally, the results are discussed, and some recommendations are given.

2. Background

2.1. Microgrid Load Profiles

In [24], machine learning is used for the prediction and classification of microgrid consumers. Demographic data, such as income, energy sources, and desired appliances are used to predict average consumption, load profiles, and demand growth for prospective customers, while behavioural data like hourly consumption, meter top-up frequency and top-up amounts of existing customers generates economic viability insights.
The authors of [25] analyse the load profiles of eleven microgrids that were installed from 2014 and 2016 in East Africa, with seven of the microgrids situated in Kenya and the other four situated in Tanzania. They provide day-to-day variability and timestep variability factors that could be used in software packages for simulating energy systems, such as HOMER (Hybrid Optimization of Multiple Energy Resources).
Using k-means clustering and smart meter data, customers of microgrids in Tanzania were classified on the basis of normalised average daily load profiles, as well as daily energy consumption [26]. By classifying customers according to their load profile and average daily consumption, their consumption in terms of both quantity and patterns are assessed. Insights are presented about the distribution of consumer categories across different consumption levels and load profiles for the case under study, which highlight that for businesses, the type of business does not determine the level of consumption or type of profile, and thus, demand management approaches should not be based only on consumer category. Using k-means clustering, Tanzania microgrid customers were grouped based on daily electricity consumption into low (<140 Wh), medium (140–450 Wh), and high (>450 Wh) segments. Five distinct load profile clusters were identified, with commercial customers exhibiting high daytime usage and households large evening peaks with relatively low overall consumption. K-means clustering was used to develop a random forest model for load profile prediction based on energy usage patterns and demographics of Tanzanian microgrid customers [27]. For Mpale microgrid in Tanzania, an evening peak in consumption and a higher weekend consumption were observed [28].
For this work, we analysed the load profiles for microgrid customers in Uganda as well as the load profile for a Tanzania microgrid to determine general consumption characteristics.

2.1.1. Load Profiles of Ugandan Microgrid Customers

Winch Energy (WE) Limited is an off-grid developer of renewable energy solutions, as well as a designer of and integrator of technology. They use containerised remote power units (RPUs) to provide clean energy to off-grid communities in Uganda and Sierra Leone. Winch Energy Uganda/NOA Uganda is the biggest microgrid developer in Uganda, with Senyondo and Buzaami–Bugoma microgrids operational at Bunjako on the shores of Lake Victoria, and another 25 microgrids installed in Lamwo district, Northern Uganda [29].
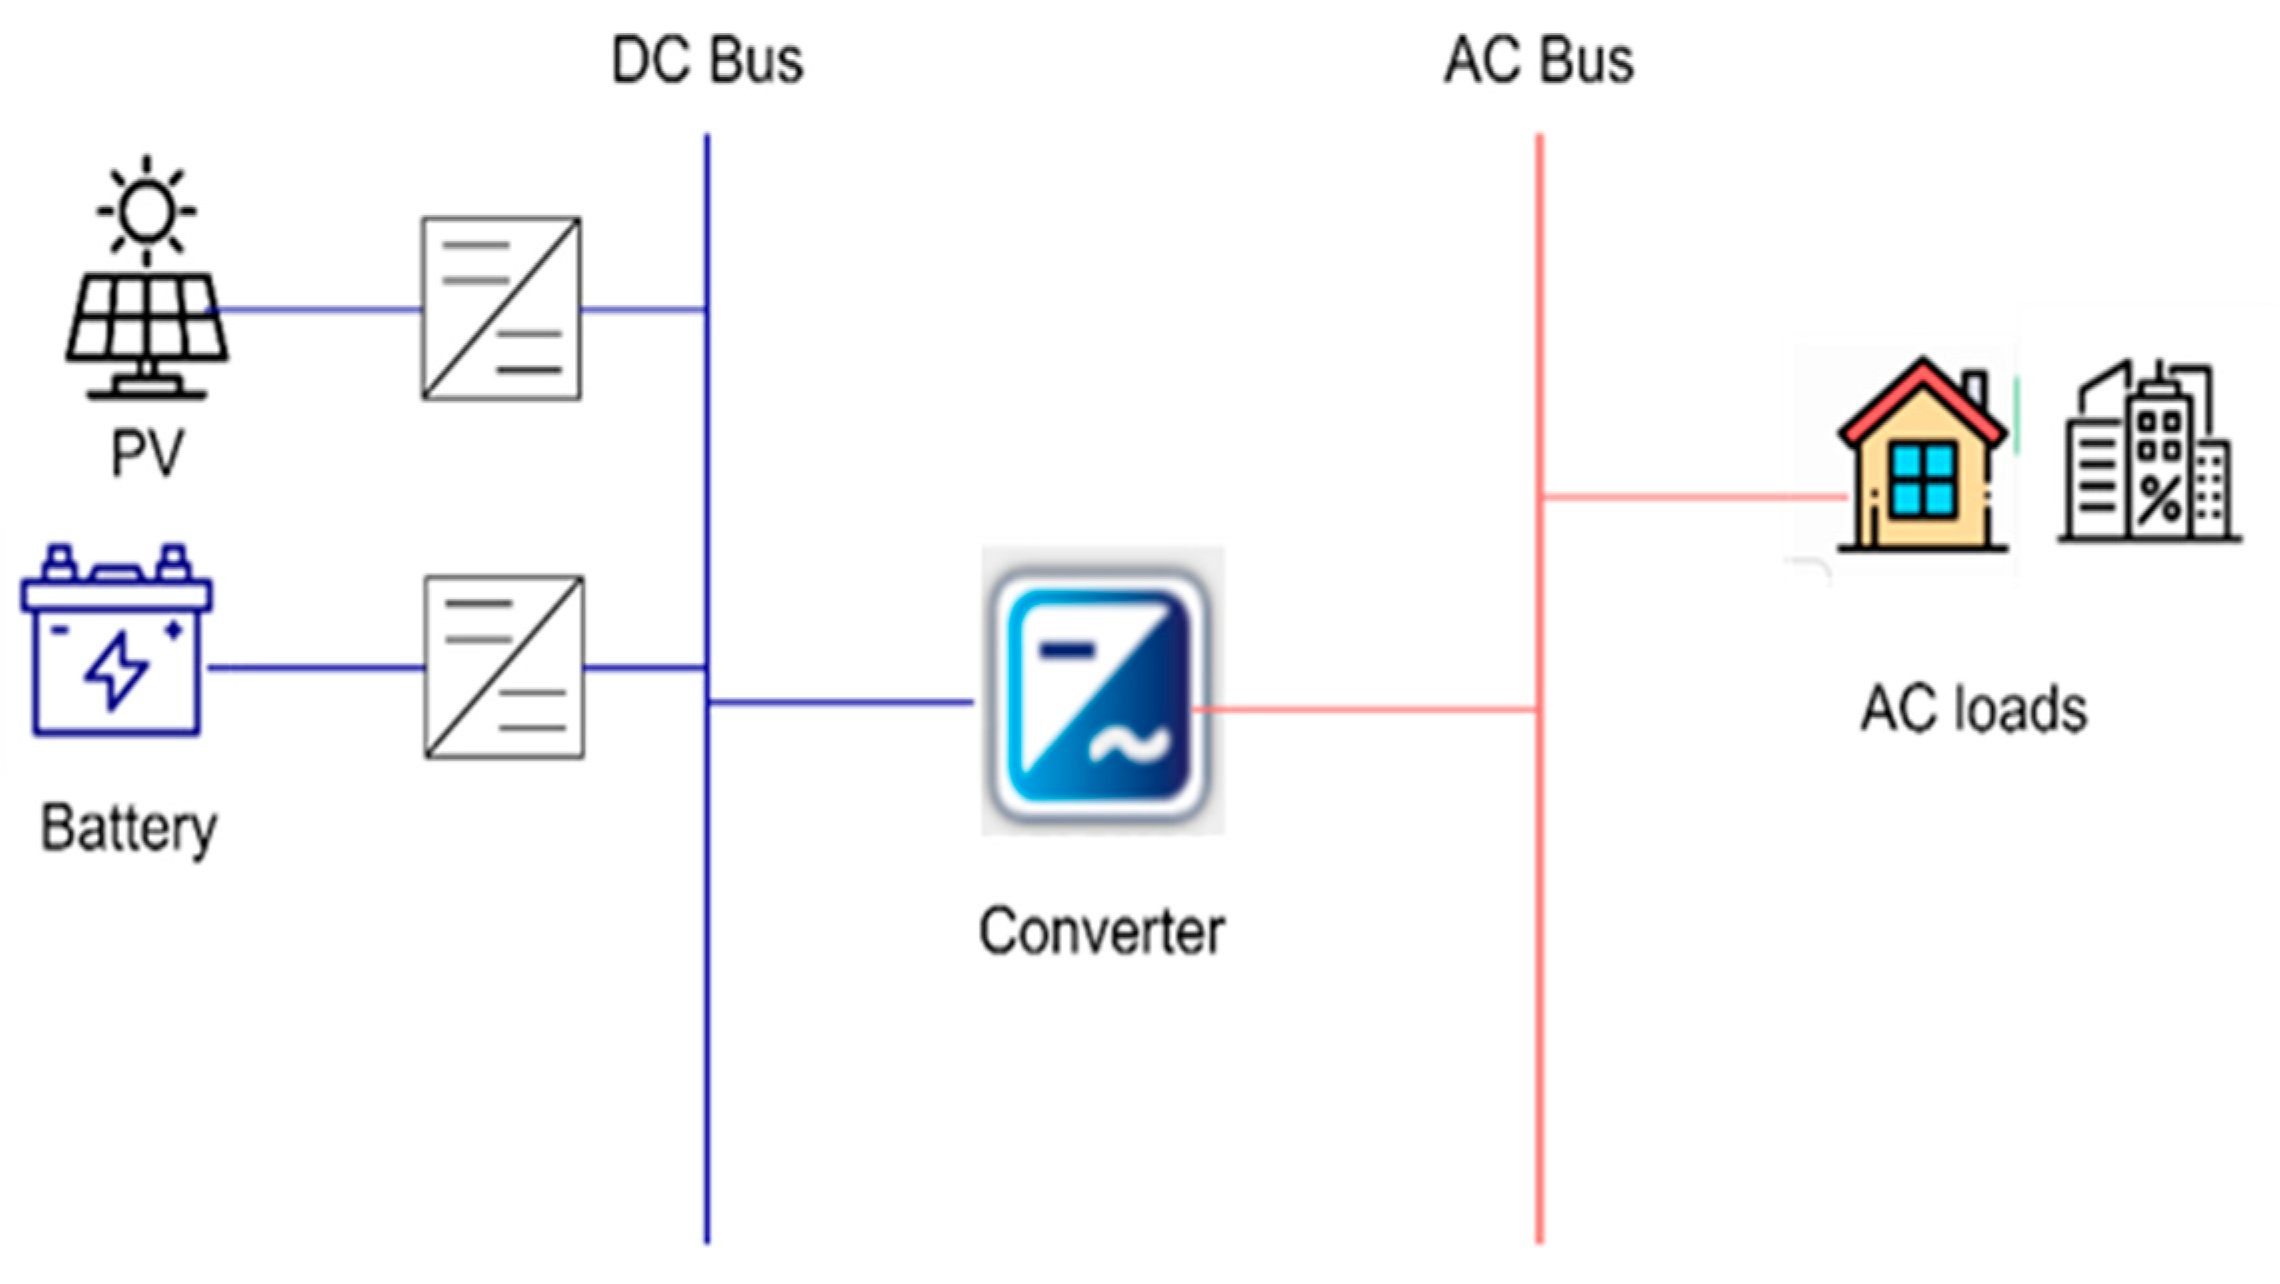
For our work the power consumption of customers from eight rural microgrids operated by Winch Energy in Uganda was analysed. The microgrids are located in Central Uganda and Lamwo district, Northern Uganda. The microgrids have 100% green energy supply and consist of solar PV systems with battery storage, as depicted in Figure 1.
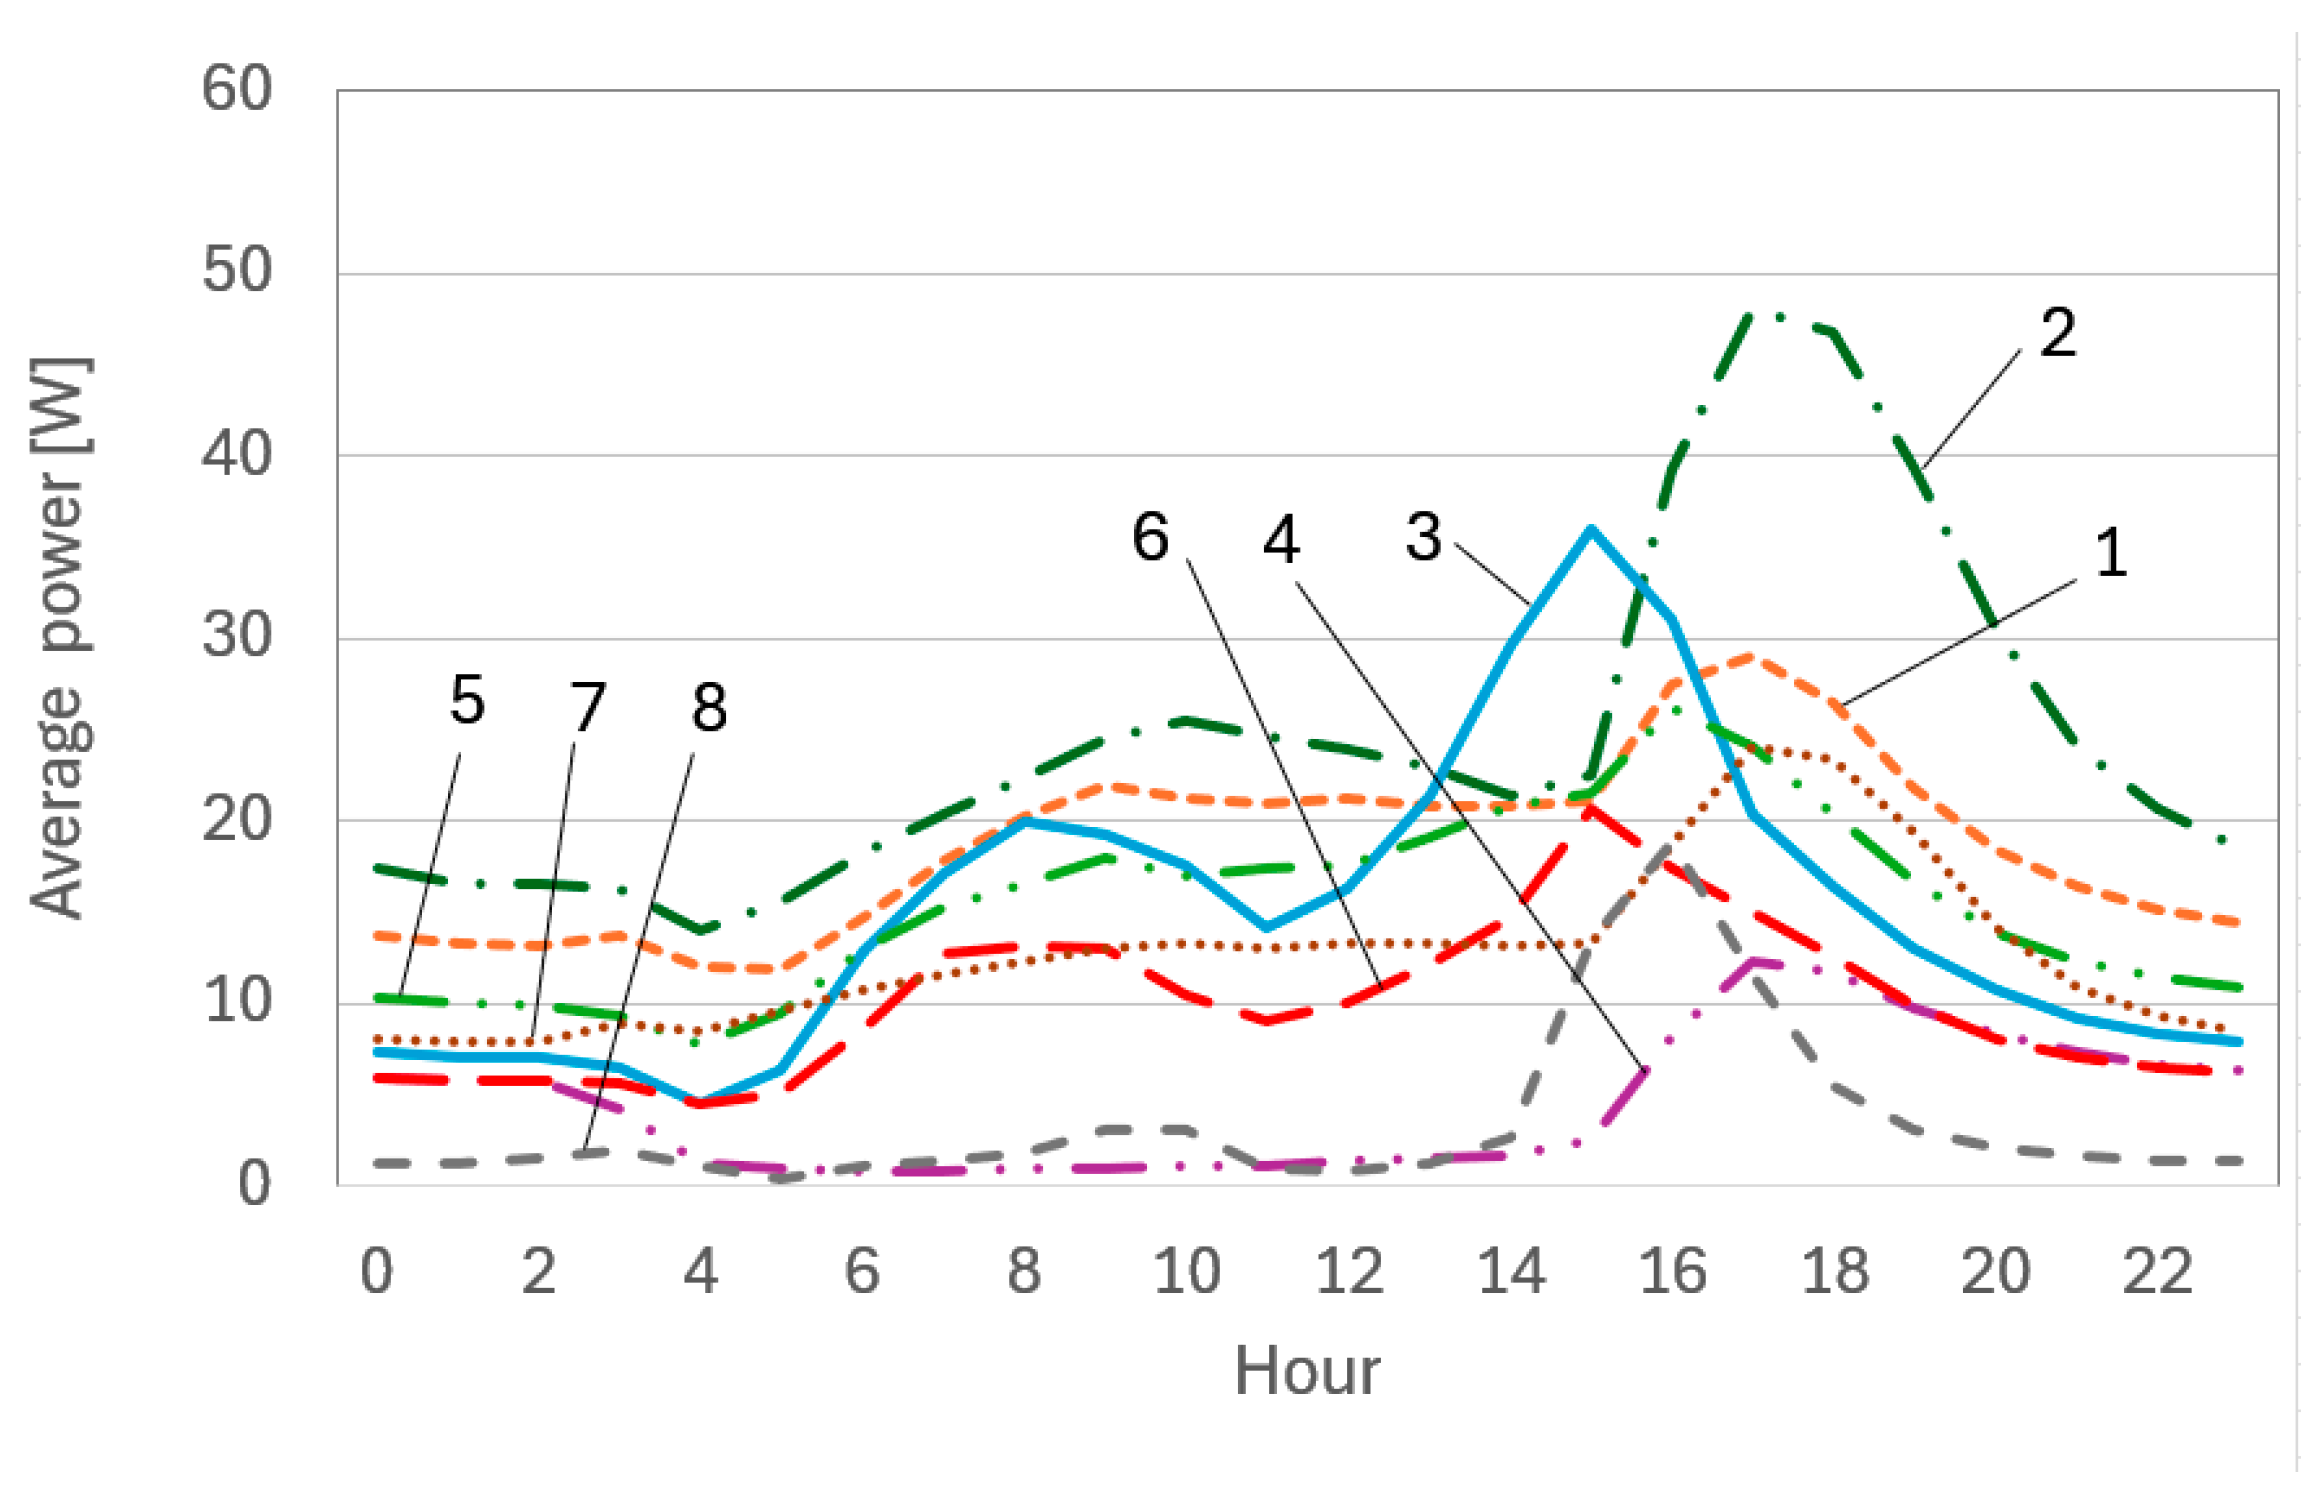
The microgrids started operations in different months of 2022. Using the smart meter data of the customers, the average customer load profile per microgrid for 866 consumers from the eight microgrids were as shown in Figure 2. Most of them display the evening peak that characterises residential consumers and during the day there is generally low consumption, indicating that there is untapped potential to elevate the daytime demand and improve the load factor. We do not differentiate between residential and commercial customers, as the aim was to obtain the average microgrid customer consumption irrespective of category.
The average daily energy consumption of the 866 customers from the eight microgrids was 312 Wh. This value is used in the microgrid analysis described hereafter.

2.1.2. Silale Microgrid in Tanzania

Silale microgrid is located in Korogwe district, Tanzania. This off-grid microgrid with solar PV and battery storage was installed around 2015, and from around 2019, its operation was taken over by the local community.
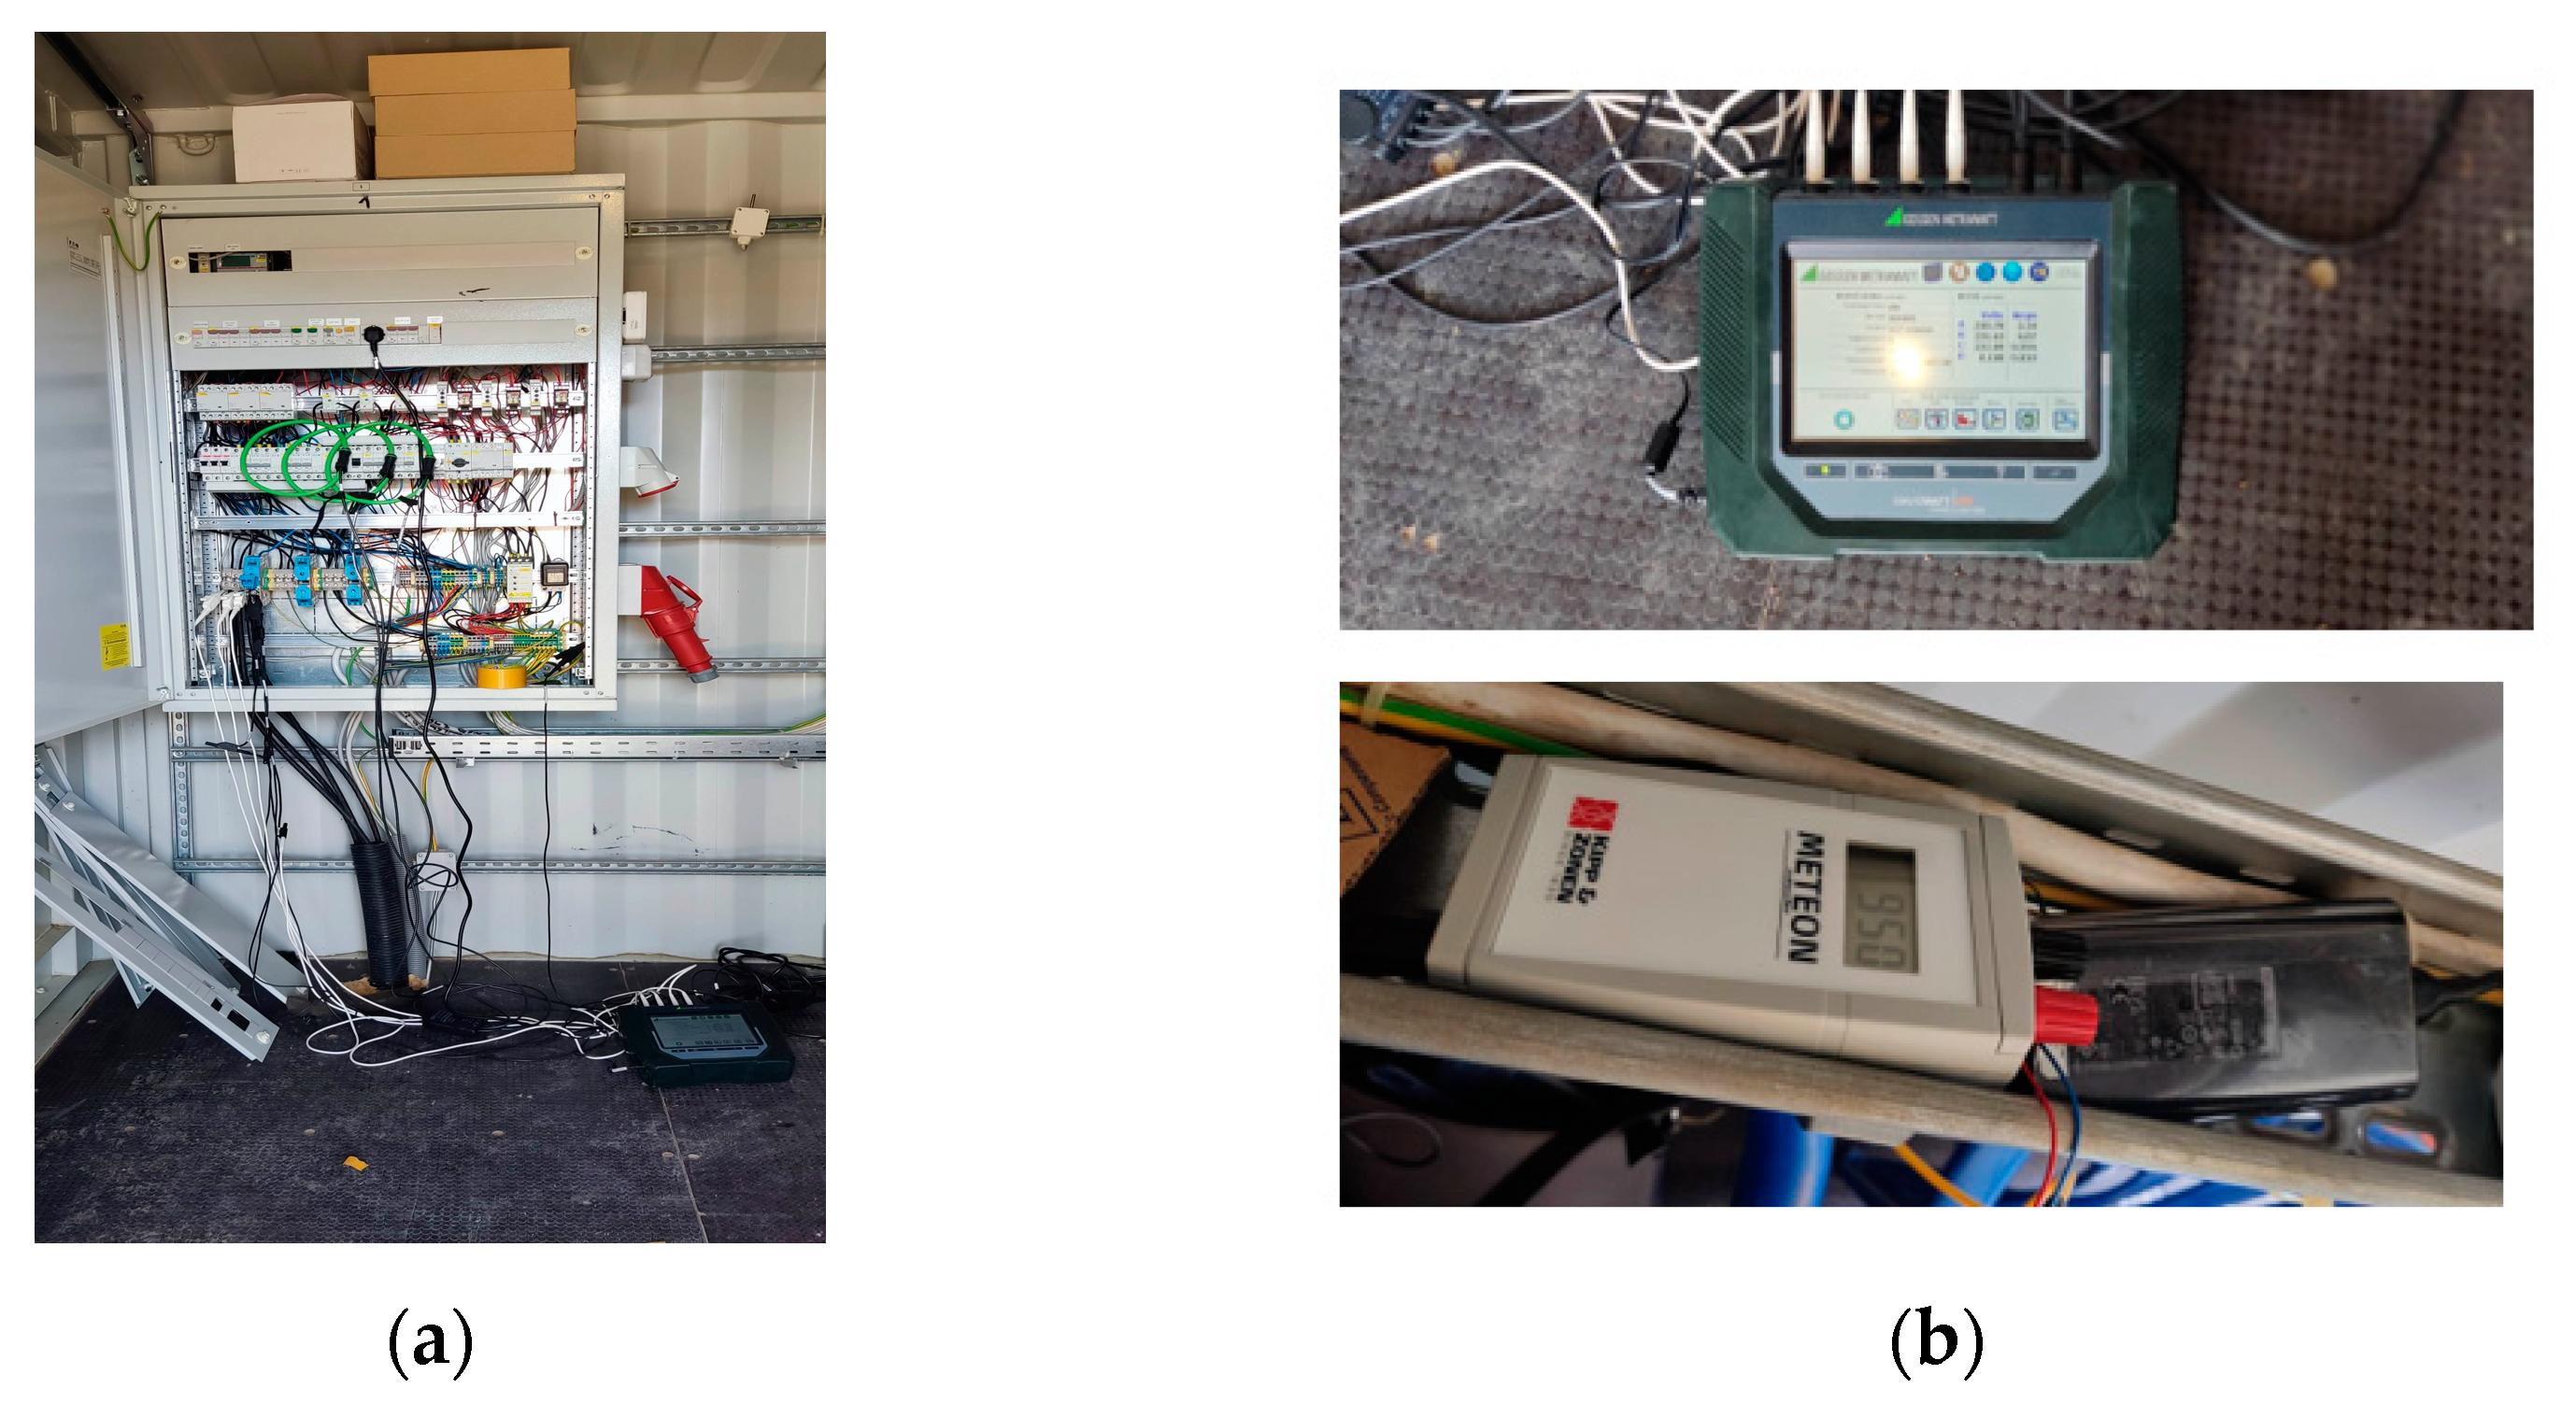
The site was installed with 55 Solarwatt panels rated at 250 Wp each, and a 48 V storage system comprising 24 Hoppecke 10 OPzV 2V 1236 Ah batteries. However, by the time of the field visit in 2022, two of the batteries were faulty and had been disconnected from the battery storage system and several solar panels were damaged or degraded. Other equipment includes one SMA Sunny Tripower STP 15000 TL-10 solar inverter, three SMA Sunny Island SI 6.0H battery inverters and one Sunny WebBox data logger meant for logging the PV system data. Some of the microgrid equipment are shown in Figure 3.
At installation, the phase line allocation was completed according to the following categories:
  • Line 1 (Phase A): Organisations—school and church
  • Line 2 (Phase B): Businesses—shops, restaurants, salons and bars
  • Line 3 (Phase C): Households
The grid was eventually extended to the village and residents could opt for a minigrid connection or grid connection or both.
A Gossen Metrawatt Mavowatt 240 power analyzer was used to take power measurements over the period 15–29 December 2022 (see Figure 4). An SP Lite2 irradiance meter was used for irradiance measurements.
During that period there were several nighttime outages as well as several prolonged power outage periods. Some phases experienced prolonged outages while others remained on, e.g. from 25 to 27 December 2022, Phase 2 was off while Phases 1 and 3 were on. As this phase was supposed to be connected to businesses, this was problematic as it was the phase with the highest revenue generation potential. Over the measurement period, the peak total power consumption was about 2 kW, as shown in Table 1.
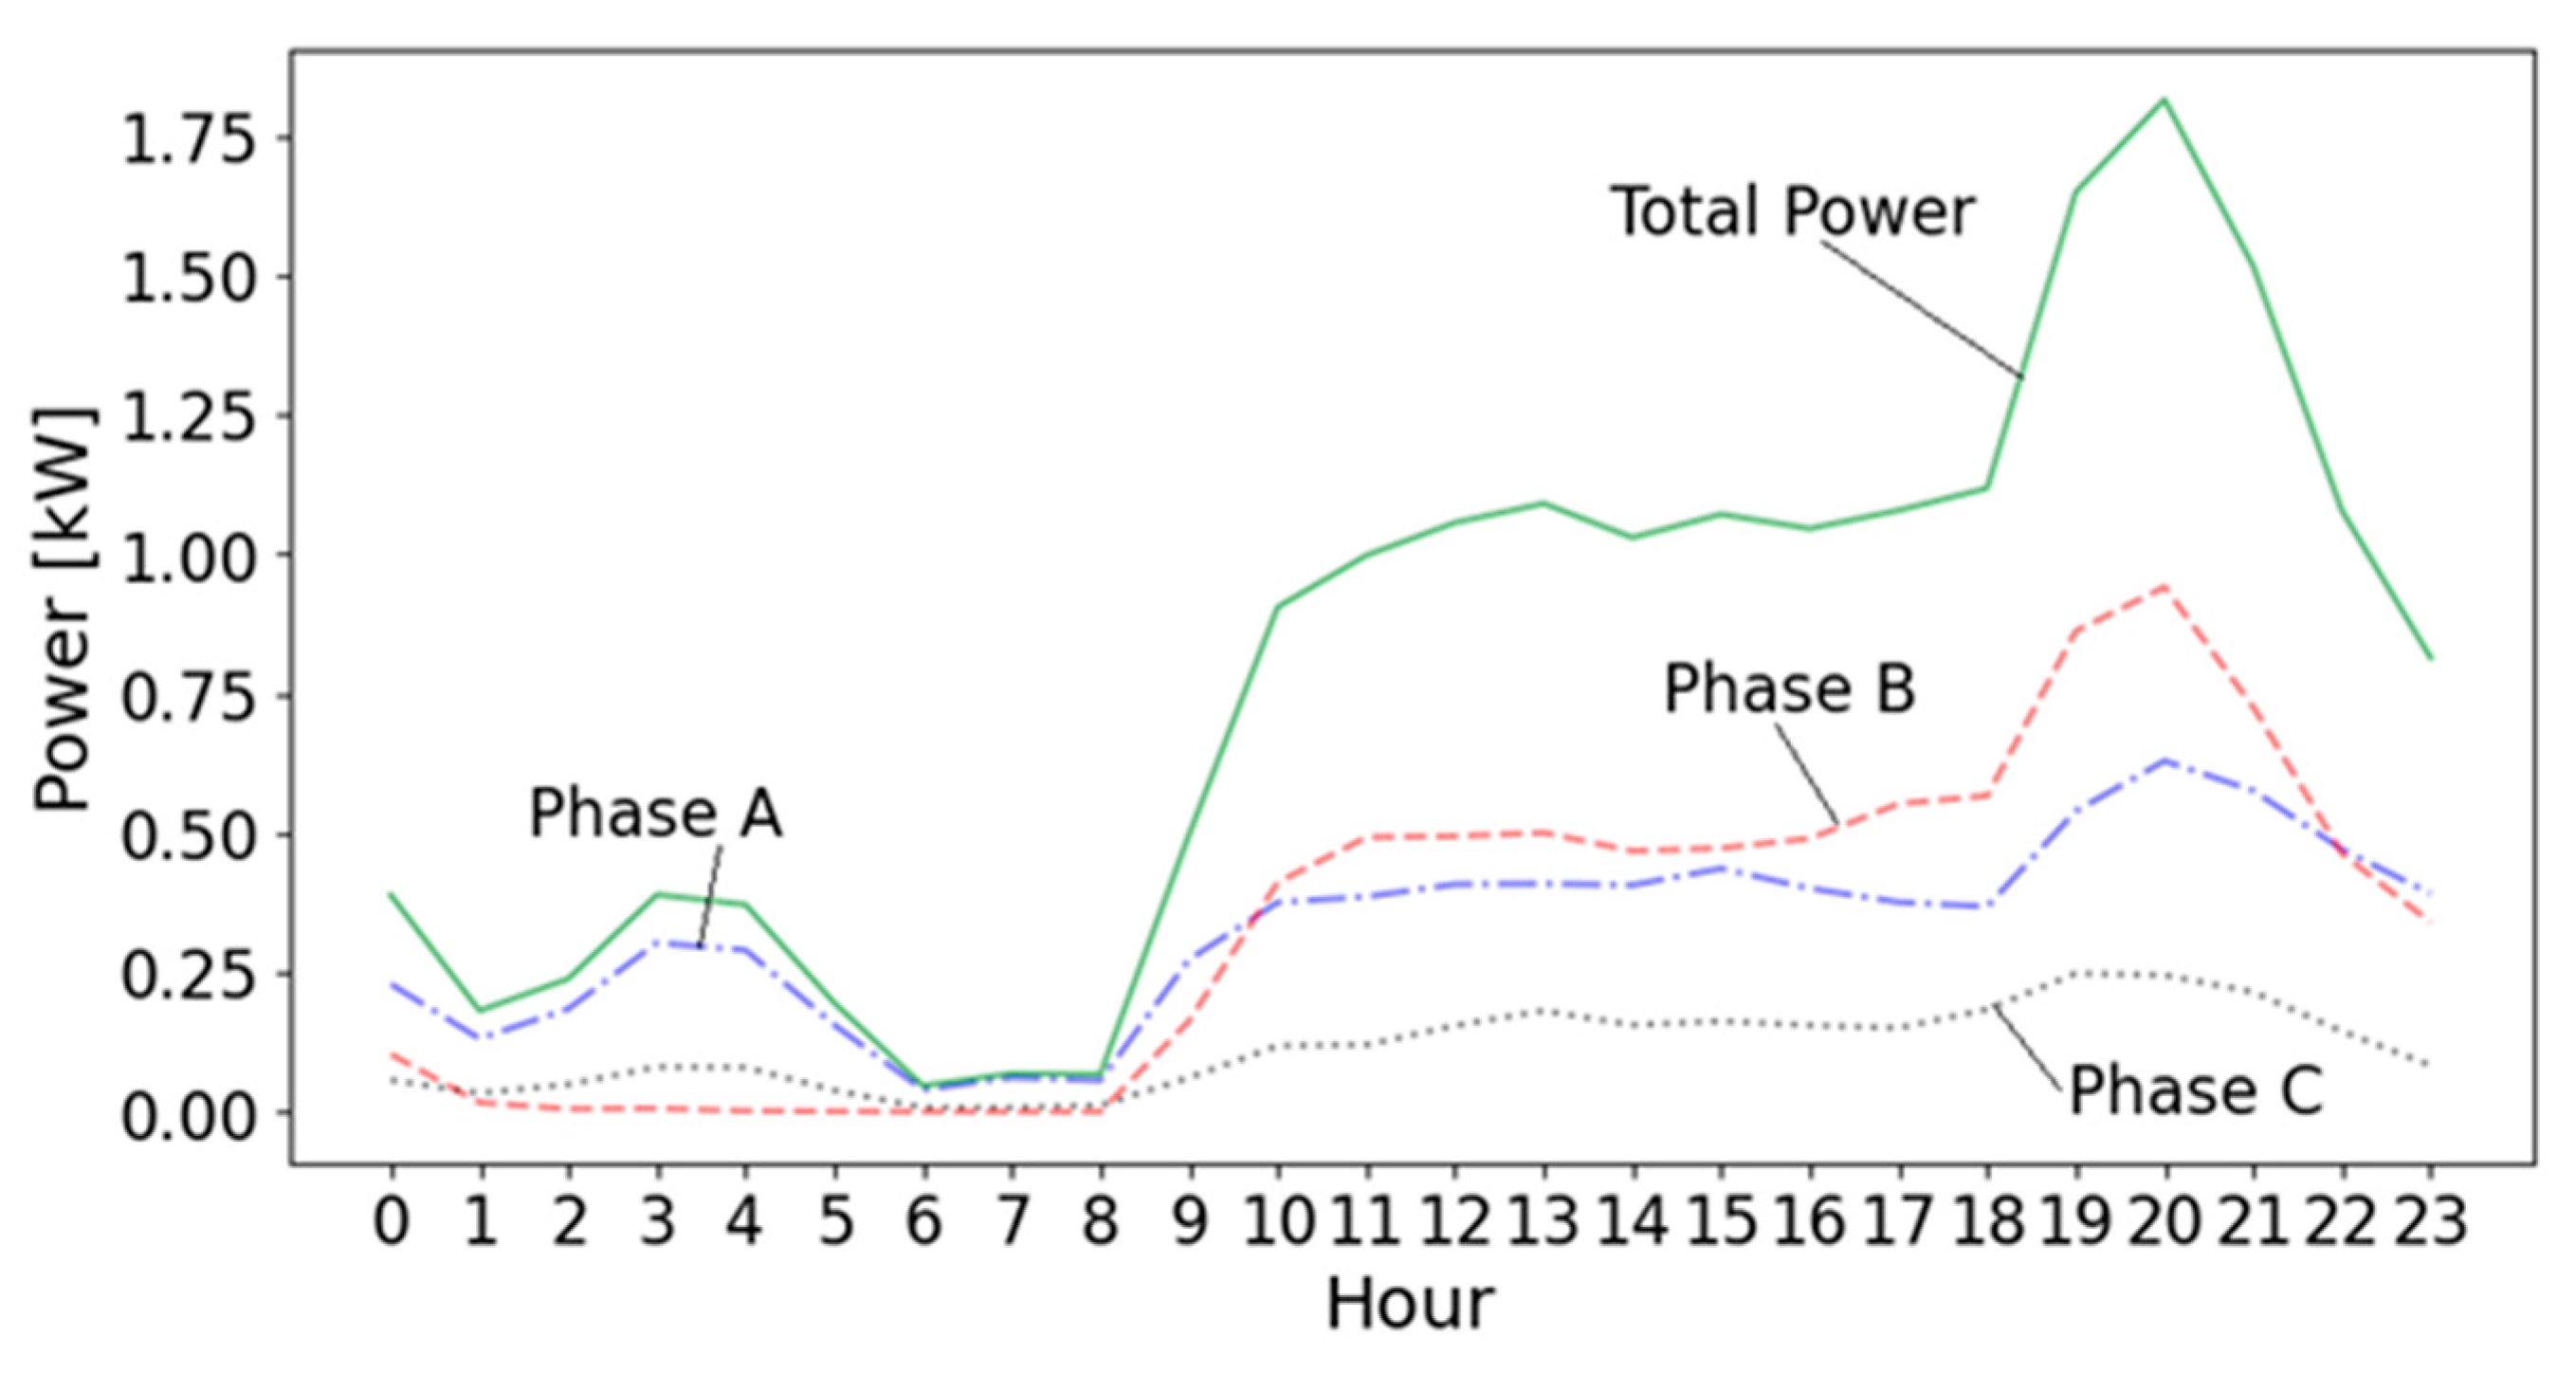
In general, Phase B (businesses) had the highest power consumption. Phase C (households) had the lowest average consumption followed by Phase A (organisations), as shown in Figure 5. The average total microgrid consumption was generally low between midnight and 8 a.m. and then rose till about 10 a.m., after which it remained fairly constant at about 1 kW until 7 p.m. when the characteristic evening load ramp up occurred to an average peak of 1.75 kW at 9 p.m. due to residential energy demand, followed by a drop in demand.
It was found that total power consumption is significantly less than the system power rating. Thus, there is an untapped opportunity to increase daytime consumption and improve the microgrid’s load factor by lowering its peak to average ratio. Also observable is the significant daytime consumption which indicates that there is an appreciable commercial component of the microgrid demand.
Recommendations to increase sustainability for the microgrid and for microgrids, in general, include the following:
Productive energy use should be promoted to increase consumption, particularly during the daytime for solar microgrids like Silale. Measures such as strategic load growth or load shifting can help to achieve valley filling by adding or shifting demand to low consumption periods.
Communities should be sensitised about handling of microgrid equipment and proper behaviour in the vicinity of microgrids to limit damage, such as that which occurs due to stones thrown on the panels. This will avoid an unenvisaged ramp up in lifecycle costs due to early equipment replacement requirements, as well as the decline in power generation capacity which negatively impacts reliability.
Line balancing should always be ensured so that there is equitable loading of lines. Load redistribution, if required, should be carried out to avoid the occurrence of frequent load shedding and poor power quality on overloaded lines.
Decommissioning strategies are important in ensuring that even at microgrid end of life and/or handover there is a plan for handling, operation and disposal of the equipment, e.g., battery recycling/disposal measures should be in place.

2.2. Electric Mobility

Characterised by low emissions and operating costs, typically electric 2Ws have ranges of 50–100 km [9,30,31], speeds of 40–65 km/h [8,9,32], and charging power in the range of 0.8–4 kW [8,33].
According to [9], an internal combustion engine motorbike has an average fuel consumption of 3 1itres/100 km. Given a daily fuel consumption per bike of 4.5 litre of petrol for a 150 km distance, the average annual tailpipe emissions (i.e., ignoring emissions from electricity generation for e-bike charging and fossil fuel production [34]) per conventional bike will be 3.8 ton CO2 at 2.32 kg CO2/litre of petrol [9], which can be avoided by using electric bikes. Motorcycle hydrocarbon and carbon monoxide emissions per km are said to be 10 times the corresponding vehicle values [35]. In Uganda’s capital city, Kampala, annual CO2 emissions from its 150,000 motorcycles exceed 450,000 tons [9].
High levels of particulate matter (PM) emissions via combustion engines are mainly a result of poor maintenance, low-quality fuel, and ageing vehicles [36], resulting in adverse public health and air quality impacts. Battery drive vehicles have 70% less CO2 emissions over their entire lifecycle (75–150 g/km) than fossil fuel drive vehicles (200–250 g/km) [37]. Electrified transportation can, thus, reduce CO2, PM 2.5 and NOx emissions in Sub-Saharan Africa, especially when powered by green energy. A 97.5% drop in CO2 emissions and an over 98% decrease in CO, PM 2.5, and NOx emissions, and an 80% decrease in SOx emissions, were reported for Zembo bikes in Uganda relative to conventional bikes [11]. It is noted that in this work we only considered tailpipe emissions, and not entire lifecycle emissions of the two-wheelers.
E-mobility rollout requires the integrated modelling of transportation and electric distribution networks, different charging rate options, and the consideration of demand variability with space and time [38]. Lack of standards for battery performance, as well as battery swapping stations and/or charging stations, hampers the quality and longevity of E2&3Ws, and thus the authors of [8] recommend recycling policies, implementing electric vehicle (EV) standards, and establishing training centres as accelerators for e-mobility in Africa. Battery swapping is helping to mitigate the infrastructure, range, and battery cost challenges for E2&3Ws, as initiatives in Uganda, Kenya, Rwanda, and other African countries are proving [7,32].
Motorbike riding is a major income generation source for many people in East Africa [9]. It has been estimated that Uganda has over one million motorcycles, with less than 1% of these being electric, and over 80% of the motorcycles (commonly referred to as boda bodas) countrywide being for productive use [39]. Switching from conventional internal combustion engine (ICE) motorbikes to electric motorbikes can reportedly increase motorcycle rider income by 100% due to the lower operation and maintenance costs [40]. Battery swapping is a popular business model for e-bike companies as this prevents the riders from needing to cover the significant costs of the batteries upfront, which would otherwise be a deterrent given the short 2–3 year useful battery lifetime [4,40]. While conventional boda boda daily rental and daily fuel expenses can cost USD 4 and USD 5–USD 6, respectively, an e-bike battery leasing cost of USD 3 per day significantly lowers operational costs [41,42].
According to Africa E-Mobility Alliance (AfEMA), Kenya has over 1600 electric two- and three-wheelers and Rwanda has close to 1200 [43]. In Uganda, Zembo sells imported electric bikes while Bodawerk/GOGO equips bikes with lithium-ion (Li-ion) batteries. Battery swapping, as well as leasing and charging station services, are offered primarily in urban areas [4]. AfricroozE provides electric bicycles that are able to function as cargo bikes, ambulances, or transport bikes [44].
It has been estimated that battery swapping stations require USD 1800–USD 2550 for their setup, with chargers costing USD 300 and batteries USD 1000–USD 1500 [35]. Microgrids and stand-alone solar charging stations present a solution for areas with weak and non-existent grids and rural locations with fewer public transport options, fewer and far-flung fuel stations, and costlier fuel than urban areas [45].
Microgrids offer a rich opportunity to offset the capital and energy generation costs required for setting up the electric charging stations in off-grid areas, which enhance sustainability for the microgrids in terms of boosted demand, as well as the coverage area of the electric mobility companies and customers.

2.3. Research Contributions

Prior work on load shifting and peak clipping assumed an aggregated controllable load [14]. In this paper, more granular modelling of strategic load growth DSM is done, whereby different types and numbers of schedulable loads (e-mobility vehicles and portable storage) are not treated as an aggregated batch but are optimally scheduled based on system parameters and constraints.
DSM strategies are typically approached differently for grid-connected versus isolated systems, with pricing often being a key factor in effecting load shifting and peak clipping in on-grid systems, while stand-alone systems usually target the matching of consumption with battery state of charge (SOC) and PV generation [46].
In [22], DSM was carried out in a two-stage optimisation process with optimal sizing based on lifecycle cost (LCC) minimisation using PSO (particle swarm optimisation) as the first stage objective, and then the maximisation of user comfort and daily cost minimisation using mixed-integer linear programming (MILP) optimisation as the second stage objectives. The minimisation of energy costs and keeping power demand below a given maximum value were the load scheduling objectives in [47] for a grid, RE source and battery setup.
In [48], a non-linear (NLP) programming optimisation algorithm was used for prioritising the loads of a solar charging station in Kenya to align with PV production levels and also for shifting loads from low production days to surplus energy days, thus increasing annual energy demand while also lowering annual energy deficit [32].
This work improves prior works by using MILP optimisation to reduce PV curtailment by charging three e-bikes (two electric motor bikes and one electric bicycle) for a microgrid in Uganda. It also extends prior analyses of electromobility in rural Africa by considering portable storage as an off-microgrid electrification approach in East Africa and developing regions. The e-mobility and portable storage loads are thus handled via demand side management as dispatchable curtailable loads that are only fed by excess PV power.
The costs of establishing and operating the charging stations and batteries were not considered in this work. It is assumed that those costs are covered by e-mobility and portable battery companies which, in the absence of the grid, use the isolated microgrid’s power and can thus avoid the costs of setting up their own (usually solar with battery storage) electricity generation systems.
The contributions of this work are as follows:
  • A DSM strategy of strategic load growth using electric two-wheelers in an East African microgrid is investigated and a detailed analysis is carried out on integrating e-mobility into rural microgrids in Africa and Uganda in particular
  • To the best of the authors’ knowledge, a novel analysis is conducted of the off-microgrid electrification potential for an isolated rural microgrid through the integration of portable storage loads.
    The novelty stems from the lack of studies on modelling of portable storage potential for off-microgrid electrification based on microgrid consumer data for estimation of the number of additional customers that can be electrified.
  • Actual microgrid load profile data for several microgrids is incorporated for evaluating the impact and potential customer base of the proposed off-microgrid electrification solution
  • A lifecycle analysis and levelized cost of energy (LCOE) comparison are conducted for different system configurations to evaluate the effectiveness of the proposed DSM intervention.

3. Materials and Methods

3.1. Senyondo Microgrid Site Description

Winch Energy’s Senyondo microgrid at Bunjako on Lake Victoria’s shores is an off-grid system with solar PV generation and battery storage serving off-grid communities [20]. The containerised equipment and setup are shown in Figure 6. The microgrid has a PV capacity of 75.8 kWp and 296.64 kWh lead–acid battery storage, as well as SMA Sunny Tripower 20000 TL-30 and SMA Sunny Island 8.0H-12 power inverters.
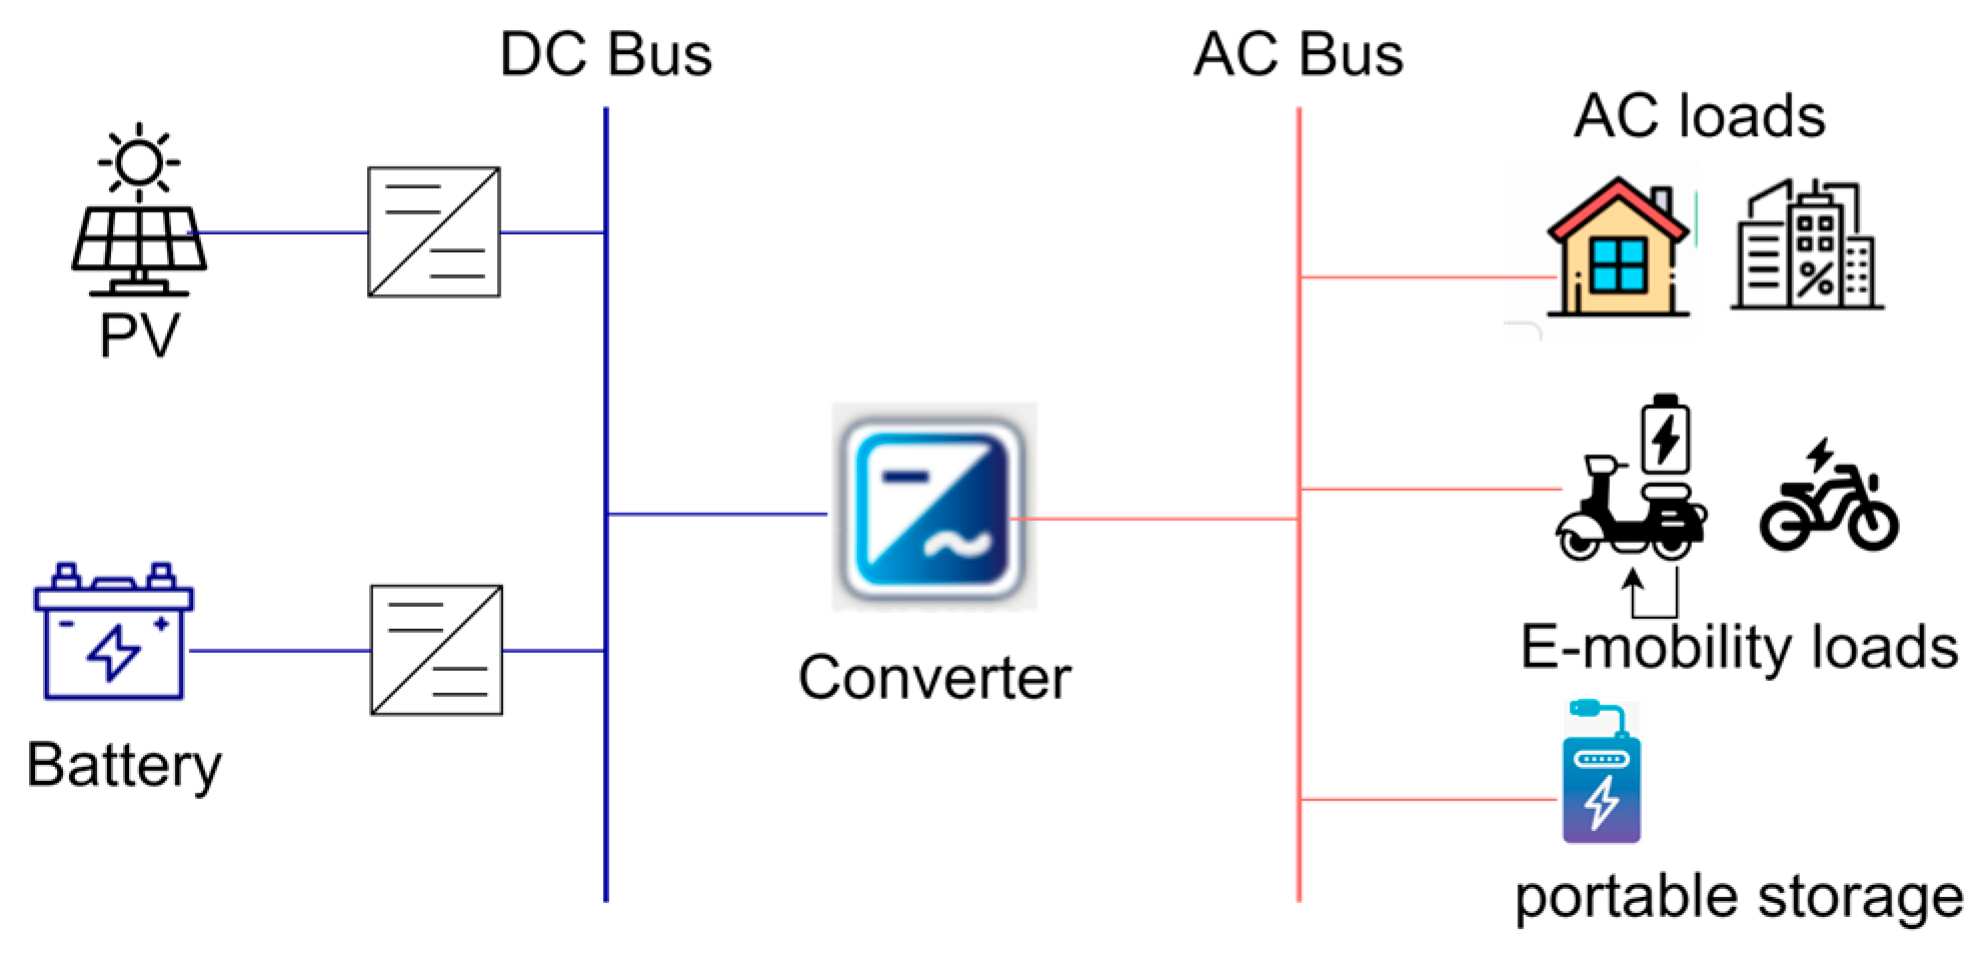
The microgrid’s PV module and battery specifications were considered in the modelling and lifecycle analysis of the microgrid. The schematic of the Senyondo microgrid is shown in Figure 1 and the proposed setup, including e-mobility and portable storage loads, is shown in Figure 7.

3.2. System Modelling

3.2.1. Meteorological Data

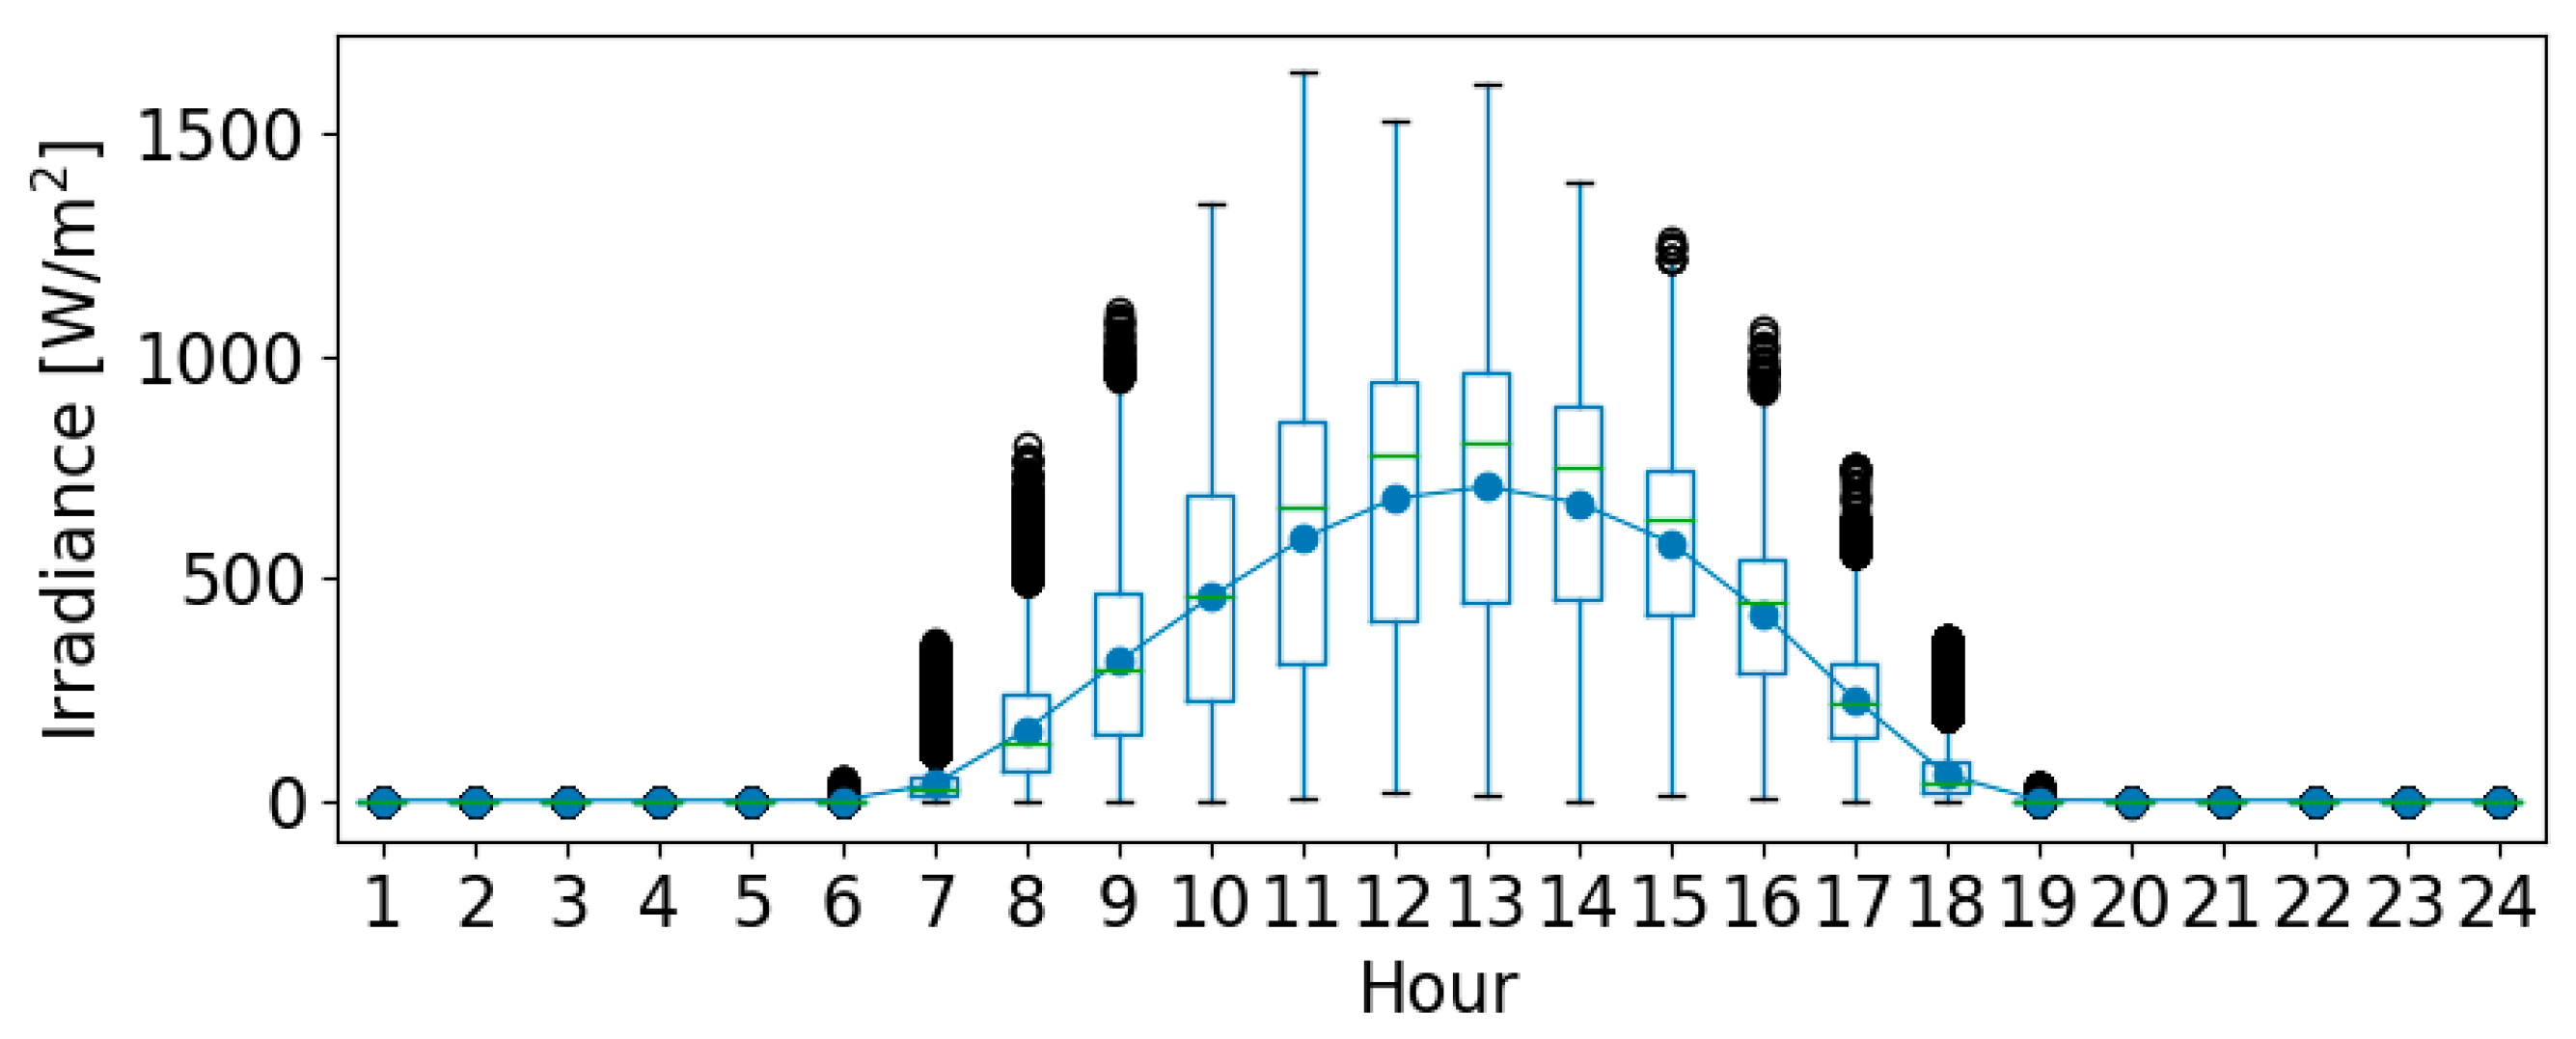
Irradiance, temperature, and load data for a year for Senyondo microgrid was used. An irradiance meter was installed at the microgrid site to measure irradiance data. Irradiance measurements, taken on-site for the period 10 March 2022 to 21 September 2023, had the distribution shown in Figure 8.
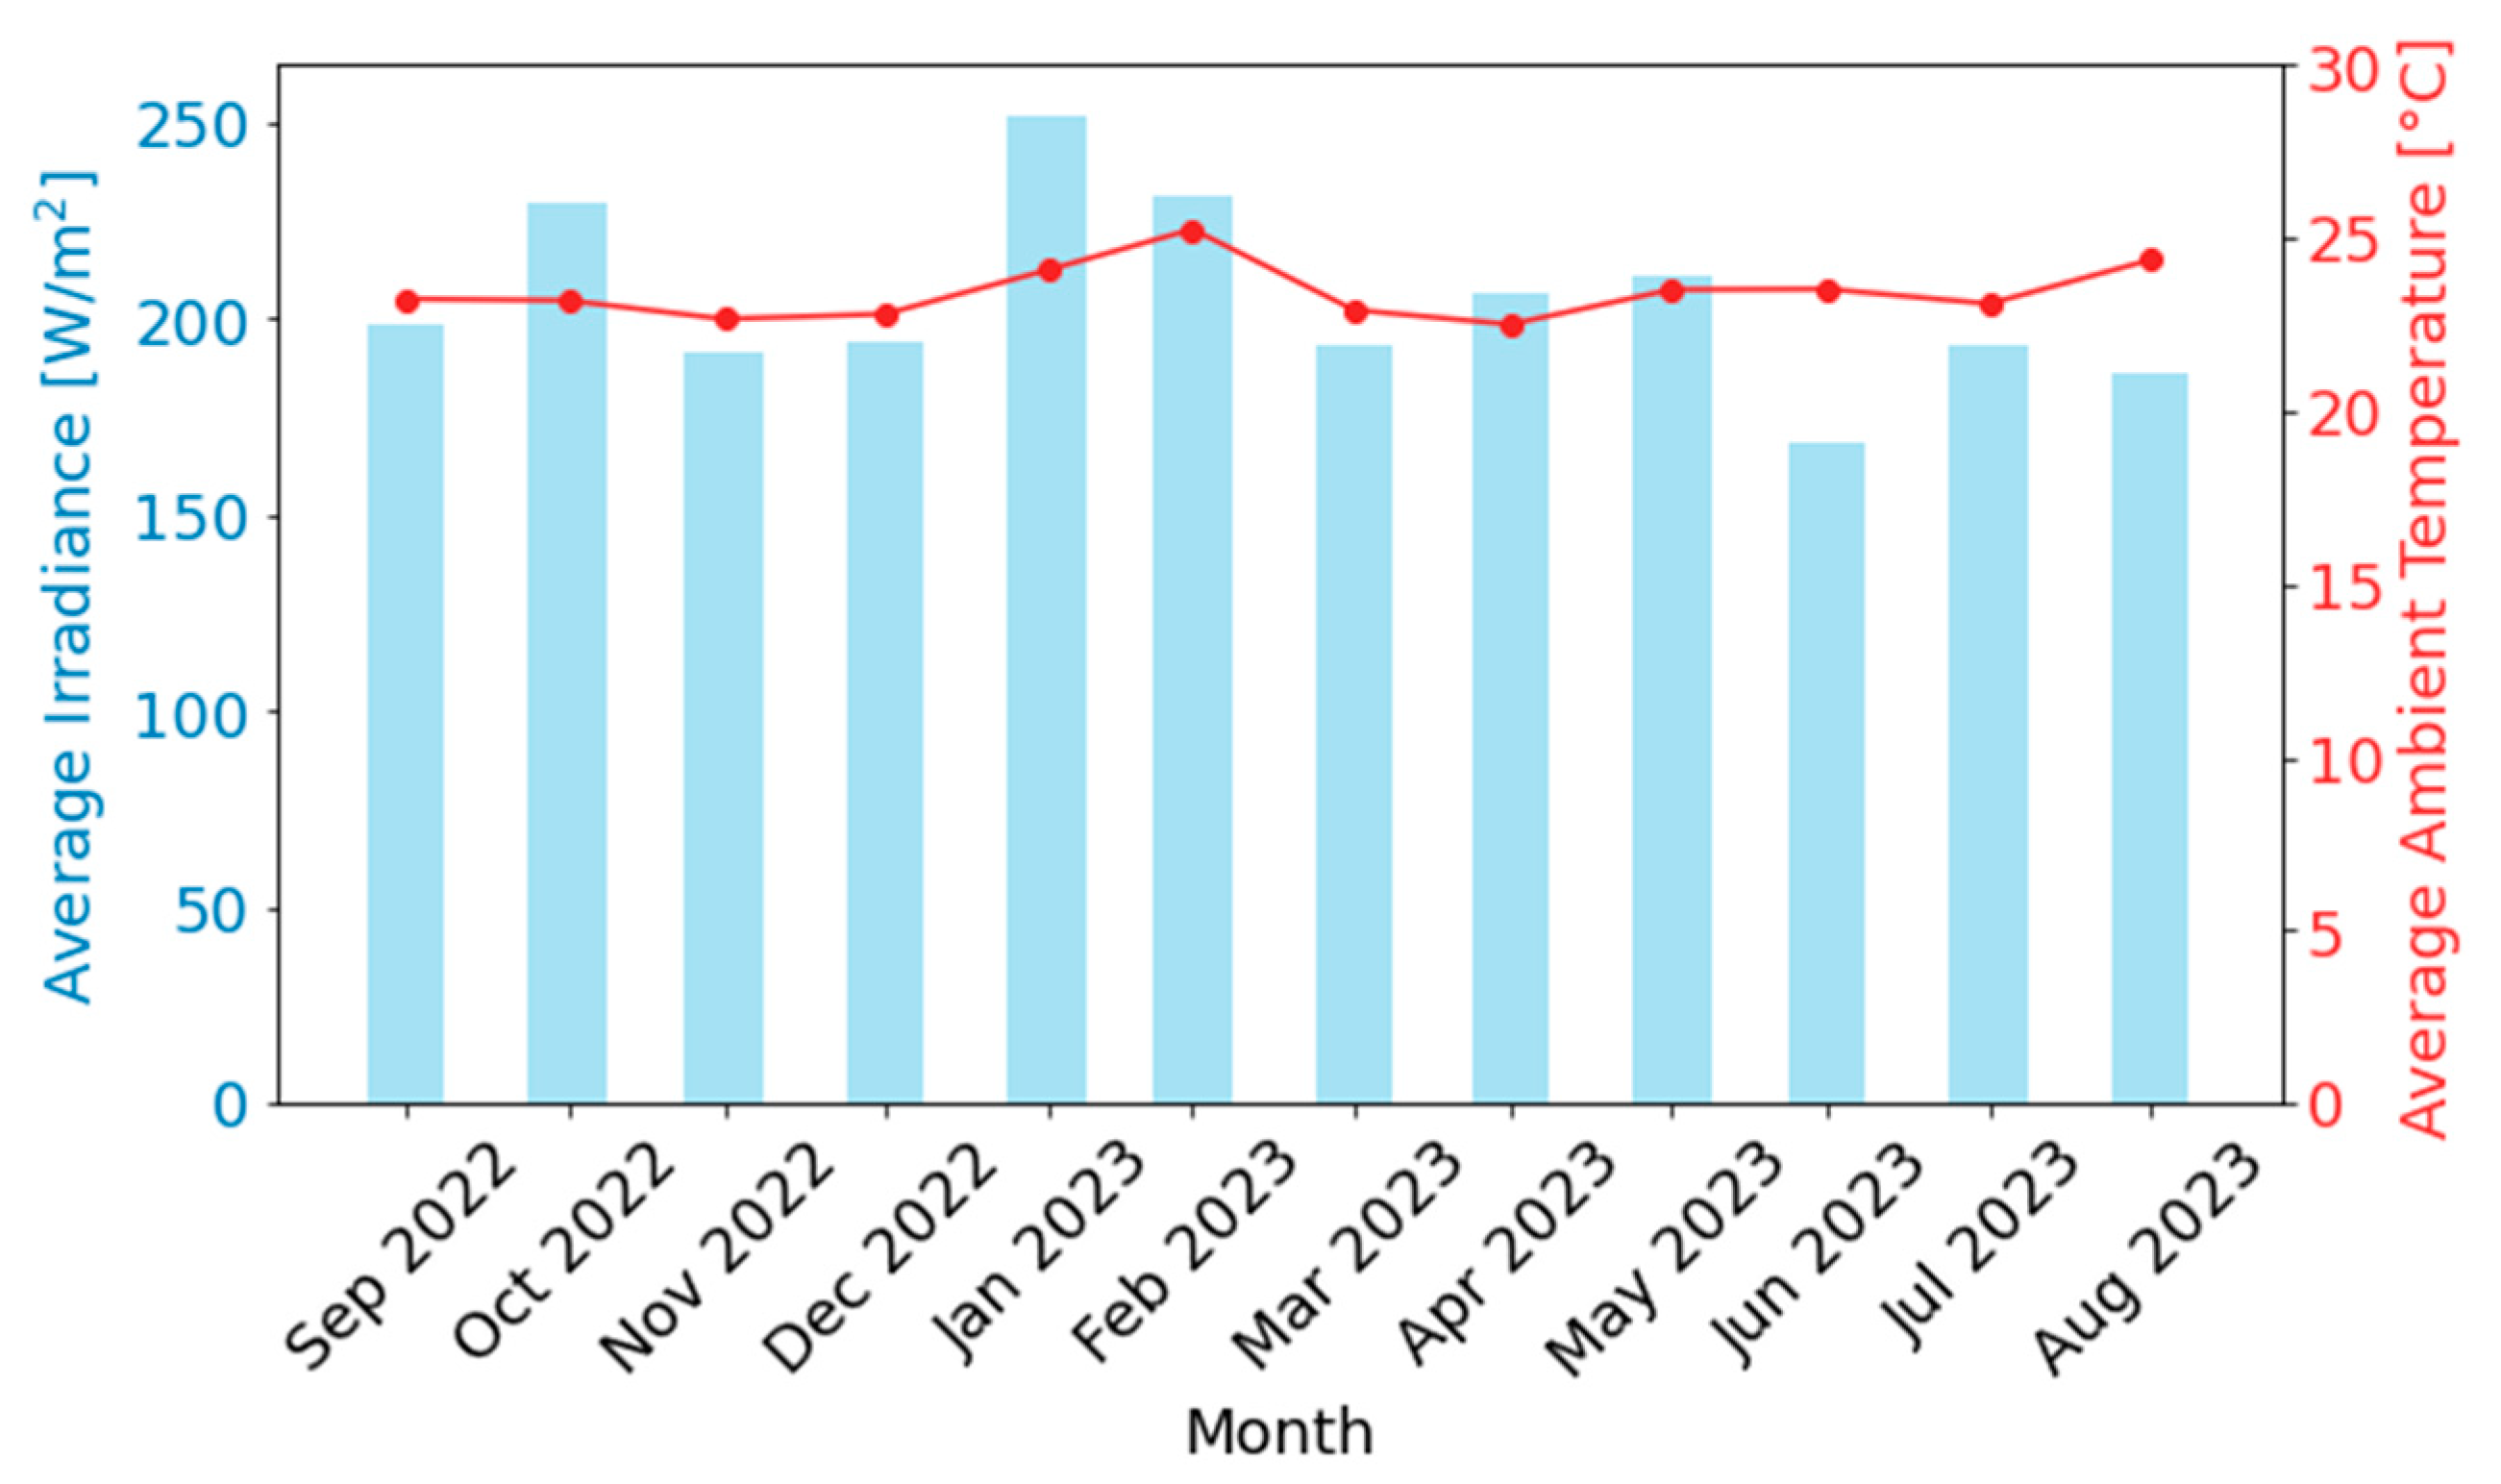
The average ambient temperature of the location obtained from the NASA website [49] for the period from 1 September 2022 to 31 August 2023 is plotted in Figure 9.
The ambient temperature data of the location obtained from the NASA website [49] for the period 1 September 2022 to 31 August 2023 was used for the PV energy production modelling.

3.2.2. Load Profile

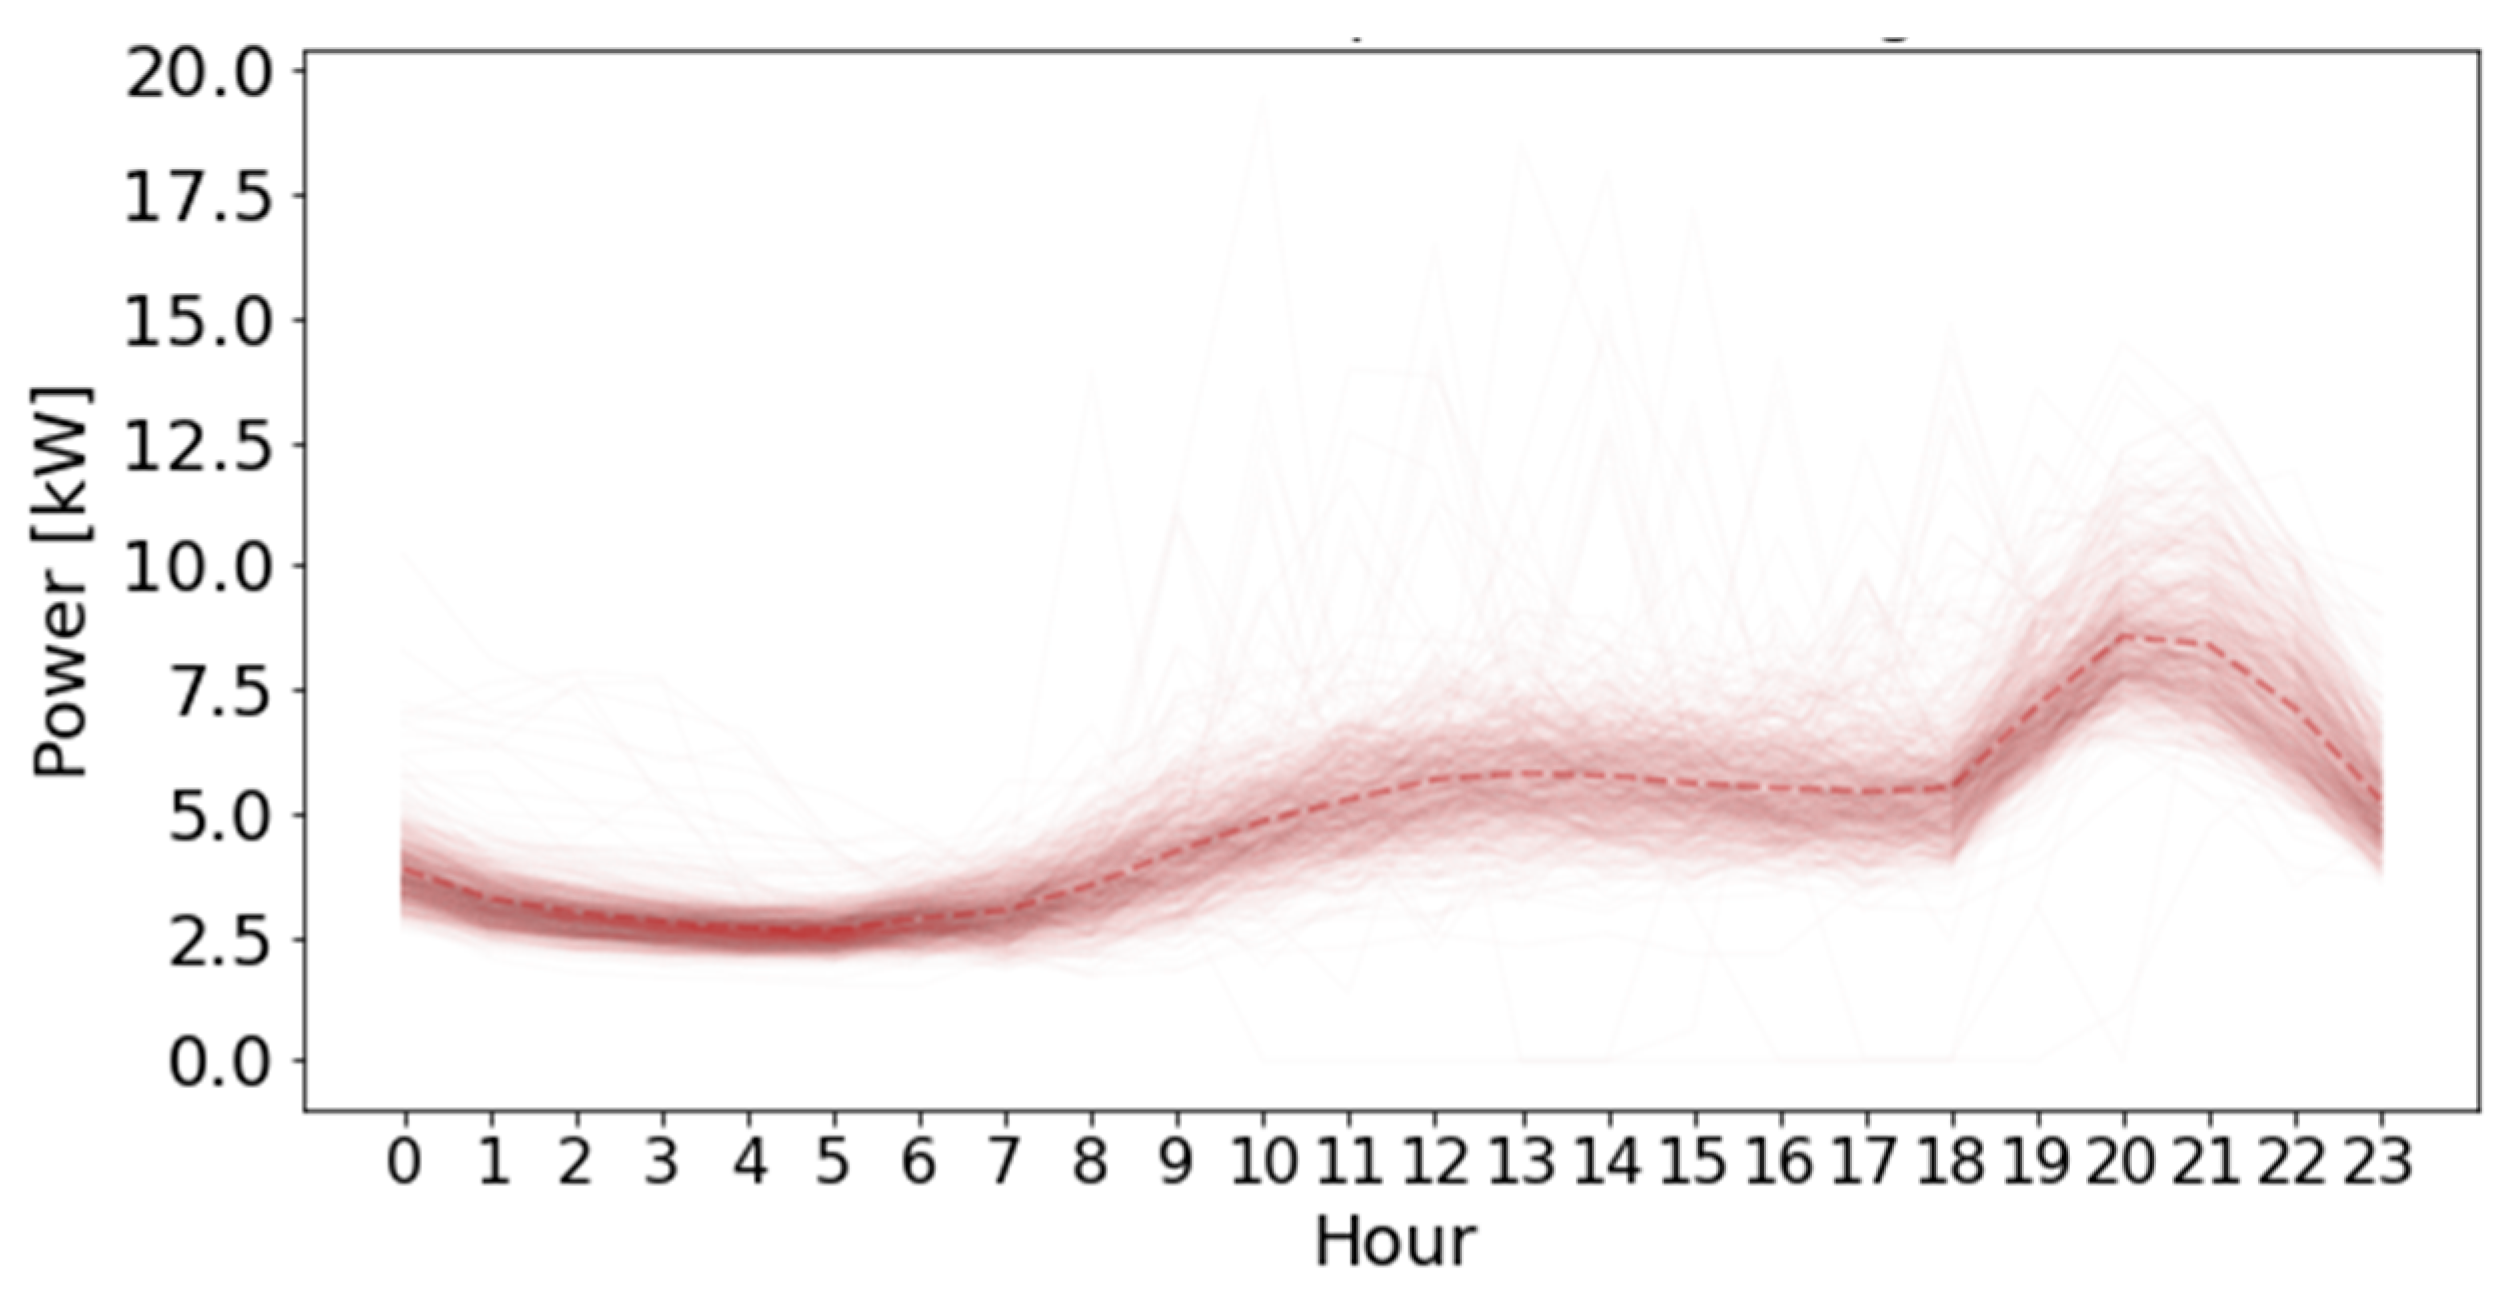
The microgrid demand profile for the period spanning 4 March 2022 to 21 September 2023 was plotted as shown in Figure 10. It displays an evening peak as is typical of microgrids [50] and, in general, of residential consumers [14].
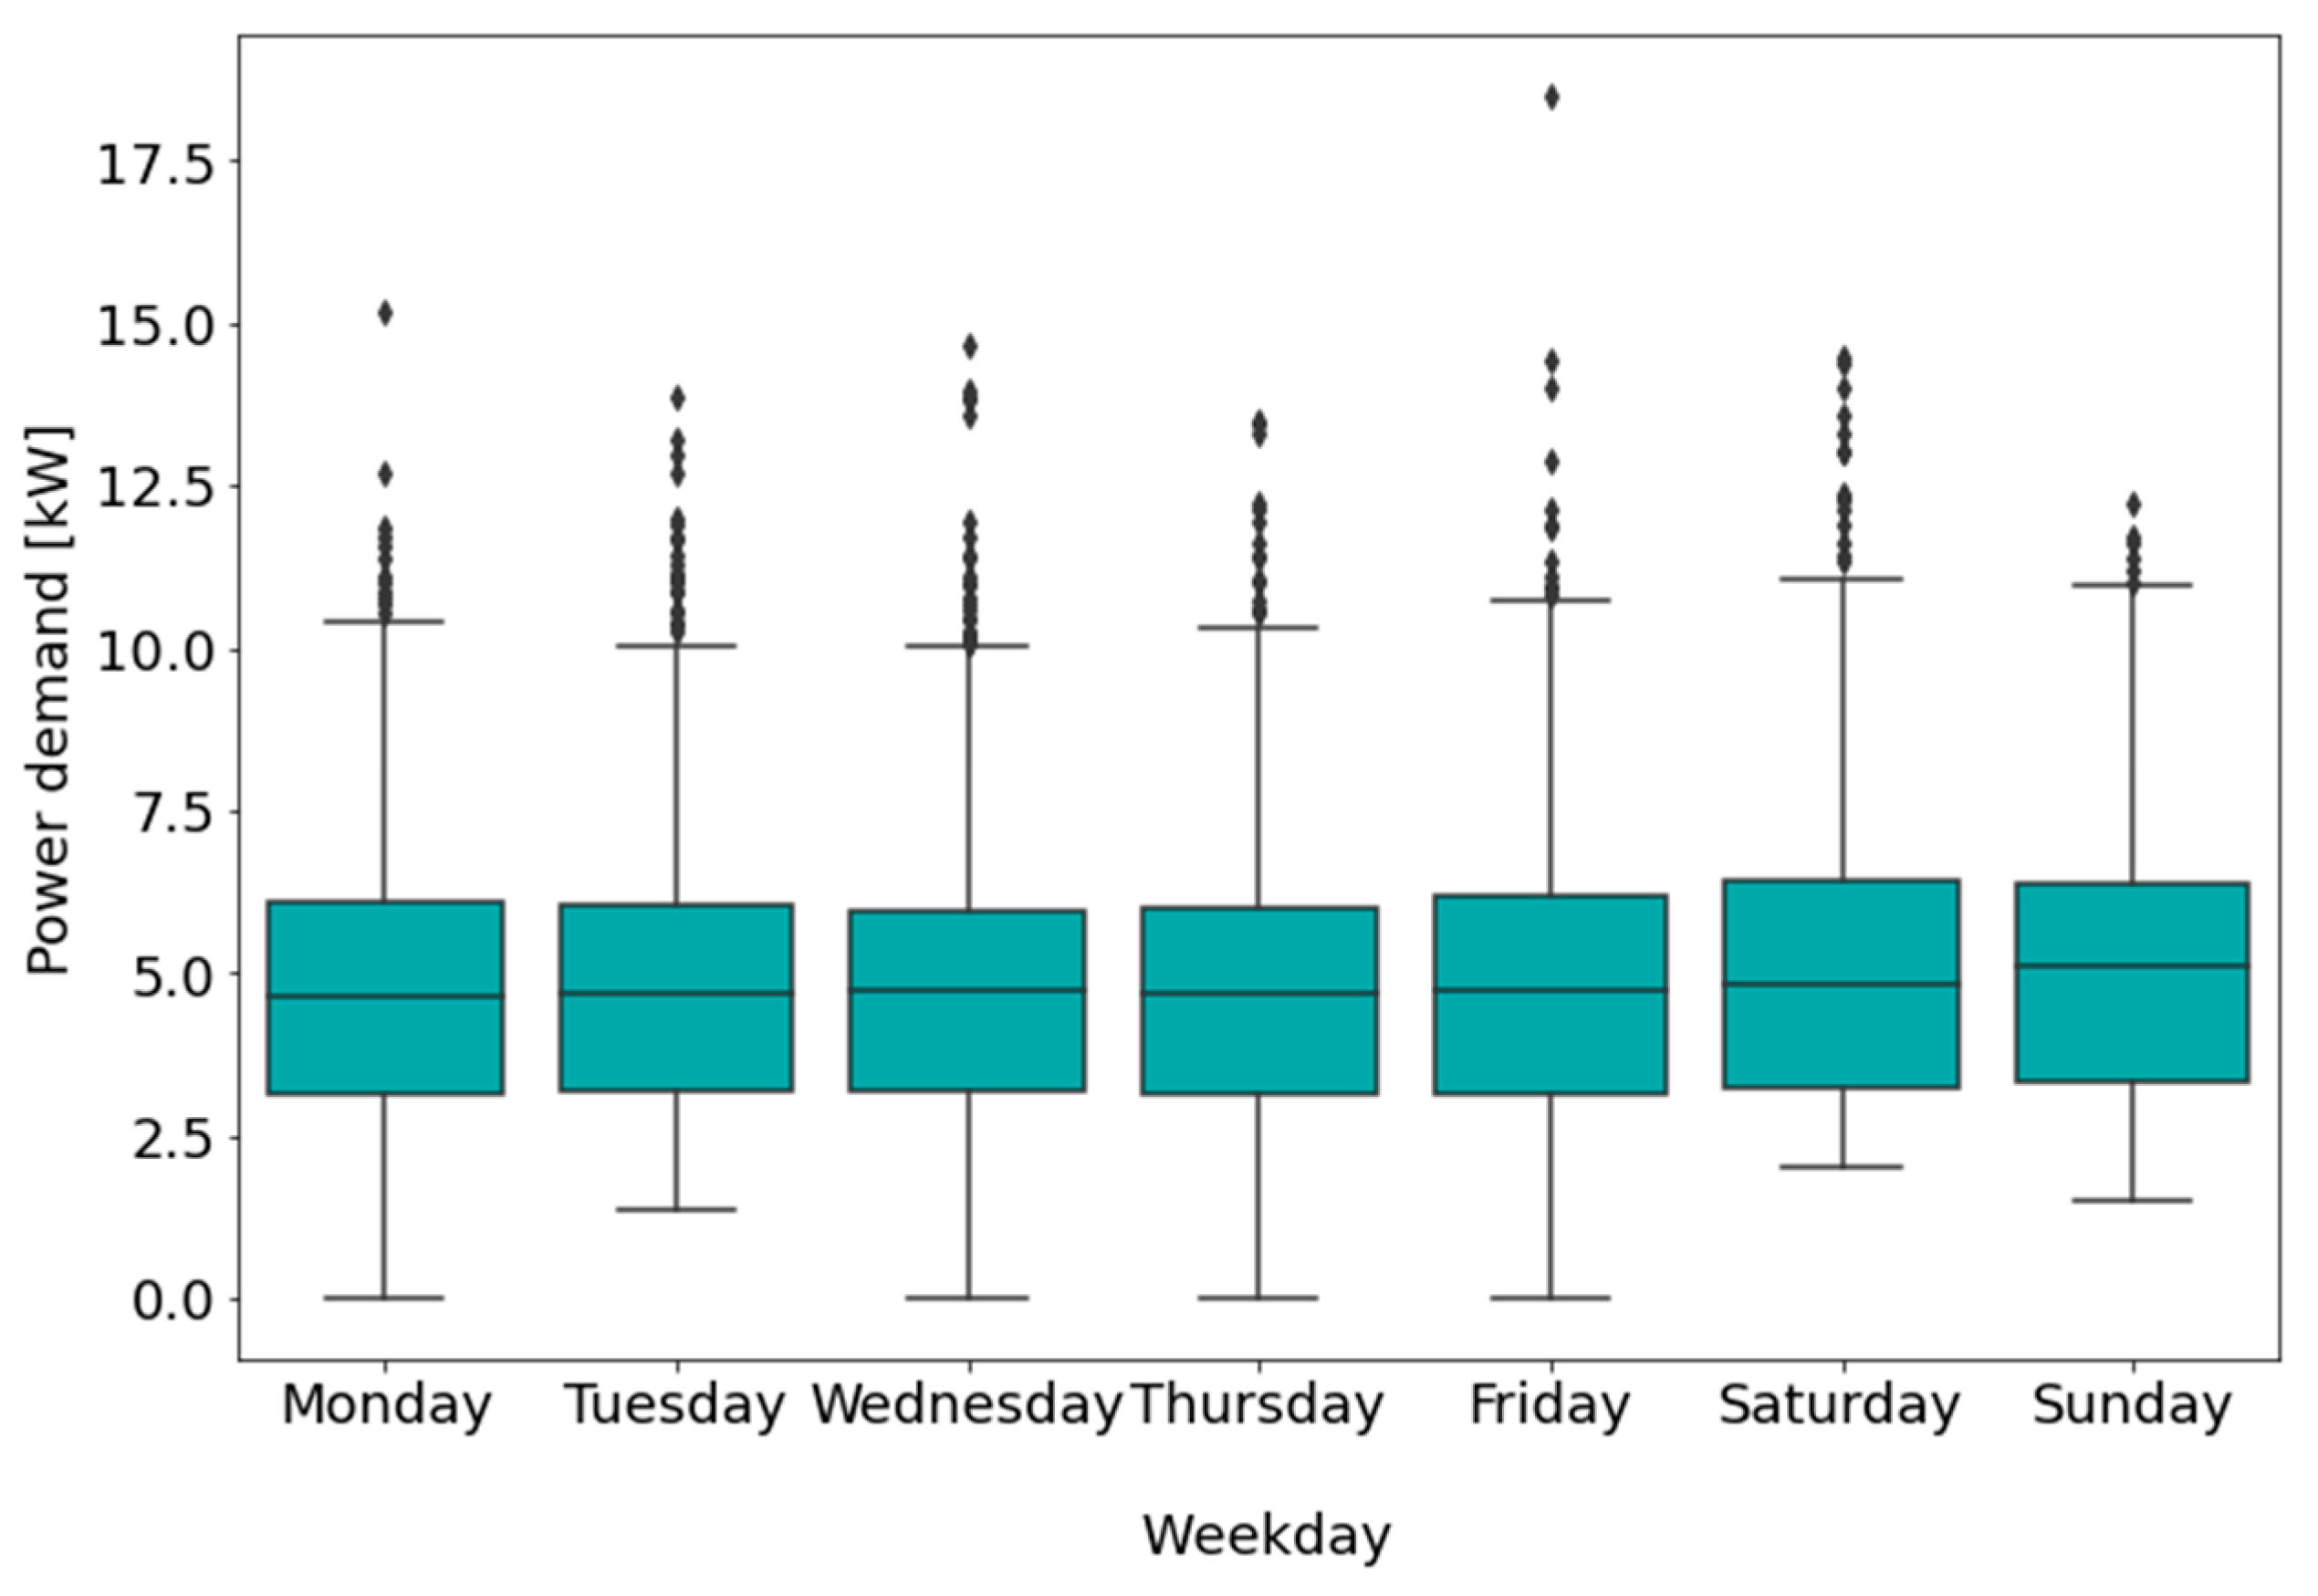
A year’s data for the period from 1 September 2022 to 31 August 2023 was used for our modelling and analysis. The average weekday demand distribution for the year is shown in Figure 11 and shows that the consumption was consistent over the days of the week, with Saturday and Sunday having a marginally higher consumption than the other days of the week, and Sunday exhibiting the highest average consumption by a negligible margin. Therefore, any DSM method should be equitably implementable for different days of the week.
The challenge of handling missing or outlying data for smart meters was discussed at length in [51,52], arising from factors such as communication network failures, equipment downtime, environmental factors, unstable transmissions between sensors and databases, etc. This is typically handled using elimination, which refers to leaving out the missing data, or imputation, which refers to inserting estimated data. The method of elimination or omitting the missing data has the disadvantage of leaving out important information and thus we opted for imputation for substituting the missing data.
Imputation techniques include last observation carried forward, mean, median, mode, maximum likelihood estimate (MLE), multiple imputation (MI) [51,53] and machine learning-based options, like support vector regressor (SVR), Bayesian missing values imputation, k-nearest neighbour missing values imputation, and random forest imputation (RFI) [52]. K-nearest neighbours (KNN) and random forest are popular imputation methods [54]. Random forest and random forest-based methods, such as missing forest, have been found to outperform KNN and other imputation methods [55,56].
For the 365-day period analysed, 0.15% of the average hourly demand data was missing, possibly due to network failures or data logging system downtime. Hence, the missing forest algorithm in Python 3.8.10 was used to impute the missing data, so as to obtain the average hourly data for a full year, which 8760 h of data was used as the base load in the modelling and lifecycle analysis. Note that annual load profile growth over the project lifetime was not considered in our analysis.

3.2.3. Solar PV System

Solar PV production is a function of irradiance and ambient temperature. The output PV production was modelled using the equations below [57,58,59]:
P P V t = P r   f d   G ( t ) G r e f   1 + K T   ( T c T r e f )
and
T c = T a m b + 0.0256   G t
where P P V and P r are the PV output power and the rated PV capacity under standard test conditions (STC), respectively (kW); f d = 0.9 is the derating factor [60], G ( t ) and G r e f are the incident solar radiation in kW/m2 and at STC of 1 kW/m2, respectively; K T   = −0.0037/°C is the temperature coefficient of power, T c , T r e f = 25 °C, and T a m b are the cell temperature, reference temperature, and ambient temperature, respectively, in °C.
The hourly PV energy produced, where t denotes an hour, is given as below.
E P V t = P P V t   t
The PV specifications used are shown in Table 2.

3.2.4. Battery System

The battery charging was modelled as below [61]:
E B t = E B t 1 + E G t E L t η c o n v     η c c   η b a t
where E B t denotes the battery energy at time t , E G is the generated electrical energy, E L is the hourly base load energy, η c o n v is the converter efficiency, η c c is the charge controller efficiency and η b a t is the battery round trip efficiency.
Energy during discharging is given by
E B t = ( 1 σ ) E B t 1 + E G t E L t η c o n v     η c c   η b a t
where σ is the battery hourly self-discharge.
It is assumed that the maximum battery charging and discharging power are sufficient to meet the base load demand. For lead–acid batteries, monthly self-discharge is about 2–5%, and for Li-ion batteries, it is about 1% [62]. The initial battery SOC was set to 70%.
  • Battery degradation modelling
The largest proportion of microgrid lifecycle costs stems from storage replacement [63]. For microgrids in developing countries, the batteries are a major cause of system unsustainability due to inability to replace batteries at the end of their lifetime [64]. This is because of the low demand and income levels typical of off-grid remote rural communities. The inverse relationship between the lifespan of the battery and its use means that replacement is inevitable due to either capacity degradation over time, caused by processes like corrosion, sulphation, and stratification, or due to reaching the battery cycling limit [65,66,67]. The ambient temperature also affects battery lifetime [68]; a 10 °C increase in temperature from 20 °C to 30 °C will halve the battery life [69].
Rainflow cycle analysis is commonly used for battery degradation modelling and analysis. In [46], a rainflow counting algorithm (RCA) that extracts the number of full and half cycles from the battery depth of discharge (DOD) followed by filtering was used for battery capacity degradation computation. A rainflow counting method using battery DOD and the number of cycles was used to incorporate capacity reduction as an additional cost for VRLA and Li-ion batteries [70]. The battery cycling ageing cost computed by filtering followed by implementation of the RCA was used for dispatch decisions in [71]. In [72], a battery degradation model was presented that considers DOD with microcycle resolution and battery temperature to assess the gain from hybridising a lead–acid battery energy storage system (ESS) with supercapacitors.
In this work, we use the rainflow cycles counting algorithm [73,74], whereby battery lifetime is computed from the cycles to failure. The number of cycles and DOD data are obtained from the manufacturer information, and a degradation model is developed using specifications of the Hoppecke OPzV Sun/Power VR L 2-1700 batteries at Senyondo microgrid for a temperature of 25 °C.
From the manufacturer-specified battery cycles, temperature and DOD information [69], the semi-log plot of the number of cycles versus DOD at 25 °C was generated (see Figure 12) and used for the rainflow cycle counting simulation of Senyondo battery degradation.
The average ambient temperature was 23.4 °C, so manufacturer data for 25 °C was used to generate the following expression for the cycles to failure as a function of DOD [68,73]:
n c y c l e s ( D O D ) = 18 , 927.43   e ( 8.9220   D O D ) + 6563.71   e ( 1.9022   D O D )
The ageing rate per cycle is the inverse of n c y c l e s ( D O D ) . The battery degradation rate B D for the entire period was thus calculated as
B D = k 1 n c y c l e s ( D O D k )
where k represents the cycle index.
The battery lifetime in years L b a t was obtained as
L b a t = 1 B D
The battery specifications used [14,75,76] are shown in Table 2.
Table 2. PV, battery, and converter specifications.
ComponentParameterValueParameterValue
PV
[57]
Average PV panel rating395 WpInstallation cost 20 %   of   C P V
Lifetime25 yearsAnnual O&M cost 2.5 %   of   C P V
Capital   cos t   ( C P V )USD 400
Battery
[14,75,76]
Nominal capacity 1545 AhMinimum SOC (%)50%
Nominal   voltage   ( V B a t )2 VMaximum SOC (%)100%
System DC voltage 48 V Capital   cos t   ( C B a t )USD 300/kWh
Self-discharge rate (σ)0.2%Installation cost 3 %   of   C B a t
Round   trip   efficiency   ( η B a t ) 86%Annual O&M cost 2.5 %   of   C B a t
Charge   controller   efficiency   ( η c c ) 90%
Converter
[14,77,78]
Power rating 80 kWInstallation cost 3 %   of   C c o n v
Lifetime15 yearsAnnual O&M cost 2.5 %   of   C c o n v
Capital   cos t   ( C c o n v ) USD 300/kW Efficiency   ( η c o n v ) 98%

3.2.5. Converter

The converter handles the conversion of AC to DC and DC to AC. Typically, the converter rating P c o n v (kW) is given by this equation [61]:
P c o n v = P L m a x η c o n v
with P L m a x denoting the maximum AC load power demand.
The converter was set to 80 kW to minimise PV curtailment. The converter [14,77,78] specifications are shown in Table 2.

3.2.6. Electric Bikes and Portable Storage

Certified and real-world energy consumption of electric bikes and bike-like three-wheelers have been reported to range between 0.17 and 2.25 kWh/100 km and 0.41 and 1.45 kWh/100 km, respectively, with an average of 0.54 kWh/100 km and 0.71 kWh/100 km, respectively [79]. For electric motorbikes, the corresponding certified and real-world values were 1.07–17.5 kWh/100 km and 6.0–13.5 kWh/100 km, with the averages of 4.62 kWh/100 km and 9.3 kWh/100 km, respectively.
According to [11], motorbike riders in urban Uganda reported a 150 km average daily distance, and with Zembo bikes, the average daily distance was 70 km. The possible coverage distance of a Bodawerk bike is 100–120 km [80]. For our analysis, we assumed a daily average distance of 50 km [32], given the rural location and the fact that the population was less dense than urban areas.
A hybrid solar 8.55 kWp system with 9.6 kWh battery storage installed in Uganda could recharge 20–30 Zembo bikes daily [81]. A Bodawerk e-bike with a passenger can cover 50 km–120 km daily, while a Zembo bike’s reported battery range is 50–80 km [82].
For the mobile loads, three types of electric two-wheelers available in Uganda were considered: the Bodawerk e-motorcycle [31,32,45,83], the Zembo e-motorcycle [11,30,45,84], and the AfricroozE e-bicycle [45,85]; the specifications for these electric two-wheelers are shown in Table 3. The Bodawerk 4.6 kWh smart battery [83] was also considered in this work as a portable storage electrification solution for off-microgrid consumers, and a charging rate of 1000 W was assumed.
The number of additional loads of each type charged daily n x n d a i l y was computed as
  n x n d a i l y = E n x n d a i l y / x n b a t _ c a p
where x n denotes the type of load with x n = 1,2 , 3,4 corresponding to Bodawerk, Zembo, Africrooze, and portable storage loads, respectively; E n x n d a i l y is the energy supplied to load type x n daily in kWh; and x n b a t _ c a p is the battery capacity of x n in kWh.
Daily targets were set for each type of load, with Bodawerk, Zembo, and Africrooze battery charging targets set to 20 and the portable battery daily charging target set to 60 to minimise the amount of PV energy curtailed.
It was assumed that each e-mobility rider covered an average daily distance of 50 km. For conventional ICE motorbikes, it was assumed that the average petrol requirements were 1.5 litres/50 km [8,9].
The equivalent annual savings in fuel consumption from using electric 2Ws and 3Ws can be calculated by summing up the equivalent litres of petrol that would have been required to meet the daily 50 km distance coverage of each type of e-bike.
From this, the annual CO2 emissions avoided by using electric transport can be computed as the product of CO2 emissions per litre and the annual total avoided petrol litres
C O 2 a v o i d e d y r = d = 1 365 D a i l y   l i t r e s   o f   p e t r o l   a v o i d e d   f o r   a l l   b i k e s C O 2   p e r   l i t r e
with CO2 emissions being 2.32 kg CO2/litre of petrol.
For the Li-ion portable storage, a depth of discharge of 80% and conversion efficiency of 85% were assumed. The usable energy E p o r t _ u s a b l e in kWh is thus as shown below
E p o r t _ u s a b l e = x p o r t b a t _ c a p   D O D p o r t   η p o r t
where x p o r t b a t _ c a p is the portable battery capacity in kWh, D O D p o r t   is the portable battery depth of discharge, and η p o r t is the portable battery converter efficiency.
The average number of off-microgrid customers that can be served annually is thus
O f f M G = d = 1 365 n p o r t a b l e d a i l y   E p o r t u s a b l e   / ( 365   M G c u s t o m e r k w h d a i l y   )
where O f f M G is the number of off-microgrid customers that can be served annually using portable storage, and M G c u s t o m e r k w h d a i l y = 0.312 kWh, is the average annual energy consumption per customer for the 8 microgrids described in Section 2.1.1.

3.2.7. Reliability Considerations

A very important metric for microgrids, particularly for off-grid and rural systems in Africa is the loss of power supply probability (LPSP) [86]. It represents the probability of an energy system failing to meet the load demand requirements at a given time.
The key factors affecting LPSP in microgrids are weather resource parameters, system size and design, and energy sharing facilities. While LPSP can be reduced by oversizing systems, this leads to higher costs.
The LPSP is calculated as
L P S P = t = 1 T P d e f i c i t ( t ) t = 1 T E L ( t )  
with P d e f i c i t denoting the deficit in power required to serve the demand.
Typical LPSP values for African microgrids are 0.12 in Morocco [87] and 0.1 for Uganda [50,88]. In practice, lower LPSP values can be achieved by increasing the storage capacity or oversizing the PV system, both of which raise costs but improve system reliability. For most rural microgrids, an LPSP below 0.05 is considered a good balance between cost and system performance.

3.3. Economic Parameters

Key economic values in energy system analysis include net present value (NPV), lifecycle cost (LCC), and levelized cost of energy (LCOE) [14,61,65].
The lifecycle cost L C C is
L C C = I C C + I N S + P R O P E X + P R R E P + P R F U E L
with I C C as initial capital cost, P R O P E X , P R R E P , and P R F U E L representing the present value of the operating costs, replacement costs and fuel costs, respectively. Since there was no diesel or biomass generator, P R F U E L = 0 .
Installation costs ( I N S ) are calculated as
I N S = I N S P V + I N S B A T   b = 1 B r 1 + f n b 1 1 + r n b + I N S C O N V   c = 1 C r 1 + f n c 1 1 + r n c
where I N S P V , I N S B A T , and I N S C O N V represent the PV, battery, and converter installation costs, B r is the number of battery replacements and C r is the number of converter replacements over the project lifetime.
P R O P E X = O P E X P V + O P E X B A T + O P E X C O N V   n = 1 N 1 + f n 1 1 + r n
P R R E P = R E P B A T   b = 1 B r 1 + f n b 1 1 + r n b + R E P C O N V   c = 1 C r 1 + f n c 1 1 + r n c
with
X r = i n t   N n x n x
where O P E X P V , O P E X B A T , and O P E X C O N V represent the PV, battery, and converter operational costs, R E P B A T and R E P C O N V represent the battery and converter replacement costs, X r is how many times component X is replaced, n x is component X ’s operational lifetime, and N is the project lifetime.
f is the inflation rate, i n o m is the nominal interest rate, and r is the discount rate given by the following equation:
r =   i n o m f 1 + f
The average cost per kWh of useful energy produced by the system over its lifetime is referred to as the levelized cost of energy ( L C O E ) and is a technology-independent way of comparing generation sources and technologies.
L C O E = L C C t T E L t + E m o b t + E P S t     C R F
with E m o b t and E P S t representing the energy for e-mobility loads and portable storage, respectively, at time t , and the capital recovery factor ( C R F ) given by [77]
C R F =   i n o m   1 + i n o m N 1 + i n o m N 1
The salvage values of the converter and battery storage were included in the cost evaluation. Table 4 displays the values used in the economic modelling [14,88,89].

4. Optimisation Approach

Microgrid modelling has been investigated with objectives such as minimising lifecycle costs [61], minimising levelized cost of energy [14,50,90], maximising reliability, minimising renewable generation curtailment [86,91], minimising fuel costs and emissions [92], maximising renewable fraction [87], and combinations thereof [93]. Our focus is on minimising generation curtailment.
The microgrid will only charge the battery storage when the base load is completely supplied. The surplus energy from the PV generation after meeting the base load and the battery charging requirements is used to charge the electro-mobility loads and the portable storage. The flow chart in Figure 13 depicts the basic control strategy.
MATLAB 2023 was used for the system modelling and simulation of the technical and economic aspects of the microgrids. MILP optimisation was used for the control and dispatch of the e-mobility and portable storage loads. The goal of the chosen approach was the minimisation of PV curtailment by charging of the additional loads. The additional loads act as curtailable DSM loads which are supplied depending on the available PV power.
The algorithm is designed to first charge the existing loads with solar energy and then charge the batteries. Excess PV power is used to charge the mobile loads and portable storage, and any unused PV energy thereafter is dumped. It is assumed that the e-mobility and portable loads are supplied by an AC charging station that serves as an additional daytime load for the microgrid. The costs of the charging station and additional loads were not considered in this work as it was assumed that the charging station is operated by third parties.
If there is insufficient PV energy to meet the demand, the battery supplies the required power to the base load until the minimum battery state of charge is reached, after which load shedding occurs. It is assumed that the charging efficiency for the mobility and portable storage loads is 100%.

MILP Optimisation

The MILP solver was used to schedule the e-mobility and portable storage loads depending on the surplus PV generation. This further develops the approach in [48,94], with priority weights and power charging requirements determining the number of each additional type of load that can be supplied by the PV in each hour.
The MILP objective function   f o b j which was to be maximised is
f o b j = x n = 1 x N W x n   P x n   n x n   t
where n x n   t is the number of loads of type x n , W x n refers to the priority weighting of load x n , P x n is the charging power of load x n , and x n = 1,2 , 3,4 refers to the Bodawerk, Zembo, Africrooze, and portable storage loads, respectively.
The charging priorities assigned were W 1 = W 2 = W 3 = 1   and W 4 = 0.5 .
The constraints that were to be observed include the following:
0     β k     β k m a x , β k { β p v , β b a t }
P P V ( t ) = P L ( t ) + P B a t ( t )
E B m i n < E B t < E B m a x
where β k denotes the upper bounds of the PV and battery sizes.
The energy balance equation that must be fulfilled at each timestep is given by Equation (25), where battery power E B t is positive if the battery is charging and is negative if the battery is discharging. E B m i n is the minimum battery energy and E B m a x is the maximum battery energy. The minimum battery state of charge (SOC) is 50% of the battery capacity.
The e-mobility and portable storage constraints are as follows:
x n = 1 x N P x n   n x n   t   P p v e x c e s s t   η c o n v
  n x n   t n x n + 1   t     2   , x n = 1
where x N = 4 is the number of types of e-mobile and portable loads, n x n   t is the number of loads of type x n charged at time t , and P p v e x c e s s t is the excess PV power at time t after supplying the base load and charging the battery.
Furthermore, the difference between the number of Bodawerk and Zembo batteries charged daily should not exceed 2, as given by Equation (28), to ensure that a comparable number of the e-bikes is charged daily.
Several studies have used estimated charging times to model e-mobility charging patterns and energy profiles. In [94], peak sun hours and estimated charging times for the e-bikes being studied were used for e-bike load scheduling. In the analysis of e-mobility possibilities for on-land and off-land PV as well as wind installations with battery storage, annual renewable energy and storage supply capacity plus charging time estimates were used to model the e-mobility deployment [95]. In this work, we adopt a more granular approach by calculating, for each hour of a year, the energy balance for supplying the e-mobile and portable storage loads.
The charging priority weights and targeted daily number of each type of load are shown in Table 5. We specified the maximum number of batteries of each type to be charged daily ( n x n d a i l y m a x ) where
0 n x n d a i l y n x n d a i l y m a x
The actual daily number of batteries charged on a given day for each load type ( n x n d a i l y ) depends on that day’s surplus PV energy.

5. Discussion of Results

Four scenarios were simulated. The results for the scenarios are shown in Table 6 for the base case (no DSM) (Scenario 1); when the additional DSM loads were introduced (Scenario 2); when the PV, battery, and converter capacities were halved (Scenario 3); and lastly when the PV, battery, and converter capacities, were halved and the additional loads were introduced (Scenario 4).

5.1. Technical Results

  • Scenario 1
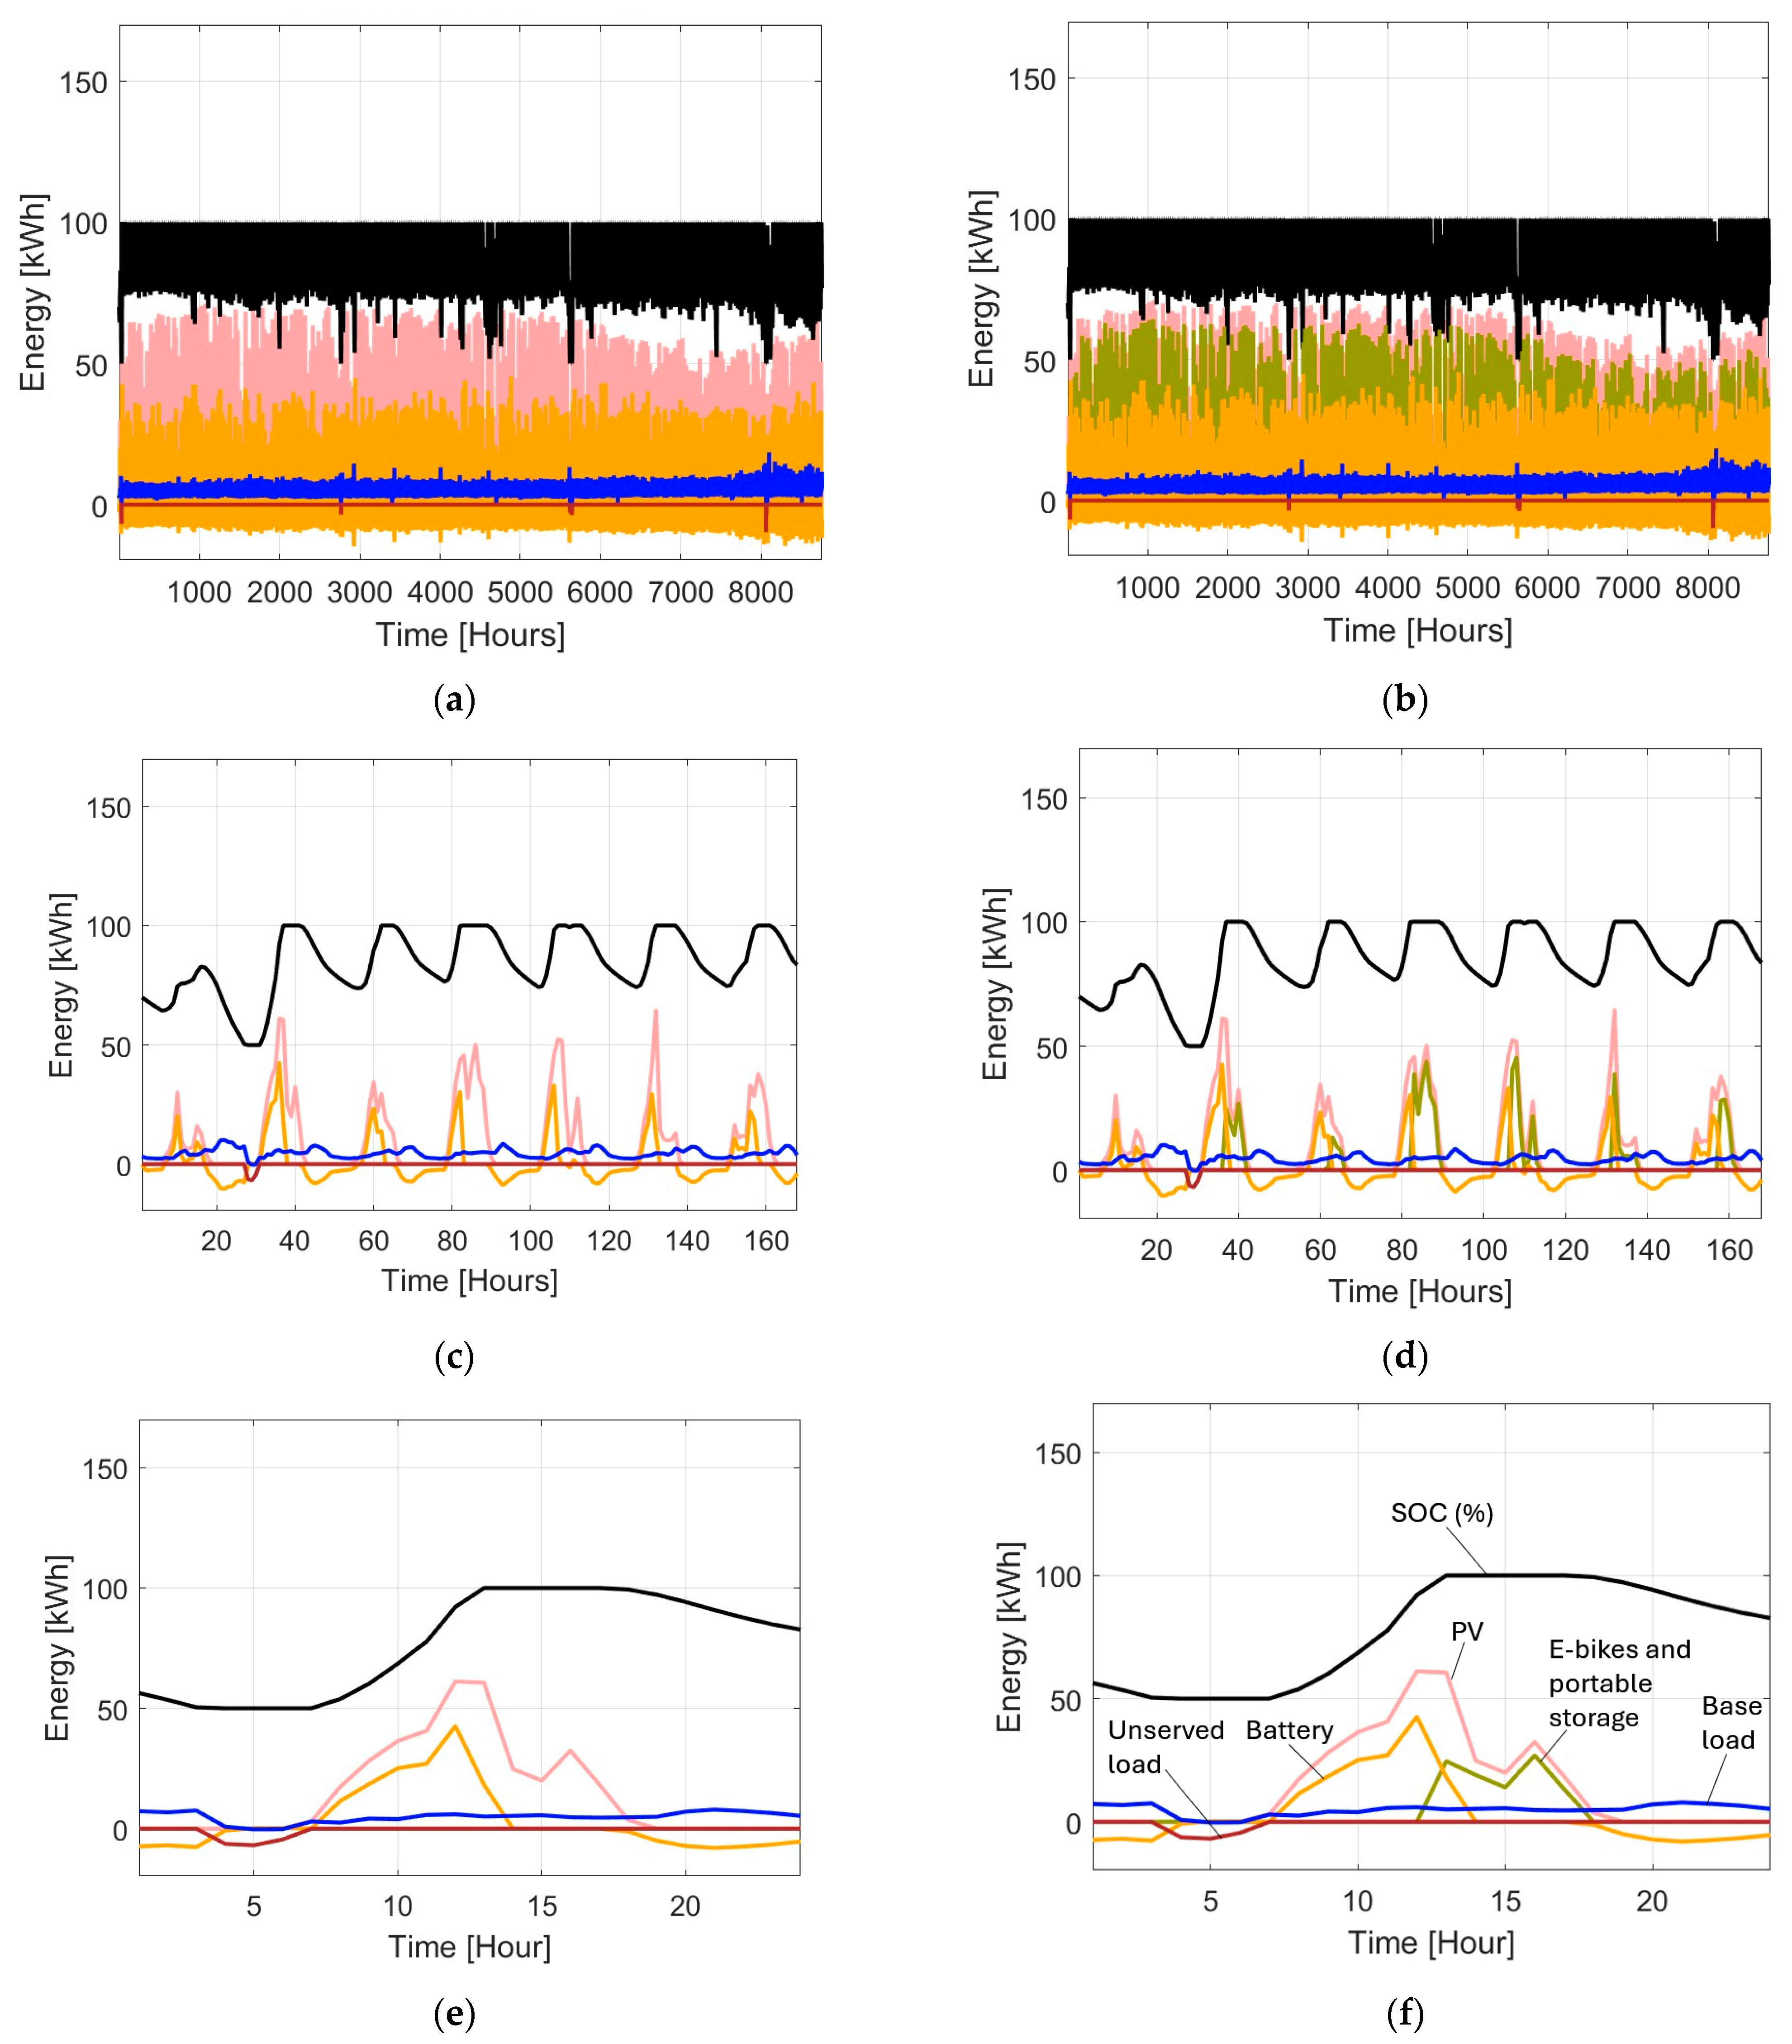
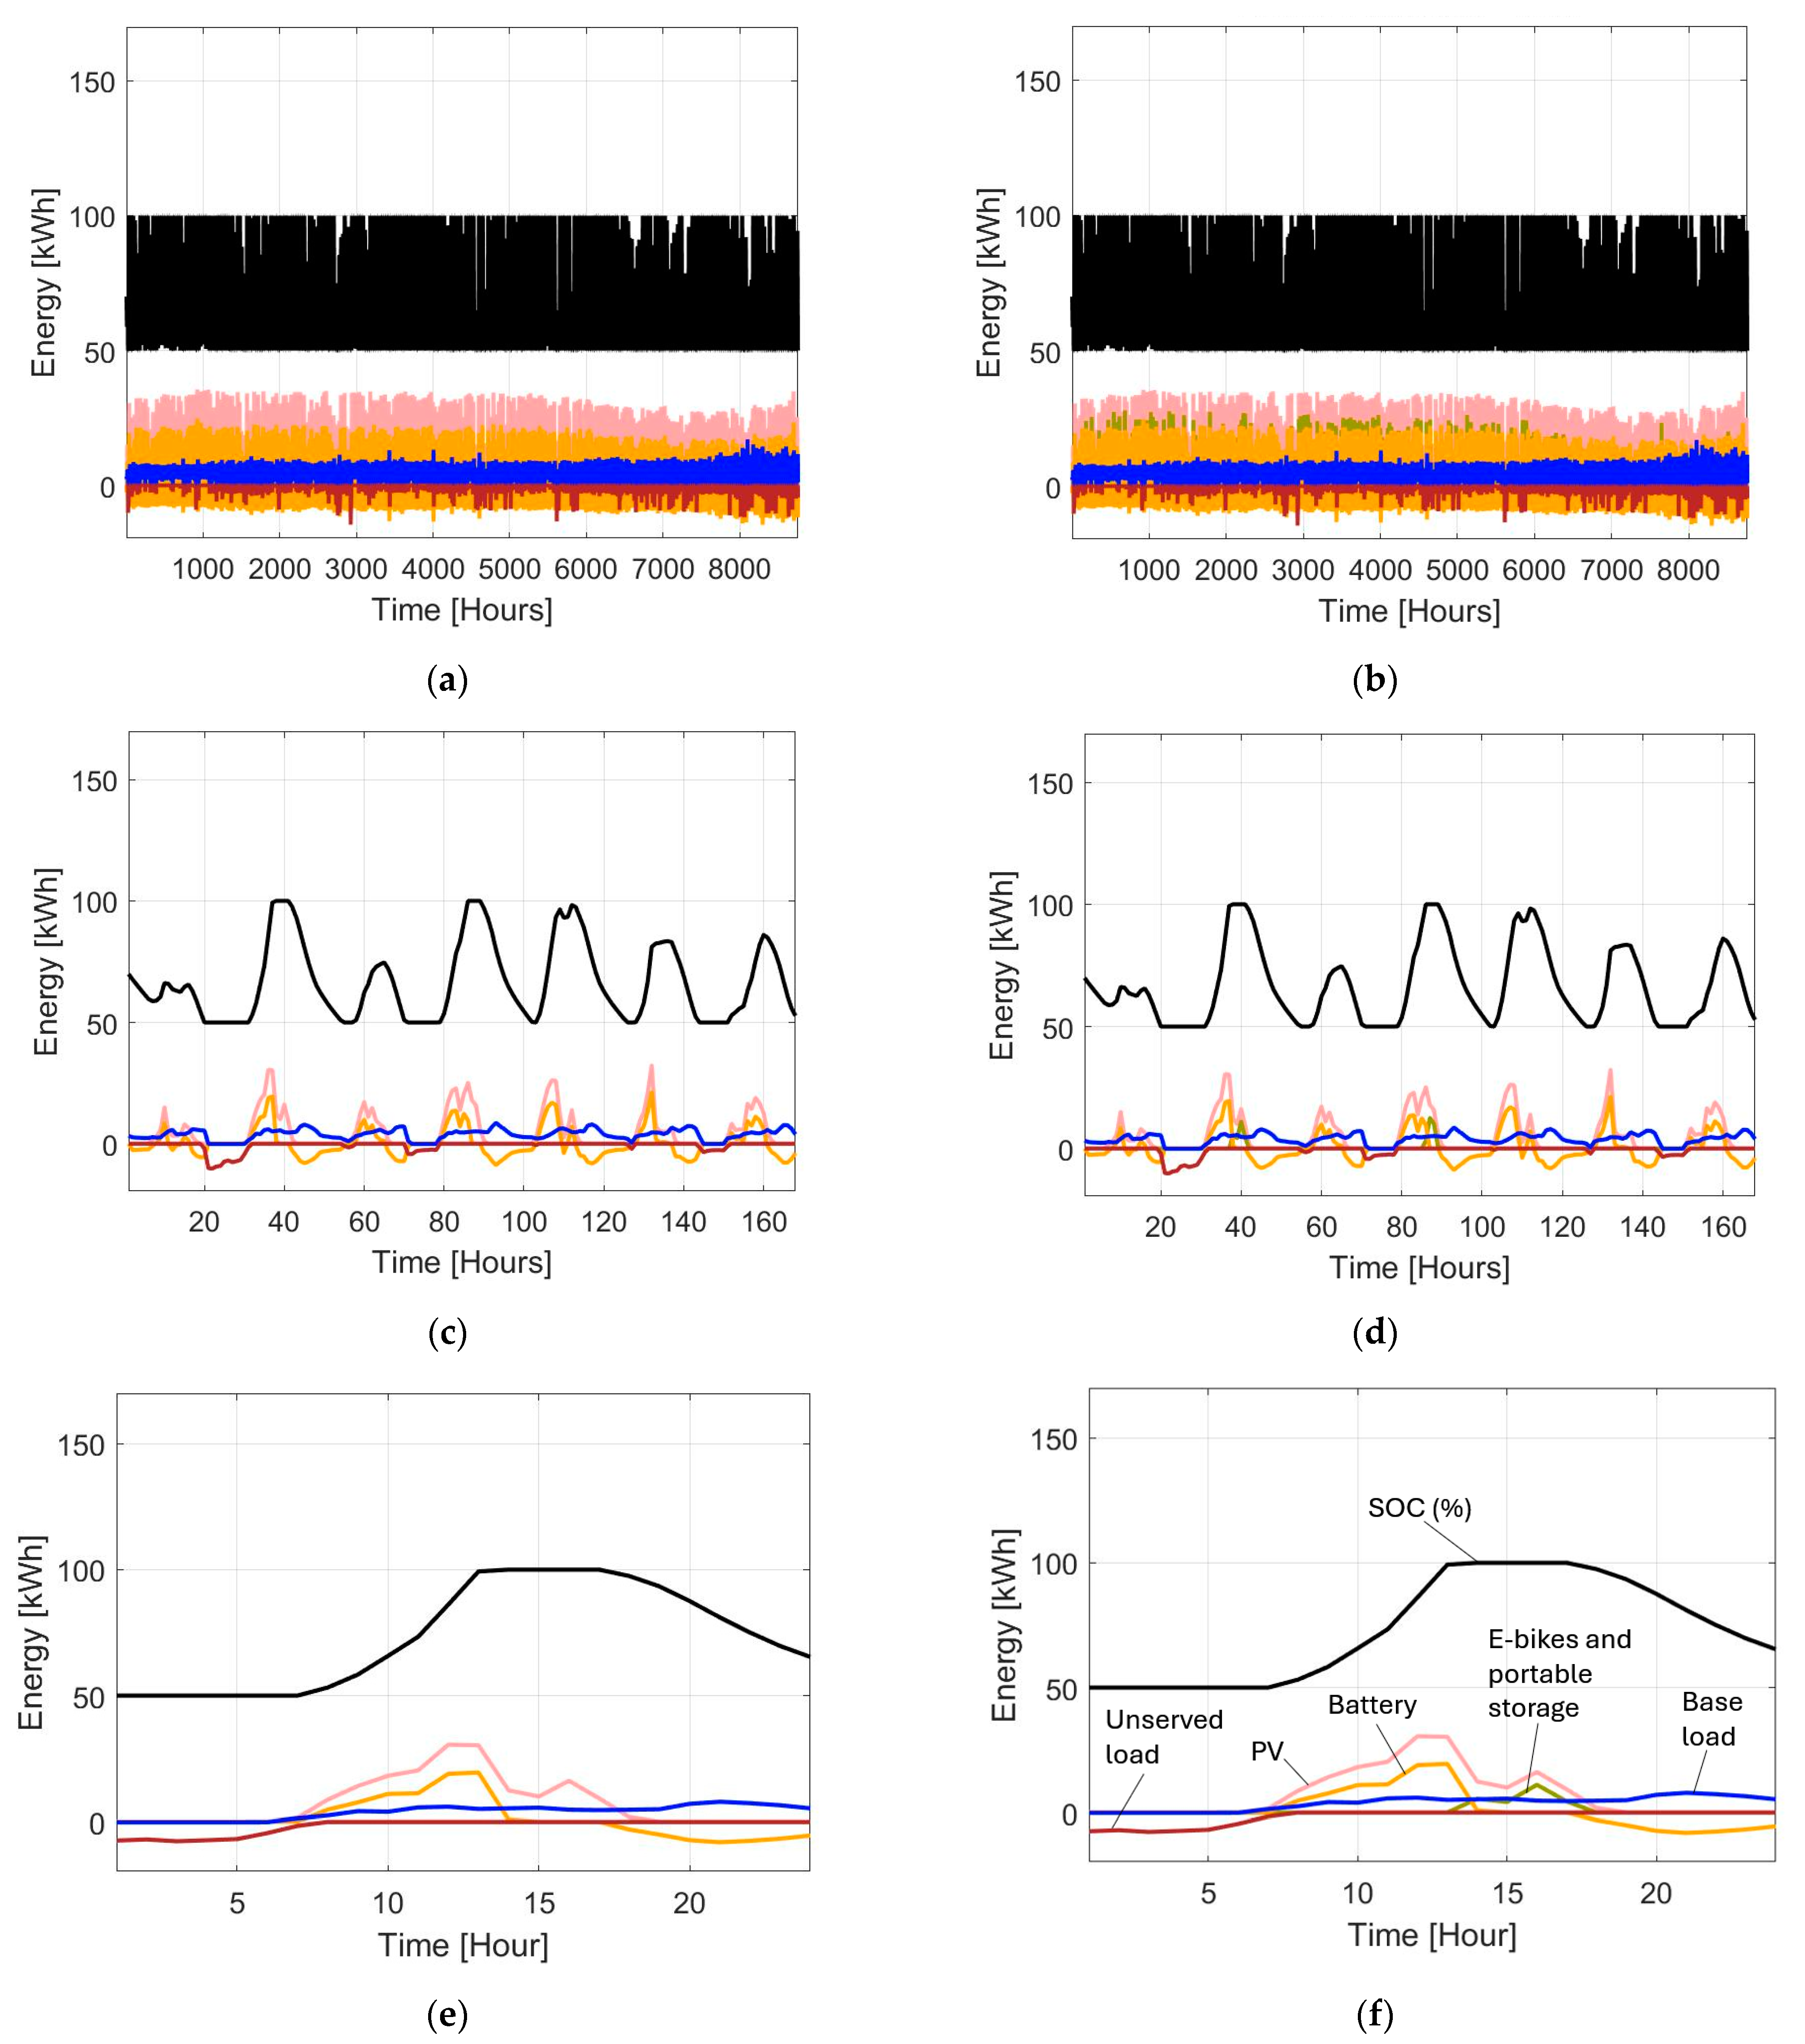
For the business-as-usual case, the energy profiles for when there were no e-bike and portable storage loads are shown in Figure 14a. Negative battery values indicate battery discharge while positive values correspond to battery charging. The average SOC was 85.4% and dropped to the minimum of SOC of 50% very rarely. There is a perceptible rise in demand after about 8000 h of the yearly duration and thus the battery was discharged to lower levels after that time.
With battery degradation included, the calculated battery lifetime was 14.11 years, as shown in Table 6.
In general, the PV and battery are sufficient to supply and meet the load demand, with a low LPSP of 0.23%. This is to be expected as the PV capacity sizing outstrips the demand, hence the high reliability. There is a high annual PV curtailment of 60,138.8 kWh, as shown in Table 6.
The simulated data for the first week of the year is shown in Figure 14c. The irradiance and, hence, average PV generation fluctuate significantly over the week in question, with day 1, day 3, and day 7 displaying low peak PV energy, indicative of cloudy days and low irradiance. Hence, there is load shedding on day 2 in the early hours due to the battery energy being insufficient to meet overnight and early morning demand. From day 2, there was surplus PV energy that was curtailed once the load demand was met, and the battery energy storage system (ESS) was fully charged. After day 2 of this week, the battery SOC remains relatively high and above 70%.
The load profile for day 2 in Figure 14e shows the lost load due to the demand exceeding the available supply resources. The dropped load when the morning battery SOC dropped to 50%, as well as the curtailment of PV energy between 1500 h and 1700 h, can also be observed in Figure 14e.
  • Scenario 2
Scenario 2 corresponds to the introduction of the e-bike and portable storage loads for the base case scenario. The annual curtailed PV energy decreased by 98.5% to only 879.05 kWh, as shown in Figure 14b and Table 6. The other energy values other than the additional load energy values remained the same as in Scenario 1 (see Figure 14). Starting from day 2 of week 1, the additional loads were able to consume most of what would otherwise have been surplus PV energy, as shown in Figure 14d. On day 1, there was not sufficient irradiance to meet the battery charging and load requirements, and although day 3 also had limited PV production, once the BESS was fully charged, some e-bikes and portable loads could be supplied. Surplus PV generation was able to charge the additional loads from day 2, as Figure 14f shows.
  • Scenario 3
In Scenario 3, the PV capacity, battery size, and converter rating were set to half of the base case sizes (37.92 kWp, 148.32 kWh, and 40 kW, respectively) and the base load was retained as in the base case (Scenario 1). This was feasible as the peak base load was less than 20 kW. For this case without e-bikes and portable storage, the energy profiles over the year are shown in Figure 15a.
The 50% battery SOC limit was reached more frequently, with the average SOC reducing to 68.73%, while the LPSP increased to 14.11%, as shown in Table 6. The curtailed PV energy was 10,669.76 kWh, which is 18% of the initial curtailed energy in Scenario 1. The first week’s energy profile shown in Figure 15c illustrates the higher depletion rate of the battery storage on the first and third days when there is low irradiance, and hence load-shedding increases compared to the base case shown in Figure 14c.
On day 2 of the first week, there was a load loss when the battery SOC limit of 50% was reached, until around 7 a.m., when the PV generation commenced, as shown in Figure 15e.
  • Scenario 4
In Scenario 4, the PV capacity, battery size, and converter rating were set to half of the base case sizes (75.84 kWp, 148.32 kWh, and 40 kW, respectively) and the base load was retained as is, but with schedulable e-bikes and portable storage loads introduced. The corresponding energy profiles over the year are shown in Figure 15b.
After the introduction of the e-bike and portable storage loads, there was a 98.6% reduction in annual curtailed PV energy compared to Scenario 3, to only 155.2 kWh. The annual energy supplied to the additional loads was only 10,304.3 kWh, and only 0.5% of this was supplied to the portable batteries, which was insufficient to meet the annual energy needs of even one off-microgrid customer (see Table 6). This indicates that when the PV generation is more constrained and for the chosen e-bike and portable battery charging priority ratings, it is advisable to only serve e-mobility loads and not include portable storage due to the limited PV surplus. In week 2, on day 2 and day 4, some additional loads were supplied because the base load and battery charging were prioritised first, as seen in Figure 15d,f.
  • Low PV production
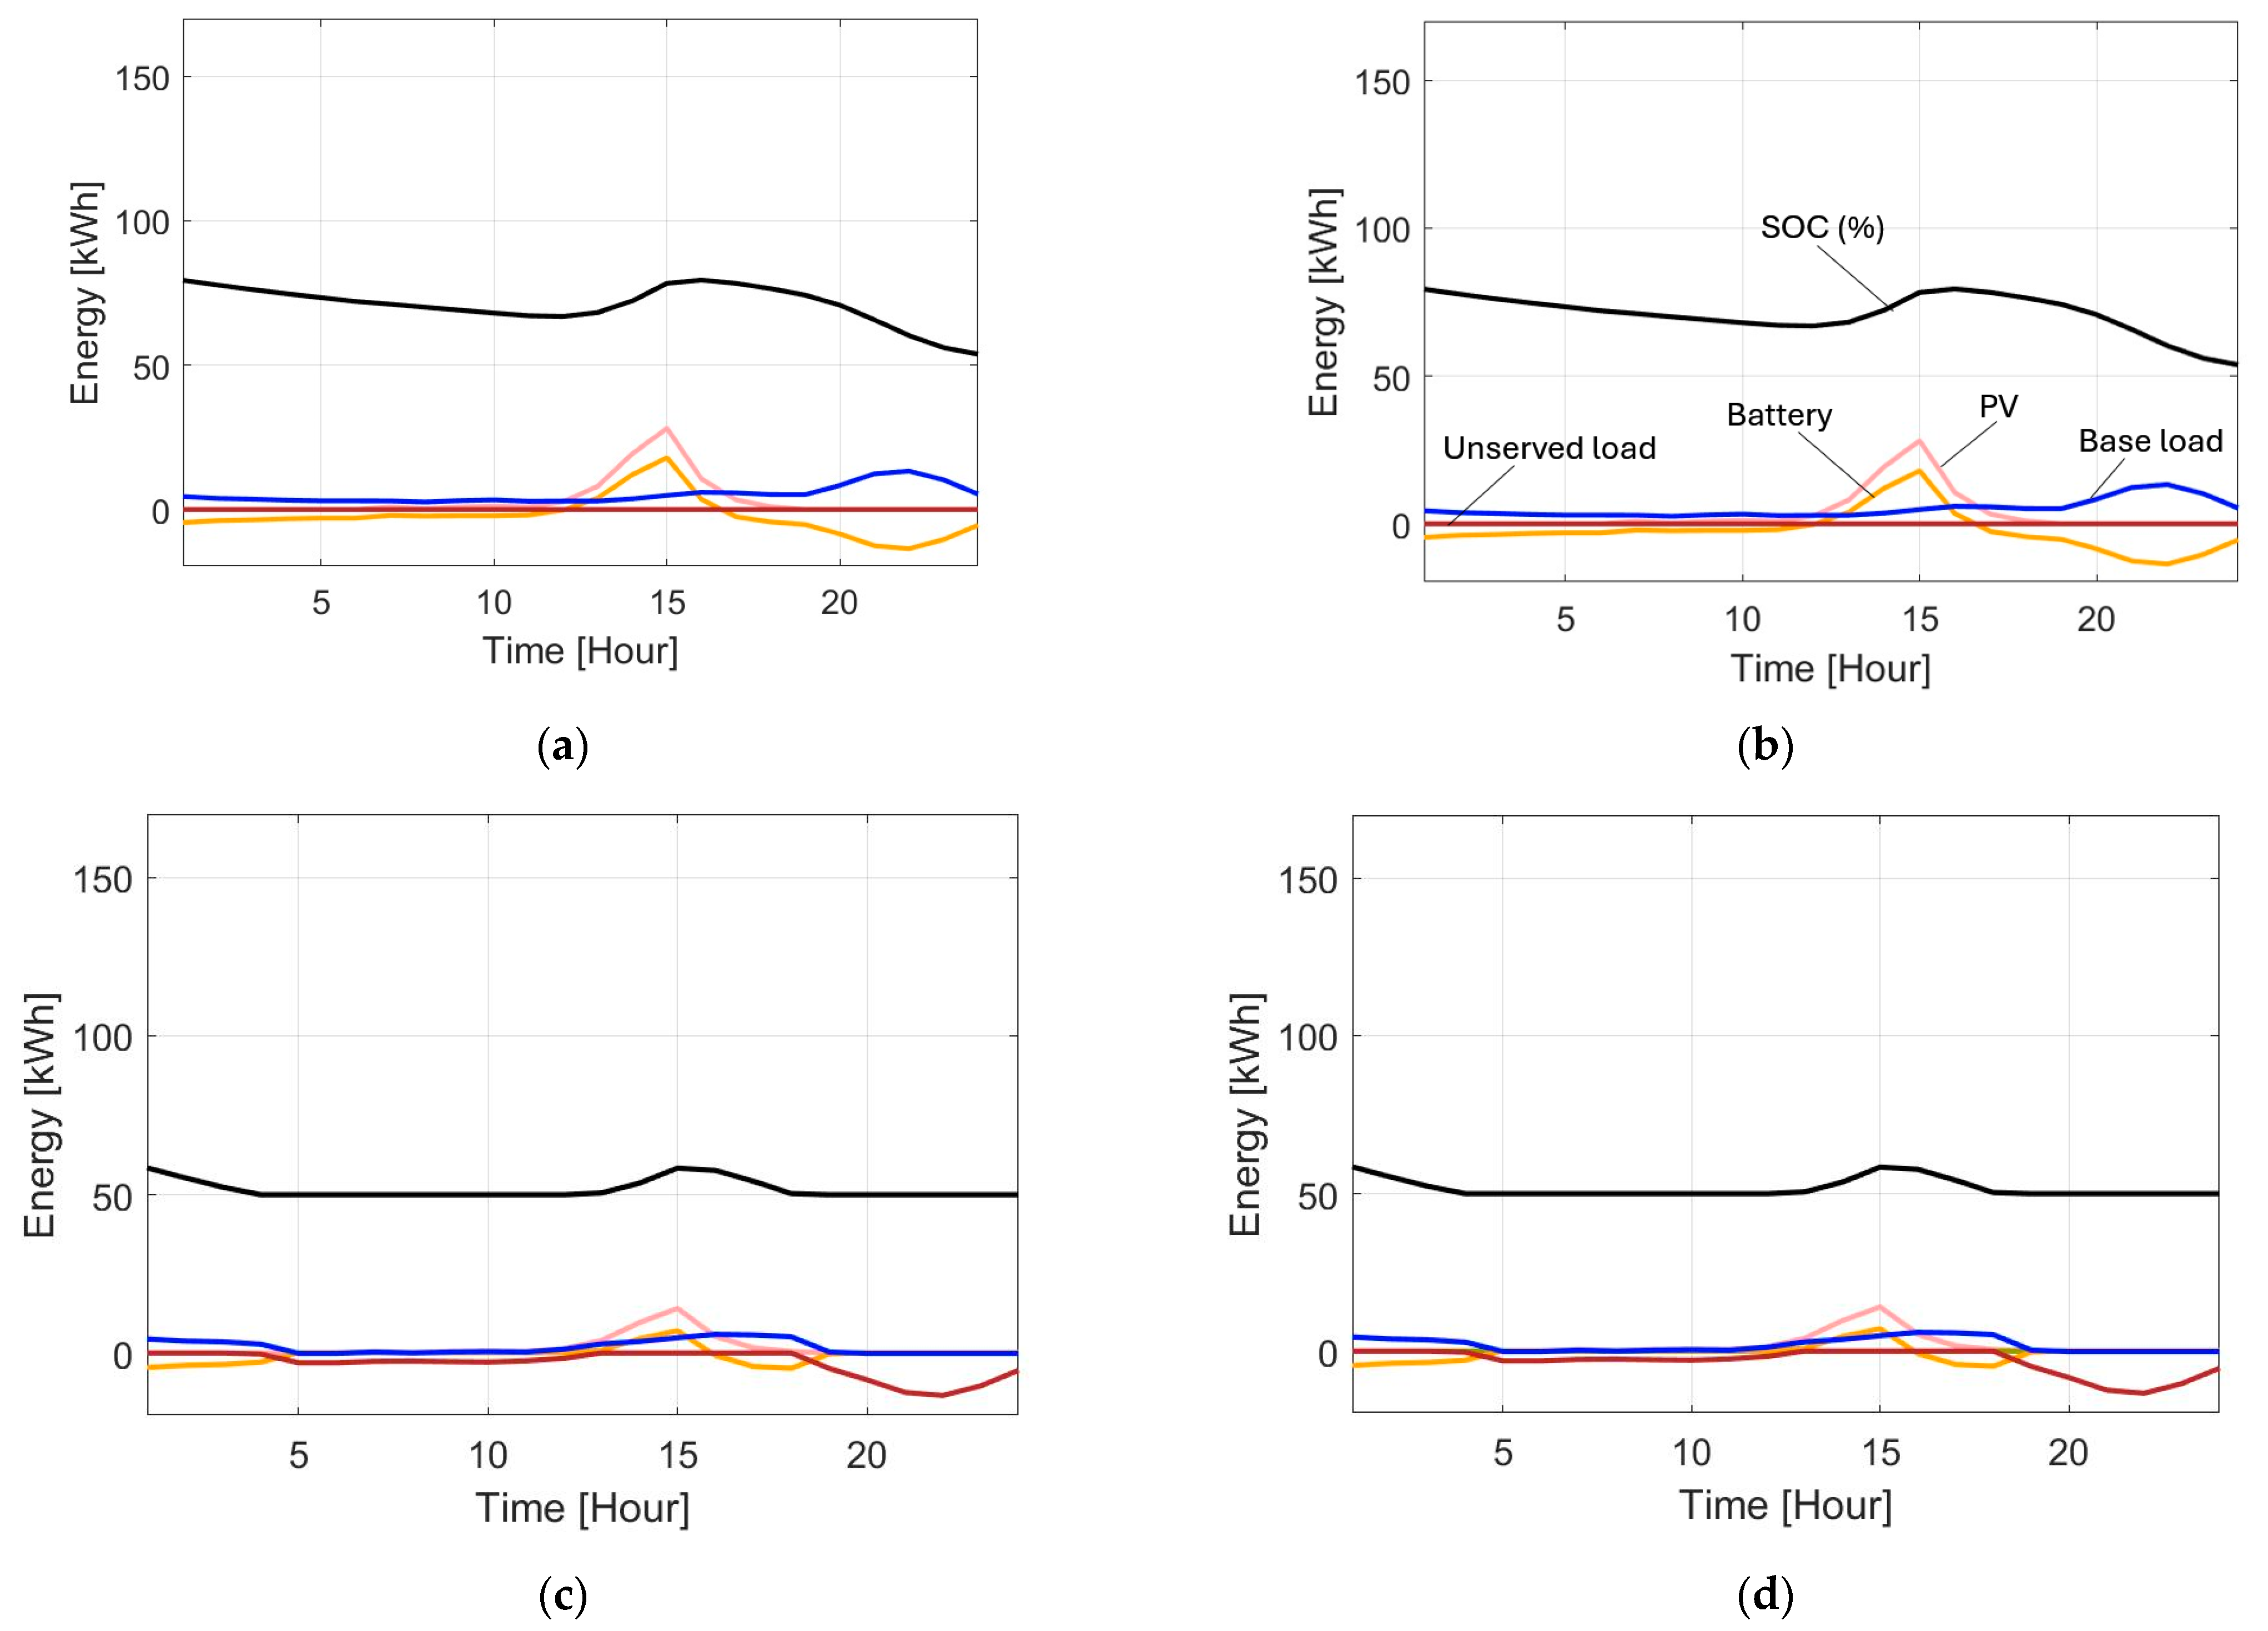
The energy and SOC profiles for Scenarios 1–4 for the day with the lowest total irradiance and hence the lowest PV production over the one-year period are shown in Figure 16. The base case profiles (i.e., for PV capacity 75.84 kWp, battery size 296.64 kWh, and converter rating 80 kW) in Figure 16a for Scenario 1 and Figure 16b for Scenario 2 show that the battery had sufficient energy on that day to meet the base load requirements but not enough to supply the additional loads due to the low PV production. Battery SOC dropped below 60% on that day.
When the PV capacity, battery size, and converter rating are set to half of the base case sizes (37.92 kWp, 148.32 kWh and 40 kW, respectively), the energy and SOC profiles for Scenario 3 (Figure 16c) and Scenario 4 (Figure 16d) show that there is significant unmet load, especially after 2000 h due to the lower generation and storage capacities. Thus, there was more load curtailment for the smaller energy system, as expected. Furthermore, there was no e-bike or portable battery charging. Thus, it is important for there to be sufficient e-bikes and portable batteries to provide autonomy to meet demand and cater for low PV output days.

5.2. E-Mobility and Portable Storage Results

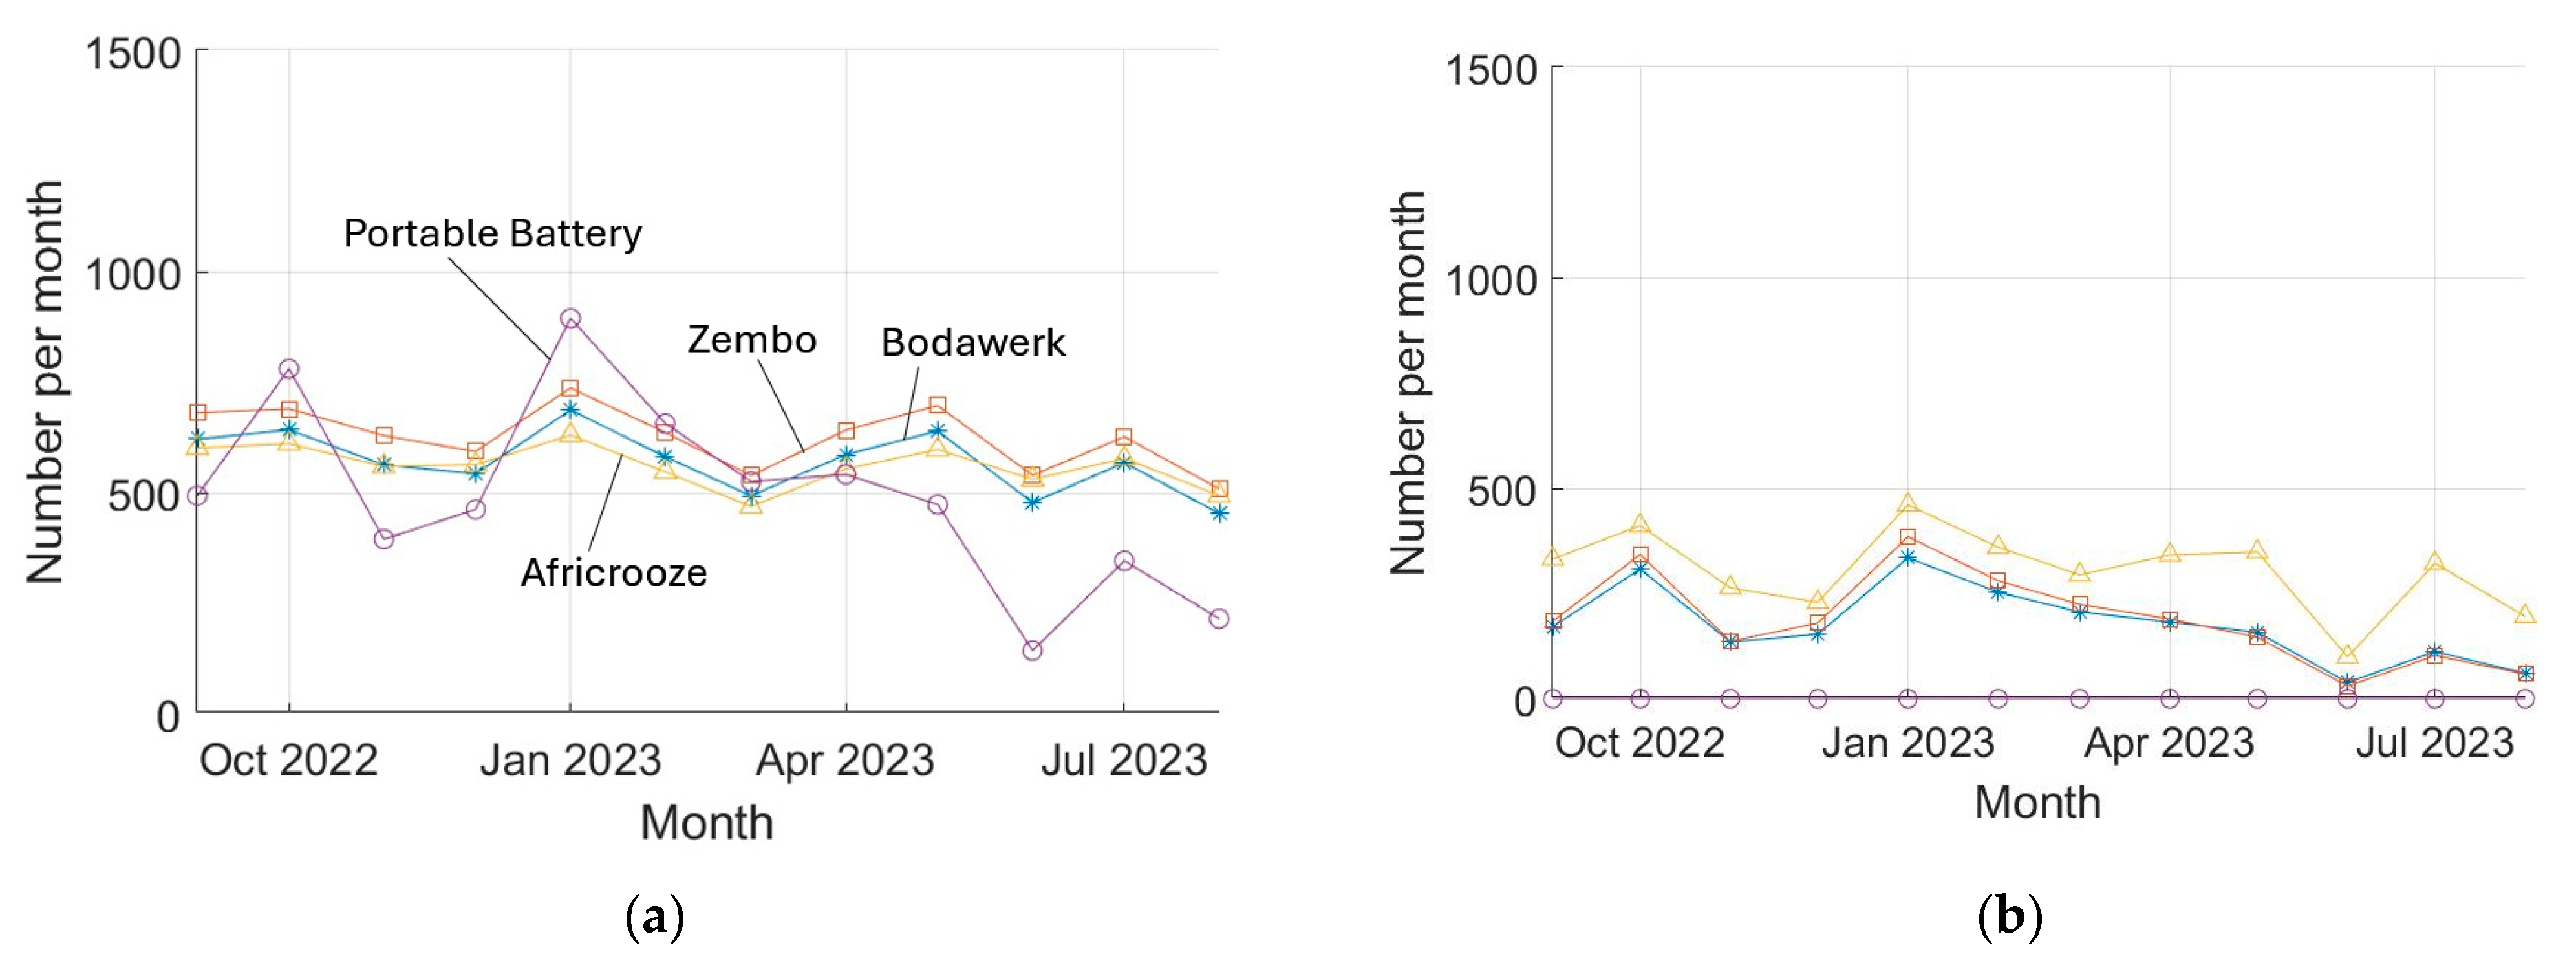
The number of e-bikes and portable batteries charged per month for Scenario 2 and Scenario 4 were plotted in Figure 17. When the PV, battery, and converter capacities were halved (Scenario 4), there was a significant drop in the e-bikes charged due to the reduction in surplus PV. Notable is that integration of portable storage is not an optimal solution for the given charging priorities and capacities, as evidenced by the drop to 0 of portable batteries charged annually (see Figure 17b). Therefore, the choice of additional loads and charging priorities should be adjusted to fit the desired DSM objective.
A comparison with Figure 9 shows that the higher irradiance months of September 2022, October 2022, January 2023, and February 2023 were the months in which there were larger numbers of additional loads charged, as shown in Figure 17.
The annual emissions avoided by integrating electric mobility in Scenario 2 were 73.27 tons of CO2/year, while the emissions avoided by integrating electric mobility in Scenario 4 were 29.20 tons of CO2/year. This is a 60% reduction in annual CO2 emissions avoided, due to the downscaling of PV capacity by 50% and hence reduction in PV surplus energy.

5.3. Economic Results

Most microgrids described in the literature include various combinations of PV, battery, grid, fuel cell, hydro, biomass, and other energy resources. In this work, we analysed systems with only PV and battery. The LCOE values for varying equipment configurations [14,50,87,90,96,97] range from 0.034 USD/kWh to 1.9 USD/kWh. The extremely wide range is due to various factors, including the types of technologies modelled, capital costs and other economic factors used, off-grid or on-grid status, site-dependent weather conditions, etc.
As per Table 6, the LCC for Scenarios 3 and 4 (USD 367,053) is only 27% lower than for Scenarios 1 and 2 (USD 499,918), despite Scenarios 3 and 4 having half the PV, converter and battery capacities of Scenarios 1 and 2 and, thus, lower capital costs. This is because the battery lifetime for Scenarios 3 and 4 of 7.62 years is 46% shorter than that of Scenarios 1 and 2; hence, there were higher battery operational costs due to the increased number of battery replacements required over the project lifetime.
There is a 57% reduction in LCOE from 0.808 to 0.350 due to the inclusion of the e-bikes and portable storage in Scenario 2 relative to Scenario 1, which is closer to the USD 0.30/kWh tariff for Ugandan microgrids [88]. For Scenario 4, there was a 21% reduction in LCOE relative to Scenario 3, from 0.689 to 0.543. All four scenarios gave better LCOE values than that for a stand-alone PV and battery system for Rwanda, which was 1.82 USD/kWh [96].

5.4. Sensitivity Analysis

The effect of varying the battery cost, converter cost, interest rate, battery lifetime, and charging priority weights for the additional loads as compared to the base case (Scenario 1) were investigated.
  • Varying battery capital costs
Table 7 shows the variation in LCC and LCOE when battery capital costs per kWh ( C B a t ) were varied as ±10% and ±20% of the base case (Scenario 1) costs.
Even with a 20% increase in battery capital costs, the integration of e-bikes and portable storage decreased the LCOE by over 50%. A 20% decrease in C B a t yielded a 11% decrease in LCC and a 61% decrease in LCOE. This highlights the large dependence of LCOE on battery costs, due to their high contribution to operational costs.
  • Varying converter capital costs
The converter costs ( C c o n v ) were varied as ±10% and ±20% of the base case (Scenario 1) costs. Table 8 shows the negligible impact of ( C c o n v ) on the LCC and LCOE. Without additional loads, a ±20% change in C c o n v yielded only a ±3% change in both LCC and LCOE as the LCC values became USD 514,743 and USD 485,093. However, the additional loads generated significant improvements in LCOE with over ≥55% LCOE reductions relative to Scenario 1. This implies that the converter cost has a relatively insignificant impact on LCC and LCOE and thus for PV and battery systems, instead of matching the converter size to the peak load [77] or 110% of the peak load [57,61], we recommend to match the converter size to the PV capacity. This has the additional advantage of catering for load growth without soon requiring a converter upgrade.
  • Varying battery lifetime
The significant contribution of the ESS to the LCC costs is highlighted by the increase by 23% and 64% of the LCC with a 7-year and 5-year battery lifetime, respectively, as illustrated in Table 9. When the e-mobility and portable storage loads were integrated, the corresponding LCOE values increased to 0.432 USD/kWh and 0.571 USD/kWh.
  • Varying interest rates
The interest rate was varied as ±10% and ±20% of the base case (Scenario 1). Table 10 shows that increasing the interest rate by 20% results in a 16% decrease in LCC to USD 419,602, while decreasing the interest rate by 20% yields an undesirable 24% rise in LCC. Thus, a higher interest rate yields a lower LCC for the model used. The effect of interest rate changes on the LCOE is negligible.
  • Varying charging priorities for the additional loads
The impact of changing the charging priority of the portable storage loads was investigated by changing the weights from W 1 = W 2 = W 3 = 1 and W 4 = 0.5 in Scenario 1 to W 1 = W 2 = W 3 = W 4 = 1 . The maximum number of each battery type that can be charged daily remain the same as before (see Table 5), i.e., n x n d a i l y m a x for each of the e-bike types is 20, and n x n d a i l y m a x for the portable batteries is 60.
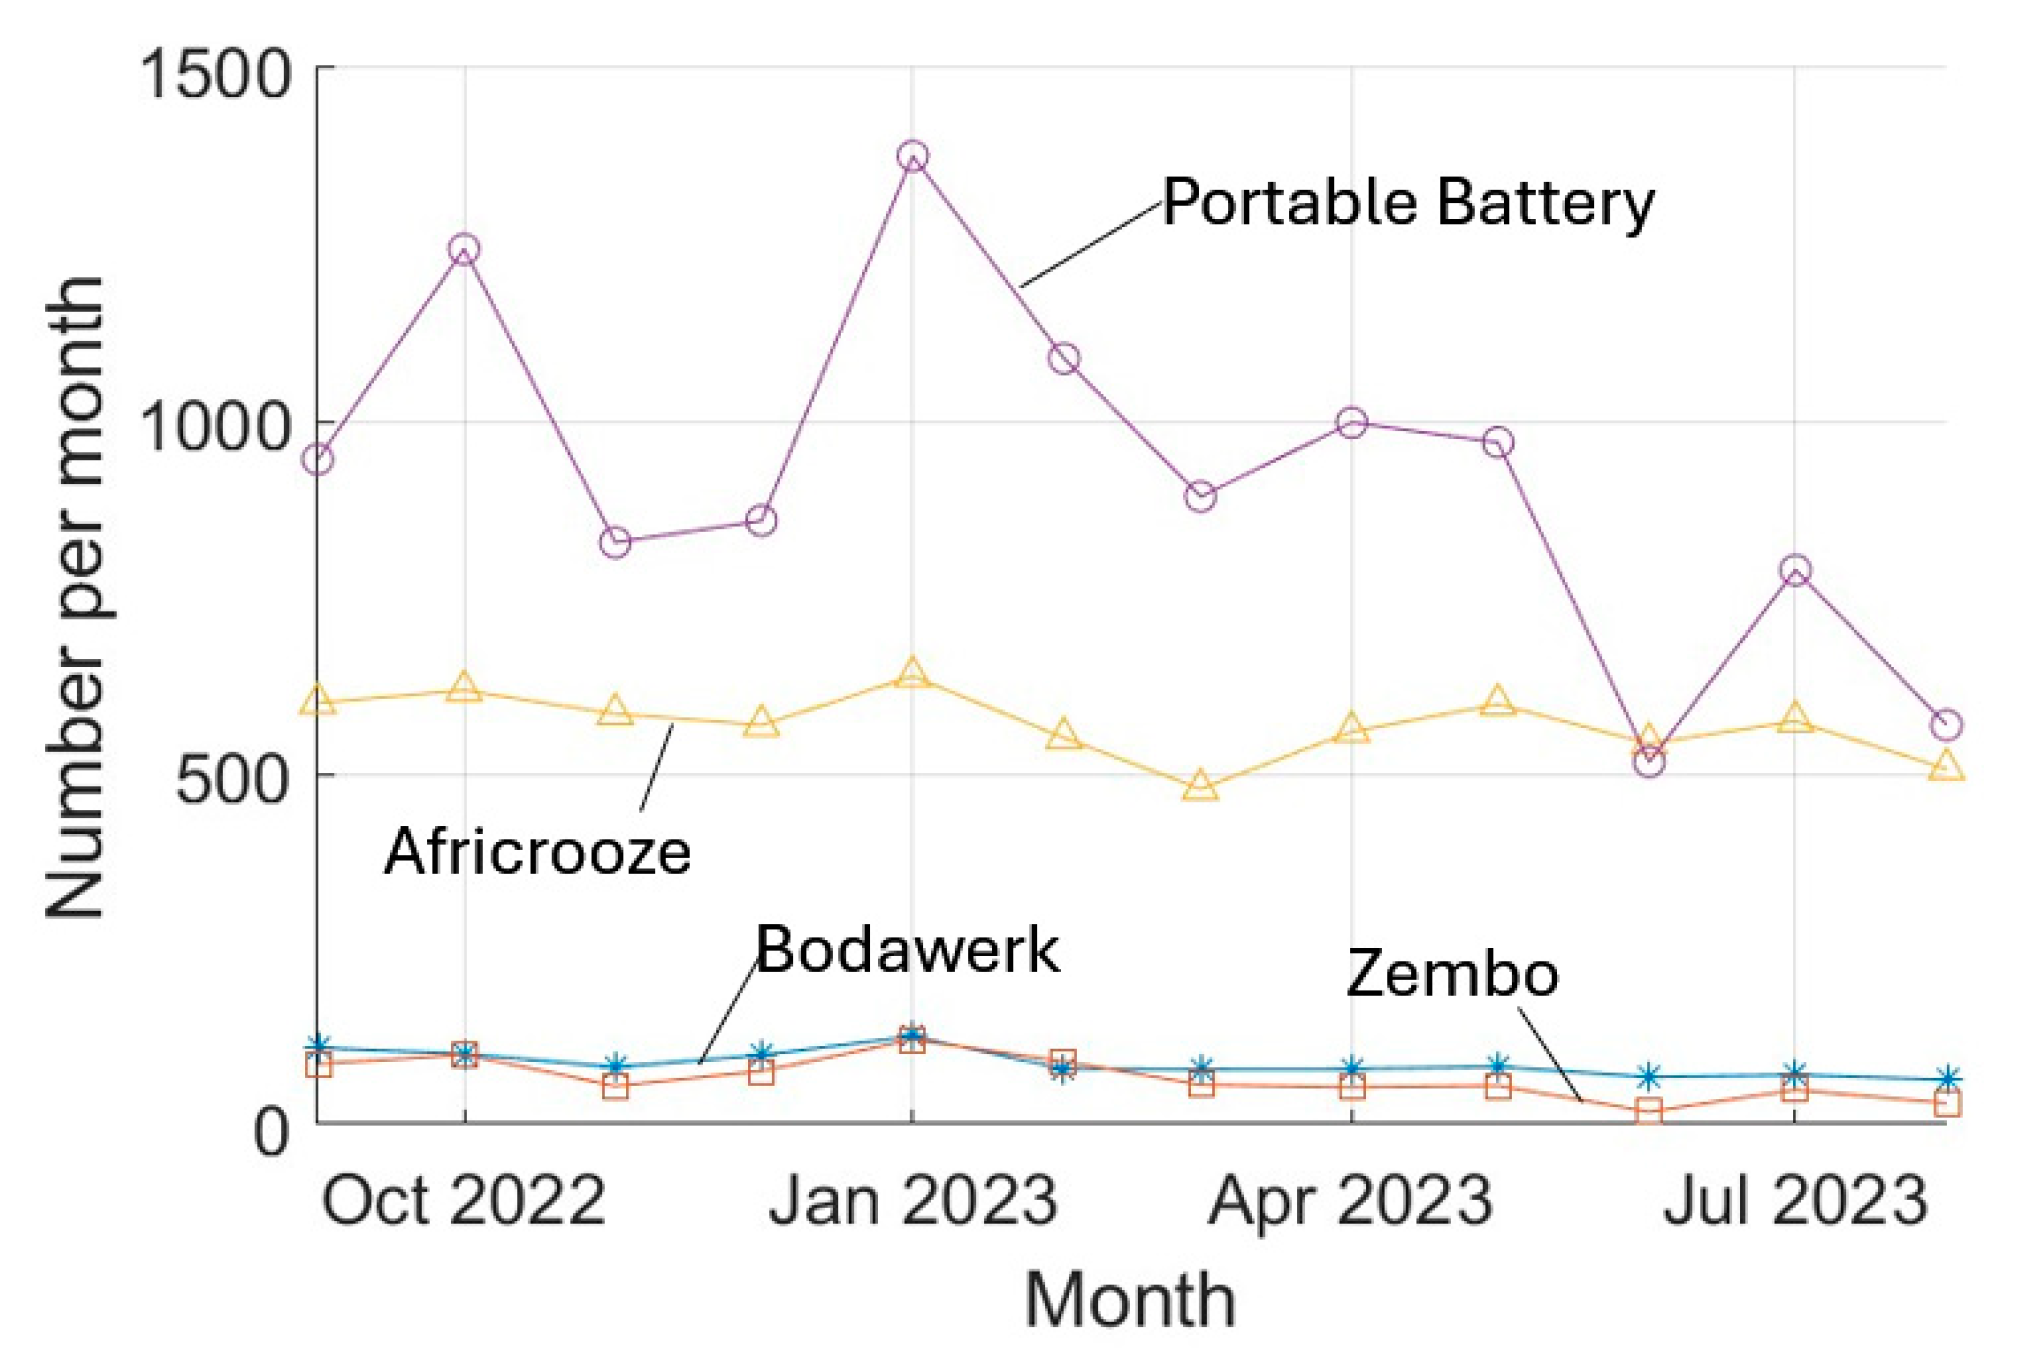
When the weights were made equal, a smaller number of e-bikes were charged (Figure 18) compared to Scenario 2 (see Figure 17b) while the portable storage consumed most of the surplus PV energy. Hence, the off-microgrid customers can be prioritised over the e-bikes by increasing W 4 . The annual number of off-microgrid customers who can be served increased by over 90% to 304 annually. As shown in Table 11, there was a 72% decrease in curtailed PV energy.
When the additional loads are assigned equal weights, the result is equivalent to prioritising off-microgrid customers and de-prioritising emissions reductions from e-mobility. As shown in Table 11, the annual CO2 emissions avoided were reduced to 30.34 tons of CO2/year, and, on average, 30 portable batteries were charged daily.
The constraint on the difference between the number of Zembo and Bodawerk batteries charged daily means only 30% more Bodawerk bikes are charged annually compared to Zembo bikes, while over eight times as many Africrooze bikes compared to Zembo bikes are charged annually. The difference in annual e-bike numbers could be altered by changing the daily targets for each e-bike type as well as the weighting priorities.
To mitigate the challenge of limited charging stations that may be a deterrent to uptake of electric two wheelers, it is recommended that e-mobility and portable storage charging facilities be setup at other off-grid microgrids in the region so as to facilitate ease of battery swapping.

5.5. Benefits of the Proposed Solution

The introduction of e-mobility and portable storage in a microgrid community would elevate energy access in a multi-pronged manner. Portable storage extends electricity to previously unelectrified off-microgrid households and businesses without requiring them to invest in solar home systems or generators. Additionally, cheaper transport for the community and increased earnings of electric two- and three-wheeler riders imply an increased ability to pay for electricity and thus, potentially higher levels of demand. For microgrid developers, increased demand means increased revenue and thus an enhanced ability to maintain and scale up existing microgrids, as well as to setup new microgrids.
This approach can be applied in any microgrid setting where the daytime demand exceeds the solar energy production, and even better where two-and three-wheelers are commonly used, e.g., in India and other African countries.

6. Conclusions

This work analysed load profiles for East African microgrids, and then investigated the integration of electric two-wheelers and portable storage into a solar PV with battery microgrid in Uganda, East Africa. By introducing e-mobility and portable storage, DSM strategic load growth can be achieved, and electricity access can be expanded. This would be an important step toward achieving transport decarbonisation and enhancing microgrid sustainability, as well as augmenting the productive use of energy at rural off-grid microgrids.
Battery degradation was considered. Results showed a 98.5% reduction in PV energy curtailment and a 57% reduction in the LCOE from 0.808 USD/kWh to 0.350 USD/kWh when the electric two-wheeler and portable storage loads were introduced. Avoided emissions of up to 73.27 tons of CO2/year are possible with the proposed e-bikes, and an average of 160 customers could be served annually as off-microgrid consumers without requiring investment in additional distribution infrastructure. Annual revenue could be increased by 135% by incorporating the additional loads, assuming a uniform tariff for all microgrid customers.
Sensitivity analyses were conducted by varying the battery and converter costs, the battery lifetime, the interest rate, and the priority weighting of the additional loads. Battery costs were found to be a major contributor to lifecycle costs and also had a big impact on the LCOE. The interest rate significantly affects the LCC as well.
Most microgrids in Africa use lead–acid battery storage due to the lower upfront costs. However, with a demand surge from e-mobility and portable storage loads, Li-ion batteries would be positioned more favourably as a storage option of choice, given their higher energy density and longer lifetime. An assured, larger demand would mitigate the challenge of higher capital costs that is a deterrent to Li-ion deployment for most rural microgrid developers in emerging economies, due to the uncertainty of anticipated and actual demand levels in rural and off-grid communities.
The introduction of e-mobility and portable storage in a microgrid community can increase energy access in a multi-faceted manner. Portable storage extends electricity to previously unelectrified off-microgrid households and businesses. Cheaper transport for the community, increased earnings of electric two- and three-wheeler riders, and employment opportunities in the e-mobility sector imply an increased ability to pay for electricity and thus, potentially higher levels of demand. Increased demand means increased revenue for the microgrid developers and more funds for maintaining and scaling up existing microgrids as well as for installing new microgrids.
Partnerships and collaboration between microgrid developers and e-mobility and portable storage companies are recommended, as well as a conducive policy and regulatory environment that promotes sustainable e-mobility. It would also be important to have technical personnel available locally to install, maintain, and repair the additional loads and their systems.
Future research could include the modelling of load growth over the project lifetime and the evaluation of other generation sources, storage technologies, different optimisation methods, and incorporation of prediction and forecasting. Flexibility implications of electric two- and three-wheelers and portable storage can also be studied for both isolated and grid-connected microgrids.
Author Contributions

Conceptualization: J.N.K.; methodology, J.N.K.; software S.K. and J.N.K.; validation, S.K., J.N.K. and G.H.P.; formal analysis, J.N.K.; investigation, J.N.K. and G.H.P.; data curation, S.K. and J.N.K.; writing—original draft preparation, J.N.K.; writing—review and editing, J.N.K., G.H.P. and S.K.; visualisation, S.K., J.N.K. and G.H.P.; supervision, S.K.; project administration, S.K.; funding acquisition, S.K. All authors have read and agreed to the published version of the manuscript.

Funding

This research was funded by the German Federal Ministry of Education and Research (BMBF) within the compound assignment “CLIENT II—Art-D Grids: Africa Research and Teaching Platform for Development—Sustainable Modular Grids for Grid Stability”. Project: 03SF0607B.

Institutional Review Board Statement

Not applicable.

Informed Consent Statement

Not applicable.

Data Availability Statement

Data could be available upon request and agreement from the authorised organisations.

Acknowledgments

The authors are grateful to Winch Energy Limited for their support and willingness to provide data and system access for this research. We are also grateful to the Silale microgrid personnel. Our thanks to Aminu Bugaje for the insights on e-mobility.

Conflicts of Interest

The authors declare no conflicts of interest.

Nomenclature

Acronyms
AfEMAAfrica E-Mobility Alliance
AhAmpere hour
CRF Capital Recovery Factor
DODDepth of Discharge
DSMDemand Side Management
E2&3WsElectric two- and three-wheelers
EDREmergency Demand Response
EPRIElectric Power Research Institute
ESSEnergy Storage System
EVElectric Vehicle
HOMERHybrid Optimisation of Multiple Energy Resources
ICEInternal Combustion Engine
IEAInternational Energy Agency
IQRInterquartile Range
LCCLifecycle Costs
LCOELevelized Cost of Energy
LPSPLoss of Power Supply Probability
MIMultiple Imputation
MICEMultivariate Imputation by Chained Equations
MILPMixed-Integer Linear Programming
MLEMaximum Likelihood Estimate
O&MOperation and Maintenance
PCCPoint of Common Coupling
PMParticulate Matter
PSOParticle Swarm Optimisation
Q1First Quartile
Q3Third Quartile
RCARainflow Counting Algorithm
RFIRandom Forest Imputation
SDGSustainable Development Goal
STCStandard Test Conditions
SVRSupport Vector Regressor
VRLAValve Regulated Lead–Acid
Symbols
B r Number of battery replacements over project lifetime
β p v   Upper bound of PV size
β b a t   Upper bound of battery size
B D Battery degradation rate
C B a t Battery capital cost (USD/kWh)
C c o n v Converter capital cost (USD/kW)
C r Number of converter replacements over project lifetime
C R F Capital recovery factor
D O D Depth of discharge
D O D p o r t Portable battery depth of discharge
E B Battery energy (kWh)
E B m a x Maximum battery energy (kWh)
E B m i n Minimum battery energy (kWh)
E G Generated electrical energy (kWh)
E L Hourly base load energy (kWh)
E m o b Energy for e-mobility loads (kWh)
E n x n d a i l y   Energy   supplied   to   load   of   type   x n  daily (kWh)
E p o r t _ u s a b l e Usable energy of portable battery storage (kWh)
E P S Energy for portable storage (kWh)
E P V PV energy produced (kWh)
f Inflation rate
f d Derating factor for PV modules
f o b j MILP objective function
G Incident solar radiation (kW/m2)
G r e f Incident solar radiation at STC (kW/m2)
h Hour
I C C Initial capital cost
i n o m Nominal interest rate
I N S Installation costs
I N S B A T Battery installation costs
I N S C O N V Converter installation costs
I N S P V PV installation costs
K T Temperature   coefficient   of   power   for   solar   PV   modules   ( / ° C )
L b a t Battery lifetime (years)
L C C Lifecycle cost
LCOE Levelized cost of energy
M G c u s t o m e r k w h d a i l y   Average annual energy consumption per microgrid customer
NProject lifetime (years)
η b a t Battery round trip efficiency
η c c Charge controller efficiency
η c o n v Converter efficiency
n c y c l e s ( D O D ) Number of battery cycles as a factor of DOD
n x Component   X ’s operational lifetime (years)
n x n   Number of loads of type x n
n x n d a i l y   Number   of   loads   of   type   x n   charged daily
n x n d a i l y m a x   Maximum   number   of   loads   of   type   x n  charged daily
η p o r t Portable battery converter efficiency
O f f M G Number of off-microgrid customers served annually
O P E X B A T Battery operational costs
O P E X C O N V Converter operational costs
O P E X P V PV operational costs
P B a t Battery power (kW)
P c o n v Converter power rating (kW)
P L Load power (kW)
P L m a x Maximum AC load power demand (kW)
P P V PV output power (kW)
P p v e x c e s s Excess PV power (kW)
P r PV rated power at STC (kW)
P R F U E L Present value of fuel costs
P R O P E X Present value of operating costs
P R R E P Present value of replacement costs
P x n Charging   power   of   load   x n
R E P B A T Battery replacement costs
R E P C O N V Converter replacement costs
r Discount rate
σ Battery self-discharge
Tamb Ambient   temperature   ( )
T c Cell   temperature   ( )
T r e f Reference   temperature   ( )
x n Type of e-mobility or portable storage load
x n b a t _ c a p Battery capacity of load x n (kWh)
x p o r t b a t _ c a p Portable battery capacity (kWh)
X r Number of times component X  is replaced over project lifetime
W x n Priority   weighting   of   load   x n

References

  1. International Institute for Sustainable Development (IISD). SDG7 Bulletin: Global Stocktaking on Sustainable Energy. Available online: https://enb.iisd.org/sites/default/files/2024-04/global_stocktaking_sdg7_0.pdf (accessed on 25 May 2024).
  2. International Energy Agency (IEA). Africa Energy Outlook 2022. 2022. Available online: https://www.oecd-ilibrary.org/energy/africa-energy-outlook_g2120ab250-en (accessed on 29 June 2023).
  3. Africa e-mobility Alliance EAC 2023/4 Finance Acts and e-Mobility. Available online: https://africaema.org/resources/AfEMA_technical_brief_2023_EAC.pdf (accessed on 16 October 2024).
  4. Okello, G.; Reynolds, J. Pathways to e-Mobility Transitions in Uganda: Policy Brief on Transition to Electric Mobility; Institute for Sustainability Leadership, University of Cambridge: Cambridge, UK, 2022. [Google Scholar]
  5. IEA. Global EV Outlook 2022; IEA: Paris, France, 2022. [Google Scholar]
  6. Ouramdane, O.; Elbouchikhi, E.; Amirat, Y.; Gooya, E.S. Optimal Sizing and Energy Management of Microgrids with Vehicle-to-Grid Technology: A Critical Review and Future Trends. Energies 2021, 14, 4166. [Google Scholar] [CrossRef]
  7. IEA. Global EV Outlook 2023; IEA: Paris, France, 2023. [Google Scholar]
  8. Ayetor, G.K.; Mbonigaba, I.; Mashele, J. Feasibility of Electric Two and Three-Wheelers in Africa. Green Energy Intell. Transp. 2023, 2, 100106. [Google Scholar] [CrossRef]
  9. Siemens Stiftung e-Mobility Solutions for Rural Sub-Saharan Africa: Leveraging Economic, Social and Environmental Change. Available online: https://www.siemens-stiftung.org/wp-content/uploads/medien/publikationen/publication-emobility-emobilitysolutionsforruralsubsaharanafrica-siemensstiftung.pdf (accessed on 4 April 2023).
  10. Transitec Consulting Engineers. Analysis of Boda-Boda Operations Paratransit Modernization and Street Usage Study Final Report. Available online: https://transportforcairo.com/wp-content/uploads/2022/11/GKMA_Bodaboda_Final_Report.pdf (accessed on 6 July 2024).
  11. Park, J.; Calzavara, J.; Courtright, T. Environmental and Social Impact Assessment of Electric Motorcycle Taxis in Kampala, Uganda. Master’s Thesis, University of Michigan, Ann Arbor, MI, USA, 2021. [Google Scholar]
  12. Bishop, T.; Barber, C.; Adu, J.; Afukaar, F.; Rettie, N.; Krasnolucka-Hickman, A.; Divall, D.; Porter, G. Enhancing Understanding on Safe Motorcycle and Three-Wheeler Use for Rural Transport. 2019. Available online: https://www.transaid.org/wp-content/uploads/2019/07/RAF2114A_Final-Report_190909_FINAL_Revised.pdf (accessed on 16 October 2024).
  13. Opiyo, N.N. Different Storage-Focused PV-Based Mini-Grid Architectures for Rural Developing Communities. Smart Grid Renew. Energy 2018, 9, 75–99. [Google Scholar] [CrossRef]
  14. Kakande, J.N.; Philipo, G.H.; Krauter, S. Optimal Design of a Semi Grid-Connected PV System for a Site in Lwak, Kenya Using HOMER. In Proceedings of the 8th World Conference on Photovoltaic Energy Conversion, Milan, Italy, 26–30 September 2022; pp. 1463–1468. [Google Scholar]
  15. Electric Power Research Institute (EPRI). Principles and Practice of Demand Side Management; EPRI: Palo Alto, CA, USA, 1993. [Google Scholar]
  16. Pourbabak, H.; Chen, T.; Zhang, B.; Su, W. Control and Energy Management System in Microgrids. In Clean Energy Microgrids; Obara, S., Morel, J., Eds.; Institution of Engineering and Technology (IET): London, UK, 2017. [Google Scholar]
  17. Rodrigues, L.S.; Marques, D.L.; Ferreira, J.A.; Costa, V.A.F.; Martins, N.D.; Neto Da Silva, F.J. The Load Shifting Potential of Domestic Refrigerators in Smart Grids: A Comprehensive Review. Energies 2022, 15, 7666. [Google Scholar] [CrossRef]
  18. Meliani, M.; Barkany, A.E.; Abbassi, I.E.; Darcherif, A.M.; Mahmoudi, M. Energy Management in the Smart Grid: State-of-the-Art and Future Trends. Int. J. Eng. Bus. Manag. 2021, 13, 1–26. [Google Scholar] [CrossRef]
  19. Prasad, J.; Jain, T.; Sinha, N.; Rai, S. Load Shifting Based DSM Strategy for Peak Demand Reduction in a Microgrid. In Proceedings of the 2020 International Conference on Emerging Frontiers in Electrical and Electronic Technologies, ICEFEET 2020, Patna, India, 10–11 July 2020; pp. 1–6. [Google Scholar]
  20. Philipo, G.H.; Kakande, J.N.; Krauter, S. Neural Network-Based Demand-Side Management in a Stand-Alone Solar PV-Battery Microgrid Using Load-Shifting and Peak-Clipping. Energies 2022, 15, 5215. [Google Scholar] [CrossRef]
  21. Alsaidan, I.S. Optimal Planning of Microgrid-Integrated Battery Energy Storage. Ph.D. Thesis, University of Denver, Denver, CO, USA, 2018. [Google Scholar]
  22. Bhamidi, L.; Sivasubramani, S. Optimal Sizing of Smart Home Renewable Energy Resources and Battery under Prosumer-Based Energy Management. IEEE Syst. J. 2021, 15, 105–113. [Google Scholar] [CrossRef]
  23. Xu, J.; Yan, C.; Xu, Y.; Shi, J.; Sheng, K.; Xu, X. A Hierarchical Game Theory Based Demand Optimization Method for Grid-Interaction of Energy Flexible Buildings. Front. Energy Res. 2021, 9, 736439. [Google Scholar] [CrossRef]
  24. CrossBoundary LLC. Energy 4 Impact. In Innovation Insight: Machine Learning to Predict Mini-Grid Consumption; CrossBoundary LLC: Nairobi, Kenya, 2019. [Google Scholar]
  25. Williams, N.J.; Jaramillo, P.; Cornell, B.; Lyons-Galante, I.; Wynn, E. Load Characteristics of East African Microgrids. In Proceedings of the 2017 IEEE PES-IAS PowerAfrica Conference Harnessing Energy, Information and Communications Technology Affordable Electricity Africa, PowerAfrica 2017, Accra, Ghana, 27–30 June 2017; pp. 236–241. [Google Scholar] [CrossRef]
  26. Williams, N.J.; Jaramillo, P.; Campbell, K.; Musanga, B.; Lyons-Galante, I. Electricity Consumption and Load Profile Segmentation Analysis for Rural Micro Grid Customers in Tanzania. In Proceedings of the 2018 IEEE PES/IAS PowerAfrica, PowerAfrica 2018, Cape Town, South Africa, 26–29 June 2018; pp. 360–365. [Google Scholar] [CrossRef]
  27. Yoder, E.; Williams, N.J. Load Profile Prediction Using Customer Characteristics. In Proceedings of the 2020 IEEE PES/IAS PowerAfrica, PowerAfrica 2020, Nairobi, Kenya, 25–28 August 2020. [Google Scholar] [CrossRef]
  28. Mwammenywa, I.; Hilleringmann, U. Analysis of Electricity Power Generation and Load Profiles in Solar PV Microgrids in Rural Villages of East Africa: Case of Mpale Village in Tanzania. In Proceedings of the IEEE Africon Conference 2023, Nairobi, Kenya, 20–22 September 2023. [Google Scholar]
  29. Winch Energy Winch Energy News. Available online: https://www.winchenergypower.com/category/news/ (accessed on 12 September 2024).
  30. PREO. Charging Ahead—Accelerating e-Mobility in Africa. 2023. Available online: https://www.preo.org/reports/charging-ahead-accelerating-e-mobility-in-africa/ (accessed on 25 July 2024).
  31. Bugaje, A.; Ehrenwirth, M.; Trinkl, C.; Zoerner, W. Investigating the Performance of Rural Off-Grid Photovoltaic System with Electric-Mobility Solutions: A Case Study Based on Kenya. J. Sustain. Dev. Energy Water Environ. Syst. 2022, 10, 1090391. [Google Scholar] [CrossRef]
  32. Bugaje, A.; Ehrenwirth, M.; Trinkl, C.; Zörner, W. Electric Two-Wheeler Vehicle Integration into Rural off-Grid Photovoltaic System in Kenya. Energies 2021, 14, 7956. [Google Scholar] [CrossRef]
  33. Raabe, M.; Sophia, S.; Fahsold, K.; Roche, M.Y. Sustainable e-Mobility. Available online: https://sesa-euafrica.eu/wp-content/uploads/2024/02/SESA-factsheet-1-Emobility_Approved.pdf (accessed on 25 July 2024).
  34. Plötz, P.; Moll, C.; Bieker, G.; Mock, P. From Lab-to-Road: Real-World Fuel Consumption and CO2 Emissions of Plug-in Hybrid Electric Vehicles. Environ. Res. Lett. 2021, 16, 054078. [Google Scholar] [CrossRef]
  35. RENAC Fact Sheet e-Mobility. Available online: https://www.renac.de/fileadmin/renac/media/Projects/Soaring/Soaring_Fact_sheet_E-Mobility.pdf (accessed on 2 August 2024).
  36. Ayetor, G.K.; Mbonigaba, I.; Ampofo, J.; Sunnu, A. Investigating the State of Road Vehicle Emissions in Africa: A Case Study of Ghana and Rwanda. Transp. Res. Interdiscip. Perspect. 2021, 11, 100409. [Google Scholar] [CrossRef]
  37. EEB; ECOS. Deutsche Umwelthilfe. In What Is the Environmental Impact of Electric Cars; Environmental Action Germany (Deutsche Umwelthilfe—DUH): Radolfzell, Germany, 2023. [Google Scholar]
  38. Unterluggauer, T.; Rich, J.; Andersen, P.B.; Hashemi, S. Electric Vehicle Charging Infrastructure Planning for Integrated Transportation and Power Distribution Networks: A Review. eTransportation 2022, 12, 100163. [Google Scholar] [CrossRef]
  39. Kuhudzai, R.J. Bodawerk Rebrands To GOGO, Launches New Electric Motorcycle & Partners with Watu to Fund Expansion in Uganda. Available online: https://cleantechnica.com/2023/10/06/bodawerk-rebrands-to-gogo-launches-new-electric-motorcycle-partners-with-watu-to-fund-expansion-in-uganda/ (accessed on 27 July 2024).
  40. Engineering for Change Bodawerk e-Boda Electric Motorcycle. Available online: https://www.engineeringforchange.org/solutions/product/bodawerk-e-boda-electric-motorcycle/ (accessed on 27 July 2024).
  41. VOA in Uganda’s Chaotic Capital, Motorcycle Taxis Are a Source of Life and Death. Available online: https://www.voanews.com/a/in-uganda-s-chaotic-capital-motorcycle-taxis-are-a-source-of-life-and-death-/7749369.html (accessed on 21 August 2024).
  42. Kuhudzai, R.J. Strong e-Mobility Focus at the Recent Lake Basin Region Innovation & Investment Week in Kisumu. Available online: https://cleantechnica.com/2019/11/25/strong-e-mobility-focus-at-the-recent-lake-basin-region-innovation-investment-week-in-kisumu/ (accessed on 27 July 2024).
  43. Africa e-Mobility Alliance Electric Vehicle Data—Kenya. Available online: https://www.africaema.org/data (accessed on 25 July 2024).
  44. Redaktion Solar-Powered Mobility. Available online: https://www.kfw.de/stories/environment/climate-action/africrooze/ (accessed on 27 July 2024).
  45. Kuranel, N.R.; Mohapatra, D. e-Mobility & DRE Innovations in Emerging Economies. 2022. Available online: https://itpo-germany.org/PDF/E-Mobility%20&%20DRE%20Innovations.pdf (accessed on 27 July 2024).
  46. Khezri, R.; Member, S.; Mahmoudi, A.; Member, S.; Haque, M.H.; Member, S. A Demand Side Management Approach For Optimal Sizing of Standalone Renewable-Battery Systems. IEEE Trans. Sustain. Energy 2021, 12, 2184–2194. [Google Scholar] [CrossRef]
  47. Arun, S.L.; Selvan, M.P. Intelligent Residential Energy Management System for Dynamic Demand Response in Smart Buildings. IEEE Syst. J. 2018, 12, 1329–1340. [Google Scholar] [CrossRef]
  48. Bugaje, A.; Ehrenwirth, M.; Trinkl, C.; Bär, K.; Zörner, W. Development of a Load Management Algorithm Using Nonlinear Programming (NLP) for Optimum Integration of Electric-Mobility Solutions into Rural off-Grid PV Systems. In Proceedings of the NEIS 2020—Conference on Sustainable Energy Supply and Energy Storage Systems, Hamburg, Germany, 14–15 September 2020. [Google Scholar]
  49. NASA. NASA Data Access Viewer. Available online: https://power.larc.nasa.gov/data-access-viewer/ (accessed on 31 May 2024).
  50. Seremba, N.E.; Ssemakula, F.; Namaganda-Kiyimba, J.; Kakande, J.N. Integration of the Centralized Grid and Decentralized Renewable Energy Off-Grid Systems: A Techno-Economic Analysis. In Proceedings of the 2024 IEEE Conference on Technologies for Sustainability (SusTech), Portland, OR, USA, 14–17 April 2024; IEEE: Portland, OR, USA, 2024; pp. 257–263. [Google Scholar]
  51. Shapi, M.K.M.; Ramli, N.A.; Awalin, L.J. Energy Consumption Prediction by Using Machine Learning for Smart Building: Case Study in Malaysia. Dev. Built Environ. 2021, 5, 100037. [Google Scholar] [CrossRef]
  52. Hussain, S.; Mustafa, M.W.; Ateyeh Al-Shqeerat, K.H.; Saleh Al-rimy, B.A.; Saeed, F. Electric Theft Detection in Advanced Metering Infrastructure Using Jaya Optimized Combined Kernel-Tree Boosting Classifier—A Novel Sequentially Executed Supervised Machine Learning Approach. IET Gener. Transm. Distrib. 2022, 16, 1257–1275. [Google Scholar] [CrossRef]
  53. Dhungana, H.; Bellotti, F.; Berta, R.; De Gloria, A. Performance Comparison of Imputation Methods in Building Energy Data Sets. In Applications in Electronics Pervading Industry, Environment and Society; Saponara, S., De Gloria, A., Eds.; Springer Nature: Cham, Switzerland, 2021; p. 150. [Google Scholar]
  54. Petrazzini, B.O.; Naya, H.; Lopez-Bello, F.; Vazquez, G.; Spangenberg, L. Evaluation of Different Approaches for Missing Data Imputation on Features Associated to Genomic Data. BioData Min. 2021, 14, 44. [Google Scholar] [CrossRef]
  55. Rosado-Galindo, H.; Dávila-Padilla, S. Tree-Based Missing Value Imputation Using Feature Selection. J. Data Sci. 2020, 18, 606–631. [Google Scholar] [CrossRef]
  56. Dixneuf, P.; Errico, F.; Glaus, M. A Computational Study on Imputation Methods for Missing Environmental Data. arXiv 2021, arXiv:2108.09500. [Google Scholar] [CrossRef]
  57. P Kumar, P.; Saini, R.P. Optimization of an Off-Grid Integrated Hybrid Renewable Energy System with Various Energy Storage Technologies Using Different Dispatch Strategies. Energy Sources Part A Recover. Util. Environ. Eff. 2020, 1–30. [Google Scholar] [CrossRef]
  58. Kebede, A.A.; Berecibar, M.; Coosemans, T.; Messagie, M.; Jemal, T.; Behabtu, H.A.; Van Mierlo, J. A Techno-Economic Optimization and Performance Assessment of a 10 KWP Photovoltaic Grid-Connected System. Sustainability 2020, 12, 7648. [Google Scholar] [CrossRef]
  59. Wu, Y.; Liu, Z.; Li, B.; Liu, J.; Zhang, L. Energy Management Strategy and Optimal Battery Capacity for Flexible PV-Battery System under Time-of-Use Tariff. Renew. Energy 2022, 200, 558–570. [Google Scholar] [CrossRef]
  60. Brihmat, F.; Mekhtoub, S. PV Cell Temperature/PV Power Output Relationships Homer Methodology Calculation. IPCO. 2014. Available online: https://www.semanticscholar.org/paper/PV-Cell-Temperature-PV-Power-Output-Relationships-Brihmat-Mekhtoub/81ca5f5da5e2e77ef9b420439c6d057fcae70849 (accessed on 7 July 2024).
  61. Kumar, P.P.; Suresh, V.; Jasinski, M.; Leonowicz, Z. Off-grid Rural Electrification in India Using Renewable Energy Resources and Different Battery Technologies with a Dynamic Differential Annealed Optimization. Energies 2021, 14, 5866. [Google Scholar] [CrossRef]
  62. Silva, V.A.; Aoki, A.R.; Lambert-Torres, G. Optimal Day-Ahead Scheduling of Microgrids with Battery Energy Storage System. Energies 2020, 13, 5188. [Google Scholar] [CrossRef]
  63. Zebra, E.I.C.; van der Windt, H.J.; Nhumaio, G.; Faaij, A.P.C. A Review of Hybrid Renewable Energy Systems in Mini-Grids for off-Grid Electrification in Developing Countries. Renew. Sustain. Energy Rev. 2021, 144, 111036. [Google Scholar] [CrossRef]
  64. Antonanzas-Torres, F.; Antonanzas, J.; Blanco-Fernandez, J. State-of-the-Art of Mini Grids for Rural Electrification in West Africa. Energies 2021, 14, 990. [Google Scholar] [CrossRef]
  65. Delgado-Sanchez, J.M.; Lillo-Bravo, I. Influence of Degradation Processes in Lead-Acid Batteries on the Technoeconomic Analysis of Photovoltaic Systems. Energies 2020, 13, 4075. [Google Scholar] [CrossRef]
  66. Opiyo, N.N. Modelling Temporal Diffusion of PV Microgeneration Systems in a Rural Developing Community. Ph.D. Thesis, University of Leeds, Leeds, UK, 2016. [Google Scholar]
  67. Ouédraogo, S.; Faggianelli, G.A.; Pigelet, G.; Notton, G.; Duchaud, J.L. Performances of Energy Management Strategies for a Photovoltaic/Battery Microgrid Considering Battery Degradation. Sol. Energy 2021, 230, 654–665. [Google Scholar] [CrossRef]
  68. Ya’acob, N.; Apandi, A.S.G.A.; Yuso, A.L.; Kassim, M.; Naim, N.F. Prediction of Battery Lifetime Using Hybrid Solar Power System. Math. Stat. Eng. Appl. 2022, 71, 208–224. [Google Scholar] [CrossRef]
  69. Hoppecke Manual for Hoppecke VRLA Batteries. Available online: https://www.hoppecke.com/fileadmin/Redakteur/Hoppecke-Main/Products-Import/vrl_manual_de.pdf (accessed on 10 September 2024).
  70. Dragičević, T.; Pandžić, H.; Škrlec, D.; Kuzle, I.; Guerrero, J.M.; Kirschen, D.S. Capacity Optimization of Renewable Energy Sources and Battery Storage in an Autonomous Telecommunication Facility. IEEE Trans. Sustain. Energy 2014, 5, 1367–1378. [Google Scholar] [CrossRef]
  71. Correa, C.A.; Gerossier, A.; Michiorri, A.; Kariniotakis, G. Optimal Scheduling of Storage Devices in Smart Buildings Including Battery Cycling. In Proceedings of the 2017 IEEE Manchester PowerTech, Powertech 2017, Manchester, UK, 18–22 June 2017; pp. 1–6. [Google Scholar] [CrossRef]
  72. Luo, X.; Barreras, J.V.; Chambon, C.L.; Wu, B.; Batzelis, E. Hybridizing Lead–Acid Batteries with Supercapacitors: A Methodology. Energies 2021, 14, 507. [Google Scholar] [CrossRef]
  73. Mandelli, S.; Brivio, C.; Colombo, E.; Merlo, M. A Sizing Methodology Based on Levelized Cost of Supplied and Lost Energy for Off-Grid Rural Electrification Systems. Renew. Energy 2016, 89, 475–488. [Google Scholar] [CrossRef]
  74. Downing, S.D.; Socie, D.F. Simple Rainflow Counting Algorithms. Int. J. Fatigue 1982, 4, 31–40. [Google Scholar] [CrossRef]
  75. Schreiber, M.; Wainstein, M.E.; Hochloff, P.; Dargaville, R. Flexible Electricity Tariffs: Power and Energy Price Signals Designed for a Smarter Grid. Energy 2015, 93, 2568–2581. [Google Scholar] [CrossRef]
  76. Mongird, K.; Viswanathan, V.; Alam, J.; Vartanian, C.; Sprenkle, V.; Baxter, R. 2020 Grid Energy Storage Technology Cost and Performance Assessment. 2020. Available online: https://www.pnnl.gov/sites/default/files/media/file/Final%20-%20ESGC%20Cost%20Performance%20Report%2012-11-2020.pdf (accessed on 30 June 2023).
  77. Kebede, A.A.; Coosemans, T.; Messagie, M.; Jemal, T.; Behabtu, H.A.; Van Mierlo, J.; Berecibar, M. Techno-Economic Analysis of Lithium-Ion and Lead-Acid Batteries in Stationary Energy Storage Application. J. Energy Storage 2021, 40, 102748. [Google Scholar] [CrossRef]
  78. SMA Sunny Tripower 15000TL/20000TL/25000TL. Available online: https://files.sma.de/downloads/STP15-25TL-30-DS-en-41.pdf (accessed on 7 July 2024).
  79. Weiss, M.; Cloos, K.C.; Helmers, E. Energy Efficiency Trade-Offs in Small to Large Electric Vehicles. Environ. Sci. Eur. 2020, 32, 46. [Google Scholar] [CrossRef]
  80. ARE Bodawerk–Shareable & Circular Li-Ion Batteries for Africa (Uganda). Available online: https://www.ruralelec.org/case-study/bodawerk-shareable-circular-li-ion-batteries-africa-uganda/ (accessed on 27 July 2024).
  81. ARE Hybrid Solar PV System Installed for Zembo Motorcycles in Uganda. Available online: https://aptechafrica.com/hybrid-solar-pv-system-installed-for-zembo-motorcycles-in-uganda/ (accessed on 27 July 2024).
  82. Courtright, T.R. Introducing the Quarterly Kampala Boda Report. Available online: https://medium.com/lubyanza/introducing-the-quarterly-kampala-boda-report-718426589984 (accessed on 6 July 2024).
  83. Bodawerk Homepage. Available online: https://bodawerk.com/energy (accessed on 20 August 2024).
  84. Zembo Homepage. Available online: https://www.zem.bo (accessed on 20 August 2024).
  85. AfricroozE Homepage. Available online: https://africrooze.com/en/ (accessed on 20 August 2024).
  86. Elkholy, M.H.; Said, T.; Elymany, M.; Senjyu, T.; Gamil, M.M.; Song, D.; Ueda, S.; Lotfy, M.E. Techno-Economic Configuration of a Hybrid Backup System within a Microgrid Considering Vehicle-to-Grid Technology: A Case Study of a Remote Area. Energy Convers. Manag. 2024, 301, 118032. [Google Scholar] [CrossRef]
  87. Mouachi, R.; Jallal, M.A.; Gharnati, F.; Raoufi, M. Multiobjective Sizing of an Autonomous Hybrid Microgrid Using a Multimodal Delayed PSO Algorithm: A Case Study of a Fishing Village. Comput. Intell. Neurosci. 2020, 2020, 8894094. [Google Scholar] [CrossRef]
  88. Mahomed, S.; Shirley, R.; Tice, D.; Phillips, J. Business Model Innovations for Utility and Mini-Grid Integration: Insights from the Utilities 2.0 Initiative in Uganda 2020. Available online: https://www.energyeconomicgrowth.org/www.energyeconomicgrowth.org/sites/default/files/2020-12/EEG%20Energy%20Insight%20_Insights%20from%20the%20Utilities%202.0%20initiative%20in%20Uganda.pdf (accessed on 27 March 2021).
  89. MoFPED. Performance of the Economy-Monthly Report August 2021; MoFPED: Kampala, Uganda, 2021.
  90. Omotoso, H.O.; Al-Shaalan, A.M.; Farh, H.M.H.; Al-Shamma’a, A.A. Techno-Economic Evaluation of Hybrid Energy Systems Using Artificial Ecosystem-Based Optimization with Demand Side Management. Electronics 2022, 11, 204. [Google Scholar] [CrossRef]
  91. Hu, B.; Wang, H.; Yao, S. Optimal Economic Operation of Isolated Community Microgrid Incorporating Temperature Controlling Devices. Prot. Control Mod. Power Syst. 2017, 2, 6. [Google Scholar] [CrossRef]
  92. Philipo, G.H.; Kakande, J.N.; Krauter, S. Combined Economic and Emission Dispatch of a Microgrid Considering Multiple Generators. In Proceedings of the 2023 IEEE PES/IAS PowerAfrica, PowerAfrica 2023, Marrakech, Morocco, 6–10 November 2023; pp. 1–5. [Google Scholar]
  93. Mathew, M.; Hossain, M.S.; Saha, S.; Mondal, S.; Haque, M.E. Sizing Approaches for Solar Photovoltaic-Based Microgrids: A Comprehensive Review. IET Energy Syst. Integr. 2022, 4, 12048. [Google Scholar] [CrossRef]
  94. Bugaje, A.I. Standalone Solar-Based Power Supply for Electric Mobility in Rural Areas of Developing Countries. Ph.D. Thesis, Technische Universität Berlin, Berlin, Germany, 2023. [Google Scholar]
  95. Afzal, W.; Zhao, L.-Y.; Chen, G.-Z.; Xue, Y. Hybrid Wind/PV E-Bike Charging Station: Comparison of Onshore and Offshore Systems. Sustainability 2023, 15, 14963. [Google Scholar] [CrossRef]
  96. Nsengimana, C.; Han, X.T.; Li, L.L. Comparative Analysis of Reliable, Feasible, and Low-Cost Photovoltaic Microgrid for a Residential Load in Rwanda. Int. J. Photoenergy 2020, 2020, 8855477. [Google Scholar] [CrossRef]
  97. Nallolla, C.A.; Vijayapriya, P. Optimal Design of a Hybrid Off-Grid Renewable Energy System Using Techno-Economic and Sensitivity Analysis for a Rural Remote Location. Sustainability 2022, 14, 5393. [Google Scholar] [CrossRef]
Figure 1. General setup of the eight microgrids in Uganda.
Solar 04 00033 g001
Figure 2. Average daily consumption of customers of eight microgrids in Uganda.
Solar 04 00033 g002
Figure 3. Silale microgrid setup.
Solar 04 00033 g003
Figure 4. (a) Silale measurement setup; (b) Mavowatt and Kipp and Zonen Meteon display for the SP Lite2 irradiance meter.
Solar 04 00033 g004
Figure 5. Average load profile for the Silale microgrid from 15 to 29 December 2022.
Solar 04 00033 g005
Figure 6. Senyondo microgrid equipment.
Solar 04 00033 g006
Figure 7. Proposed microgrid loads including e-mobility and portable storage.
Solar 04 00033 g007
Figure 8. The irradiance distribution per hour (curve indicates mean) for the Senyondo (rectangle lower border, inner line, and top border indicate the first quartile (Q1), median, and third quartile (Q3), respectively). The circles outside the rectangles represent outliers i.e. data points outside the range of 1.5 times the IQR (interquartile range) from Q1 and Q3.
Solar 04 00033 g008
Figure 9. Monthly average irradiance and ambient temperature for Senyondo.
Solar 04 00033 g009
Figure 10. Load profile for Senyondo microgrid over 18 months (the dashed line represents the average values).
Solar 04 00033 g010
Figure 11. Average power drawn per weekday for Senyondo microgrid over a year.
Solar 04 00033 g011
Figure 12. Semi-log plot of number of cycles to failure versus DOD at 25 °C for the Hoppecke VR-L battery.
Solar 04 00033 g012
Figure 13. Flow chart of the dispatch and optimisation approach.
Solar 04 00033 g013
Figure 14. Average hourly energy and SOC profiles for the base case for a year: (a) Scenario 1; (b) Scenario 2 with e-bikes and portable storage. Average hourly energy and SOC profiles for the base case for the first week: (c) Scenario 1; (d) Scenario 2 with e-bikes and portable storage. Average hourly energy and SOC values for day 2: (e) Scenario 1; (f) Scenario 2 with e-bikes and portable storage.
Solar 04 00033 g014
Figure 15. Average hourly energy and SOC profiles with half the base case PV, battery, and converter capacities for a year: (a) Scenario 3; (b) Scenario 4 with e-bikes and portable storage. Average hourly energy and SOC profiles with half the base case PV, battery, and converter capacities for the first week: (c) Scenario 3; (d) Scenario 4 with e-bikes and portable storage. Average hourly energy and SOC values for day 2: (e) Scenario 3; (f) Scenario 4 with e-bikes and portable storage.
Solar 04 00033 g015
Figure 16. Average hourly energy and SOC profiles for the base case for the day with the lowest irradiance: (a) Scenario 1; (b) Scenario 2 with e-bikes and portable storage. Average hourly energy and SOC profiles with half the base case PV, battery and converter capacities for the day with the lowest irradiance: (c) Scenario 3; (d) Scenario 4 with e-bikes and portable storage.
Solar 04 00033 g016
Figure 17. Number of portable batteries charged daily and e-bikes that can be charged daily with enough energy for 50 km daily distance (a) Scenario 2; and (b) Scenario 4.
Solar 04 00033 g017
Figure 18. Monthly number of portable batteries and e-bikes charged for 50 km distance for equal charging priorities.
Solar 04 00033 g018
Table 1. Silale microgrid measured power.
Phase APhase BPhase CTotal
Average Power (kW)0.3440.3740.1210.839
Maximum Power (kW)0.7211.2420.4182.093
Table 3. Electric bike and portable storage specifications.
Load TypeCharging Rate (W)Battery Capacity (Wh)E-bike Energy (Wh) Required for 50 km
Bodawerk9002200 Wh1950
Zembo11002160 Wh1830
Africrooze 200500 Wh500
Portable storage10004600 Wh--
Table 4. Economic parameters.
ParameterValueParameterValue
Project   lifetime   ( N )25 years Inflation   rate   ( f )7.5%
Nominal   interest   rate   ( i n o m ) 13%TariffUSD 0.30/kWh
Table 5. E-bike and portable storage daily targets.
Load TypeCharging Rate (W)Battery Capacity (Wh)Charging Priority/Weight Daily   Maximum   Batteries   Charged   ( n x n d a i l y m a x )
Bodawerk9002200120
Zembo11002160120
Africrooze200500120
Portable storage100046000.560
Table 6. Results for Scenarios 1 to 4.
ParameterScenario 1—Base Case (Base Load Only)Scenario 2—Base Case with E-Bikes and Portable StorageScenario 3—(Base Load Only)Scenario 4—(Base Load, E-Bikes and Portable Storage)
PV capacity (kWp)75.8475.8437.9237.92
Battery capacity (kWh)296.64296.64148.32148.32
Converter rating (kW)80804040
LCC (USD) 499,918499,918367,053367,053
LCOE (USD/kWh) 0.8080.3500.6890.543
LCC change (%) 0%−27%−27%
LCOE change relative to Scenario 1 (%) −57%−15%−33%
LCOE change Scenario 4 vs. Scenario 3 (%) −21%
Battery lifetime (years)14.1114.117.627.62
Surplus PV energy (kWh/year)60,138.84879.0510,669.76155.17
Required Base load energy (kWh/year)43,638.9243,638.9243,638.9243,638.92
Base load energy (kWh/year)43,53943,53937,482.8537,482.85
E-bike and portable storage energy (kWh/year)-58,074.6-10,304.3
Unserved (lost) load (kWh/year)101.96101.966281.716281.71
LPSP (%)0.230.2314.1114.11
Tariff (USD)0.300.300.300.30
Increase in annual revenue due to e-bikes and portable storage (%)-134.6%-26.9%
Avoided CO2 emissions (ton CO2/year)-73.27-29.20
Average number of off-grid customers supplied annually-160-0
Number Bodawerk 50 km (/year)-6944-2006
Number Zembo 50 km (/year)-7466-2385
Number Africrooze 50 km (/year)-6644-3998
Number portable batteries charged fully (/year)-5858-3
Table 7. Sensitivity analysis with varying battery capital costs ( C B a t ).
ParameterScenario 1Scenario 2 + 10 %   C B a t + 10 %   C B a t (with Additional Loads) + 20 %
C B a t
+ 20 %   C B a t (with Additional Loads) 10 %
C B a t
10 %   C B a t (with Additional Loads) 20 %
C B a t
20 %   C B a t (with Additional Loads)
C B a t (USD/kWh)300300330330360360270270240240
LCC (USD) 499,918499,918527,418527,418554,917554,917472,419472,419444,919444,919
LCOE (USD/kWh) 0.8080.3500.8520.3690.8970.3890.7630.3300.7190.312
1 Δ LCC (%) 0%6%6%11%11%−6%−6%−11%−11%
2 Δ LCOE (%) −57%6%−54%11%−52%−6%−59%−11%−61%
1 Change in lifecycle cost (LCC) relative to Scenario 1 (%). 2 Change in levelized cost of energy (LCOE) relative to Scenario 1 (%).
Table 8. Sensitivity analysis with varying converter capital costs ( C c o n v ).
ParameterScenario 1Scenario 2 + 10 %
C c o n v
+ 10 %   C c o n v (with Additional Loads) + 20 %
C c o n v
+ 20 %   C c o n v (with Additional Loads) 10 %
C c o n v
10 %   C c o n v (with Additional Loads) 20 %
C c o n v
20 %   C c o n v (with Additional Loads)
C c o n v (USD/kW)300300330330360360270270240240
LCC (USD) 499,918499,918507,331507,331514,743514,74392,506492,506485,093485,093
LCOE (USD/kWh) 0.8080.3500.8200.3540.8320.3600.7960.3440.7840.340
1 Δ LCC (%) 0%1%1%3%3%−1%−1%−3%−3%
2 Δ LCOE (%) −57%1%−56%3%−55%−1%−57%−3%−58%
1 Change in lifecycle cost (LCC) relative to Scenario 1 (%). 2 Change in levelized cost of energy (LCOE) relative to Scenario 1 (%).
Table 9. Sensitivity analysis with varying battery lifetimes ( L b a t ).
ParameterScenario 1Scenario 2 5   yrs   L b a t 5   yrs   L b a t (with Addi-tional Loads) 7   yrs   L b a t 7   yrs   L b a t (with Additional Loads) 10   yrs   L b a t 10   yrs   L b a t (with Additional Loads)
Battery lifetime (yrs)14.1114.1155771010
LCC (USD) 499,918499,918817,827817,827616,382616,382616,382616,382
LCOE (USD/kWh) 0.8080.3501.3210.5710.9960.4320.9960.431
1 Δ LCC (%) 0%64%64%23%23%23%23%
2 Δ LCOE (%) −57%64%−29%23%−47%23%−47%
1 Change in lifecycle cost (LCC) relative to Scenario 1 (%). 2 Change in levelized cost of energy (LCOE) relative to Scenario 1 (%).
Table 10. Sensitivity analysis with varying interest rates ( i n o m ).
ParameterScenario 1Scenario 2 + 10 %
i n o m
+ 10 %   i n o m (with Additional Loads) + 20 %
i n o m
+ 20 %   i n o m (with Additional Loads) 10 %
i n o m
10 %   i n o m (with Additional Loads) 20 %
i n o m
20 %   i n o m (with Additional Loads)
Interest rate (%)131314.314.315.615.611.711.710.410.4
LCC (USD) 499,918499,918455,919455,919419,602419,602553,497553,497619,090619,090
LCOE (USD/kWh) 0.8080.3500.8280.3580.8500.3680.7900.3420.7740.335
1 Δ LCC (%) 0%−9%−9%−16%−16%11%11%24%24%
2 Δ LCOE (%) −57%2%−56%5%−54%−2%−58%−4%−59%
1 Change in lifecycle cost (LCC) relative to Scenario 1 (%). 2 Change in levelized cost of energy (LCOE) relative to Scenario 1 (%).
Table 11. Results when weighted priorities for the additional loads are changed.
ParameterScenario 2—Base Case with E-Bikes and Portable StorageEqual Weighting—(Base Load with E-Bikes and Portable Storage)
LCC (USD) 499,918499,918
LCOE (USD/kWh) 0.3500.348
Surplus PV energy (kWh/yr)879.05248.64
E-bike and portable storage energy (kWh/yr)58,074.658,692.4
Increase in annual revenue due to e-bikes and portable storage (%)134.6%132.1%
Avoided CO2 emissions (ton CO2/year)73.2730.34
Average number of off-grid customers supplied annually160304
Number Bodawerk 50 km (/yr)69441068
Number Zembo 50 km (/yr)7466823
Number Africrooze 50 km (/yr)66446825
Number portable batteries charged (/yr)585811,078
Disclaimer/Publisher’s Note: The statements, opinions and data contained in all publications are solely those of the individual author(s) and contributor(s) and not of MDPI and/or the editor(s). MDPI and/or the editor(s) disclaim responsibility for any injury to people or property resulting from any ideas, methods, instructions or products referred to in the content.