Article

Global Atlas of Marine Floating Solar PV Potential

by
David Firnando Silalahi
* and
Andrew Blakers
School of Engineering, The Australian National University, Canberra, ACT 2600, Australia
*
Author to whom correspondence should be addressed.
Solar 2023, 3(3), 416-433; https://doi.org/10.3390/solar3030023
Submission received: 20 June 2023 / Revised: 21 July 2023 / Accepted: 25 July 2023 / Published: 27 July 2023
(This article belongs to the Topic Sustainable Energy Technology, 2nd Volume)

Abstract

:
In this paper, we analyse 40 years of maximum wind speed and wave height data to identify potential sites for solar photovoltaic (PV) systems floating on seas and oceans. Maximum hourly wave height and wind speed data were segregated into 5 distinct categories. These categorisations were then combined at the nearest wind speed and wave height grid point for each sea location, generating a comprehensive wind–wave map via a geographic information system (GIS) visualisation. We find that regions around the equator are generally calm, i.e., free from strong winds and large waves. The most favourable locations are around the Indonesian archipelago, and the Gulf of Guinea on the west coast of tropical Africa. Our analysis indicates the huge potential of floating solar PV systems in calm tropical maritime regions, capable of generating about one million terawatt-hours per year in regions that rarely experience waves larger than 6 m or winds stronger than 15 m/s. This study furthers our understanding of alternative renewable energy options, emphasising the promising potential of offshore floating solar PV systems in the global energy transition.

Graphical Abstract

1. Introduction

Demand for energy is likely to rise greatly by mid-century due to a growing global population, increased per capita energy consumption (correlated with affluence), and electrification of transport, heating, and industry. There is an urgent need to reduce carbon emissions to address the intensifying climate crisis. This challenge requires solutions that can not only fulfill increasing energy needs but also contribute to zero-carbon targets. The leading solution is solar PV technology, with support from wind energy. In 2022, more new solar PV [1] generation capacity was installed than everything else combined.
The International Energy Agency (IEA) projects that the world’s electricity demand will grow to around 60,000 terawatt-hours (TWh) by 2050 compared to current levels [2], even after considering increased energy efficiency measures. The International Renewable Energy Agency (IRENA) projects that world electricity generation will nearly double to about 50,000 TWh in 2050 [3]. Typical per capita electricity consumption in developed economies is 6–12 megawatt-hours (MWh) per person [4]. This may double to around 20 MWh per capita [5] to accommodate electrification of most energy functions. According to the United Nations, the world population is expected to approach ten billion people by 2050 [6]. Thus, global electricity demand may eventually approach 200,000 TWh per annum.
The power and area of solar panels required to supply 20 MWh of electricity per capita per annum are 14 kilowatts (kW) and 70 m2, respectively, assuming an average capacity factor of 16% [7] and an array solar conversion efficiency of 20%. For ten billion people, this amounts to 140 TW and 0.7 million km2, respectively. This can be compared with the global land surface area of 150 million km2 and the area devoted to agriculture of 50 million km2 [8].
The simple calculation above shows that the world has sufficient land area to provide energy from solar PV for ten billion affluent people. However, in some regions, there are constraints on provision of sufficient solar energy. These include small countries, regions at high latitudes, regions with high population density, and regions with large fractions of protected land that are unavailable for energy infrastructure. In many such regions, wind energy can provide large fractions of required energy. For example, offshore wind [9] in the Sea of Japan, the North Sea, and the Northwest Atlantic Ocean has immense potential. Strong interregional transmission helps to cover shortfalls in solar or wind availability by smoothing out local energy demand and renewable energy supply over large areas.
Floating solar panels have the potential to provide very large-scale energy in some regions. Floating solar, also known as floatovoltaics, involves installing solar panels on floating structures on bodies of water (Figure 1). The panels can be floated on inland lakes, artificial reservoirs, quarry lakes, or irrigation canals. Additionally, they can be located in maritime areas that are not subject to excessive wind speeds or wave heights. Floating solar PV (FPV) can have advantages over land-based systems, such as reduced land requirements, higher energy yield due to the cooling effect of water [10], and potential synergies with existing water infrastructure [11].
Applications of FPV systems in freshwater environments have been discussed widely. Limitations on freshwater floating solar PV systems include availability of water bodies, conflict with alternative water uses, and potential environmental impacts.
Offshore floating solar PV is an attractive option for large-scale solar energy production in some regions. Constraints include salt rather than fresh water, strong winds and large waves in many regions, and conflict with fisheries and environmental values. However, there is vast potential for maritime FPV because seas and oceans are very large. In many of the world’s densely populated areas, electricity demand centres are located close to coastal regions. Approximately 40% of the world’s population lives within 100 km of coastal regions [13].
To date, limited research has been conducted on assessing the suitability of ocean surfaces for floating solar PV sites. This study addresses this research gap by assessing the potential of ocean surfaces for floating solar PV sites. Preferable places for maritime solar panels are those where maximum wave heights and wind speeds are low because this reduces the cost of the engineering defences required to protect the panels.
In this study, a set of 40 years of maximum hourly wind speed and wave height data was analysed to map the preferable sites for floating solar PV. The largest wave heights and wind speeds experienced during the years 1980 to 2020 were selected to characterise suitability, since it is maximum values that drive the cost of engineering defences. The ocean’s surface covers 363 million km2, which is about 72% of the earth’s surface [14]. The scope of this research encompasses sea and ocean surfaces within 300 km of land. The analysis is conducted at a spatial resolution of 11 km to provide an assessment of the potential for maritime floating solar PV sites. This study is the first comprehensive survey of the scope required for maritime floating solar PV that considers factors such as hourly maximum wave height and hourly maximum wind speed. This study is not concerned with developing new floating solar PV technology.

2. Materials and Methods

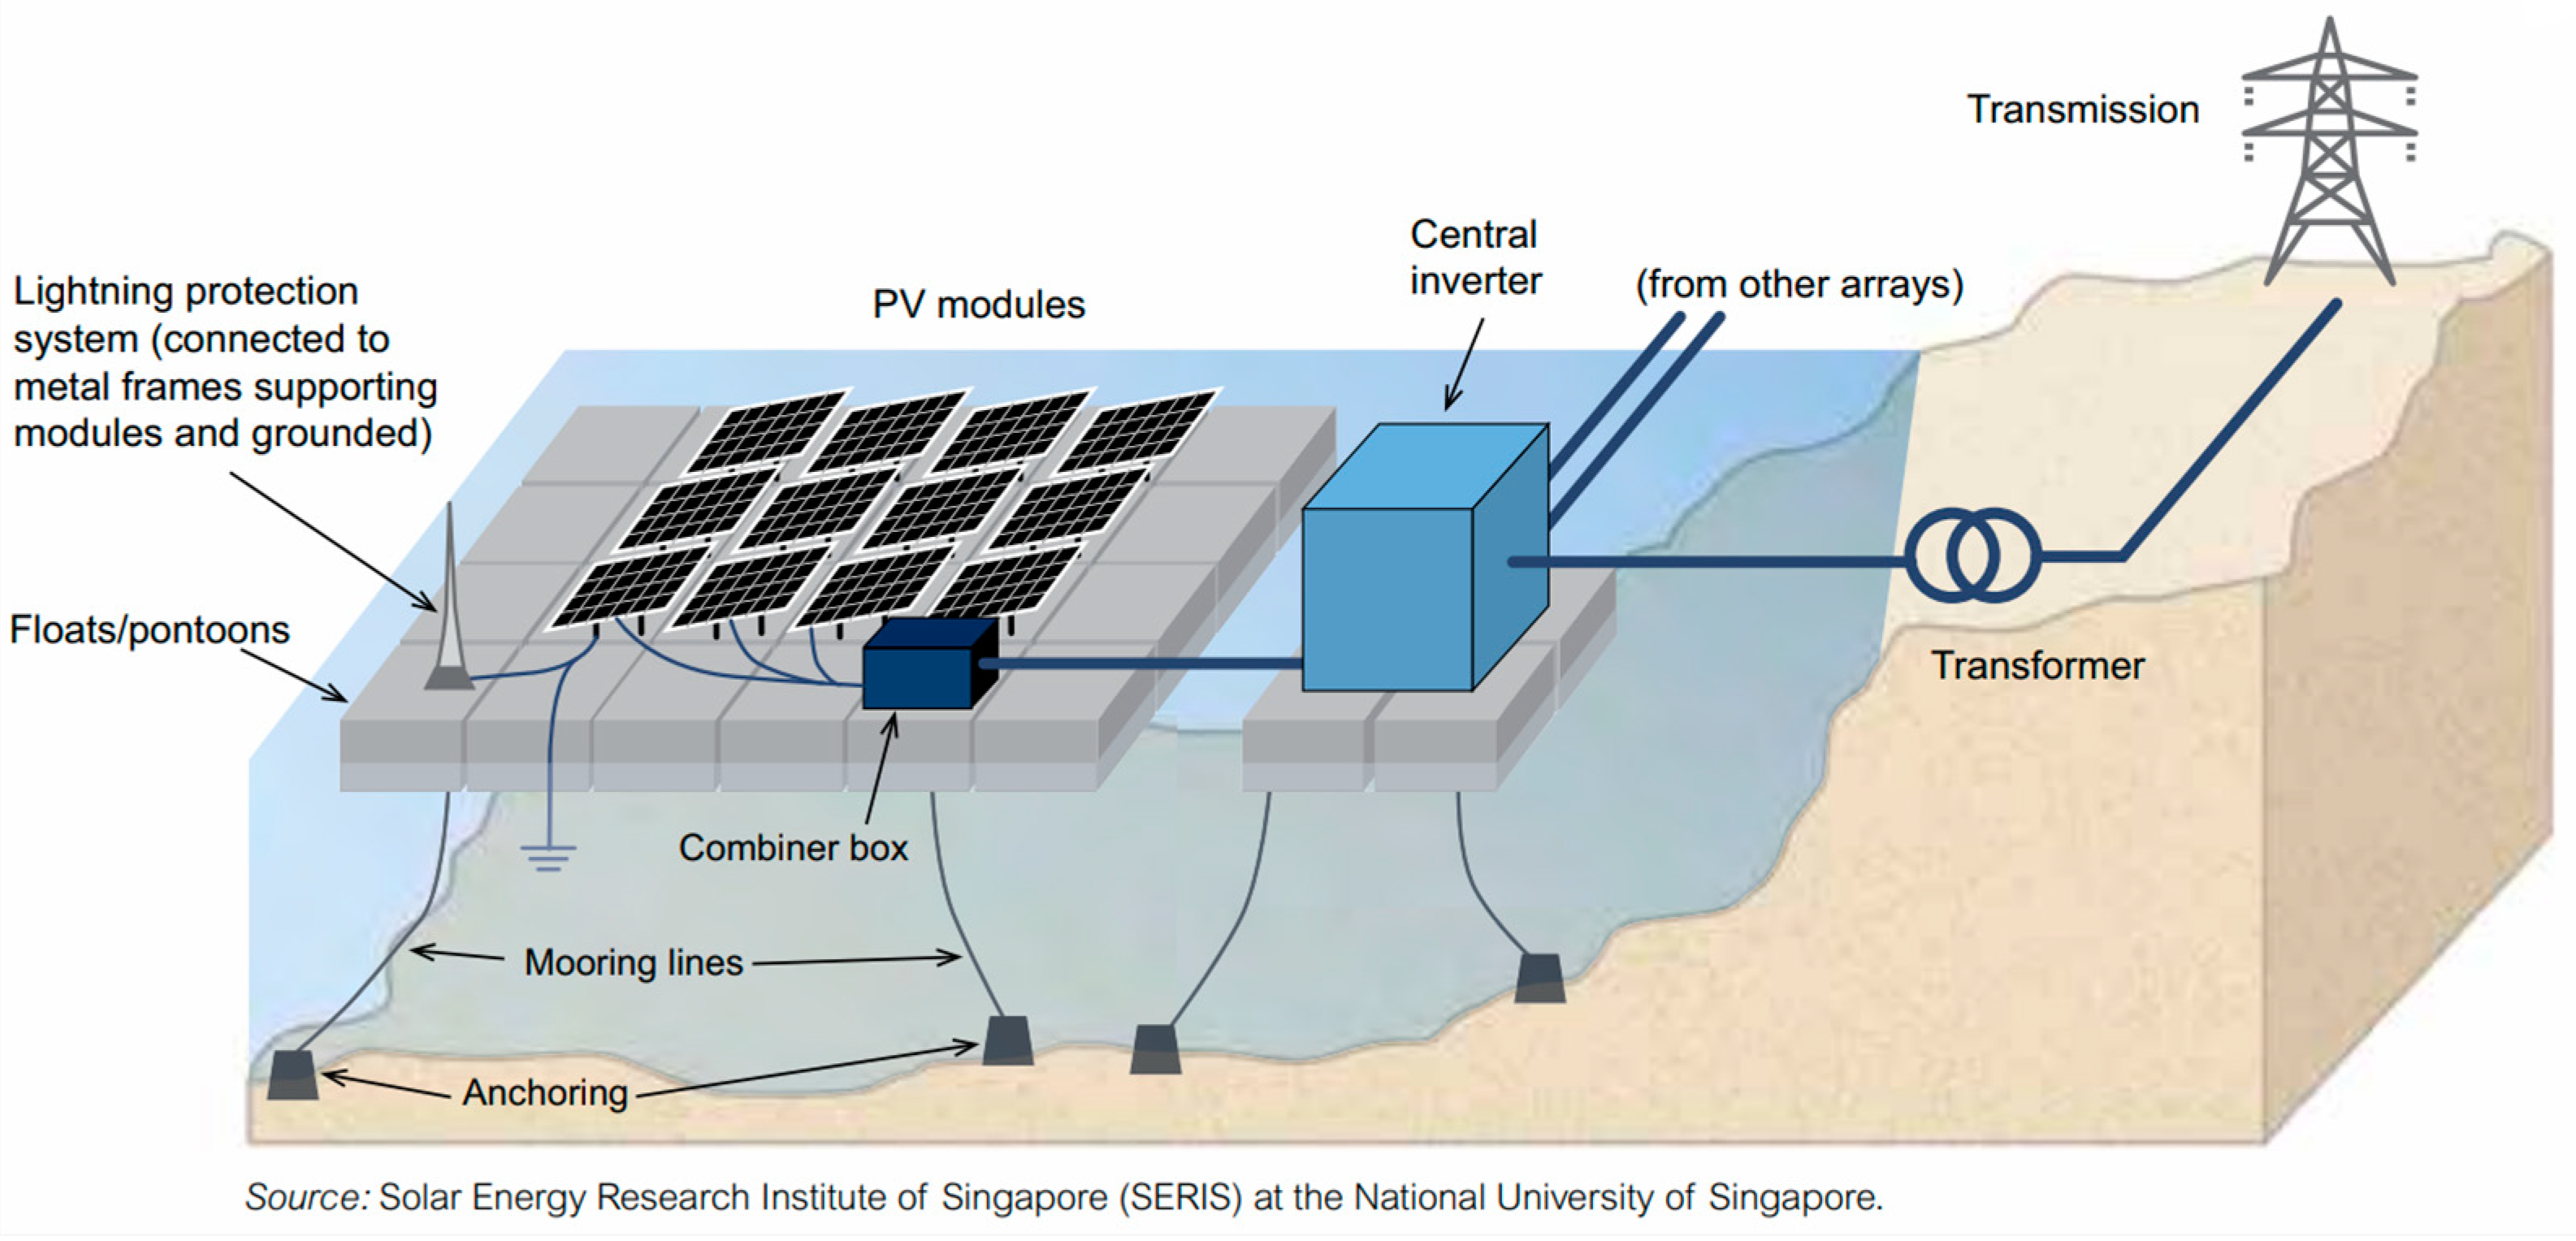
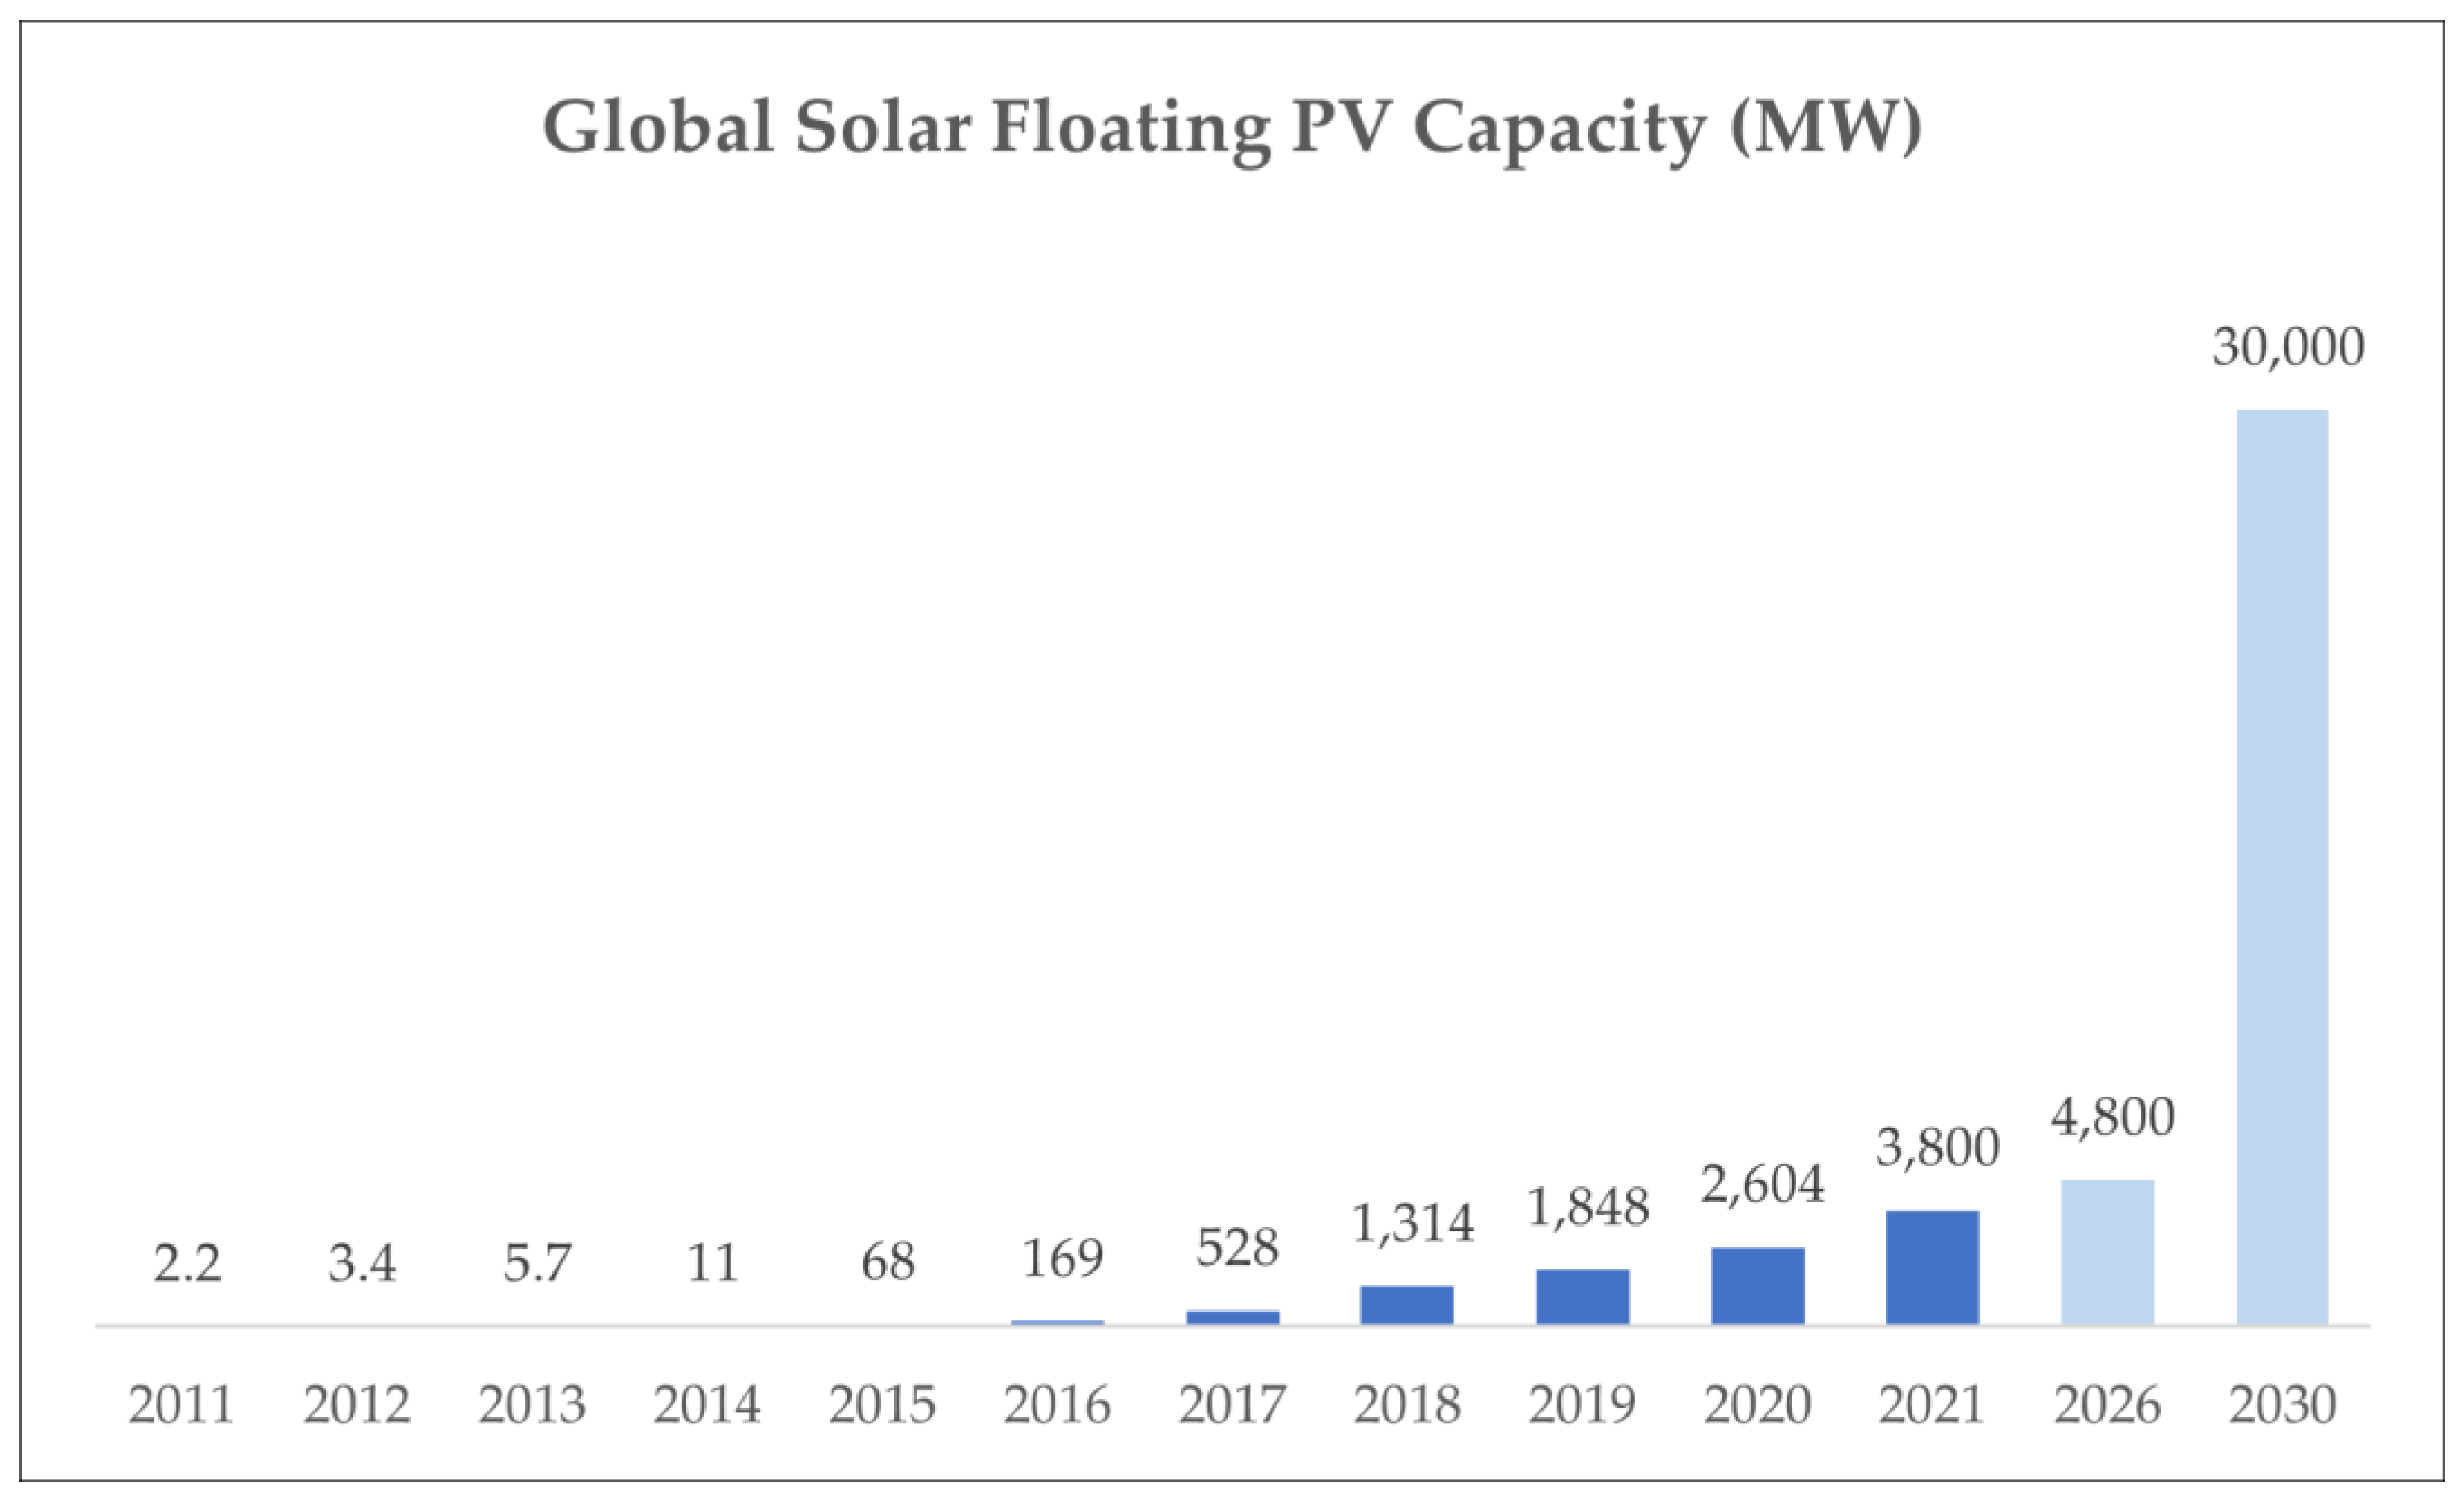
2.1. Floating PV Technology

Being in open ocean environments, offshore floating solar PV systems can benefit from more consistent and stronger solar irradiance due to the reduced effects of shading and cloud cover [15]. This can lead to higher energy yields and increased overall system efficiency compared to their freshwater counterparts.
Floating solar PV systems can be deployed in areas where there is limited land availability for ground-mounted solar panels. Floating solar PV systems can be combined with wind turbines to create hybrid systems that have higher combined capacity factors than either alone and that share transmission and grid connection points [16].
While the potential for floating solar PV systems in freshwater bodies has been widely studied, the exploration of ocean-based floating solar PV systems remains limited. A recent study by Oliveira-Pinto [17] provides a good literature review of the potential of offshore floating solar PV, available technologies, technical challenges, and risks of offshore floating solar PV. Ocean environments offer abundant surface area, potentially allowing for large-scale deployment of floating solar PV systems [18]. Floating PV performs slightly better, on average, on an annual basis than neighbouring land-based systems [19].
However, offshore floating solar PV systems also face several challenges and limitations, including corrosion risk from salt water, fouling by marine organisms, the need for robust and reliable floating structures, mooring, and anchoring systems that can withstand harsh marine environments, as well as potential ecological and environmental impacts on marine ecosystems. Strong winds and large waves can cause major damage [20]. Ensuring safety and reliability under varying wave and wind conditions is crucial for the successful deployment of floating solar panels. Despite the increasing interest in floating solar PV technology, a comprehensive global atlas of floating solar PV potential remains lacking, which hinders effective energy policy and planning.
The amount of floating solar PV installed globally in 2021 was around 3.8 GW [21]. A large floating solar PV plant with a capacity of 320 MW has been constructed in China [22]. The future expansion of floating solar PV is expected to be driven by Asian countries such as China, Indonesia, India, South Korea, Thailand, and Vietnam [21]. South Korea has a target of 2.1 GW of solar floating PV. The land-scarce country has permitted a 1.2 GW solar floating PV power project in North Jeolla. The project is expected to operate commercially in 2025 [23]. The worldwide capacity of floating PV is projected to rise to about 30 GW by 2030 [22]. Figure 2 shows real and projected cumulative global installed capacity of floating PV from 2011 to 2030.
Ocean Sun, a Norway-based floating solar company, constructed a two-floater 0.5 MWp system in the Yellow Sea, outside Shandong, China, in October 2022. It is an integrated FPV with offshore wind [13]. The pilot project is part of Shandong Province’s plan to install a total of 42 GW of offshore floating solar [25].

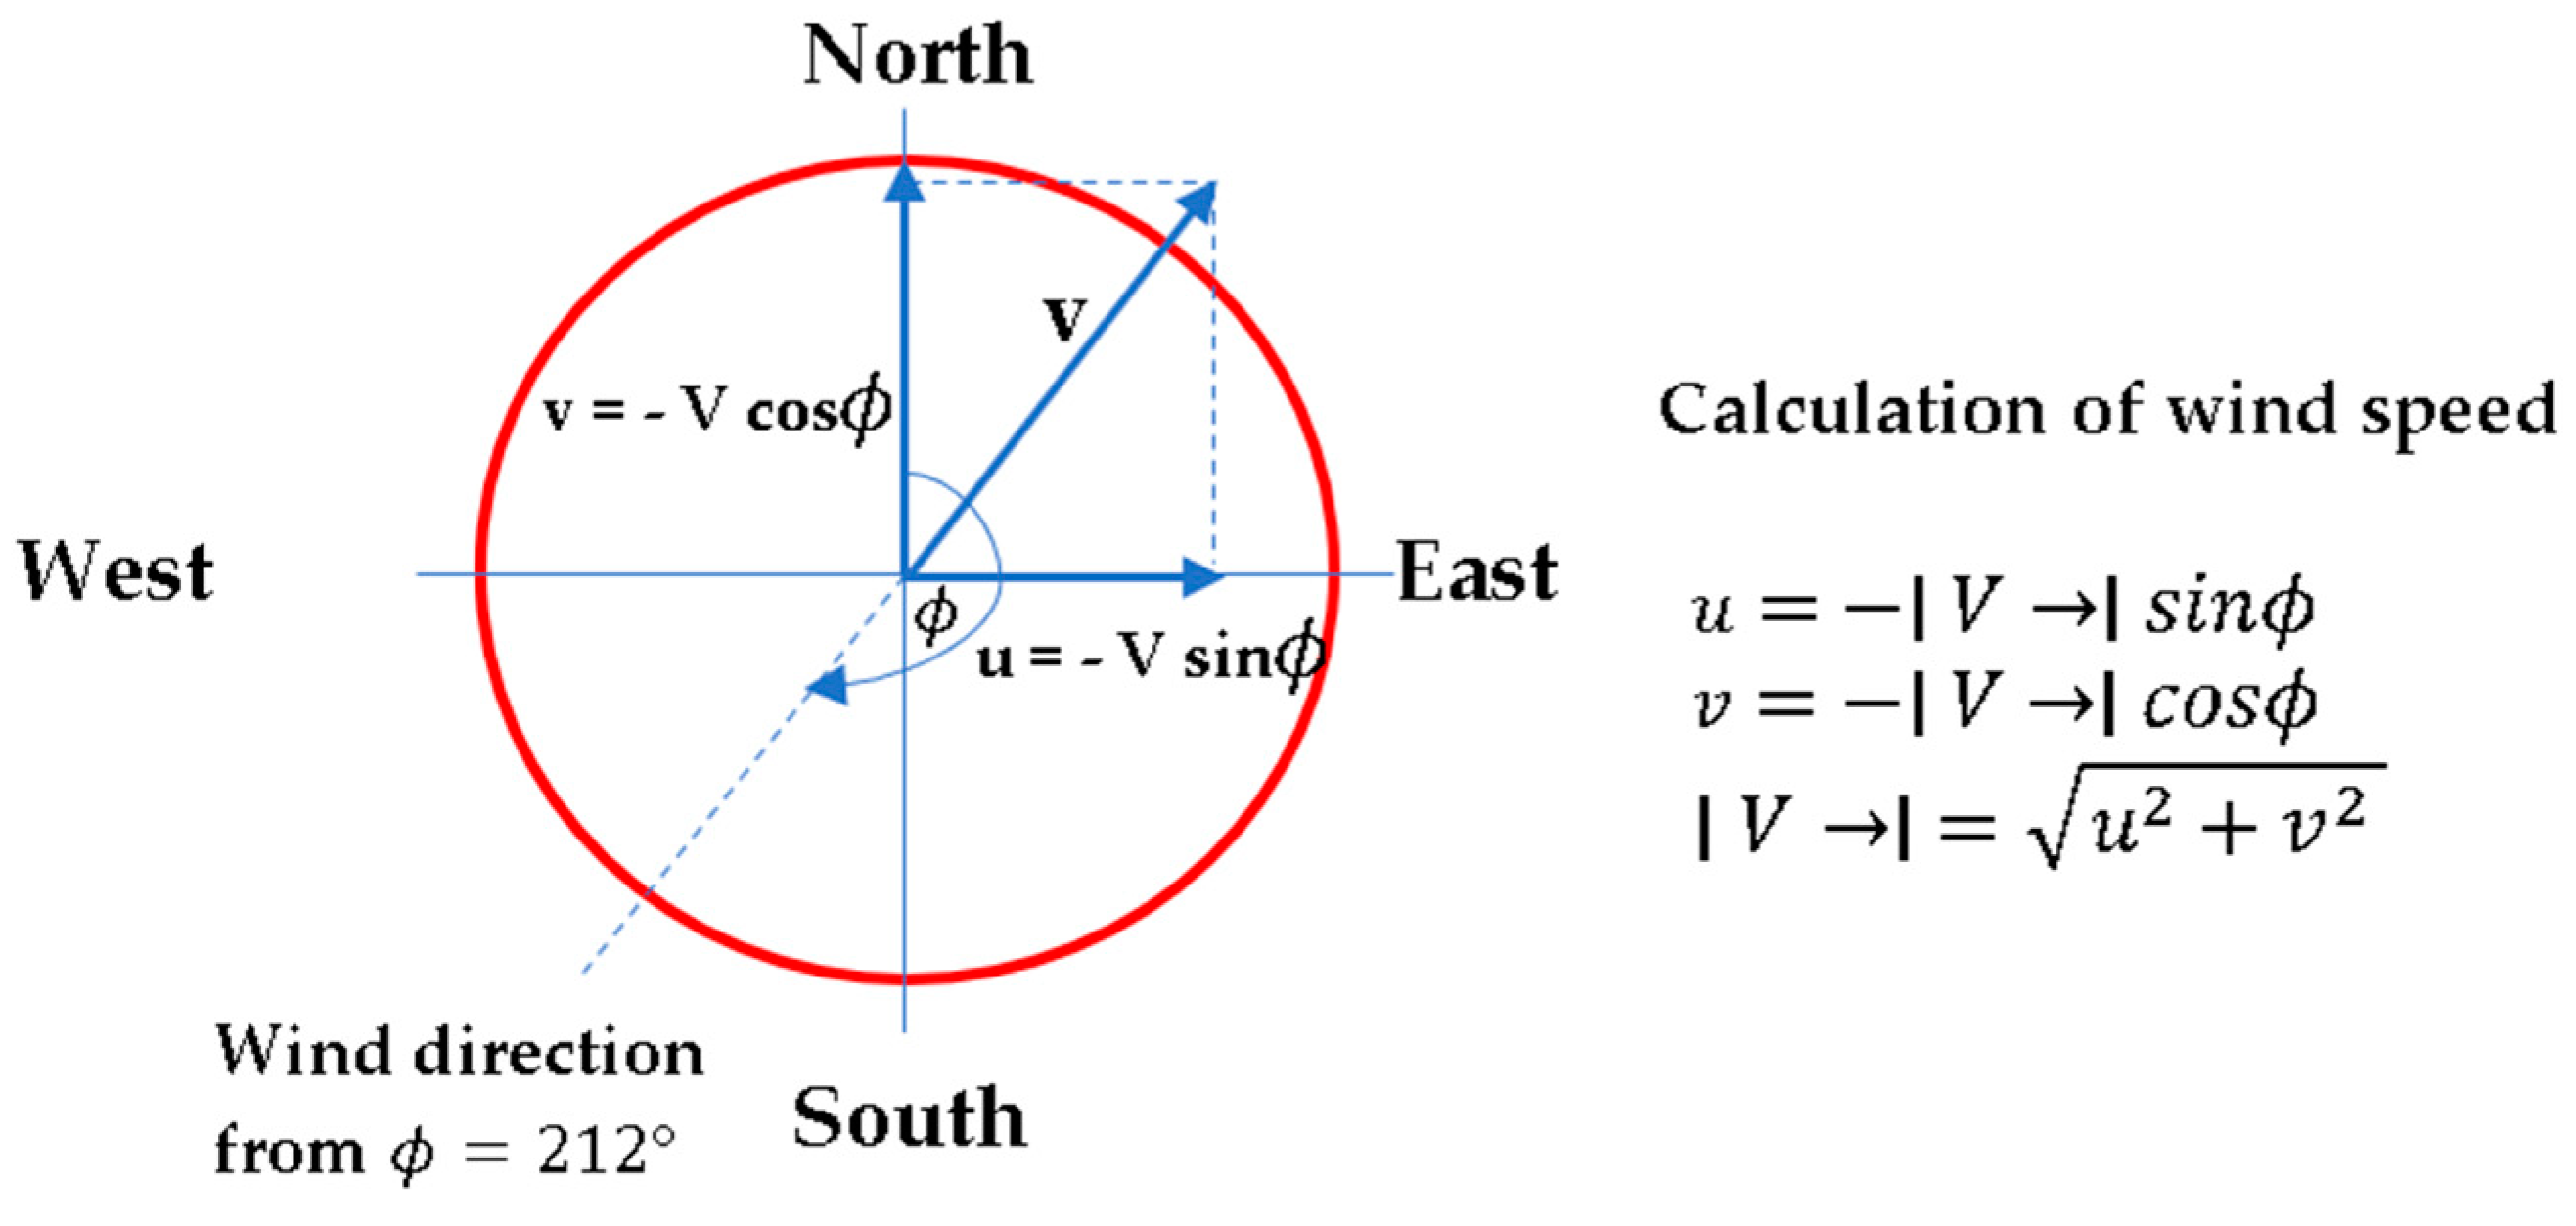
2.2. Wind and Wave from ERA5 Reanalysis
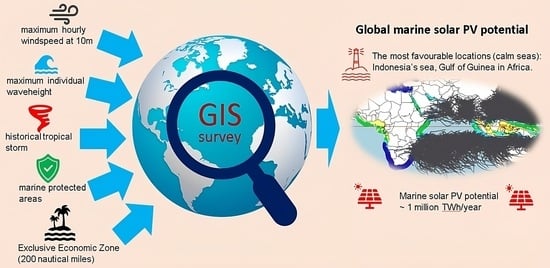
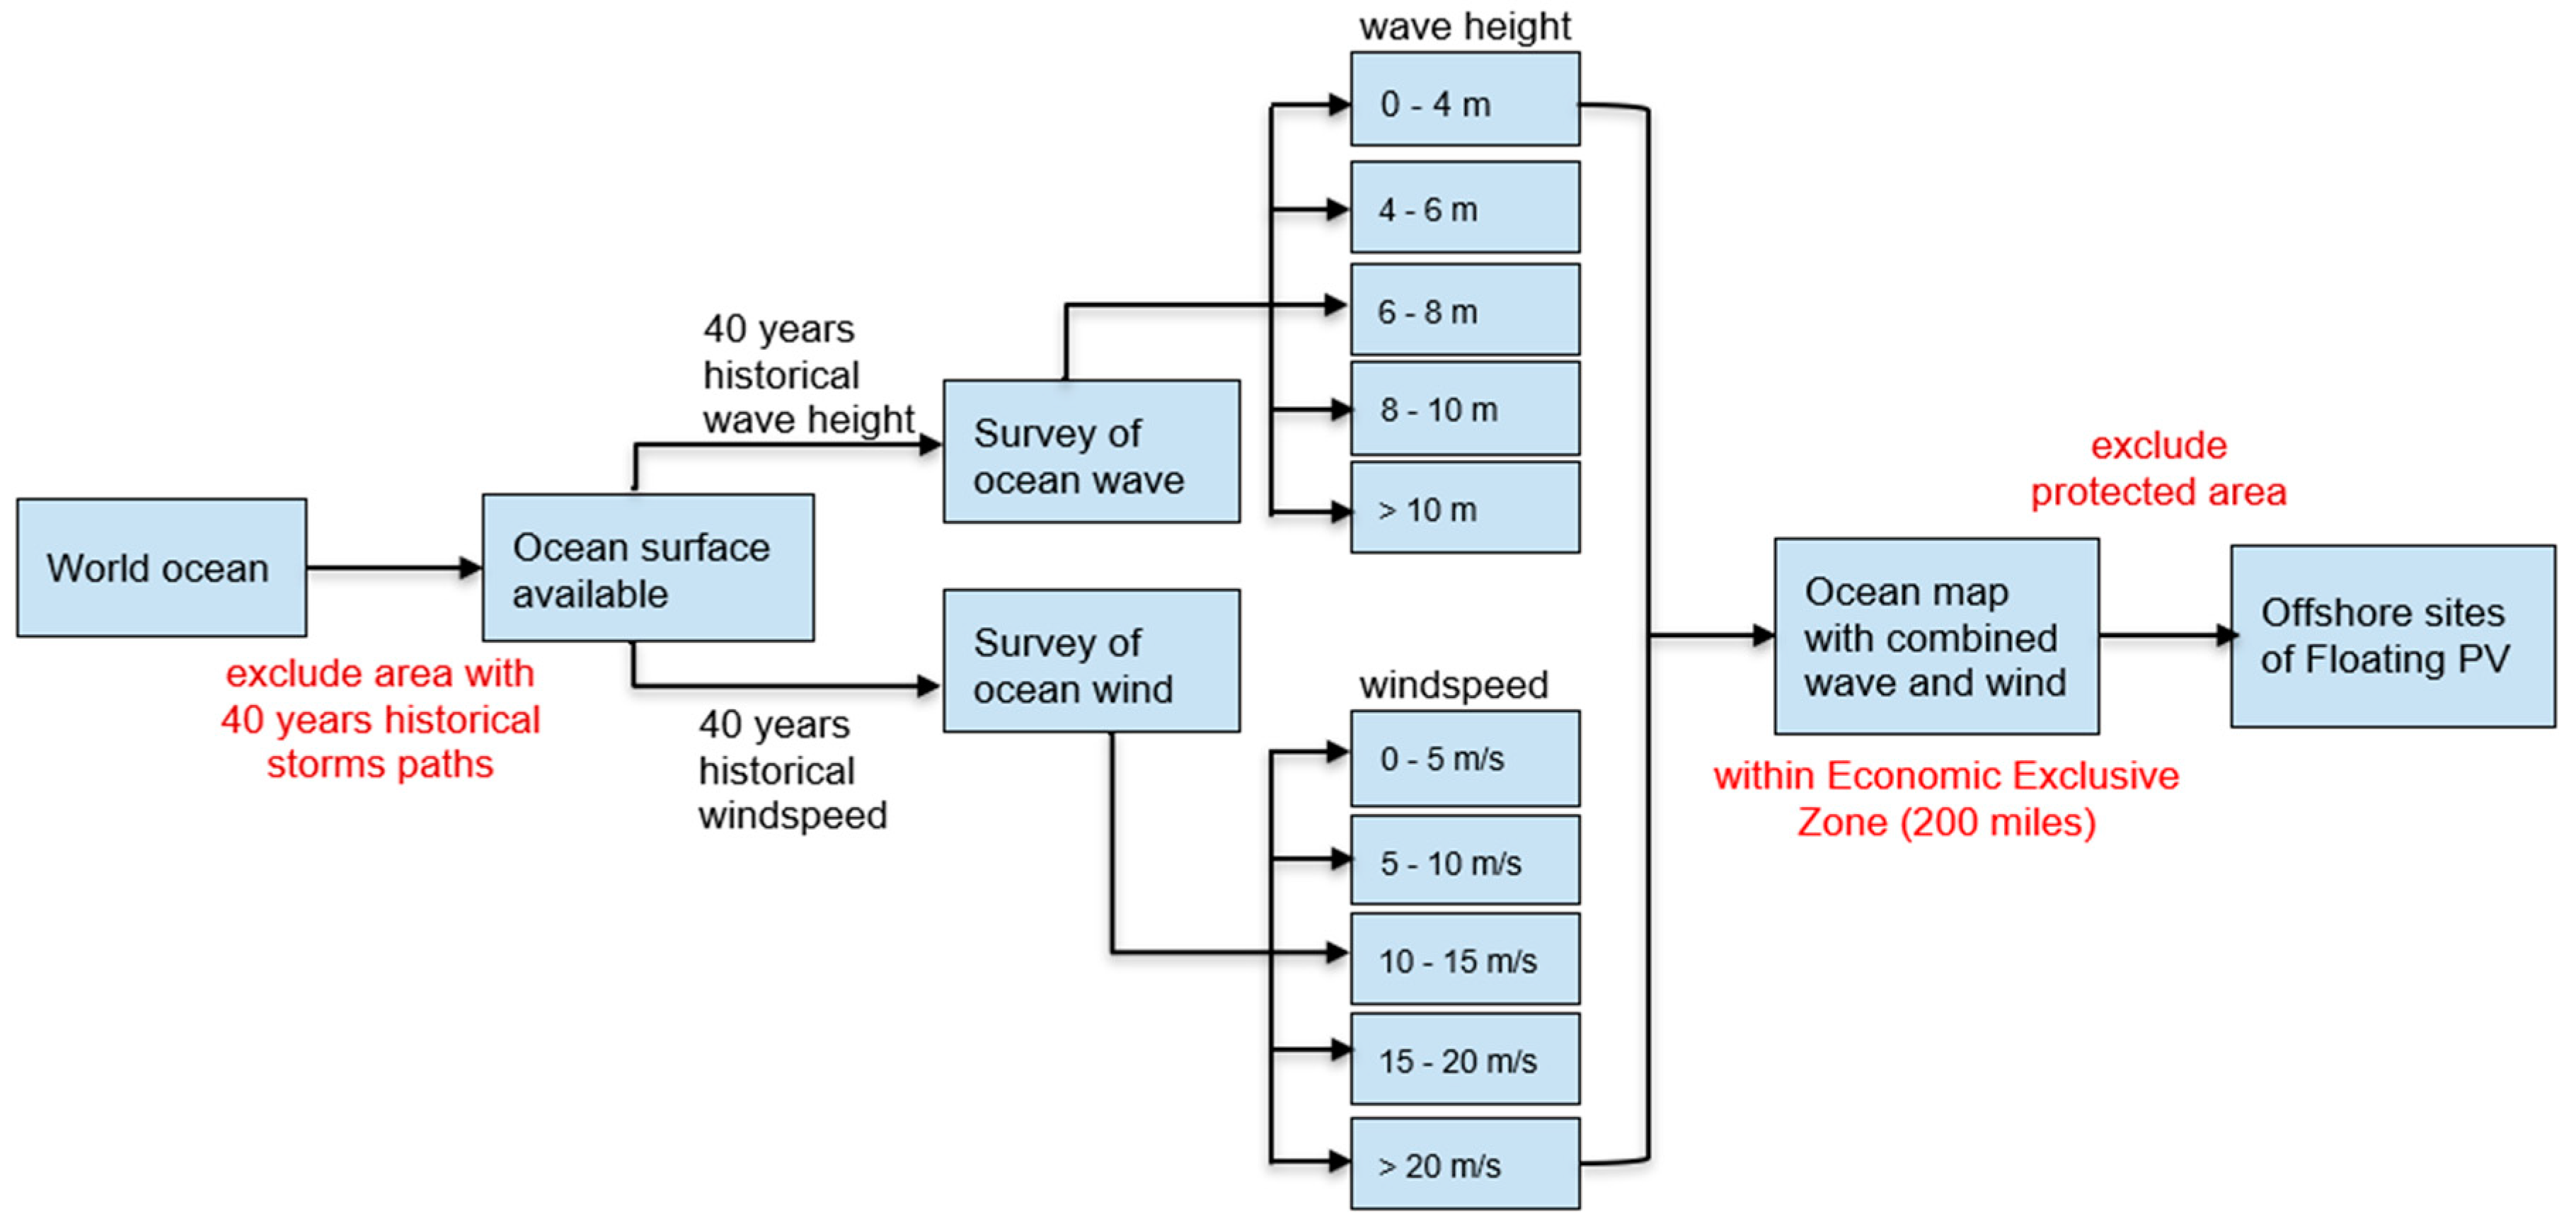
Long-term wind and wave data are required to assess the engineering defences required to minimise the risk of damage to floating PV. The ERA5 reanalysis is used in this study. The ERA5 is a global climate and weather reanalysis tool from the European Centre for Medium-Range Weather Forecasts (ECMWF) [26]. The ERA5 reanalysis dataset, provided by the European Centre for Medium-Range Weather Forecasts (ECMWF), offers hourly weather, climate, and environmental data globally. It combines past weather data with models to infer past values of weather variables such as wind speed and wave height. This allows users to study past climate conditions, track current weather patterns, and make statistical predictions about the future climate. ERA5 has a higher temporal and spatial resolution than previous global reanalyses, and it can provide more detailed information about the state of the atmosphere at different times and places, which can lead to more accurate predictions of weather patterns and climate change [27]. After the initial release of ERA5, several independent studies evaluated its performance. The studies found that ERA5 performs well in representing wind, temperature, and humidity in the Arctic [28] and Antarctic [29]. ERA5 performs well in representing surface and low-level winds over the ocean, relative to observations and other reanalyses [30,31,32]. ERA5 has been shown to outperform MERRA2 in wind energy modelling [31]. When comparing ERA5 data to in-situ observations from 103 buoys in the North American Atlantic and Pacific collected by the National Data Buoy Center between 1979 and 2019, ERA5 SWH shows generally good performance across most stations. The accuracy of ERA5 estimations of significant wave height is satisfactory under the most typical sea states of between 0.5 m and 4 m [33].
However, while ERA5 is widely respected for its accuracy, it is not perfect. Its resolution may not be high enough to capture all local weather phenomena, especially those that occur at smaller scales than ERA5 grid-size data, such as severe wind gusts. Additionally, reanalysis data are based on both observations and model simulations, which means they can sometimes contain inaccuracies or biases. Experimental or direct measurements are often more accurate at capturing localised and extreme weather events.

3. Methodology

Our aim is to provide a comprehensive resource assessment of maritime floating PV systems, taking account of wind speeds, wave heights, protected waters, distance from land, and territorial considerations. We evaluated global ocean surface wind and wave characteristics from 60 degrees North to 60 degrees South using hundreds of thousands of 0.1-degree latitude and longitude cells, which is about 11 km × 11 km at the equator.
Hourly wind speeds and individual maximum wave heights were derived from 40 years (1980–2020) of ECMWF-ERA5 reanalysis data. The wind speed data is arranged in an 11 km × 11 km grid format. The u-component and v-component of wind speeds at 10 m above water level, representing the horizontal speed of air moving eastward and northwards, respectively, were obtained. Wind speed was calculated hourly using the formula in Figure 3, with the maximum value selected for each hour.
Maximum individual wave heights, estimates of the highest wave within a 20 min time window, were derived from the ECMWF-ERA5 reanalysis data [35]. The maximum hourly wave height data in metres was classified into five ranges: 0–4, 4–6, 6–8, 8–10, and >10. The maximum wind speeds, in metres per second, were classified into five ranges: 0–5, 5–10, 10–15, 15–20, and >20.
These data were then combined at the nearest wind speed and wave height grid point for each sea location and visualised using QGIS to create a wind–wave map, focusing on maximum rather than average wave heights and wind speeds.
Tropical storms (cyclones, hurricanes, and typhoons) are likely to cause extensive damage to maritime FPV systems that are not protected by expensive engineering defences. We used 40 years of data (1980–2020) from the International Best Track Archive for Climate Stewardship (IBTrACS) [36,37,38,39] to overlay the area of the sea impacted by tropical storms. The main storm belts are illustrated in Figure 4. This comprehensive global collection of tropical storms, provided by the National Center for Environmental Information [40], helped identify areas that have experienced storms and are therefore considered to be less suitable for FPV.
Maritime locations were attributed to countries based on the 200 nautical mile limit from their coastlines using the EEZ shapefile provided by the Flanders Marine Institute [42], in accordance with international maritime law. Protected marine and coastal areas were removed from consideration using the May 2023 release of the World Database on Protected Areas (WDPA) [43]. Figure 5 shows an overview of the methodologies implemented in this research.

4. Results and Discussion

Most of the world’s maritime areas have experienced waves larger than 10 m and wind speeds larger than 20 m/s at sometime over the past 40 years. However, some regions have not, and these became the focus of our study. Our study focused on five main areas: the seas of Southeast Asia (I); the Red Sea and Persian Gulf (II); the Mediterranean and Black Seas (III); equatorial Africa (IV); and South America (V); as shown in Figure 6. Also included in Figure 6 are historical tropical storm tracks (represented by red lines).
Generally, the most suitable maritime regions for floating PV systems are located in equatorial countries due to their relatively low winds and small waves. Such areas can be found in the seas around Africa and Southeast Asia. Despite its equatorial location, northern South America experiences larger waves than other equatorial regions.
The global mapping of wind and wave conditions in these areas is illustrated in Figure 7, while Table 1 summarizes the global maritime floating solar PV potential. Subsequent figures show individual regions in greater detail. In the figures, a heat map colour key is used (Table 1). Red areas are best (calmer) followed by orange, yellow, and green, while blue areas are the stormiest. Pale blue corresponds to maritime areas far from land that were not considered in this analysis. Purple areas represent marine protected areas. The dark gray line shows the history of tropical storms.

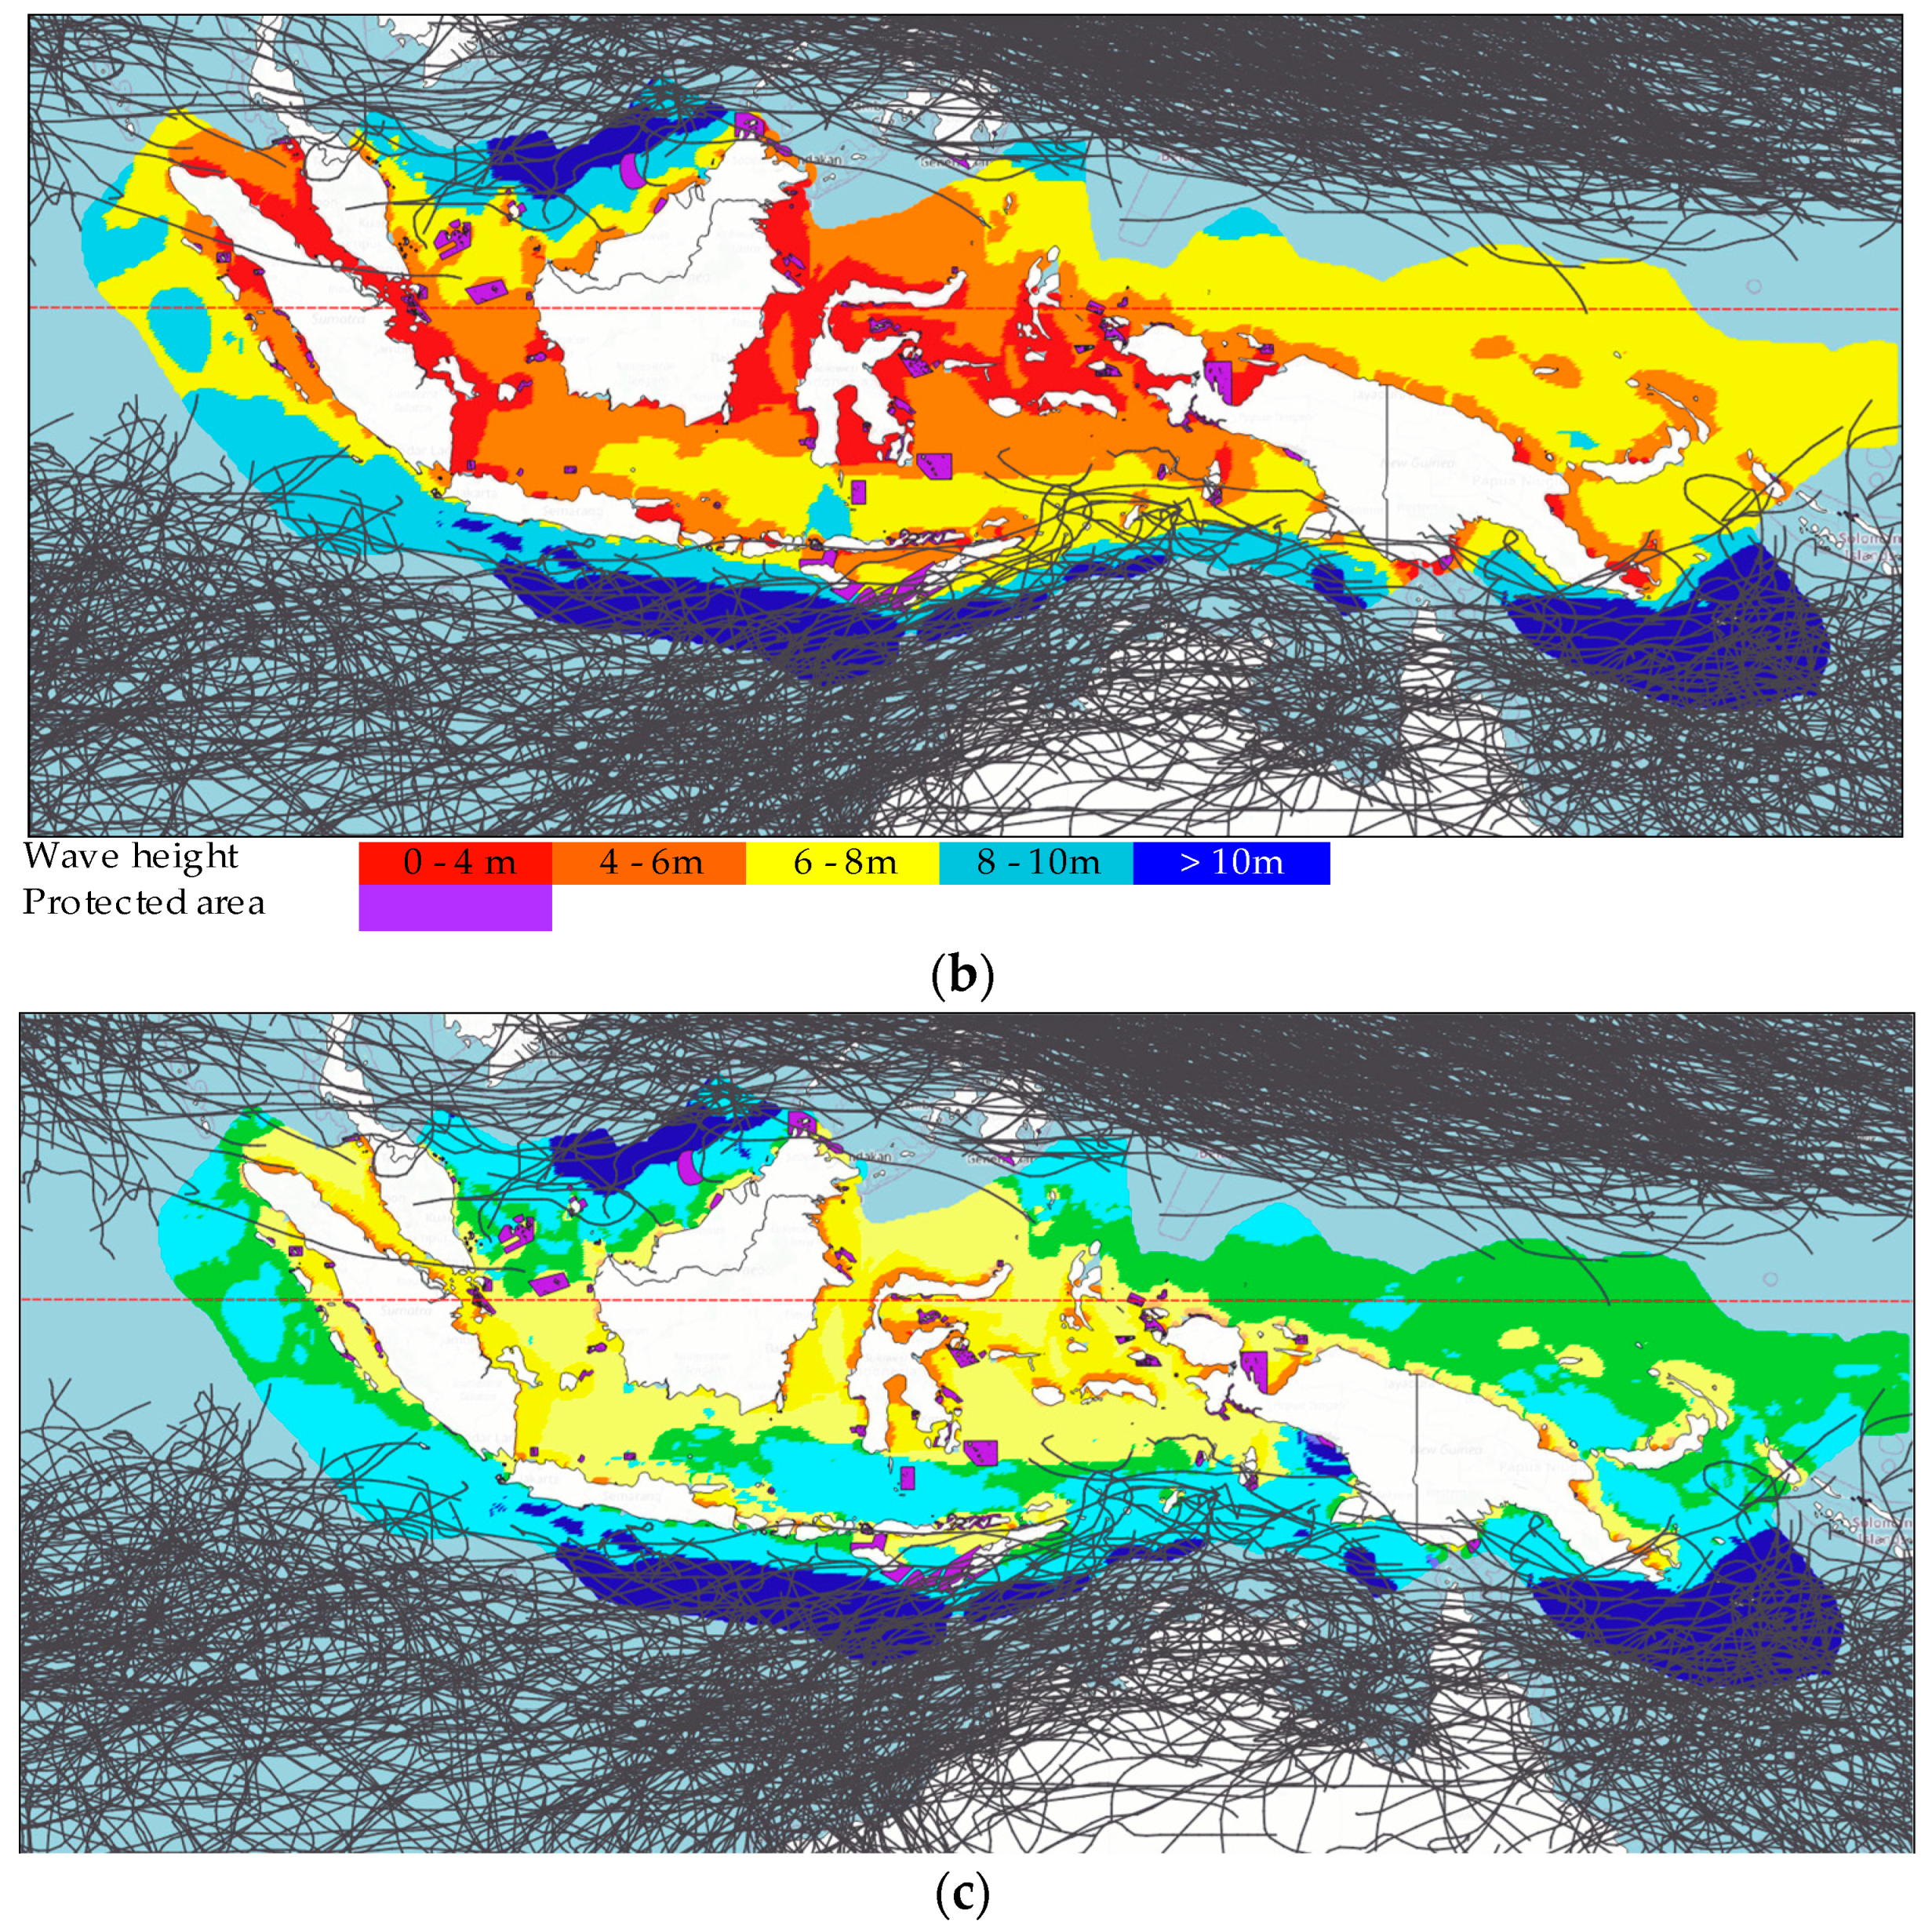
4.1. Southeast Asia (Region I)

The world’s most suitable region for maritime floating PV systems is in Southeast Asia. Malaysia, Singapore, Brunei Darussalam, Papua New Guinea, and Indonesia possess large potential for the deployment of floating PV technology. Notably, Indonesia possesses very large areas of calm sea in and around the islands, as discussed in our previous work [44]. Indonesia is the world’s only large tropical archipelago.
Figure 8 depicts the potential of the Southeast Asian maritime area for floating PV. The figure shows that ideal locations for deploying floating panels are abundant throughout Indonesian territory. Based on historical data on tropical storms over the past 40 years [36], we found that the maritime region extending from the southern part of Indonesia to northern Australia frequently experiences intense tropical storms. A similar situation is observed in the northern part of Indonesia, the Philippines, Thailand, Vietnam, and regions further north.
Table 2 (and subsequent tables) provides a compilation of results for each of the 25 combinations of maximum wind speeds and wave heights. The areas analysed include regions within 200 nautical miles (370 km) of the coast and exclude protected areas. The three numbers within each cell are (from top to bottom): (i) the area (in thousands of km2); (ii) the potential solar power (in TW); and (iii) the potential annual solar generation (in thousands of TWh). For simplicity, we assume that solar panels have low (10 degree) tilt and are densely packed to yield 0.2 GW of solar power per km2. We apply a capacity factor according to an approximate average [7] for each region for low-tilt panels—in this case 15%—to calculate potential annual energy yield. Dark blue cells (>10 m wave height, >20 m/s wind speed) are not included in these calculations.
The numbers in each cell are necessarily approximate. The purpose is to provide perspective. As noted in the introduction, an affluent society drawing all its energy from solar PV may require around 20 MWh per person per year, which amounts to 1000 TWh per 50 million people. Thus, the number 39 in the cell (<4 m, 5–10 m/s) is sufficient for 2 billion affluent people. The combined population of the relevant countries (Malaysia, Singapore, Brunei Darussalam, Papua New Guinea, and Indonesia) is 0.33 billion people.
Indeed, Southeast Asia has 800,000 km2 of seascape that, in 40 years, has not experienced waves larger than 4 m or winds stronger than 15 m/s. This could generate about 210,000 TWh of electricity per year. This is sufficient for solar energy to provide the full energy requirements of 10 billion affluent people, which is equivalent to the projected global population in 2050. Any perception that these countries will have difficulty meeting their future energy needs from solar energy without severe conflict with food production and ecosystems is misplaced.

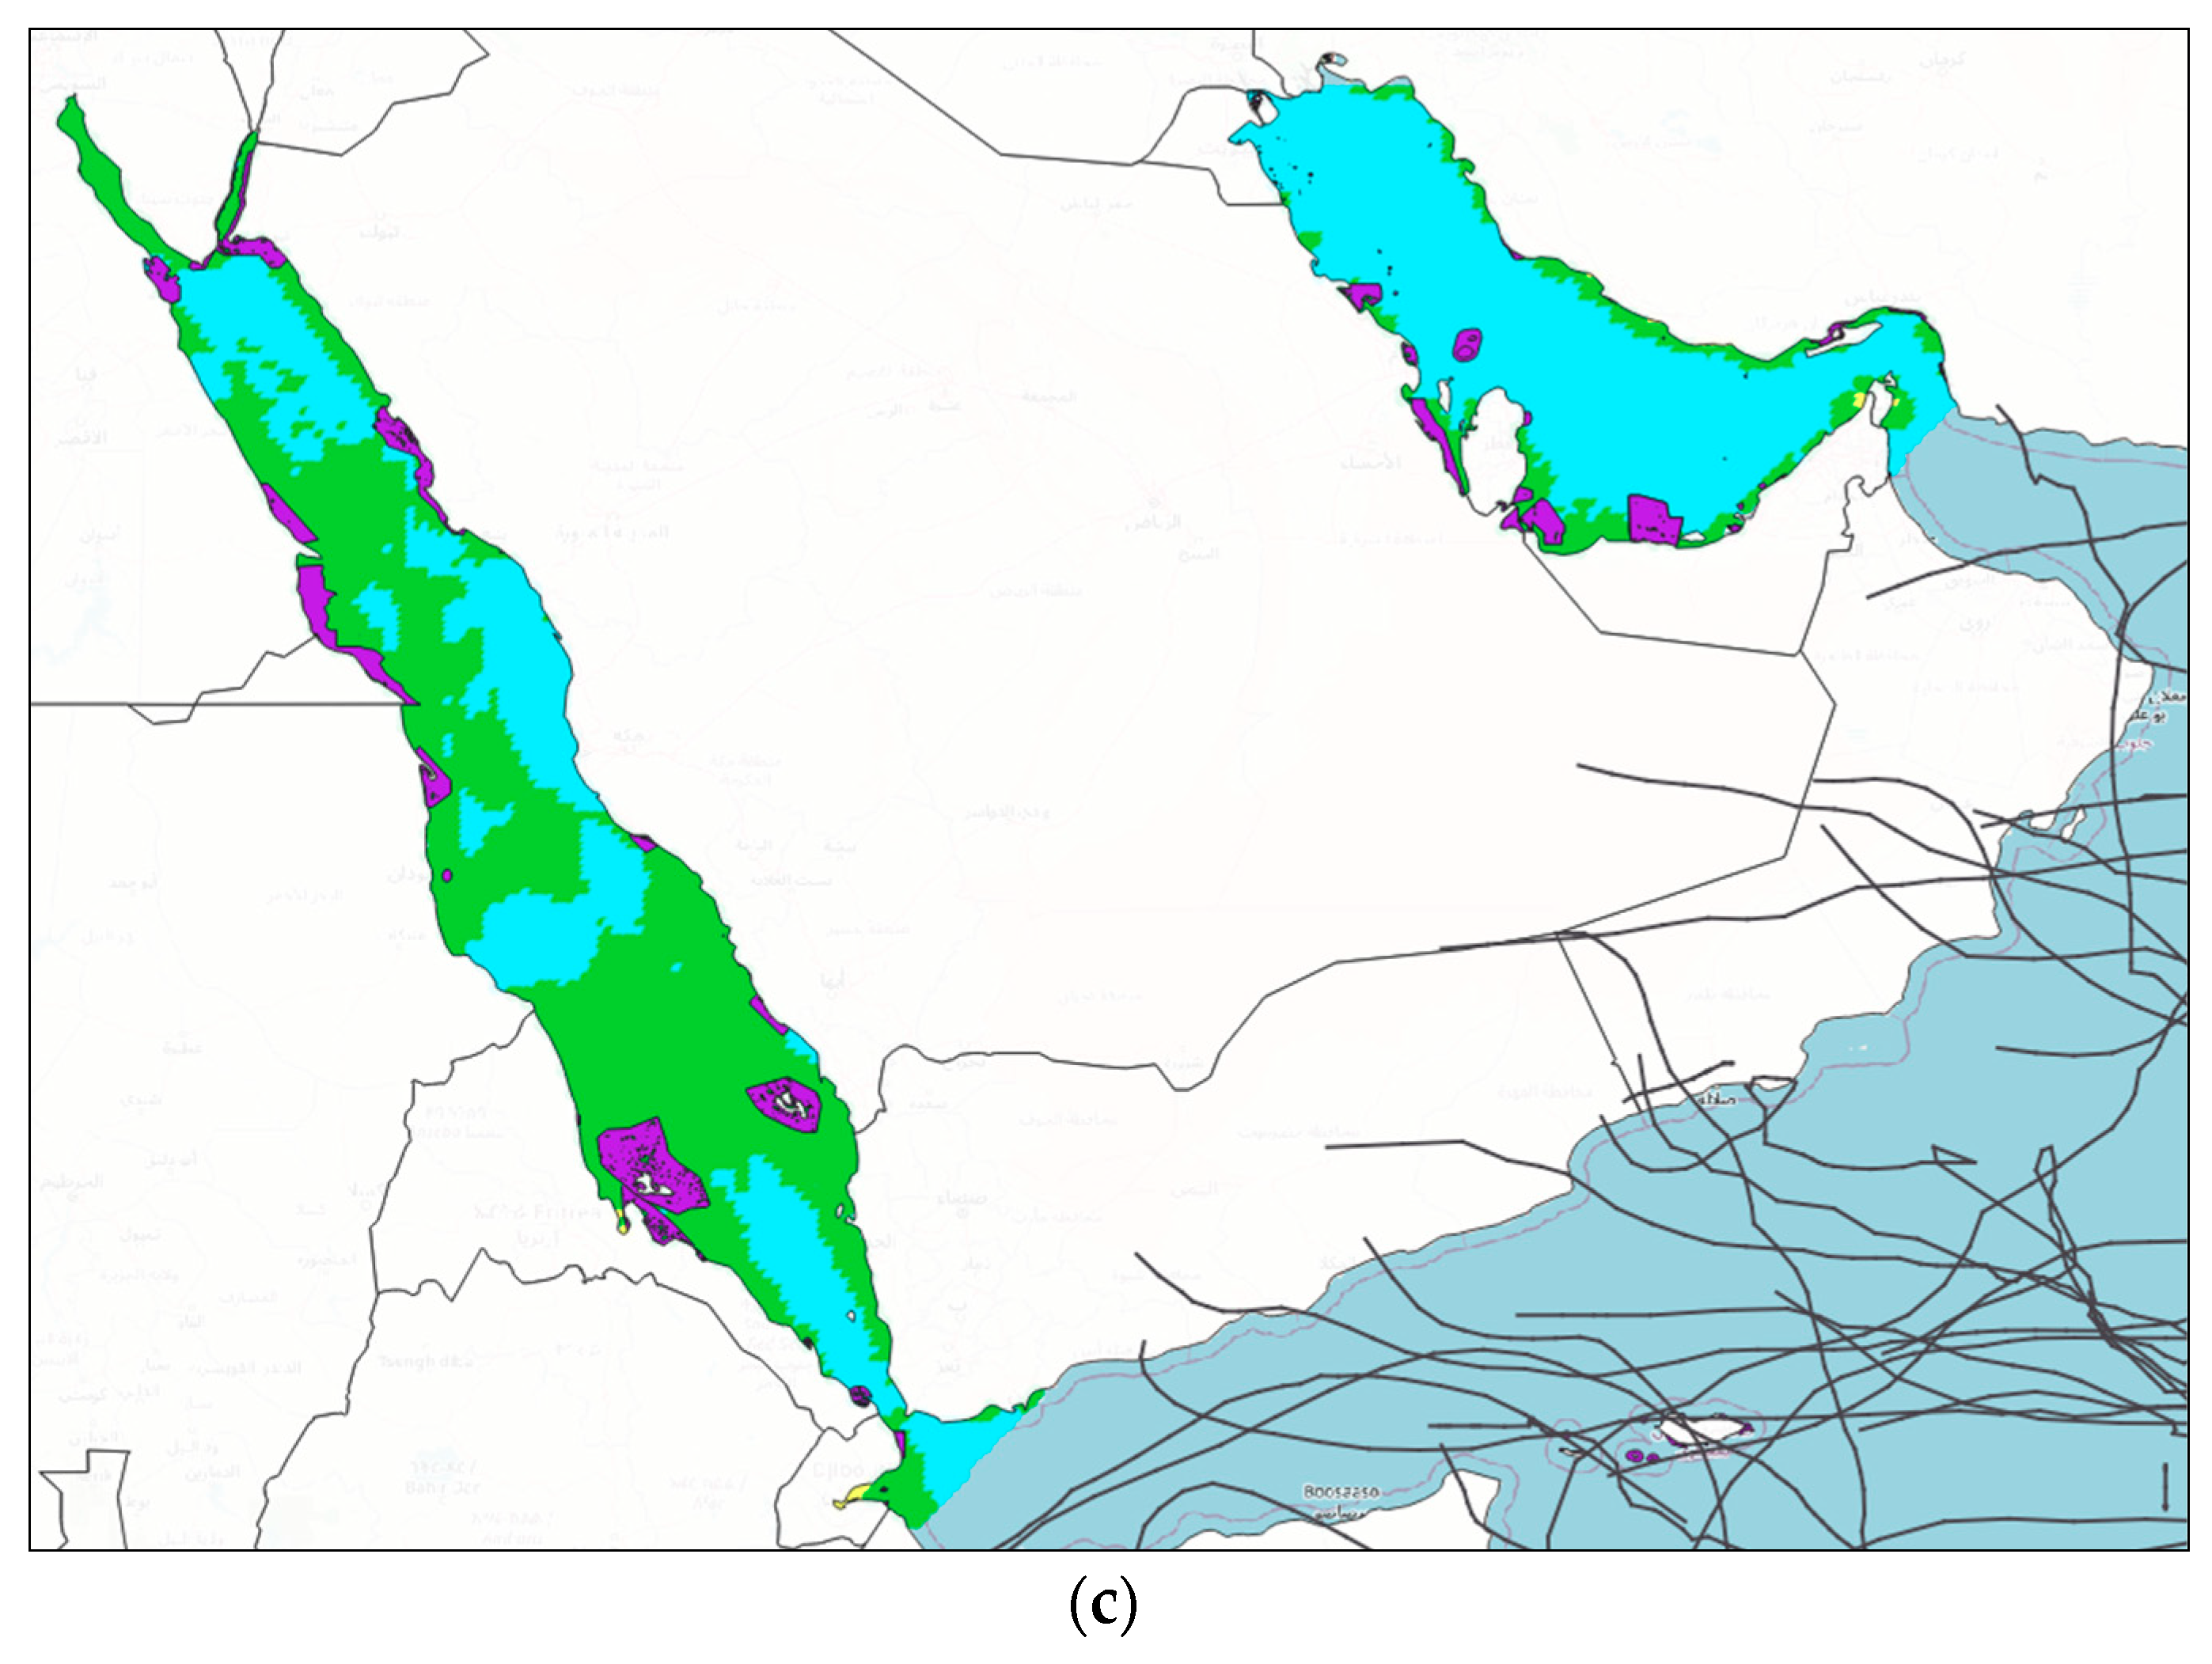
4.2. The Middle East (Region II)

The Red Sea and Persian Gulf have not experienced tropical storms. The Persian Gulf, enclosed by several Middle Eastern countries, covers an area of about 241,000 km2 [45]. The Red Sea, situated between Africa and Asia, has a surface area of approximately 450,000 km2 [46]. Most of the Red Sea experiences maximum wind speeds in the range of 10–15 m/s. In the Persian Gulf, about half of the area exhibits maximum wind speeds of 10–15 m/s, while the remaining half reaches wind speeds of 15–20 m/s. The entire surface of the Red Sea has a maximum wave height of 6–8 m, like most of the Persian Gulf, except for a minor portion that records a maximum wave height of 8–10 m. Overall, both regions typically experience maximum individual wave heights below 8 m and maximum wind speeds below 15 m/s, as represented by Figure 9 and Table 3. The maritime regions of the Gulf of Aden, situated between Yemen and Somalia, as well as the southern Arabian Sea near Oman, regularly experience storms.
The Arabian Peninsula has excellent wind and solar resources, and so it is questionable whether floating PV in the Red Sea or Persian Gulf will be required.

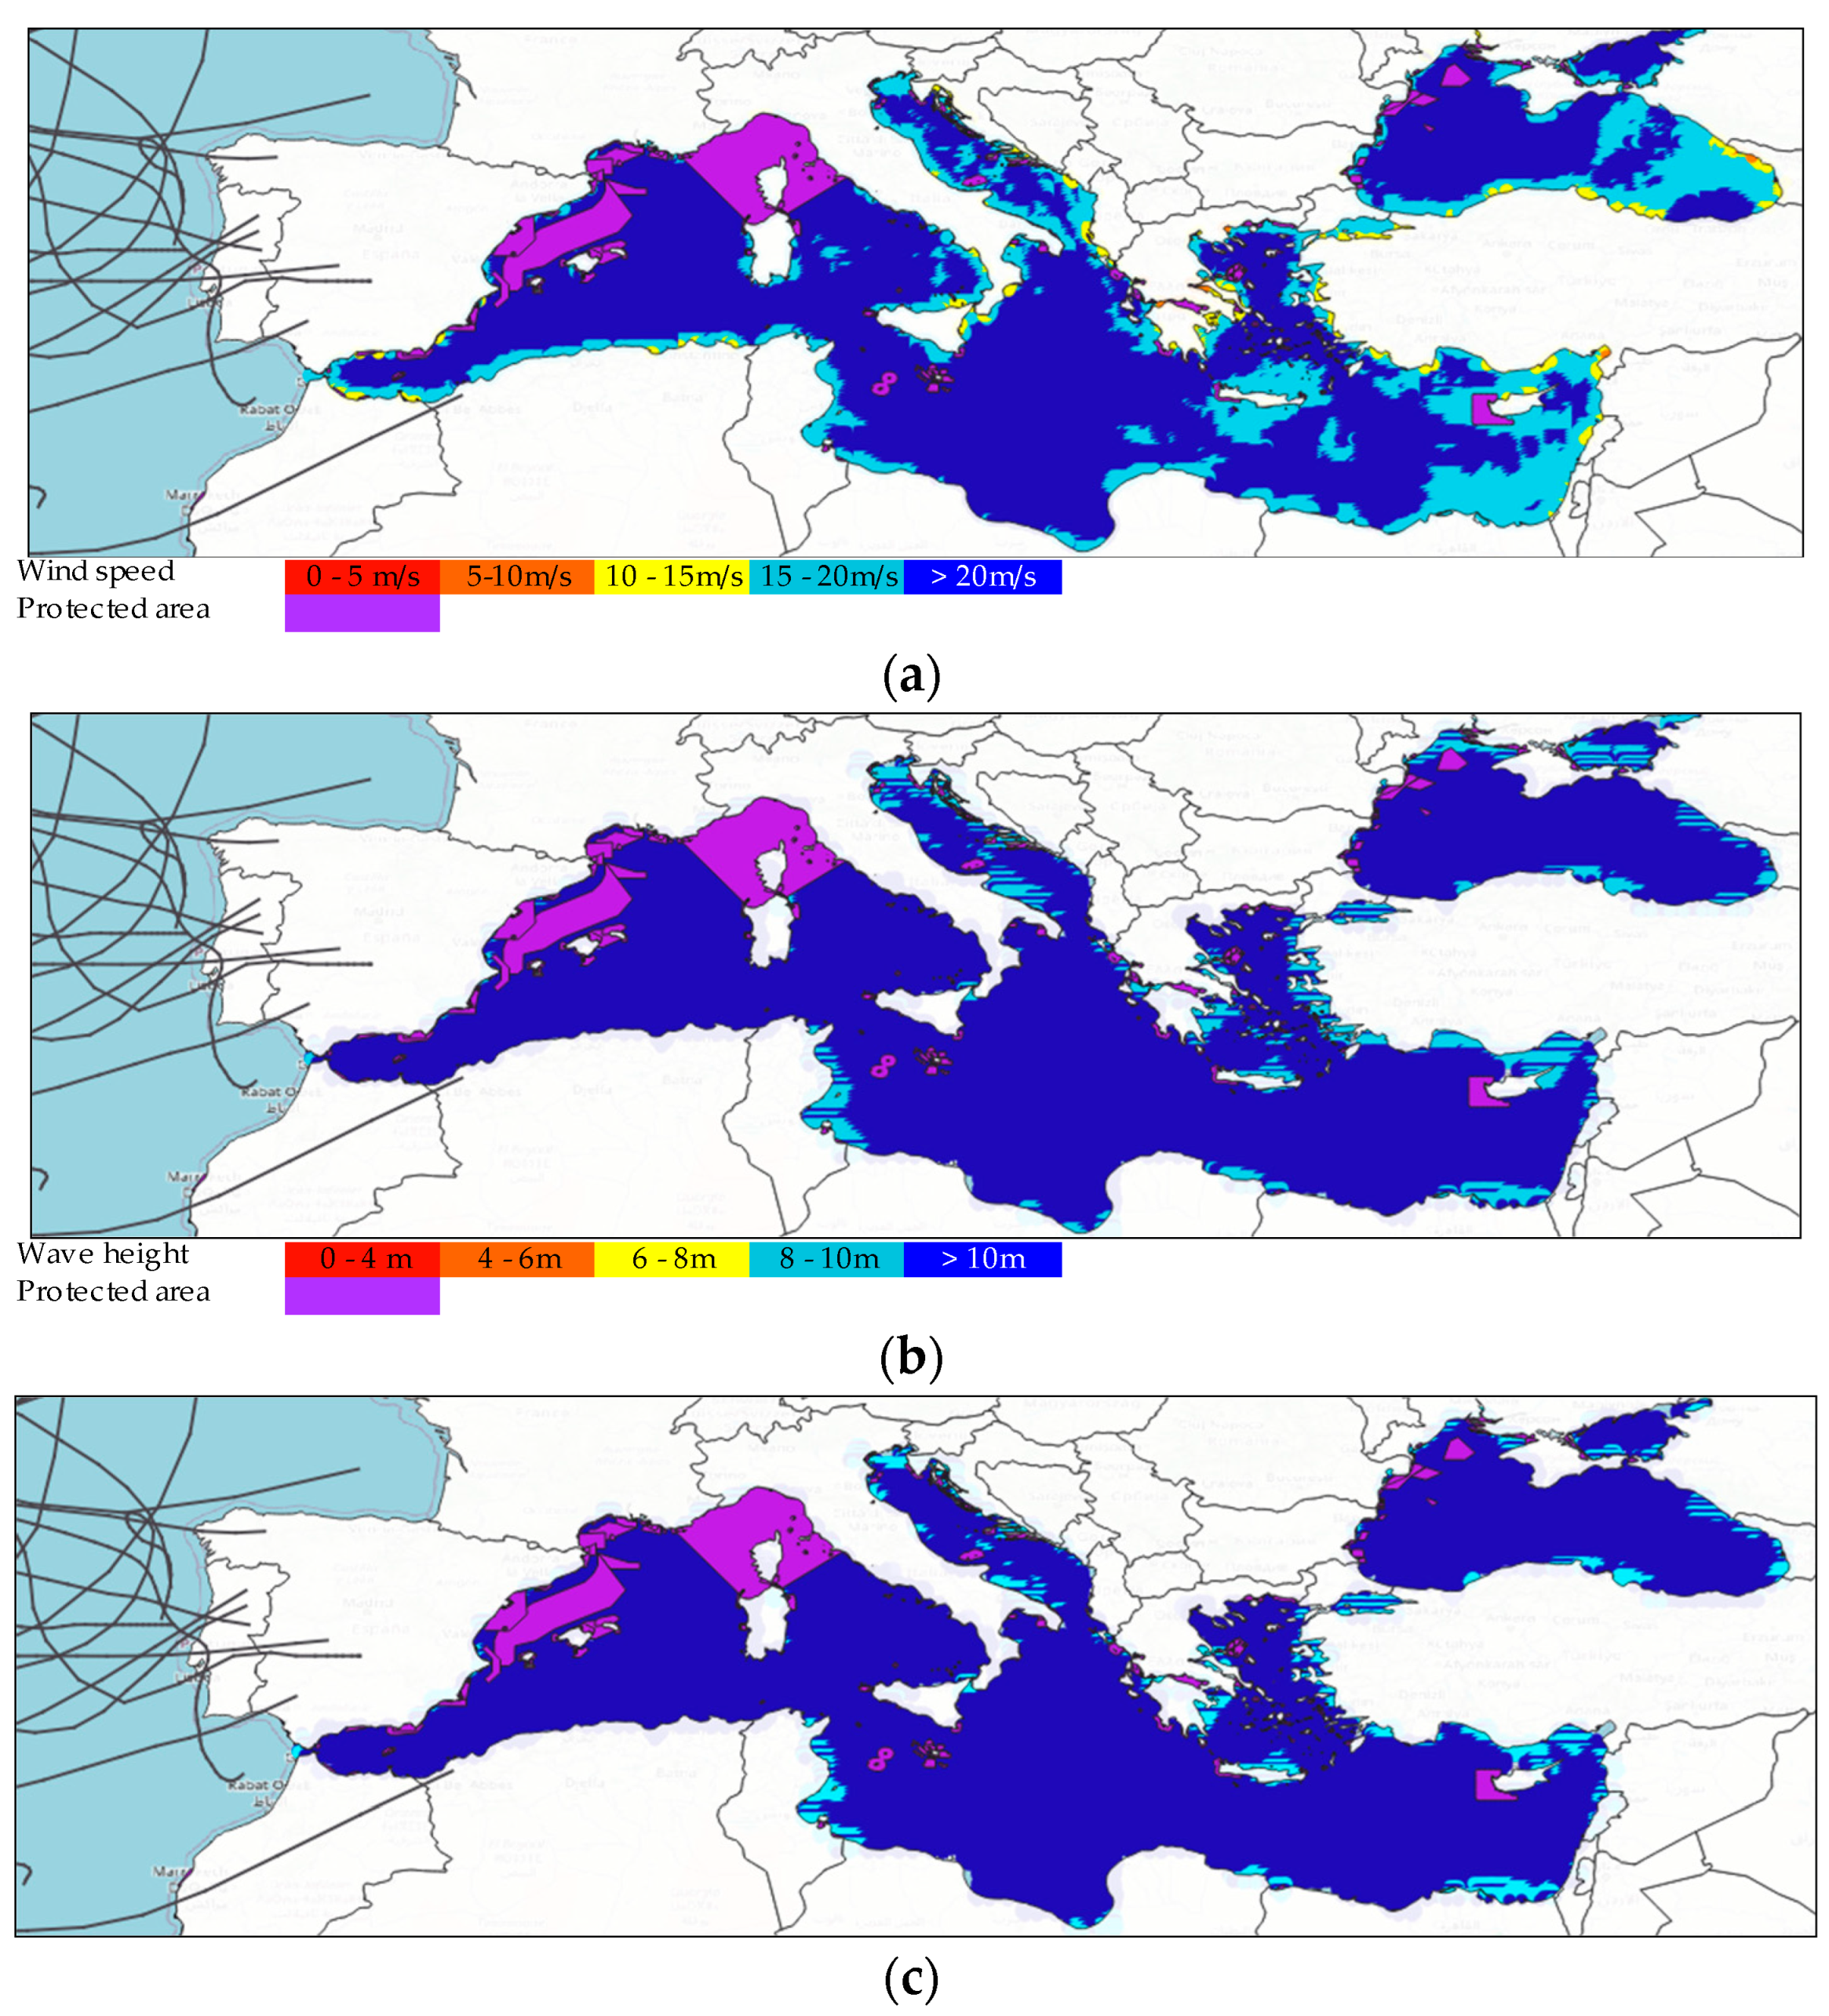
4.3. The Mediterranean and Black Sea (Region III)

The Mediterranean Sea and the Black Sea are located at the southern edge of Europe, which has a high population density and a northerly latitude. It would be advantageous if substantial capacity for floating PV were available to supplement land-based PV and the immense offshore wind resources in the North, Irish, and Baltic Seas.
Nearly all areas of the Mediterranean and Black Seas experience large waves of more than 10 m, although tropical storms do not penetrate this far north. Protected regions such as the northern Adriatic and the Greek Isles, as shown by Figure 10, offer scope for floating PV systems that have engineering defences sufficient to withstand waves up to 10 m in height. About 29,000 TWh per annum (Table 4) could be generated in such systems if they could also survive wind speeds of up to 20 m/s (assuming a capacity factor of 14%). Such systems would need to compete economically with land-based PV in southern Europe and northern Africa.

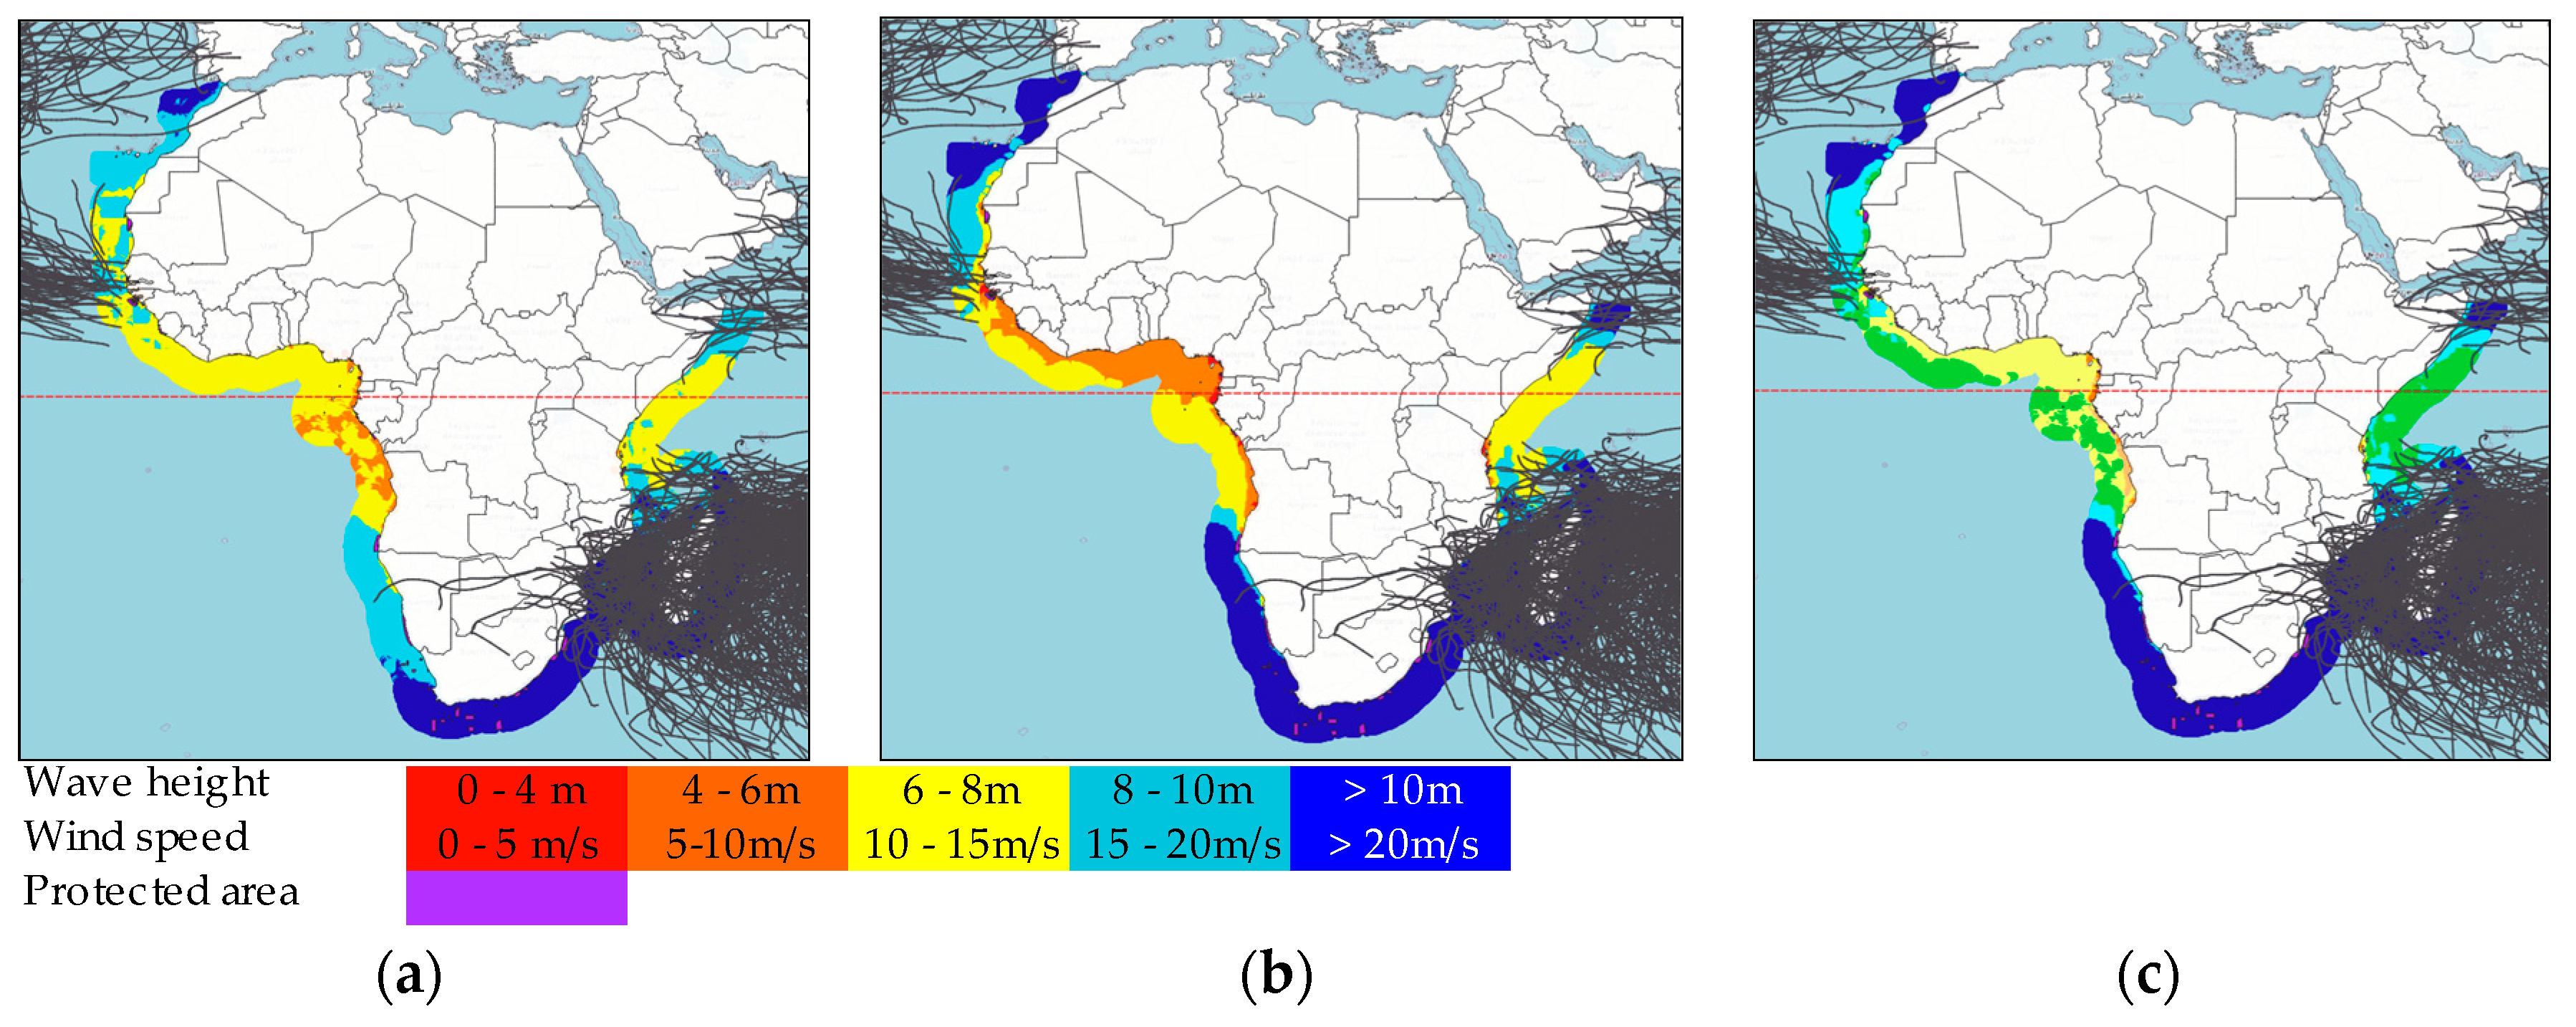
4.4. Africa (Region IV)

Equatorial Africa has enormous scope for floating PV (Table 5). There is potential for 11,000 TWh of floating solar generation from regions that do not experience waves larger than 4 m in height or winds stronger than 15 m/s (Figure 11). This is enough for 550 million affluent people—about one third of Africa’s current population. If the tolerable maximum wave height is 6 m, then the available resource increases to 300,000 TWh per annum, which is enough for 15 billion affluent people. It is notable that the open sea in the Gulf of Guinea does not experience large waves.
Floating PV has the potential to reduce land use conflicts. Countries bordering the Gulf of Guinea are experiencing large population growth rates. Nigeria is projected to reach 377 million people in 2050 [47] and become the world’s third most populous country. It already has one of the highest population densities [48] in Africa, at 250 people per km2. In 2050, 377 million affluent Nigerians could generate 7500 TWh per annum, sufficient for all their energy needs, from 6 TW of floating PV covering 30,000 km2 of Nigeria’s territorial seas.

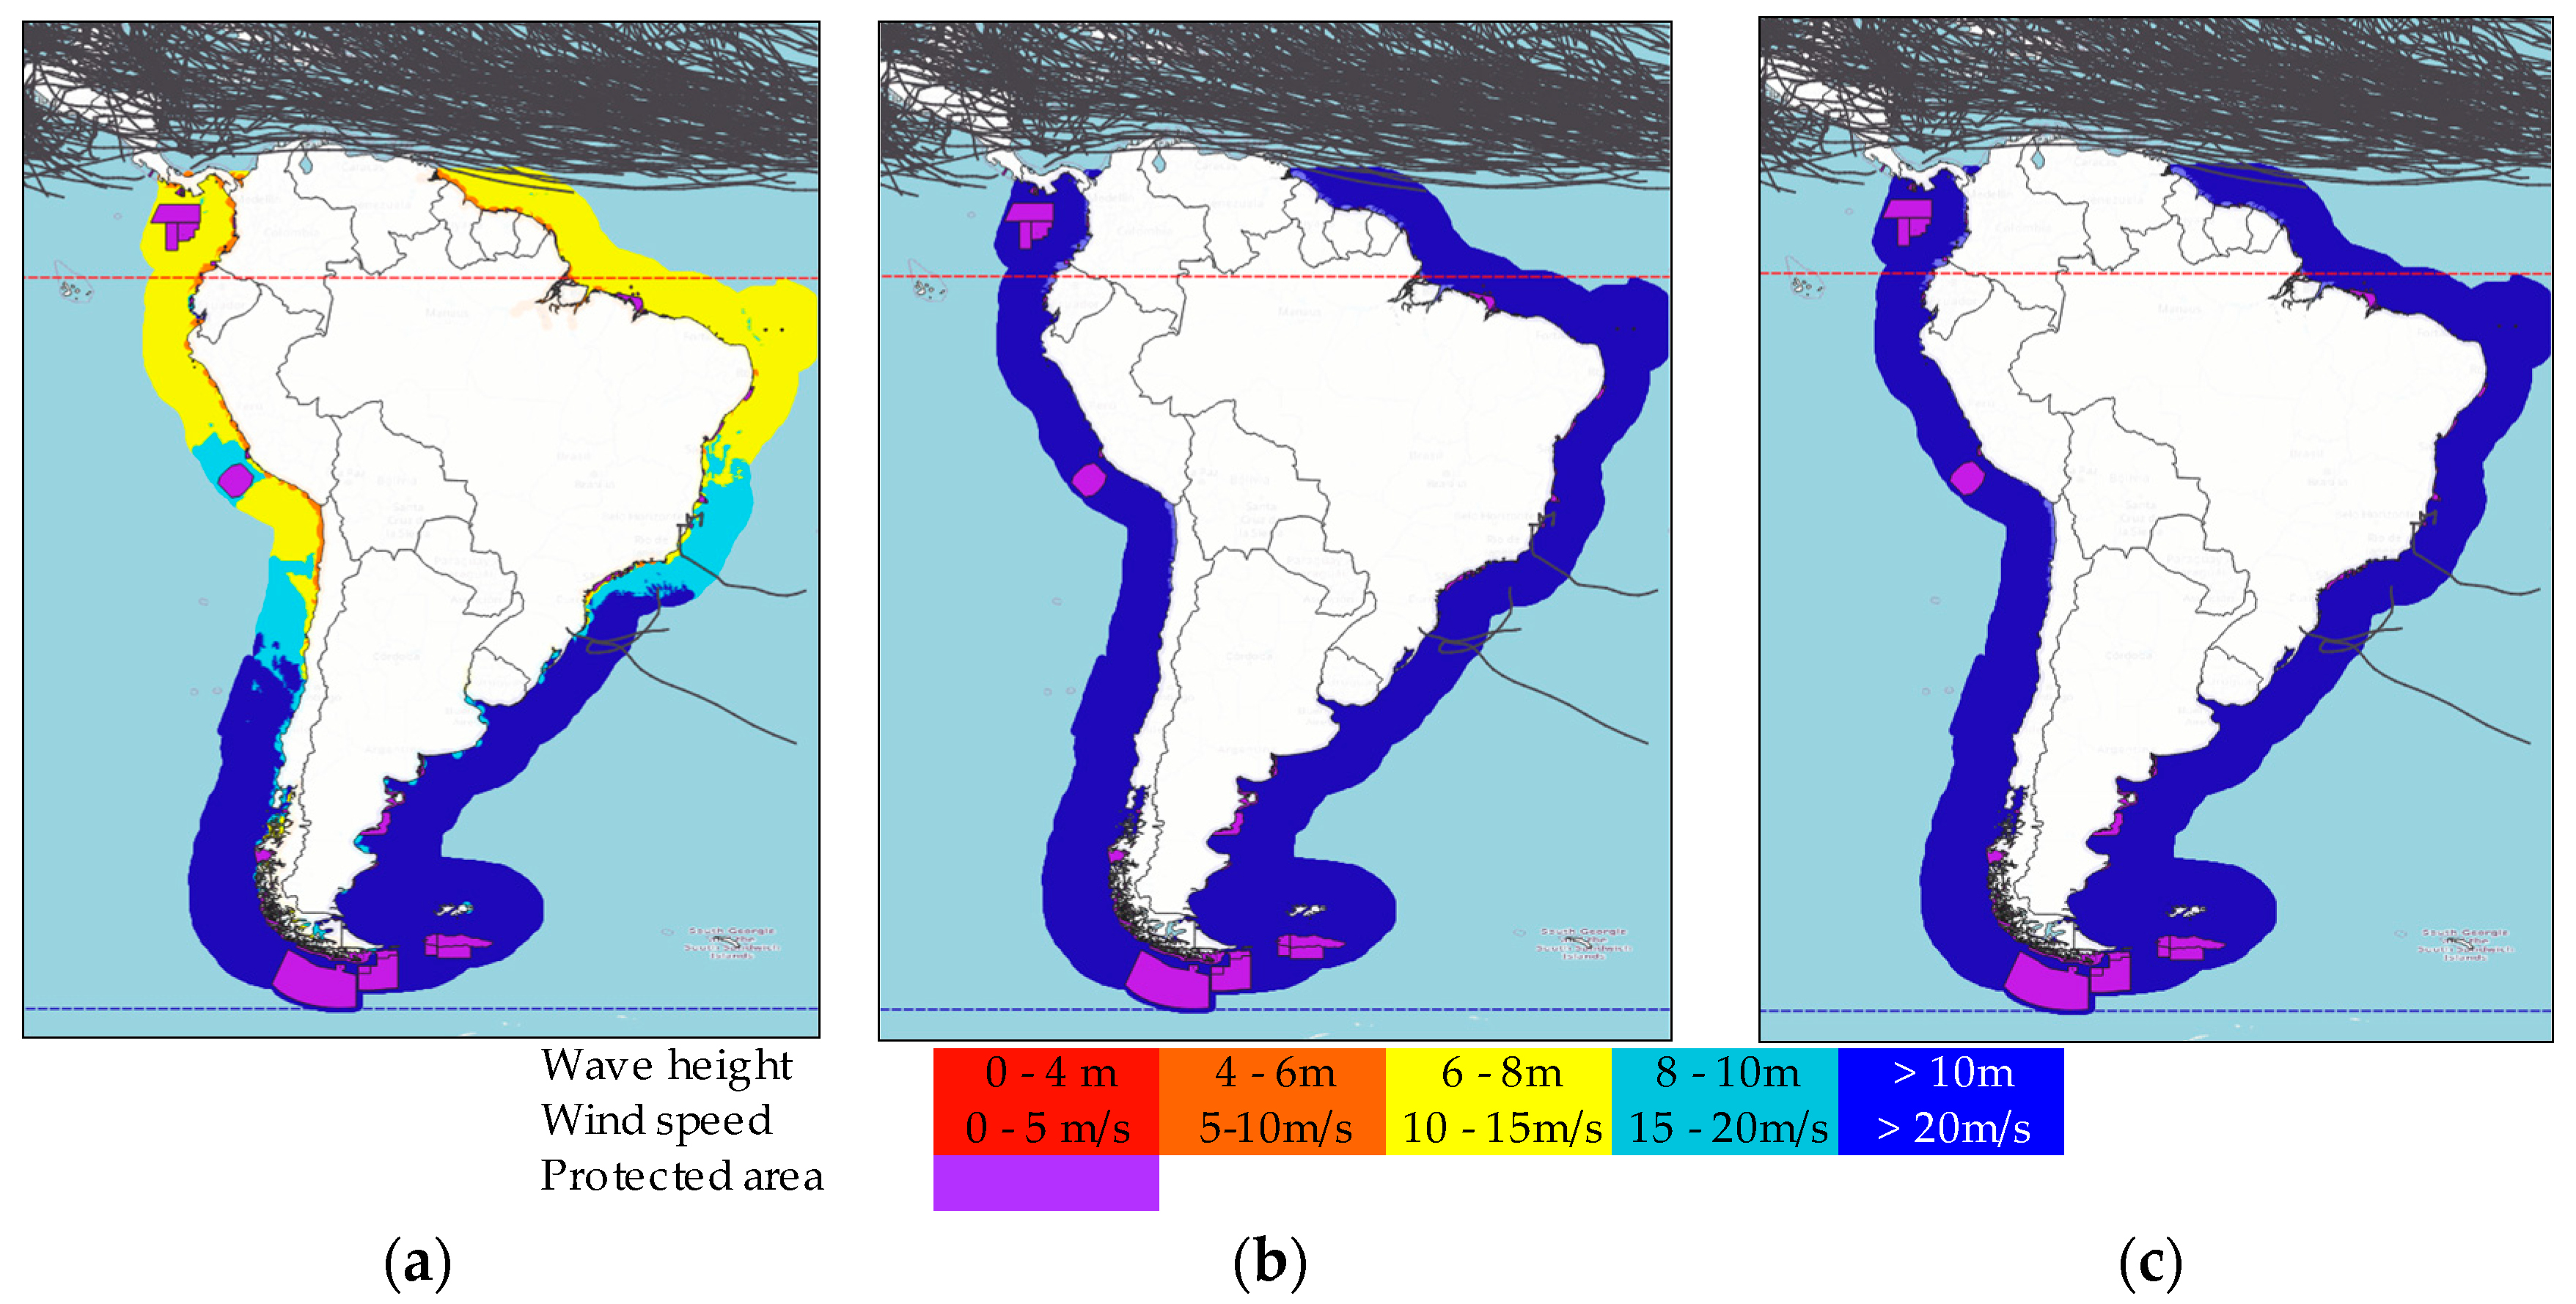
4.5. South America (Region V)

The northern half of South America experiences gentle winds; about 28 thousand km2 of seascape does not experience winds stronger than 15 m/s (Table 6). However, Central America is subject to frequent tropical storms, while almost the entire South American coastline is subject to large waves (>10 m), as shown in Figure 12. Offshore floating PV in Central and South America is unlikely to be an economical proposition because of the need for extensive and expensive engineering defences.

5. Conclusions

A global assessment of suitable maritime areas for the installation of offshore floating PV systems has been conducted, considering maximum wind speeds, maximum wave heights, protected areas, and territorial considerations. Maximum wave height and wind speeds over 40 years (1980–2020) were utilised.
Most of the global seascape experiences waves larger than 10 m and winds stronger than 20 m/s. The engineering defences required for floating PV under such conditions may render them uneconomic compared with land-based solar and wind turbines (both onshore and offshore). However, in some areas, offshore floating PV is potentially an important component of a 100% renewable energy future.
The most prospective regions cluster within 5–12 degrees of latitude of the equator, principally in and around the Indonesian archipelago and in the Gulf of Guinea in the vicinity of Nigeria and neighbouring countries. These regions have low potential for wind generation, high population density, rapid growth in both population and energy consumption, and substantial intact ecosystems that should not be cleared for solar farms.
The economical scope for offshore floating PV in Central and South America is limited by tropical storms and large waves. The Middle East has large technical potential, although there will be strong competition from land-based solar and wind farms. Europe has some prospects in sheltered areas, such as the northern Adriatic Sea and around the Greek Isles.
The combined offshore floating solar PV annual generation potential for regions that do not experience waves larger than 4 m or winds stronger than 15 m/s is 220,000 TWh. This is sufficient for all the energy needs of an affluent global population of 11 billion people. If maximum wave heights of 6 m can be tolerated, then the annual energy generation potential rises to about one million TWh as an upper bound.
The analysis and conclusions presented in this paper depend on the accuracy of meteorological reanalysis. Further work is required to ensure that the ERA5 data really does capture the historically largest waves and strongest winds. Additionally, tsunamis could be a significant risk in some areas. Finally, some maritime areas may be excluded because of their impact on fishing, navigation, the expansion of protected areas, and other factors.

Supplementary Materials

Map details can be accessed at https://re100.eng.anu.edu.au/ (accessed on 21 July 2023).

Author Contributions

Conceptualisation, D.F.S. and A.B.; data curation, D.F.S.; formal analysis, D.F.S.; methodology, D.F.S. and A.B.; supervision, A.B.; validation, A.B.; visualisation, D.F.S.; writing—original draft, D.F.S.; writing—review and editing, A.B. All authors have read and agreed to the published version of the manuscript.

Funding

The APC was funded by the Australian National University. D.F.S.’s ongoing PhD study is funded by the Indonesia Endowment Fund for Education (LPDP).

Institutional Review Board Statement

Not applicable.

Informed Consent Statement

Not applicable.

Data Availability Statement

Not applicable.

Conflicts of Interest

The authors declare no conflict of interest.

References

  1. Blakers, A. Despairing about Climate Change? These 4 Charts on the Unstoppable Growth of Solar May Change Your Mind. Available online: https://theconversation.com/despairing-about-climate-change-these-4-charts-on-the-unstoppable-growth-of-solar-may-change-your-mind-204901 (accessed on 4 June 2023).
  2. Net Zero by 2050—Analysis—IEA. Available online: https://www.iea.org/reports/net-zero-by-2050 (accessed on 15 May 2023).
  3. World Energy Transitions Outlook. Available online: https://www.irena.org/publications/2021/Jun/World-Energy-Transitions-Outlook (accessed on 4 June 2023).
  4. Energy Data Explorer—Our World in Data. Available online: https://ourworldindata.org/explorers/energy?tab=table&amp%3Bfacet=none&amp%3Bcountry=USA~GBR~CHN~OWID_WRL~IND~BRA~ZAF&amp%3BTotal+or+Breakdown=Total&amp%3BEnergy+or+Electricity=Electricity+only&amp%3BMetric=Annual+generation (accessed on 4 June 2023).
  5. Lu, B.; Blakers, A.; Stocks, M.; Cheng, C.; Nadolny, A. A Zero-Carbon, Reliable and Affordable Energy Future in Australia. Energy 2021, 220, 119678. [Google Scholar] [CrossRef]
  6. World Population Prospects—Population Division—United Nations. Available online: https://population.un.org/wpp/Download/Standard/CSV/ (accessed on 15 May 2023).
  7. The World Bank and the International Finance Corporation Global Solar Atlas. Available online: https://globalsolaratlas.info/map (accessed on 4 June 2023).
  8. Agricultural Area over the Long-Term, 1600 to 2016. Available online: https://ourworldindata.org/grapher/total-agricultural-area-over-the-long-term (accessed on 4 June 2023).
  9. Global Wind Atlas. Available online: https://globalwindatlas.info/en/area/Indonesia?print=true (accessed on 22 January 2021).
  10. Bontempo Scavo, F.; Tina, G.M.; Gagliano, A.; Nižetić, S. An Assessment Study of Evaporation Rate Models on a Water Basin with Floating Photovoltaic Plants. Int. J. Energy Res. 2021, 45, 167–188. [Google Scholar] [CrossRef]
  11. Trapani, K.; Redõn Santafé, M. A Review of Floating Photovoltaic Installations: 2007–2013. Prog. Photovolt. Res. Appl. 2015, 23, 524–532. [Google Scholar] [CrossRef] [Green Version]
  12. Solar Energy Research Institute of Singapore. Where Sun Meets Water: Floating Solar Market Report; Solar Energy Research Institute of Singapore: Singapore, 2019. [Google Scholar]
  13. Center for International Earth Science Information Network at Columbia University. Percentage of Total Population Living in Coastal Areas; Center for International Earth Science Information Network at Columbia University: New York, NY, USA, 2017. [Google Scholar]
  14. The OCEAN Conference. Ocean Fact Sheet Package. Available online: https://www.un.org/sustainabledevelopment/wp-content/uploads/2017/05/Ocean-fact-sheet-package.pdf (accessed on 21 July 2023).
  15. Kumar, M.; Mohammed Niyaz, H.; Gupta, R. Challenges and Opportunities towards the Development of Floating Photovoltaic Systems. Sol. Energy Mater. Sol. Cells 2021, 233, 111408. [Google Scholar] [CrossRef]
  16. Sahu, A.; Yadav, N.; Sudhakar, K. Floating Photovoltaic Power Plant: A Review. Renew. Sustain. Energy Rev. 2016, 66, 815–824. [Google Scholar] [CrossRef]
  17. Oliveira-Pinto, S.; Stokkermans, J. Marine Floating Solar Plants: An Overview of Potential, Challenges and Feasibility. Proc. Inst. Civ. Eng.—Marit. Eng. 2020, 173, 120–135. [Google Scholar] [CrossRef]
  18. Cazzaniga, R.; Rosa-Clot, M. The Booming of Floating PV. Sol. Energy 2021, 219, 3–10. [Google Scholar] [CrossRef]
  19. Golroodbari, S.Z.; van Sark, W. Simulation of Performance Differences between Offshore and Land-Based Photovoltaic Systems. Prog. Photovolt. Res. Appl. 2020, 28, 873–886. [Google Scholar] [CrossRef]
  20. Testing the Waters with Floating Solar Plants|Energy Global. Available online: https://www.energyglobal.com/special-reports/11042023/testing-the-waters-with-floating-solar-plants/ (accessed on 15 May 2023).
  21. International Renewable Energy Agency Energy from the Sea: An Action Agenda for Deploying Offshore Renewables Worldwide. Available online: https://www.irena.org/events/2021/May/An-Action-Agenda-for-Deploying-Offshore-Renewables-Worldwide (accessed on 15 May 2023).
  22. Floating PV: On the Rise in Europe—Intersolar Europe. Available online: https://www.intersolar.de/market-trends/floating-pv-europe (accessed on 4 June 2023).
  23. Power Plant Profile: Saemangeum Floating Solar Power Project, South Korea. Available online: https://www.power-technology.com/marketdata/power-plant-profile-saemangeum-floating-solar-power-project-south-korea/ (accessed on 20 May 2023).
  24. Global Industry Analysts, Inc. Global Industry Analysts Predicts the World Floating Solar Panels Market to Reach 4.8 Thousand MW by 2026; Global Industry Analysts, Inc.: San Jose, CA, USA, 2022. [Google Scholar]
  25. Ocean Sun Has Signed a Technology License Agreement for 0.5 MWp Offshore Pilot in Haiyang, Shandong, China|Ocean Sun. Available online: https://oceansun.no/ocean-sun-has-signed-a-technology-license-agreement-for-0-5-mwp-offshore-pilot-in-haiyang-shandong-china/ (accessed on 22 May 2023).
  26. Climate Reanalysis|Copernicus. Available online: https://climate.copernicus.eu/climate-reanalysis (accessed on 4 June 2023).
  27. Hersbach, H.; Bell, B.; Berrisford, P.; Hirahara, S.; Horányi, A.; Muñoz-Sabater, J.; Nicolas, J.; Peubey, C.; Radu, R.; Schepers, D.; et al. The ERA5 Global Reanalysis. Q. J. R. Meteorol. Soc. 2020, 146, 1999–2049. [Google Scholar] [CrossRef]
  28. Graham, R.M.; Hudson, S.R.; Maturilli, M. Improved Performance of ERA5 in Arctic Gateway Relative to Four Global Atmospheric Reanalyses. Geophys. Res. Lett. 2019, 46, 6138–6147. [Google Scholar] [CrossRef] [Green Version]
  29. Tetzner, D.; Thomas, E.; Allen, C. A Validation of ERA5 Reanalysis Data in the Southern Antarctic Peninsula—Ellsworth Land Region, and Its Implications for Ice Core Studies. Geosciences 2019, 9, 289. [Google Scholar] [CrossRef] [Green Version]
  30. Belmonte Rivas, M.; Stoffelen, A. Characterizing ERA-Interim and ERA5 Surface Wind Biases Using ASCAT. Ocean Sci. 2019, 15, 831–852. [Google Scholar] [CrossRef] [Green Version]
  31. Olauson, J. ERA5: The New Champion of Wind Power Modelling? Renew. Energy 2018, 126, 322–331. [Google Scholar] [CrossRef] [Green Version]
  32. Kalverla, P.C.; Duncan, J.B., Jr.; Steeneveld, G.-J.; Holtslag, A.A.M. Low-Level Jets over the North Sea Based on ERA5 and Observations: Together They Do Better. Wind Energy Sci. 2019, 4, 193–209. [Google Scholar] [CrossRef] [Green Version]
  33. Wang, J.; Wang, Y. Evaluation of the ERA5 Significant Wave Height against NDBC Buoy Data from 1979 to 2019. Mar. Geod. 2022, 45, 151–165. [Google Scholar] [CrossRef]
  34. ERA5: How to Calculate Wind Speed and Wind Direction from u and v Components of the Wind?—Copernicus Knowledge Base—ECMWF Confluence Wiki. Available online: https://confluence.ecmwf.int/pages/viewpage.action?pageId=133262398 (accessed on 15 May 2023).
  35. ERA5 Hourly Data on Single Levels from 1940 to Present. Available online: https://cds.climate.copernicus.eu/cdsapp#!/dataset/reanalysis-era5-single-levels?tab=overview (accessed on 15 May 2023).
  36. Knapp, K.R.; Kruk, M.C.; Levinson, D.H.; Diamond, H.J.; Neumann, C.J. The International Best Track Archive for Climate Stewardship (IBTrACS). Bull. Am. Meteorol. Soc. 2010, 91, 363–376. [Google Scholar] [CrossRef] [Green Version]
  37. Naval Meteorology and Oceanography Command Western North Pacific Ocean Best Track Data. Available online: https://www.metoc.navy.mil/jtwc/jtwc.html?western-pacific (accessed on 15 May 2023).
  38. Naval Meteorology and Oceanography Command Southern Hemisphere Best Track Data. Available online: https://www.metoc.navy.mil/jtwc/jtwc.html?southern-hemisphere (accessed on 15 May 2023).
  39. Naval Meteorology and Oceanography Command North Indian Ocean Best Track Data. Available online: https://www.metoc.navy.mil/jtwc/jtwc.html?north-indian-d (accessed on 15 May 2023).
  40. National Centers for Environmental Information (NCEI). Available online: https://www.ncei.noaa.gov/ (accessed on 4 June 2023).
  41. Tropical Cyclone—Weather Satellites, Aircraft Reconnaissance, and El Niño/La Niña|Britannica. Available online: https://www.britannica.com/science/tropical-cyclone/Tracking-and-forecasting (accessed on 16 May 2023).
  42. Marine and Land Zones: The Union of World Country Boundaries and EEZs. Available online: https://www.marineregions.org/sources.php#unioneezcountry (accessed on 15 May 2023).
  43. The World Database on Protected Areas (WDPA). Available online: https://www.protectedplanet.net/en/thematic-areas/wdpa?tab=WDPA (accessed on 15 May 2023).
  44. Silalahi, D.F.; Blakers, A.; Stocks, M.; Lu, B.; Cheng, C.; Hayes, L. Indonesia’s Vast Solar Energy Potential. Energies 2021, 14, 5424. [Google Scholar] [CrossRef]
  45. Persian Gulf|Gulf, Middle East|Britannica. Available online: https://www.britannica.com/place/Persian-Gulf (accessed on 31 May 2023).
  46. Red Sea|Sea, Middle East|Britannica. Available online: https://www.britannica.com/place/Red-Sea (accessed on 31 May 2023).
  47. Nigeria: Population Forecast 2025–2050|Statista. Available online: https://www.statista.com/statistics/1122955/forecast-population-in-nigeria/ (accessed on 4 June 2023).
  48. Countries by Population Density|Countries by Density 2023. Available online: https://worldpopulationreview.com/country-rankings/countries-by-density (accessed on 4 June 2023).
Figure 1. Floating solar PV system with its components. Image from Solar Energy Research Institute of Singapore [12].
Solar 03 00023 g001
Figure 2. Cumulative global installed capacity of floating PV. Data source from [12,22,24].
Solar 03 00023 g002
Figure 3. Formula of wind speed calculation redrawn from ECMWF’s image [34].
Solar 03 00023 g003
Figure 4. Major tracks and frequency of hurricanes and typhoons. Image from Encylopedia Britannica [41].
Solar 03 00023 g004
Figure 5. Flowchart of site assessments of offshore FPV sites.
Solar 03 00023 g005
Figure 6. Five selected area of analysis avoiding historical storm paths: the seas of Southeast Asia (I); the Red Sea and Persian Gulf (II); the Mediterranean and Black Seas (III); equatorial Africa (IV); and South America (V).
Solar 03 00023 g006
Figure 7. World’s maritime: (a) maximum wind speed, (b) maximum wave height, (c) combined maximum wind speed and wave height. Detailed map can be accessed at http://re100.eng.anu.edu.au/ (accessed on 21 July 2023) (Supplementary Materials).
Solar 03 00023 g007aSolar 03 00023 g007b
Figure 8. Southeast Asia’s maritime: (a) maximum wind speed, (b) maximum wave height, (c) combined maximum wind speed and wave height.
Solar 03 00023 g008aSolar 03 00023 g008b
Figure 9. The Red Sea and Persian Gulf’s maritime: (a) maximum wind speed, (b) maximum wave height, (c) combined maximum wind speed and wave height.
Solar 03 00023 g009aSolar 03 00023 g009b
Figure 10. The Mediterranean and Black Sea’s maritime: (a) maximum wind speed, (b) maximum wave height, (c) combined maximum wind speed and wave height.
Solar 03 00023 g010
Figure 11. Africa’s maritime: (a) maximum wind speed, (b) maximum wave height, (c) combined maximum wind speed and wave height.
Solar 03 00023 g011
Figure 12. South America’s maritime: (a) maximum wind speed, (b) maximum wave height, (c) combined maximum wind speed and wave height.
Solar 03 00023 g012
Table 1. Global maritime floating solar PV potential.
Wave HeightWind Speed
0–5 m/s5–10 m/s10–15 m/s15–20 m/s>20 m/s
0–4 m0.11716698-
0.02341342
0.03451762
4–6 m 13927671234
-2855325
3772732
6–8 m 2144050185127
-43810370
561092513
8–10 m 0.44932147147
-0.199429
0.1129564
>10 m-15722167538
Note: In each cell, the numbers are (top to bottom): (i) area (thousands of km2); (ii) potential solar power (TW); and (iii) potential annual solar generation (thousands of TWh per annum).
Table 2. Southeast Asia’s maritime floating solar PV potential.
Wave HeightWind Speed
0–5 m/s5–10 m/s10–15 m/s15–20 m/s>20 m/s
0–4 m0.11496506-
0.02301301
0.03391711
4–6 m-291776953
635519
846725
6–8 m-32115114519
1423229
1556301
8–10 m -172121111
-34242
45318
>10 m---482624
Note: In each cell, the numbers are (top to bottom): (i) area (thousands of km2); (ii) potential solar power (TW); and (iii) potential annual solar generation (thousands of TWh per annum).
Table 3. Red Sea and Persian Gulf’s maritime floating solar PV potential.
Wave HeightWind Speed
0–5 m/s5–10 m/s10–15 m/s15–20 m/s>20 m/s
0–4 m-----
4–6 m-----
6–8 m-2318329-
06466
1112115
8–10 m--0.125-
0.025
0.039
>10 m-----
Note: In each cell, the numbers are (top to bottom): (i) area (thousands of km2); (ii) potential solar power (TW); and (iii) potential annual solar generation (thousands of TWh per annum).
Table 4. Mediterranean and Black Sea’s maritime floating solar PV potential.
Wave HeightWind Speed
0–5 m/s5–10 m/s10–15 m/s15–20 m/s>20 m/s
0–4 m-----
4–6 m-----
6–8 m-----
8–10 m 0.41110669
-0.07221
0.1326
>10 m-0.4165002079
Note: In each cell, the numbers are (top to bottom): (i) area (thousands of km2); (ii) potential solar power (TW); and (iii) potential annual solar generation (thousands of TWh per annum).
Table 5. Africa’s maritime floating solar PV potential.
Wave HeightWind Speed
0–5 m/s5–10 m/s10–15 m/s15–20 m/s>20 m/s
0–4 m 23192
540
651
4–6 m 110991290
221986
292608
6–8 m 20916172717
4232354
5542571
8–10 m 31080467
62161
81211
>10 m--1312244794
Note: In each cell, the numbers are (top to bottom): (i) area (thousands of km2); (ii) potential solar power (TW); and (iii) potential annual solar generation (thousands of TWh per annum).
Table 6. South America’s maritime floating solar PV potential.
Wave HeightWind Speed
0–5 m/s5–10 m/s10–15 m/s15–20 m/s>20 m/s
0–4 m-----
4–6 m-----
6–8 m-----
8–10 m-----
>10 m-0.5271042
Note: In each cell, the numbers are available area (thousands of km2).
Disclaimer/Publisher’s Note: The statements, opinions and data contained in all publications are solely those of the individual author(s) and contributor(s) and not of MDPI and/or the editor(s). MDPI and/or the editor(s) disclaim responsibility for any injury to people or property resulting from any ideas, methods, instructions or products referred to in the content.

