Article

Effect of Calcium on the Characteristics of Action Potential Under Different Electrical Stimuli

by
Xuan Qiao
and
Wei Yao
*
Shanghai Key Laboratory of Acupuncture Mechanism and Acupoint Function, Department of Aeronautics and Astronautics, Fudan University, 220 Handan Road, Shanghai 200433, China
*
Author to whom correspondence should be addressed.
AppliedMath 2024, 4(4), 1358-1381; https://doi.org/10.3390/appliedmath4040072
Submission received: 31 July 2024 / Revised: 14 October 2024 / Accepted: 21 October 2024 / Published: 1 November 2024

Abstract

:
This study investigates the role of calcium ions in the release of action potentials by comparing two models based on the framework: the standard HH model and a HH + Ca model that incorporates calcium ion channels. Purkinje cells’ responses to four types of electrical current stimuli—constant direct current, step current, square wave current, and sine current—were simulated to analyze the impact of calcium on action potential characteristics. The results indicate that, under the constant direct current stimulation, the action potential firing frequency of both models increased with the escalating current intensity, while the delay time of the first action potential decreased. However, when the current intensity exceeded a specific threshold, the peak amplitude of the action potential gradually diminished. The HH + Ca model exhibited a longer delay in the first action potential compared to the HH model but maintained an action potential release under stronger currents. In response to the step current, both models showed an increased action potential frequency with a higher current, but the HH + Ca model generated subthreshold oscillations under weak currents. With the square wave current, the action potential frequency increased, though the HH + Ca model experienced suppression under high-frequency weak currents. Under the sine current, the action potential frequency rose, with the HH + Ca model showing less depression near the sine peak due to calcium’s role in modulating membrane potential. These findings suggest that calcium ions contribute to a more stable action potential release under varying stimuli.

1. Introduction

Purkinje cells are the largest and most complex output neurons in the cerebellum [1,2]. They receive inputs from the cerebellum and other brain regions, integrating this information through their extensive dendritic arbors and single axons [3]. Their intricate dendritic architecture and diverse ion channels make them ideal models for studying electrophysiological properties [4]. Purkinje cells primarily inhibit the activity of other neurons by releasing the neurotransmitter gamma-aminobutyric acid (GABA) [2,5]. This inhibitory action contributes to the cerebellum’s principal function, which is the fine regulation and coordination of movement [6,7]. Investigating the action potential characteristics of Purkinje cells is essential for understanding the cerebellar function and its underlying neural mechanisms.
An action potential is a transient depolarization of the membrane potential, during which the cell membrane shifts from a negative state relative to the extracellular environment to a brief positive state [8]. This process is driven by the activity of gated ion channels on the cell membrane [9]. The generation of an action potential is a highly organized and complex electrophysiological process that occurs when a cell is stimulated by an external signal of sufficient intensity. This process is initiated when the stimulation intensity reaches or surpasses the cell’s threshold (Point II), triggering rapid and substantial changes in the ion channel activity across the cell membrane. The subsequent depolarization phase (Process III) is marked by a sharp increase in the membrane’s permeability to sodium ions, which flow rapidly into the cell along their concentration gradient. This inward flow of sodium ions leads to a reversal of the membrane potential, switching from the resting state of a positive outside and negative inside to a positive inside and negative outside configuration, thus forming the rising phase of the action potential and reaching its peak (Point IV). During this phase, the membrane potential undergoes rapid and significant changes in amplitude, which is a direct indicator of the cell’s excitability. Following the depolarization phase, the membrane enters the repolarization stage (Process V). At this point, the sodium ion channels gradually close, while potassium ion channels open, allowing potassium ions to exit the cell along their concentration gradient. This outward movement of potassium ions leads to a gradual reduction in the membrane potential. If the potassium ion channels remain open beyond repolarization, the continued outflow of potassium ions can result in an overshoot of the membrane potential, causing the cell to enter a hyperpolarized state (Process VI). Finally, the membrane potential stabilizes as the cell returns to its resting state (Process VII), characterized by the re-establishment of a positive outside and negative inside resting membrane potential. This resting state persists until the arrival of the next stimulus of sufficient intensity. This cyclical process of action potential generation and conduction represents the cell’s rapid response mechanism to external stimuli and plays a critical role in various physiological functions. Each phase of the action potential reflects the intricate dynamics of ion channel activity and membrane potential modulation, which are essential for cellular excitability and signal transmission. A typical action potential and its corresponding stages are illustrated in Figure 1 [10].
The release of neuronal action potentials is mainly related to the transmembrane movement of sodium and potassium ions. Relevant studies have shown that calcium ions also participate in the release of action potentials and play a regulatory role. Building upon the Morris Lecar neuron model, Ren Xin [11] conducted a detailed investigation into the firing dynamics of neurons subjected to electrical stimulation in the presence of calcium ion concentration oscillations. The study revealed that the calcium ion oscillations induced a significant alteration in the neuronal firing patterns. Specifically, the discharge activity transitioned from a simple periodic spiking pattern to a more complex burst firing behavior. This shift underscores the critical role of calcium ions in modulating the excitability and firing patterns of neurons under varying stimulation conditions. Li Ruting et al. [12] investigated the effects of calcium channel inhibition via osthole on the amplitude of the compound action potential (CAP) in the frog sciatic nerve. Their study demonstrated that the suppression of calcium ion channels led to a significant reduction in the amplitude of the CAP, indicating that calcium ion influx plays a crucial role in maintaining the excitability and conduction properties of the sciatic nerve. This finding highlights the importance of calcium channels in modulating neural signal transmission in peripheral nerves. Pattillo et al. [13] investigated the regulatory role of calcium-activated potassium (K-Ca) channels in modulating neurotransmitter release triggered by single action potentials. Their findings revealed that large-conductance K-Ca channels, expressed in presynaptic varicosities, play a critical role in regulating the amplitude of neurotransmitter release. This regulation occurs by modulating the repolarization rate of the action potential, thus influencing synaptic transmission efficacy during single action potential events. Helton et al. [14] examined the functional role of recombinant neuronal L-type calcium channels in the modulation of action potentials. Their study revealed that these channels exhibit rapid activation kinetics and facilitate substantial calcium influx in response to individual action potential waveforms. This significant calcium entry underscores the critical role of L-type calcium channels in shaping the electrophysiological properties of neurons, particularly in regulating the dynamics of action potential signaling.
In Purkinje cells, various ion channels on the cell membrane work collaboratively to influence the generation of action potentials. Among these, calcium ion channels play a critical role in neuronal signal transmission and synaptic plasticity. Simulating the presence or absence of calcium-related channels and comparing the resulting differences between models not only deepens our understanding of calcium ions’ impact on action potential characteristics but also highlights the physiological and pathological significance of this process. Such research is instrumental in elucidating the potential roles of calcium signaling in neurological disorders, such as ataxia and autism spectrum disorders, where abnormalities in calcium signaling may disrupt neuronal function and connectivity. This understanding could provide a theoretical foundation and experimental basis for future therapeutic strategies.
Loewenstein et al. [3] constructed a simplified model to investigate the characteristics of Purkinje cell action potentials, which consists of an instantaneous sodium current, slow h-type current, and voltage independent outward current. Verkerk et al. [15] compared the differences in the action potentials of Purkinje cells in sheep under different electrical stimulation frequencies. Connors et al. [16] simulated cortical excitatory neurons, including regular-spiking (RS) neurons and intrinsically bursting (IB) neurons, such as pyramidal neurons or spiny stellate cells, alongside GABAergic inhibitory interneurons, specifically fast-spiking (FS) neurons, which encompass non-pyramidal cells with smooth or sparse spines. They compared the differences in the action potential firing characteristics among these cell types. Williams et al. [17] investigated the role of mixed cationic currents activated by hyperpolarization in controlling action potential firing in cerebellar Purkinje cells in rats.
Liu Jiaqi [18] used the Izhikevich model to explore the firing characteristics of neuronal action potentials and simulated the firing characteristics of excitatory and inhibitory neurons under different current stimuli [19]. Although the Izhikevich model is effective and computationally efficient, it overlooks the detailed ion flow mechanisms involved in neuronal discharges, describing neuronal firing patterns solely through nonlinear differential equations. Consequently, when simulating certain complex neural phenomena, the Izhikevich model is unable to accurately depict the differences in action potential firing characteristics under varying electrical stimuli resulting from changes in ion channels. In contrast, the HH model is grounded in biological experimental data, yielding simulation results that are typically highly consistent with empirical observations. This model effectively captures the dynamic behavior of ion channels, particularly the effects of sodium (Na+) and potassium (K+) ion flows on the generation and propagation of action potentials. By employing specific conductivity equations, it simulates current changes in ion channels, demonstrating a high biophysical realism and a detailed description of ion dynamics [20]. This capability allows the HH model not only to simulate neuronal action potentials and accurately reflect the electrophysiological behavior of neurons but also to adjust or add parameters to investigate the functions of different ion channels. By incorporating calcium ion channels, the HH model can more precisely simulate the calcium-dependent action potential characteristics of Purkinje cells.
Calcium ions play a crucial role in regulating action potentials in neuronal electrophysiology, but the classic HH model does not fully account for the influence of calcium. Therefore, this study extends the HH model by incorporating calcium ion channels to construct an expanded model (HH + Ca model) that more accurately simulates the response of Purkinje cells under various electrical stimuli. By applying a constant DC, step current, square wave current, and sine wave current, we investigated the effects of calcium ions on action potential firing frequency, delay time, and response characteristics. This research aims to enhance the understanding of the role of calcium in Purkinje cell electrical activity and provide theoretical support for further improvements to neuronal electrophysiological models.

2. Neuron Model

2.1. HH Model

The HH model is a seminal mathematical framework in neuroscience that describes neuronal action potentials. It was developed by Alan Hodgkin and Andrew Huxley in 1952 [21]. This model characterizes the changes in neuronal membrane potential and the associated ion channel dynamics using a set of nonlinear differential equations.
The HH model comprises a voltage-gated sodium ion channel, a delayed rectifier potassium ion channel, a leakage current, and a capacitance current. Its equivalent circuit is illustrated in Figure 2 [21].
Based on the current of each ion channel and membrane capacitance, the equation for the membrane potential change can be derived as follows:
C m d V d t = I e x t I N a + I K + I L ,
where V is the membrane potential, C m is the membrane capacitance, I e x t is the total membrane current per unit area, and the current equations for each ion channel are as follows:
I N a = g N a m 3 h V E N a ,
I K = g K n 4 V E K ,
I L = g L V E L ,
where E N a and E K are the reversal potentials of sodium ions and potassium ions, g N a and g K represent the sodium ion channel and potassium ion channel, g L and E L are the leakage current conductance and leakage current reversal potential per unit area, respectively. m , h , n can be expressed by the following gate variable equations:
d m d t = α m 1 m β m m ,
d h d t = α h 1 h β h h ,
d n d t = α n 1 n β n n ,
The rate constants of the gated variables α m , β m , α h , β h , α n , and β n are in Table 1 [22,23,24]. The parameter values in the simulation are in Table 2 [22,23,25].
In the HH model, the action potential is primarily generated through the interaction between sodium and potassium ion channels. When the membrane potential reaches the threshold, the sodium ion channels rapidly open, resulting in a sodium ion influx and rapid depolarization of the membrane potential, which constitutes the rising phase of the action potential [26,27]. Subsequently, the sodium ion channels become inactive, the potassium ion channels open, and potassium ions exit the cell, leading to the repolarization of the membrane potential and forming the falling phase of the action potential.

2.2. HH + Ca Model

Calcium ions play a crucial role in the generation and regulation of neuronal action potentials, particularly under conditions of high current intensity and high-frequency stimulation. The activity of calcium ion channels significantly influences neuronal excitability and signal transduction. The introduction of calcium-related channels allows for a more accurate simulation of the physiological responses of neurons, elucidating the specific roles of calcium ions in modulating changes in membrane potential and neural signal transmission. This, in turn, enhances our understanding of nervous system function and the mechanisms underlying various disease states [26]. On the basis of the HH model, a voltage-gated calcium ion current I C a , deactivated A-type potassium ion current I K A , and calcium-activated potassium ion current I K C a were added to establish an HH + Ca model to explore the effect of calcium on action potential characteristics under different electrical stimuli. The equivalent circuit is shown in Figure 3.
After adding a calcium ion related current, the membrane potential change equation is as follows:
C m d V d t = I e x t I N a + I K D R + I K A + I K C a + I C a + I L ,
The current equations for each ion channel are as follows:
I N a = g N a m 3 h V E N a ,
I K D R = g K D R n 4 V E K ,
I K A = g A a 3 h A V E K ,
I K C a = g K C a V E K ,
I L = g L V E L ,
The gating variable equations are as follows:
d m d t = α m 1 m β m m ,
d h d t = α h 1 h β h h ,
d n d t = α n 1 n β n n ,
d a d t = α a 1 a β a a ,
d h A d t = α h A 1 h A β h A h A ,
d c d t = α c 1 c β c c ,
The rate constants of the gated variables α m , β m , α h , β h , α n , β n , α a , β a , α h A , β h A , α c , and β c are in Table 1. The parameter values in the simulation are in Table 2.
In the HH + Ca model incorporating the voltage-gated calcium ion current I C a , deactivated A-type potassium ion current I K A , and calcium activated potassium ion current I K C a , the types of currents increase, and the impact of electrical stimulation on action potentials becomes more complex. The calcium ion channels open during depolarization, and the influx of calcium ions further enhances the depolarization; however, the kinetics of the calcium ion channel opening and closing are slower than those of the sodium ion channels. The rapid activation and deactivation of A-type potassium ion currents significantly influence the membrane potential in the early stages of the action potential, and an increase in the rapid repolarization current can counteract the depolarizing effect. The calcium-activated potassium ion current is triggered after the influx of calcium ions, leading to an enhanced efflux of potassium ions and facilitating a more rapid repolarization of the membrane potential.

3. Action Potential Simulation Based on HH and HH + Ca Models

To investigate the effect of calcium on the release characteristics of action potentials under various electrical stimuli, both HH models (without calcium ion-related channels) and HH + Ca models (incorporating calcium ion-related channels) were established. Four different types of electrical stimuli—namely, direct current, step current, square wave current, and sine current—were utilized to simulate action potential release using Python 3.11 software. The characteristics of the action potential release, including frequency, peak interval time, and other parameters, were discussed. Furthermore, the role of calcium ions in the action potential release process was analyzed, and the differences between the two models were compared.

3.1. Characteristics of Action Potential Release Under Direct Current Stimulation

3.1.1. Characteristics of Action Potential Release Under Weak Current Stimulation

A weak constant current is applied to the Purkinje cells in increments of 2 pA, increasing from 2 pA to 10 pA, and the release of action potentials is simulated using the HH and HH + Ca models. As shown in Figure 4, the current intensity increases sequentially from top to bottom.
In the HH model, action potentials are already generated when the current intensity is 2 pA. To clarify the specific current intensity and stimulation time, current intensities lower than this value are subdivided in increments of 0.5 pA. As shown in Figure 5a, action potentials begin to be generated after continuous stimulation for more than 50 ms at a current intensity of 0.5 pA, and the number of actions released gradually increases with the gradual increase in the current intensity. To investigate under what current intensity stimulation action potentials are generated in the HH + Ca model, the steps 6 pA to 8 pA that do not generate action potentials and begin to generate action potentials under continuous stimulation are subdivided in increments of 0.5 pA. As shown in Figure 5b, it can be seen that the voltage of the Purkinje cell is depolarized to the threshold level after a current intensity of 7 pA and the continuous stimulation exceeds 125 ms, resulting in action potentials. Due to the intrinsic activation and inactivation characteristics of calcium ions, prolonged stimulation is required to significantly affect the membrane potential. The existence of I K A requires a greater current and longer stimulation time to overcome its hindering effect during the depolarization process. When the concentration of calcium ions increases, I K C a is activated, generating a potassium ion efflux to counteract some of the depolarization effects, making the membrane potential more stable and making it more difficult to quickly reach the threshold potential, thereby delaying the generation of action potentials.
As shown in Figure 6a,c, when removing the first unstable action potential, under weak electrical stimulation, the peak value of the action potential changes with the intensity of the current. In the HH model, the peak value of the potential first increases and then slowly decreases with the increase in the current intensity, reaching its peak at a current intensity of 8 pA, while in the HH + Ca model, the peak value of the potential shows a monotonically increasing trend. As the current intensity gradually increases to 20 pA, it can be clearly seen from Figure 6b,d that the peak potential in the HH model shows a trend of first increasing and then decreasing with the increase in the current intensity. Similarly, in the HH + Ca model, the peak potential also shows a trend of first increasing and then decreasing, reaching its peak at a current intensity of 14 pA.
Compared to the standard HH model, the HH + Ca model demonstrates a delayed onset of action potential initiation under weak direct current stimulations, requiring longer stimulation durations and higher current intensities to reach the threshold. This delay is attributed to the regulatory effects of calcium ions, which act to stabilize the membrane potential and prevent premature neuronal firing. Such a stabilizing mechanism is critical for maintaining a precise neuronal function and avoiding aberrant excitability that could lead to an impaired signal transmission. This is particularly relevant in the context of neurological disorders such as ataxia, where disruptions in calcium signaling may result in altered neuronal excitability, leading to impaired motor coordination and abnormal responses to weak stimuli. Consequently, the delayed action potential initiation observed in the HH + Ca model underscores the essential role of calcium ions in modulating neuronal responsiveness and ensuring stability under low-intensity stimulation, highlighting its significance in both physiological and pathological conditions.

3.1.2. Characteristics of Action Potential Release Under Moderate to Strong Current Stimulation

Moderate to strong constant currents of 20 pA, 30 pA, 40 pA, 50 pA, and 60 pA are applied to stimulate the neurons, and the release of action potentials is simulated using the HH and HH + Ca models. As shown in Figure 7, the intensity of the current from top to bottom is 20 pA, 30 pA, 40 pA, 50 pA, and 60 pA, respectively.
From the graph, it can be observed that as the current intensity increases, the time interval between adjacent action potentials in both models decreases. This indicates that the number of action potentials generated increases with the rising current intensity. However, as the current intensity continues to increase, the peak values of the action potentials in both models gradually decline, as illustrated in the comparison of the peak values of the first action potential in Figure 8. In the HH model, excessively strong electrical stimulation may cause the sodium ion channels to enter a deactivated state too quickly, resulting in an insufficient sodium ion influx and a subsequent decrease in the peak of the action potential. Furthermore, excessive electrical stimulation can trigger an increase in the potassium ion efflux, accelerating the repolarization process and further diminishing the peak of the action potential.
In the HH + Ca model, intense electrical stimulation may lead to a greater influx of calcium ions, which activates additional calcium-activated potassium ion currents, thereby accelerating repolarization and reducing the peak of the action potential. Enhanced electrical stimulation may also increase the activation and deactivation rates of A-type potassium ion currents, making their initial repolarization effect on the membrane potential more pronounced, which contributes to the reduction in the peak value. Excessive electrical stimulation may disrupt the balance between different ion currents, resulting in an increase in the sodium ion current that is insufficient to offset the increase in the potassium ion current, ultimately leading to a decrease in the peak of the action potential.
From Figure 9, it can be observed that the delay time of the first action potential release in the Purkinje cell decreases with the increasing current intensity in both models. The left figure shows the Purkinje cell emitting its first action potential at approximately 4.5 ms when the current intensity is 20 pA in the HH model. When the current intensity is 60 pA, the Purkinje cell releases its first action potential at approximately 2.5 ms. The right figure shows that under the HH + Ca model, when the current intensity is 20 pA, the Purkinje cell releases its first action potential at approximately 11 ms. When the current intensity is 60 pA, the Purkinje cell releases its first action potential at approximately 2.7 ms.
When the neurons begin to depolarize, the initial action potential generated may discharge in an unstable manner. Consequently, the first action potential is excluded from the analysis, and the time interval between the subsequent peaks is calculated to compare the firing frequency of the action potentials between the two models. As illustrated in Figure 10, the firing frequency of both models increases with the intensity of the current; however, the firing frequency of the HH model is greater than that of the HH + Ca model.
Figure 11, Figure 12 and Figure 13 show the peak time intervals of the two models at the current intensities of 20 pA, 40 pA, and 60 pA, respectively. It can be observed that the peak time intervals for both models gradually decrease with the increasing current intensity, ultimately reaching a stable trend. During each action potential, the sodium channels rapidly open, leading to depolarization, followed by a rapid deactivation, while the potassium channels open to initiate repolarization. At high current intensities, the threshold potential is reached more quickly, resulting in shorter switching periods for these ion channels and, consequently, shorter intervals between the action potentials. During the absolute refractory period, the neurons are unable to generate subsequent action potentials, whereas during the relative refractory period, a stronger stimulus is required to trigger new action potentials. As the current intensity increases, although the threshold within the relative refractory period decreases, it remains constrained by the absolute refractory period, preventing the peak time interval from being infinitely shortened. As the current intensity continues to rise, the firing frequency of the neurons gradually approaches a maximum value; however, the recovery of the sodium channels and the repolarization of the potassium channels require a finite amount of time. Despite further increases in the current intensity, the dynamic processes of these channels cannot be accelerated indefinitely, leading to a stabilization of the action potential intervals.
Additionally, it can be observed from the figure that the peak values of the action potentials in the HH + Ca model are higher than those in the HH model. During the rising phase of the action potential, I C a provides an additional positive charge, prolongs the depolarization time, and increases the degree of the depolarization of the cell membrane. However, I K A limits its inhibitory effect on depolarization. I K C a only works at higher calcium ion concentrations, and its effect is not significant in the early stages of the action potential. These factors collectively contribute to the higher peak potential of the action potential in the HH + Ca model compared to the HH model.
A phase plane diagram analysis was performed on the action potentials. Figure 14 illustrates the action potentials emitted by the two models under different current stimulation intensities within a 20 ms timeframe, while Figure 15 presents the phase plane diagrams of all the peaks emitted by both models during the same interval. The coarse and dense trajectories in the phase plane diagram represent the action potentials after a stable release, whereas the single non-overlapping trajectories depict the phase diagram of the initial action potential that has not yet reached stability. It is evident that the peak of the stable phase diagram decreases with the increasing current intensity, and both models exhibit the same trend.
When d V / d t is a positive value, it indicates that the membrane potential is increasing, and then a turning point appears in the phase diagram. When the action potential reaches the threshold, depolarization begins. The higher the y-axis, the faster the depolarization rate. When d V / d t = 0 is reached, the action potential reaches its peak. When d V / d t is a negative value, it indicates that the membrane potential is decreasing, and the action potential has begun the repolarization process, followed by post hyperpolarization at the next inflection point. In the HH + Ca model, due to the influx of positive charges from calcium ions, I C a prolongs the depolarization and early repolarization stages, and d V / d t does not immediately become very negative after repolarization begins. Instead, when the membrane potential approaches zero, the effect of the calcium ion current remains significant, leading to a decrease in the negative value of d V / d t . I K A provides an instantaneous potassium ion efflux, briefly increasing the negative value of d V / d t , but due to its rapid deactivation, the rate of repolarization slows down. I K C a gradually activates at high calcium ion concentrations, and this delayed effect means that when the membrane potential approaches zero, I K C a begins to increase, enhancing the potassium ion efflux and further repolarizing, causing d V / d t to become more negative again. The interaction of these factors is manifested in the phase plane diagram as the rate of change in d V / d t first slows down and then increases when the membrane potential approaches zero, forming a significant depression.
Under moderate direct current stimulations, both the HH and HH + Ca models exhibit an increase in the action potential firing frequency with the rising current intensity, consistent with findings reported in the literature [25]. However, in comparison to the HH model, the HH + Ca model demonstrate an enhanced stability in the action potential discharge, characterized by reduced fluctuations in the peak amplitude, as illustrated in Figure 15. This increased stability highlights the crucial role of calcium ions in ensuring reliable signal transmission under physiological conditions. The capacity of calcium ions to modulate and stabilize neuronal excitability during moderate stimulation is fundamental for preserving the functional integrity of neural circuits, particularly during essential physiological processes such as motor control and sensory perception.

3.1.3. Characteristics of Action Potential Release Under Strong Current Stimulation

We gradually increase the current intensity from 100 pA to 300 pA and observe the effect of the strong current on the release of action potentials. Due to the continuous external strong current stimulation of the Purkinje cells, the membrane potential may gradually rise to a stable state instead of generating discrete action potentials, and the oscillation of the membrane potential gradually becomes gentle, no longer producing spikes. Simultaneously releasing high-frequency action potentials may lead to energy depletion within the cell, causing cellular damage and preventing the cell from maintaining a normal ion gradient and membrane potential, ultimately resulting in a decrease in and flattening of the peak action potential.
As shown in Figure 16, when the current intensity is 150 pA, the action potential of the HH model gradually decreases from its original peak to an oscillating potential that gradually becomes flat and no longer produces a peak, mainly due to the inactivation of the sodium channels and the excessive activation of the potassium channels. After adding a voltage-gated calcium ion current I C a , deactivated A-type potassium ion current I K A , and calcium activated potassium ion current I K C a , due to the enhanced depolarization ability of the calcium ion influx and the additional repolarization energy provided by the calcium activated potassium channels, the Purkinje cells require a higher current stimulation to reach a state similar to no longer producing peaks. Therefore, the HH + Ca model only shows the same trend at 250 pA, and the peak action potential decreases more significantly with the increase in the current intensity. This also reflects the significant regulatory effect of calcium related channels on the electrophysiological characteristics of neurons.
Under a strong direct current stimulation, the HH + Ca model exhibited a sustained ability to generate action potentials (up to an input current intensity of 250 pA), in contrast to the HH model. This indicates the protective role of calcium ions in mitigating excessive neuronal excitation and preventing depolarization under extreme conditions, which could otherwise result in cellular damage and neuronal dysfunction. By regulating the balance between ion influx and efflux during intense stimulation, calcium ions help to maintain neuronal stability and protect against the detrimental effects of excessive neuronal discharge, such as those observed in epilepsy. These findings have significant implications for the development of therapeutic strategies targeting calcium signaling pathways to alleviate the consequences of hyperexcitability in various neurological disorders.

3.2. Characteristics of Action Potential Release Under Step Current Stimulation

The Purkinje cell is stimulated continuously for 200 ms with each initial current segment, and the same stimulation time is achieved by stepping to the next current of a different intensity. Observing Figure 17a, it is found that the HH model starts generating action potentials when the current step reaches 0.1 pA, indicating that the HH model only requires a small current stimulus to reach the threshold for generating action potentials. However, when the HH + Ca model reaches 0 pA, the neurons are not stimulated, and the membrane potential is mainly dominated by potassium ion permeability, tending towards the reversal potential of potassium ions. When subjected to weak electrical stimulations but not reaching the threshold potential for triggering action potentials, subthreshold oscillations occur. Figure 17b shows that, as the current intensity increases, the amplitude of the oscillations gradually increases.
In Figure 17c, it can be seen that the HH + Ca model starts to release action potentials when the current intensity reaches 7 pA, which is consistent with the results of the constant DC weak current stimulation in Figure 5b. The frequency of the release follows the same trend as the HH model, increasing with the increase in the current intensity. In Figure 17d, the current starts from 10 pA and steps in increments of 10 pA. As the current increases, the frequency of the action potential release increases and the peak gradually decreases, which is consistent with the results of the constant DC strong electrical stimulation in Figure 7.
Figure 18b shows the release frequency of action potentials at each stage of the step current stimulation, with increments of 10 pA from 10 pA. The time interval between two adjacent action potential spikes after distribution was selected to calculate the distribution frequency. When the action potential is stable and distributed, the distribution frequency of both models increases with the increase in the current intensity. The distribution frequency of the HH model is always higher than that of the HH + Ca model. This is because, in the HH model, the sodium channels are rapidly activated and deactivated, while the potassium channels are activated and repolarized quickly after depolarization, allowing the neurons to release multiple action potentials in a relatively short period of time. In the HH + Ca model, I C a causes the membrane potential to remain in a depolarization state for a longer period of time, reducing the rate of repolarization. The rapid activation and deactivation of I K A provide instantaneous negative feedback, inhibiting the frequent release of action potentials. The strong repolarization effect of I K C a further prolongs the interval time between the action potentials.
When the step current reaches a specific intensity and is maintained for a sufficient period of time, the membrane potential and ion channel activation and deactivation dynamics of the neurons will also reach a stable state, allowing the neurons to produce a steady-state response to each step of the current intensity. At each steady state, the firing frequency will be the same as the firing frequency of the corresponding DC constant current. The results in Figure 18a,b also confirm the above theory.

3.3. Characteristics of Action Potential Release Under Square Wave Current Stimulation

Figure 19 shows the distribution of action potentials for the two models under different square wave current intensities and current frequencies. Comparing the graphs, as the current intensity increases at the same frequency, the release frequency of the Purkinje cell action potential increases and the delay time decreases. In the HH + Ca model, compared to the first subplot in Figure 19b,d,f,h,j, which shows the process of gradually increasing the frequency with an input square wave current intensity of 10 pA, the Purkinje cells no longer generate action potentials from 20 Hz onwards. This is because, as the stimulation frequency increases, the influx of calcium ions through the voltage-gated calcium ion channels also increases. At the same time, the accumulation of calcium ions in the cell activates the calcium activated potassium ion channels, and the efflux of potassium ions leads to the hyperpolarization of the cell membrane, thereby inhibiting the generation of action potentials. At higher frequencies exceeding 10 Hz at a current intensity of 10 pA, the duration of the current pulse is shorter, and the cell membrane may not be able to reach the threshold required for an action potential. Increasing the current intensity can overcome the inhibitory effect of the calcium activated potassium ion current, ensuring that the membrane potential reaches the threshold, thereby enabling the cell to generate an action potential under high-frequency stimulation.
In Figure 19a, at a frequency of 10 Hz nd current intensities of 10 pA and 20 pA, an action potential is also generated in the HH model during the phase where the square wave current is 0 pA. This is because, after the square wave current stops, the sodium ion channel has not completely closed and the membrane potential is still in a high depolarization state, which is sufficient to trigger another action potential.
Increasing the frequency of the square wave current leads to a reduction in the number of action potential spikes per cluster in both models. Under high-frequency stimulation, the sodium ion channels do not have sufficient time to recover from the inactive state to the activated state, and each current pulse is inadequate to fully restore the membrane potential, resulting in insufficient depolarization. Consequently, each pulse can only trigger a limited number of action potentials, thereby decreasing the number of action potential spikes per cluster.

3.4. Characteristics of Action Potential Release Under Sine Current Stimulation

Figure 20 illustrates the distribution of action potentials for the two models under varying sine current intensities and frequencies. Under the sine current stimulation, the release pattern of action potentials in the HH + Ca model resembles that of the HH model. At a given frequency, the frequency of the action potential release increases with the rising current intensity; however, increasing the frequency of the sine current results in a reduction in the number of action potential spikes per cluster.
The shape of each action potential cluster is also different from that of the constant DC stimulation, step electrical stimulation, and square wave electrical stimulation. When the current intensity is between 30 pA and 60 pA, both models have a lower amplitude of action potential near the peak, reaching the lowest point at the peak, forming a concave surface. However, the HH + Ca model has a smaller degree of concavity compared to the HH model. In the HH model, during the sine wave peak period, the strong current causes the frequent activation and deactivation of the sodium ion channels, without enough time to recover from the inactive state, resulting in a weakened activation ability. At the same time, increasing the activation of the potassium ion channels accelerates the repolarization process of the membrane potential, shortens the duration of the action potential, and lowers the peak value. In the HH + Ca model, the activation and deactivation process of I C a is slower than that of the sodium ion current. Even during the sine peak period, the change in the calcium ion current is not as rapid and drastic as that of the sodium ion current, thereby reducing the instantaneous impact on the action potential. The calcium ion current can provide a sustained depolarization current during the action potential period, offsetting some of the hyperpolarization effect of the potassium ion current, thereby maintaining the membrane potential and making the depression smaller. I K A is rapidly activated and deactivated, without excessive activation at the sine wave peak, and its instantaneous inhibitory effect can reduce the outflow of potassium ions, preventing the excessive hyperpolarization of membrane potential. Therefore, the amplitude of the action potential will not be significantly reduced at the sine wave peak. The response characteristics of I K C a are relatively slow, and its regulatory effect on the membrane potential is relatively smooth under medium to strong electrical stimulations, without rapidly causing hyperpolarization like the potassium ion current in the HH model, thereby reducing the depression in the action potential.
The HH + Ca model demonstrates a smaller reduction in the action potential amplitude near the peak of the sinusoidal wave, suggesting that calcium ions play a pivotal role in sustaining neuronal excitability during rhythmic oscillatory activity. This regulatory mechanism is particularly important for neurons engaged in rhythmic motor functions, such as those found in the cerebellum, where the precise modulation of excitability is essential for maintaining coordinated motor patterns.
When narrowing the sine electrical stimulation with a current intensity of 20 pA to within 100 ms, as shown in Figure 21, the current rises to a position near the peak, and the interval between the action potential spikes is shorter. In Figure 21a, the HH model generates 19 action potentials under one wave packet, and the time interval of the action potentials gradually decreases from 5.58 ms to 3.35 ms, reaching a peak and then gradually increasing. The HH + Ca model also shows the same trend, generating 13 action potentials under one wave packet, and the time interval of action potentials is the smallest at the peak of the current. From Figure 21b–f, it can be seen that, as the current frequency increases, the number of action potentials emitted gradually decreases, and the time interval of each cluster of action potentials becomes more stable.

4. Discussions

The primary objective of this study is to investigate the impact of calcium ions on action potential firing, particularly focusing on the threshold moment for action potential generation. However, the simulations reveal (see Figure 17a,b) that the introduction of calcium ion-related channels leads to subthreshold oscillations in Purkinje cells during weak electrical stimulation, even when the excitation threshold is not reached. While action potentials are not triggered, these oscillations can still significantly influence neuronal behavior and may play a role in pathological conditions.
Purkinje cells are characterized by their abundant calcium channels and distinctive firing patterns, with subthreshold oscillations potentially yielding important physiological effects. Such oscillations can lower the threshold voltage and current required for action potentials [27], thereby enhancing the excitability of Purkinje cells [28] and making them more responsive to small-amplitude current stimuli [29]. This heightened sensitivity can affect their ability to integrate and transmit information within the cerebellar cortex. Research by Zhang, Q. et al. [30] further corroborates that oscillatory factors can have an excitatory effect on action neurons.
Neuronal excitability is intricately linked to the various pathological states of the nervous system and can significantly influence motor regulation. Abnormal excitability may lead to a range of neurological disorders, impacting motor control and coordination. For instance, excessive neuronal excitability is a hallmark of epilepsy, resulting in seizures that disrupt normal motor functions. In conditions such as Parkinson’s disease, alterations in the excitability of specific neuronal populations can lead to tremors and bradykinesia. Additionally, chronic pain disorders are often associated with increased excitability, which may contribute to motor dysfunction due to heightened sensitivity to pain.
Overall, the subthreshold oscillations of the neuronal membrane potential not only promote the generation of action potentials but also influence movement, thereby enhancing our understanding of neuronal excitatory activity. Recognizing changes in neuronal excitability is essential for elucidating the mechanisms underlying these pathological states and their effects on motor regulation and for identifying potential therapeutic targets.

5. Conclusions

This article mainly studies the effects of the constant DC, step current, square wave current, and sine current on the firing characteristics of the Purkinje cell operating potential. We discuss the characteristics and differences of the HH model and HH + Ca model in simulating action potential release and draw the following conclusions:
(1)
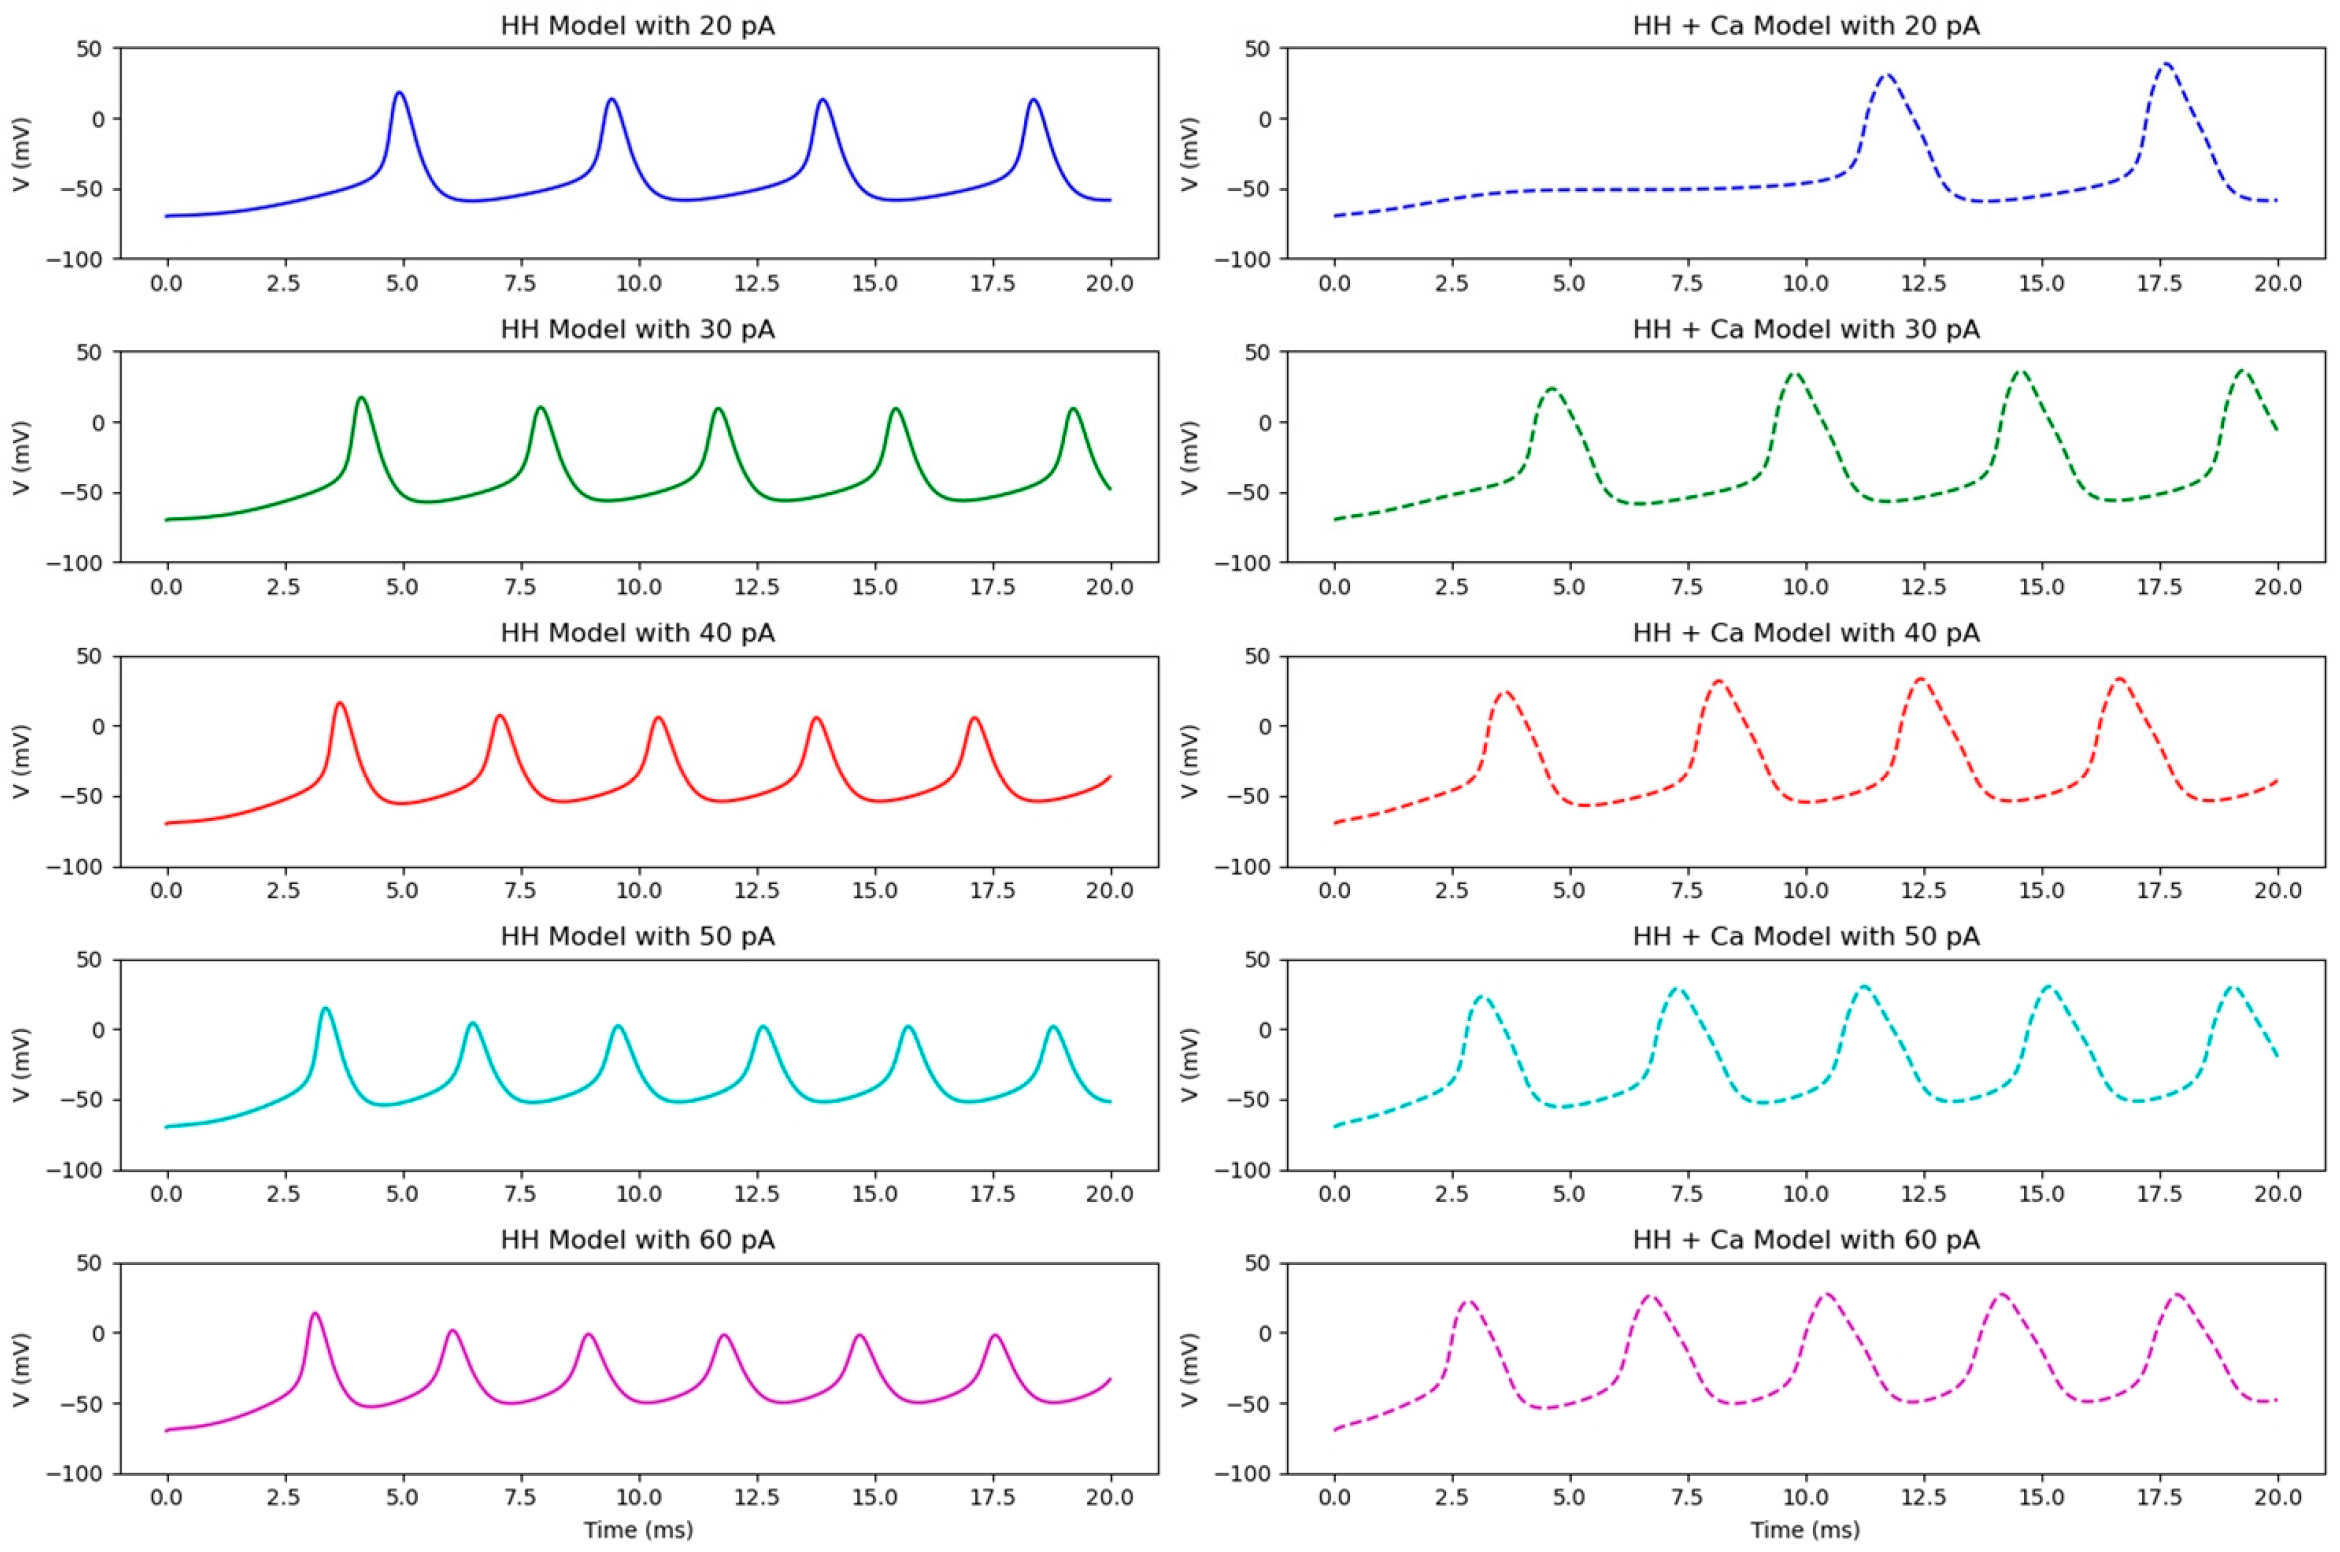
Under a direct current stimulation, the frequency of the action potential release increases with the current intensity, and the delay time of the first action potential is shortened. However, when the current stimulation exceeds a certain threshold, 10   pA , the peak amplitude of the action potential gradually diminishes. The delay time of the first action potential in the HH + Ca model is longer than that in the HH model, while the peak amplitude after a stable release is greater in the HH + Ca model. The firing frequency of the HH model is higher than that of the HH + Ca model. Under a strong current stimulation, the HH + Ca model demonstrates a greater capacity to sustain the action potential release compared to the HH model.
(2)
When a step current is applied, the results are approximately equivalent to those observed under the constant direct current stimulation. The step change in the current induces the depolarization of the membrane potential, thereby triggering the action potential release. As the current intensity increases, the frequency of the action potential release in both models also rises. The HH model exhibits greater sensitivity to current stimulations, as smaller currents can elicit action potentials, whereas the HH + Ca model requires higher current intensities to initiate action potentials. The HH + Ca model may exhibit subthreshold oscillations under weak current stimulations below the threshold, with the oscillation amplitude increasing alongside the current intensity.
(3)
When a square wave current is applied, an increase in the current intensity leads to an increase in the frequency of the action potential release in both models, accompanied by a reduction in the delay time. Increasing the frequency of the square wave current diminishes the number of peak action potentials per cluster. At a current intensity of 10 pA, high-frequency action potentials are completely suppressed in the HH + Ca model, a phenomenon not observed in the HH model. In the HH model, action potentials can still be generated when the square wave current is zero, whereas this does not occur in the HH + Ca model.
(4)
When a sine current is introduced, the frequency of the action potential release in both models increases with the rising current intensity at the same sine current frequency. As the frequency of the sine current escalates, the number of spikes in the action potential clusters decreases. At high current intensities, both models display lower action potential amplitudes near the peak of the sine wave. The continuous depolarizing current provided by the calcium ion current partially offsets the hyperpolarizing effect of the potassium ion current. Additionally, the slow response of the calcium-activated potassium ion channels in the HH + Ca model, along with the rapid activation and inactivation of the A-type potassium ion currents, mitigates the potassium ion outflow and prevents the excessive hyperpolarization of the membrane potential. Collectively, these factors result in a lesser degree of action potential depression in the HH + Ca model compared to the HH model.
By analyzing the effects of various current patterns on the action potential frequency, peak amplitude, and delay time, the study elucidates the critical role of calcium ions in modulating the action potential release. These findings not only provide a crucial foundation for understanding the physiological functions of Purkinje cells under diverse electrical stimuli, but also offer theoretical insights into the role of calcium in the pathological conditions of the nervous system. This research contributes to a deeper understanding of how neurons maintain homeostasis in response to different electrical stimuli, potentially informing the development of therapeutic strategies for neurological disorders. In particular, the regulation of calcium may be central to improving neural function in pathological conditions such as neurodegenerative diseases and epilepsy.

Author Contributions

Conceptualization, W.Y.; methodology, X.Q. and W.Y.; formal analysis, X.Q.; resources, X.Q.; validation, X.Q. and W.Y.; writing—original draft preparation, X.Q. and W.Y.; writing—review and editing, X.Q. and W.Y.; supervision, W.Y.; project administration, W.Y.; funding acquisition, W.Y. All authors have read and agreed to the published version of the manuscript.

Funding

This research was funded by the National Natural Science Foundation of China (grant number: 12172092, 82174488) and Shanghai Key Laboratory of Acupuncture Mechanism and Acupoint Function (grant number: 21DZ2271800).

Institutional Review Board Statement

Not applicable.

Informed Consent Statement

Not applicable.

Data Availability Statement

The original contributions presented in the study are included in the article.

Conflicts of Interest

The authors declare no conflicts of interest.

References

  1. Purves, D.; Augustine, G.J.; Fitzpatrick, D.; Hall, W.C.; LaMantia, A.S.; McNamara, J.O.; White, L.E. Neuroscience, 4th ed.; Sinauer Associates: Sunderland, MA, USA, 2008; pp. 432–434. [Google Scholar]
  2. Than, M.; Szabo, B. Analysis of the Function of GABAB Receptors on Inhibitory Afferent Neurons of Purkinje Cells in the Cerebellar Cortex of the Rat. Eur. J. Neurosci. 2002, 15, 1575–1584. [Google Scholar] [CrossRef] [PubMed]
  3. Loewenstein, Y.; Schaefer, A.T.; Wagner, M.J.; Senn, W.; Larkum, M.E. Bistability of Cerebellar Purkinje Cells Modulated by Sensory Stimulation. Nat. Neurosci. 2005, 8, 202–211. [Google Scholar] [CrossRef] [PubMed]
  4. Fujishima, K.; Kawabata Galbraith, K.; Kengaku, M. Dendritic Self-Avoidance and Morphological Development of Cerebellar Purkinje Cells. Cerebellum 2018, 17, 701–708. [Google Scholar] [CrossRef] [PubMed]
  5. Frederickson, R.C.A.; Burgis, V.; Holmgren, E.; McBride, W.J. A Comparison of the Inhibitory Effects of Taurine and GABA on Identified Purkinje Cells and Other Neurons in the Cerebellar Cortex of the Rat. Brain Res. 1978, 145, 117–126. [Google Scholar] [CrossRef]
  6. Purkinje Cell | Granule Cells, Cerebellum & Neurons | Britannica. Available online: https://www.britannica.com (accessed on 16 January 2024).
  7. Paul, M.S.; Limaiem, F. Histology, Purkinje Cells. In StatPearls; StatPearls Publishing: Treasure Island, FL, USA. Available online: https://www.ncbi.nlm.nih.gov/books/NBK551704/ (accessed on 16 January 2024). [PubMed]
  8. Fry, C.H.; Jabr, R.I. The Action Potential and Nervous Conduction. Surgery 2010, 28, 49–54. [Google Scholar]
  9. Purves, D.; Augustine, G.J.; Fitzpatrick, D. (Eds.) Voltage-Gated Ion Channels. In Neuroscience, 2nd ed.; Sinauer Associates: Sunderland, MA, USA, 2001. [Google Scholar]
  10. Raghavan, M.; Fee, D.; Barkhaus, P.E. Generation and Propagation of the Action Potential. In Handbook of Clinical Neurology, 1st ed.; Elsevier: Amsterdam, The Netherlands, 2019; Volume 160, pp. 3–22. [Google Scholar]
  11. Ren, X. The Effect of Calcium Ion Oscillations on Neuronal and Network Discharge Activity. Master’s Thesis, Shaanxi Normal University, Xi’an, China, 2022. [Google Scholar] [CrossRef]
  12. Li, R.T.; Wei, H.F.; Qin, Y.J.; Xiong, L.Q.; Shen, B.R.; Wang, Y.Y.; Huang, D.M.; Huang, J.; He, S.; Wu, G.Y. Osthole Reduces Compound Action Potential Amplitude in Frog Sciatic Nerve by Blocking Calcium Channels. Liaoning J. Tradit. Chin. Med. 2024, 51, 134–136+222–224. [Google Scholar] [CrossRef]
  13. Pattillo, J.; Yazejian, B.; DiGregorio, D.; Vergara, J.; Grinnell, A.; Meriney, S. Contribution of Presynaptic Calcium-Activated Potassium Currents to Transmitter Release Regulation in Cultured Xenopus Nerve–Muscle Synapses. Neuroscience 2001, 102, 229–240. [Google Scholar] [CrossRef] [PubMed]
  14. Helton, T.D.; Xu, W.; Lipscombe, D. Neuronal L-Type Calcium Channels Open Quickly and Are Inhibited Slowly. J. Neurosci. 2005, 25, 10247–10251. [Google Scholar] [CrossRef] [PubMed]
  15. Verkerk, A.O.; Veldkamp, M.W.; Abbate, F.; Antoons, G.; Bouman, L.N.; Ravesloot, J.H.; van Ginneken, A.C.G. Two Types of Action Potential Configuration in Single Cardiac Purkinje Cells of Sheep. Am. J. Physiol. Heart Circ. Physiol. 1999, 277, H1299–H1310. [Google Scholar] [CrossRef] [PubMed]
  16. Connors, B.W.; Gutnick, M.J. Intrinsic Firing Patterns of Diverse Neocortical Neurons. Trends Neurosci. 1990, 13, 99–104. [Google Scholar] [CrossRef] [PubMed]
  17. Williams, S.R.; Christensen, S.R.; Stuart, G.J.; Häusser, M. Membrane Potential Bistability Is Controlled by the Hyperpolarization-Activated Current IH in Rat Cerebellar Purkinje Neurons in Vitro. J. Physiol. 2002, 539, 469–483. [Google Scholar] [CrossRef] [PubMed]
  18. Liu, J.; Yuan, M.; Qu, X.; Zhou, S. Exploring Neuronal Action Potential Firing Characteristics Using the Izhikevich Model. Ind. Technol. Innov. 2022, 9, 100–107. [Google Scholar]
  19. Liu, J. Simulation of Firing Characteristics of Several Different Types of Neuronal Action Potentials. Ph.D. Thesis, Harbin Normal University, Harbin, China, 2024. [Google Scholar] [CrossRef]
  20. Baranauskas, G.; Martina, M. Sodium Currents Activate Without a Hodgkin-and-Huxley-Type Delay in Central Mammalian Neurons. J. Neurosci. 2006, 26, 671–684. [Google Scholar] [CrossRef] [PubMed]
  21. Hodgkin, A.L.; Huxley, A.F. A Quantitative Description of Membrane Current and Its Application to Conduction and Excitation in Nerve. Bull. Math. Biol. 1990, 52, 25–71. [Google Scholar] [CrossRef] [PubMed]
  22. Kameneva, T.; Meffin, H.; Burkitt, A.N.; Grayden, D.B. Bistability in Hodgkin-Huxley-Type Equations. In Proceedings of the 2018 40th Annual International Conference of the IEEE Engineering in Medicine and Biology Society (EMBC), Honolulu, HI, USA, 18–21 July 2018; IEEE: Piscataway, NJ, USA, 2018; pp. 4728–4731. [Google Scholar]
  23. Kameneva, T.; Meffin, H.; Burkitt, A.N. Modelling Intrinsic Electrophysiological Properties of ON and OFF Retinal Ganglion Cells. J. Comput. Neurosci. 2011, 31, 547–561. [Google Scholar] [CrossRef] [PubMed]
  24. Fohlmeister, J.F.; Coleman, P.A.; Miller, R.F. Modeling the Repetitive Firing of Retinal Ganglion Cells. Brain Res. 1990, 510, 343–345. [Google Scholar] [CrossRef] [PubMed]
  25. Yuan, M. Simulation of Retinal Ganglion Cell Action Potentials Based on HH and FCM Models. Ph.D. Thesis, Harbin Normal University, Harbin, China, 2024. [Google Scholar] [CrossRef]
  26. Stevens, C.F. Neurophysiology: A Primer; John Wiley and Sons: New York, NY, USA, 1966; ISBN 9780471824367. [Google Scholar]
  27. Chen, Y.R. Research Progress on Cell Membrane Oscillation and Its Regulation of Motor Neuron Excitability. Sports Sci. Technol. Lit. Bull. 2023, 31, 249–251. [Google Scholar]
  28. Amitai, Y. Membrane Potential Oscillations Underlying Firing Patterns in Neocortical Neurons. Neuroscience 1994, 63, 151–161. [Google Scholar] [CrossRef] [PubMed]
  29. Powers, R.K.; Türker, K.S. Deciphering the Contribution of Intrinsic and Synaptic Currents to the Effects of Transient Synaptic Inputs on Human Motor Unit Discharge. Clin. Neurophysiol. 2010, 121, 1643–1654. [Google Scholar] [CrossRef] [PubMed]
  30. Zhang, Q.; Dai, Y.; Zhou, J.; Ge, R.; Hua, Y.; Powers, R.K.; Binder, M.D. The Effects of Membrane Potential Oscillations on the Excitability of Rat Hypoglossal Motoneurons. Front. Physiol. 2022, 13, 955566. [Google Scholar] [CrossRef] [PubMed]
Figure 1. Schematic diagram of action potential.
Appliedmath 04 00072 g001
Figure 2. HH model equivalent circuit.
Appliedmath 04 00072 g002
Figure 3. HH + Ca model equivalent circuit.
Appliedmath 04 00072 g003
Figure 4. The release of action potentials in the HH and HH + Ca models under weak electrical stimulations.
Appliedmath 04 00072 g004
Figure 5. (a) The release of action potentials when the current intensity of the HH model increases from 0 pA to 2 pA. (b) The release of action potentials when the current intensity of the HH + Ca model increases from 6 pA to 8 pA.
Appliedmath 04 00072 g005
Figure 6. Peak variation. (a) The peak change in the action potential when the current intensity of the HH model increases from 0 pA to 10 pA. (b) The peak change in the action potential when the current intensity of the HH model increases from 0 pA to 20 pA. (c) The peak change in the action potential when the current intensity of the HH + Ca model increases from 0 pA to 10 pA. (d) The peak change in the action potential when the current intensity of the HH + Ca model increases from 0 pA to 20 pA.
Appliedmath 04 00072 g006
Figure 7. The release of action potentials in the HH and HH + Ca models under moderate to strong electrical stimulations.
Appliedmath 04 00072 g007
Figure 8. Comparison of the peak values of the first action potential.
Appliedmath 04 00072 g008
Figure 9. Delay times of the first action potential.
Appliedmath 04 00072 g009
Figure 10. Frequency of action potential release under different current intensities.
Appliedmath 04 00072 g010
Figure 11. Peak time interval of action potential under 20 pA electrical stimulation.
Appliedmath 04 00072 g011
Figure 12. Peak time interval of action potential under 40 pA electrical stimulation.
Appliedmath 04 00072 g012
Figure 13. Peak time interval of action potential under 60 pA electrical stimulation.
Appliedmath 04 00072 g013
Figure 14. Distribution of action potential under different current intensities within 20 ms.
Appliedmath 04 00072 g014
Figure 15. Phase plane trajectory under different current intensities within 20 ms.
Appliedmath 04 00072 g015
Figure 16. The release of action potentials in the HH and HH + Ca models under strong electrical stimulations.
Appliedmath 04 00072 g016
Figure 17. The release of action potentials in the HH model and HH + Ca model under step current stimulations. (a) Under the 0–0.5 pA step stimulation, the action potential firing characteristics of HH model and HH+Ca model. (b) Under the 0.5–3 pA step stimulation, the action potential firing characteristics of HH model and HH+Ca model. (c) Under the 4–9 pA step stimulation, the action potential firing characteristics of HH model and HH+Ca model. (d) Under the 10–60 pA step stimulation, the action potential firing characteristics of HH model and HH+Ca model.
Appliedmath 04 00072 g017
Figure 18. Comparison of the release frequency of action potentials under a direct current stimulation and step current stimulation. (a) Under the 10–40 pA DC stimulation, the frequency of the action potential release in the HH model. (b) Under the 10–40 pA step stimulation, the frequency of the action potential release in the HH model.
Appliedmath 04 00072 g018
Figure 19. The release of action potentials under different square wave current intensities and current frequencies. (a,c,e,g,i,k) The action potential release of the HH model under square wave current stimulations of different frequencies and current intensities. (b,d,f,h,j,l) The action potential release of the HH + Ca model under square wave current stimulations of different frequencies and current intensities.
Appliedmath 04 00072 g019aAppliedmath 04 00072 g019b
Figure 20. The release of action potentials under different sine current intensities and current frequencies. (a,c,e,g,i,k) The action potential release of the HH model under sine wave current stimulations of different frequencies and current intensities. (b,d,f,h,j,l) The action potential release of the HH + Ca model under sine wave current stimulations of different frequencies and current intensities.
Appliedmath 04 00072 g020aAppliedmath 04 00072 g020b
Figure 21. The peak time interval of action potential under different frequency sine current stimulation of 20 pA. (a) Peak time interval of action potential at 10 Hz. (b) Peak time interval of action potential at 20 Hz. (c) Peak time interval of action potential at 30 Hz. (d) Peak time interval of action potential at 40 Hz. (e) Peak time interval of action potential at 50 Hz. (f) Peak time interval of action potential at 60 Hz.
Appliedmath 04 00072 g021
Table 1. Rate constant of gated variables.
Na + channel α m V = 0.6 V + 30 1 e V + 30 10 β m V = 20 e V + 55 18
α h V = 0.4 e V + 50 20 β h V = 6 1 + e V + 20 10
K + channel α n V = 0.02 V + 40 1 e V + 40 10 β n V = 0.4 e V + 50 80
Ca 2 + channel α a V = 0.006 V + 90 1 e V + 90 10 β a V = 0.1 e V + 30 10
α h A V = 0.04 e V + 70 20 β h A V = 0.6 1 + e V + 40 10
α c V = 0.3 V + 13 1 e V + 13 10 β c V = 10 e V + 38 18
Table 2. Simulation parameters.
C m = 1.0   μ F / cm 2 g N a = 40.0   μ S / cm 2
E N a = 35.0   mV g L = 0.005   μ S / cm 2
E K = 70.0   mV g K D R = 10.24   μ S / cm 2
E L = 60.0   mV g K C a = 0.05   μ S / cm 2
E C a = 132.46   mV g A = 36.0   μ S / cm 2
g K = 36.0   μ S / cm 2
(HH model)
g A = 36.0   μ S / cm 2
Disclaimer/Publisher’s Note: The statements, opinions and data contained in all publications are solely those of the individual author(s) and contributor(s) and not of MDPI and/or the editor(s). MDPI and/or the editor(s) disclaim responsibility for any injury to people or property resulting from any ideas, methods, instructions or products referred to in the content.

