Abstract
The main purpose of this paper is to implement a simulation model in @RISKTM and study the impact of incorporating random variables, such as the degree days in a traditional deterministic model, for calculating the optimum thickness of thermal insulation in walls. Currently, green buildings have become important because of the increasing worldwide interest in the reduction of environmental pollution. One method of saving energy is to use thermal insulation. The optimum thickness of these insulators has traditionally been calculated using deterministic models. With the information generated from real data using the degree days required in a certain zone in Palestine during winter, random samples of the degree days required annually in this town were generated for periods of 10, 20, 50, and 70 years. The results showed that the probability of exceeding the net present value of the cost calculated using deterministic analysis ranges from 0% to 100%, without regard to the inflation rate. The results also show that, for design lifetimes greater than 40 years, the risk of overspending is lower if the building lasts longer than the period for which it was designed. Moreover, this risk is transferred to whomever will pay the operating costs of heating the building. The contribution of this research is twofold: (a) a stochastic approach is incorporated into the traditional models that determine the optimum thickness of thermal insulation used in buildings, by introducing the variability of the degree days required in a given region; (b) a measure of the economic risk incurred by building heating is established as a function of the years of use for which the building is designed and the number of years it is actually used.
Keywords:
thermal insulation; Monte Carlo simulation; life cycle cost; green building; optimal thickness; engineering economics MSC:
90-10
1. Introduction
To ensure a green building approach, energy conservation in buildings is a crucial factor in most countries. The use of insulating material in construction can help reduce energy use and therefore, in some cases, reduce polluting material generated through heating and cooling devices. In many countries, building energy consumption accounts for ~40% of global energy demands. The energy requirement for the space heating and cooling of a building is ~60% of the total energy consumed in buildings, which accounts for the largest percentage of energy usage [1,2,3,4].
Another study by the Ministry of Industry and Electricity, Kingdom of Saudi Arabia [5], mentions that the energy requirement for the cooling and heating of buildings is responsible for ~50% of the total electric energy consumption in the Kingdom of Saudi Arabia. Karakaya et al. [6] analyzed the heating and cooling performance of different insulating materials and fuel types in various geographic regions of Turkey. These analyses were performed using different values of insulation thickness, annual gains, payback periods, and emissions analyses. They proposed new empirical models, in which the equations developed confirm the ability to accurately predict optimal insulation and thickness values. They also mention that, in recent years, there has been a very rapid urbanization phenomenon around the world in which most of the buildings that are built do not follow the International Energy Efficiency Standards, so it is important that the institutions that are authorized to grant construction permits are aware and sensitive in this regard. On the other hand, Akpinar and Demir [7] developed a study in which they calculated the optimal insulation thickness of external walls, the energy savings over a 10-year lifetime, and payback periods for two different types of walls, with carbon as an energy source and two different insulation materials in cities from four different climate zones in Turkey. The results indicated a payback period of 0.3 to 6.5 years, which depended on the cities, the type of wall, the insulating material, and the cost of coal fuel. The energy savings were greater, the insulation was more effective, and the payback period was shorter for higher-ranking cities. Balo and Ulutas [8] investigated the optimal value of insulation thickness for buildings in a city in Turkey, proposing a comprehensive approach through the combination of technical and economic factors in the sustainable design of buildings. The results of the simulations of their mathematical models indicate that the use of different energy alternatives has a significant impact on air quality in residential areas, indicating that the lowest value of energy consumption is achieved by using natural gas, a porous lightweight brick building material, and glass wool insulation. Similar results will only be possible if policymakers and practitioners work together to design and implement energy efficiency plans in buildings.
Anastaselos et al. [9] reported high volumes of energy consumption for housing and service purposes throughout the EU. In many countries, heating and cooling spaces makes up the highest relative percentage of energy consumption in households [10,11]. Ozbek et al. [12] mention that buildings account for one-third of the world’s energy consumption and that reducing fuel consumption and emission values is only possible by making them more energy efficient through methods such as the use of adequate thermal insulation. They determined the optimal insulation thicknesses for cities in the various climatic regions of Turkey. Insulation thickness, thermal conductivity, heating degree days, and fuel type were determined as variable parameters, where the optimal insulation thickness and the total heating cost of the cities were determined using the response surface method, for which they developed mathematical models that estimate the total cost of natural gas coal and fuel oil, depending on the thickness of the thermal insulation, the thermal conductivity, and the degrees of heating days.
Daouas et al. [13] reported that in Tunisia, a significant increase in summer comfort requirements translated into a great boom in air conditioning device use, with an average annual increase of ~28% between 1999 and 2004. This increase led to a remarkably high electric energy consumption, which reached a new peak in summer. Recently, because of environmental changes, attention has been paid to summer comfort by accounting for cooling loads and reducing heat transfer to the buildings using an optimum insulation thickness. Küçüktopcu [14] conducted a study to determine the effect of insulation thickness on the energy efficiency and cost savings of the outer walls of cold storage facilities in climatic zones of Turkey, specifying that refrigeration facilities consume a considerable amount of energy, especially in hot climates, which can be reduced by using thermal insulators to maintain a stable temperature, also suggesting that the application of geographic information systems is important because of significant topographical differences, which were particularly useful in assessing investment opportunities. It was found in the different evaluations of models and economic parameters that the values of the coldest days of the year, along with energy and insulation prices, could produce different results.
The International Energy Agency [15] and other organizations provide accurate and up-to-date data on global energy consumption across various sectors (see Figure 1). It is evident from these references that the highest energy consumption comes from residential, commercial, and public service sources.
Figure 1.
Electricity consumption by sector in Terajoules (TJ) from 1990 to 2020. Source: International Energy Agency (IEA).
In the literature, there are many studies on the optimal insulation in walls; for example, Shaik and Talanki [16] analyzed the influence of insulation location within a flat roof directly exposed to solar radiation to reduce the heat gain in buildings. In their proposal, they considered the unstable thermal response of the building roof, such as admittance, transmittance, decay factor, and time delays, through a one-dimensional diffusion equation under convective periodic boundary conditions. The theoretical compared with the experimental results of four types of walls are available in the literature [16].
Similar studies have been conducted to minimize the thickness of the insulators to reduce their weight; for example, D’Agostino et al. [17] evaluated the energetic and economic influences of external thermal insulation using energy simulations under dynamic conditions (DesignBuilder software) for a case study. The analysis was conducted for various cities (Palermo, Milan, and Cairo) and for multiple volumes (10, 20, and 30 W/m2) of internal thermal loads. The optimal insulation thicknesses were derived, and the results demonstrate the need to avoid excessive insulation of buildings to obtain the highest possible energy saving.
An interesting study was performed by Stazi et al. [18], whose objective was to verify the dynamic behavior of three envelopes characterized by various traditional wall constructions adopted in temperate climates. In each case, the solution to the problem was identified in terms of comfort and energy savings. The proposal was tested for three buildings characteristic of the existing building heritage. The results showed that the behavior of the three envelopes differs greatly because they interact in unique ways according to climatic changes.
The research developed by Bojić et al. [19] uses a small residential house in Serbia where an optimization in the thickness of its thermal insulation layer is investigated using EnergyPlus software and the Hooke–Jeeves direct search method. The embodied energy of thermal insulation is considered. Optimization occurs throughout the life cycle of thermal insulation. The results show that the optimal thickness of thermal insulation produces the minimum consumption of primary energy.
In a proposal by Annibaldi et al. [20], a multidisciplinary approach is used to compare the optimal insulation thickness determined from the transmittance values of historical walls measured in situ with those reported in the literature. Their proposal includes a preliminary analysis of the historical envelope necessary to conduct in situ measurements of thermal transmittance and an analysis of the insulating material and its thickness to determine the optimal combination between the energy performance of the building and the related investment. These analyses would ensure optimal thermal insulation and improved environmental impact through life cycle cost analysis.
Idchabania et al. [21] highlighted the cost-effectiveness achieved through the use of thermal insulation in building walls in cold regions. Their study was based on life cycle cost analysis, in which they found that the optimal insulation thickness varies significantly depending on the insulation material selected. Benallel et al. [22] presented research using six Moroccan climatic regions, applying the concept of degree days and a life-cycle cost analysis to compare the economic and environmental evaluation of various thermal insulation materials integrated in the middle of a typical double wall. The results obtained show that the optimal insulation thicknesses increase with the increase in the total number of degree-days of heating and cooling; this translates into increased cost savings and a shorter payback period.
Recently, Acikkalp and Kandemir [23] developed a methodology, which they named the Combined Economic and Environment Method (CEEM), to determine the optimal thickness for two types of insulation materials. They performed a comparison using three methods (economic, economic and environmental, and environmental), concluding that the CEEM method is approximately twice as effective as the economic approach.
Li and Denesley [24] developed a study for decision making in regards to building refurbishment policies related to insulation in England. They suggested that it is necessary to consider a holistic whole-life approach, in which the characteristics and impacts of national funds, building parks, climatic conditions, and carbon performance of the electricity grid must be taken into account to determine tailor-made optimized wall insulation thicknesses in order to maximize both carbon emissions and reduce energy consumption.
We conducted a bibliographic search and did not find any references in which the effect of uncertainty is reflected in the calculations of the costs incurred under the selection of an optimal thickness calculated from the deterministic method. For this reason, in this study, we calculated the risk of exceeding the optimal cost calculated using the traditional method.
2. Materials and Methods
Construction materials vary between countries and regions. In this study, we take as a basis for comparison the case of Palestine, where concrete, bricks, stones, and steel bars for reinforcement are used in new building walls.
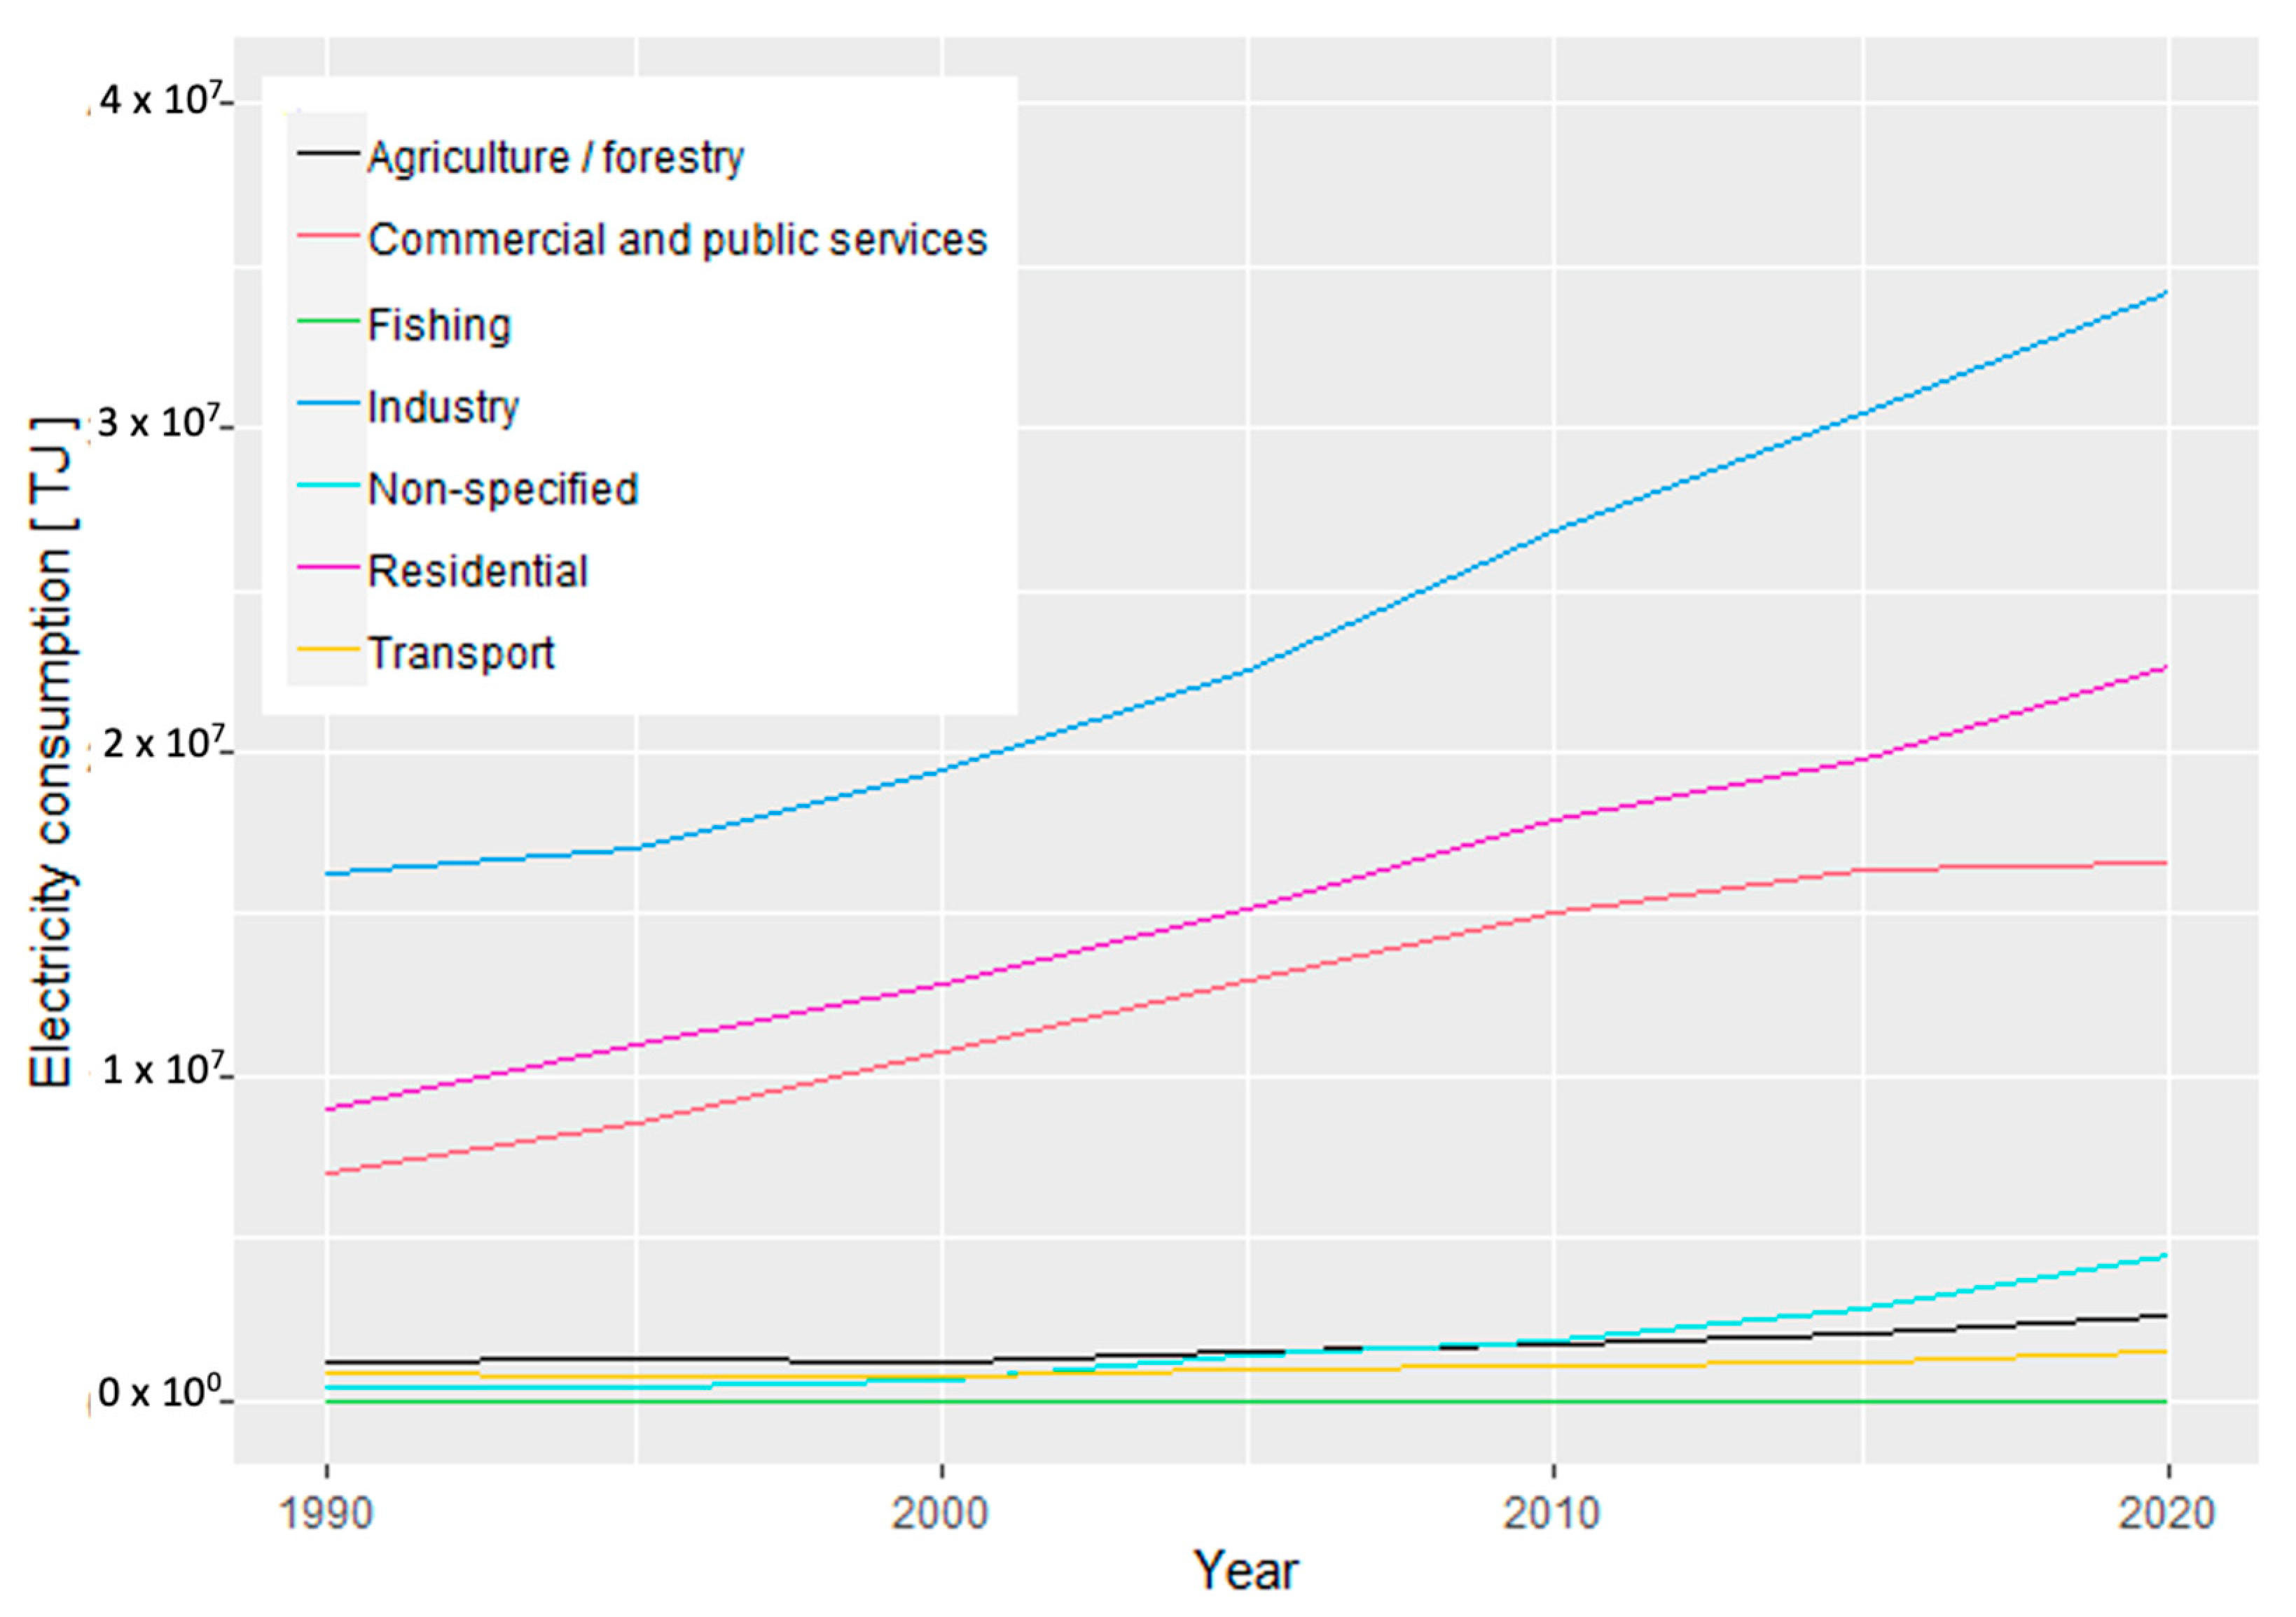
2.1. Energy Prices and Building Materials
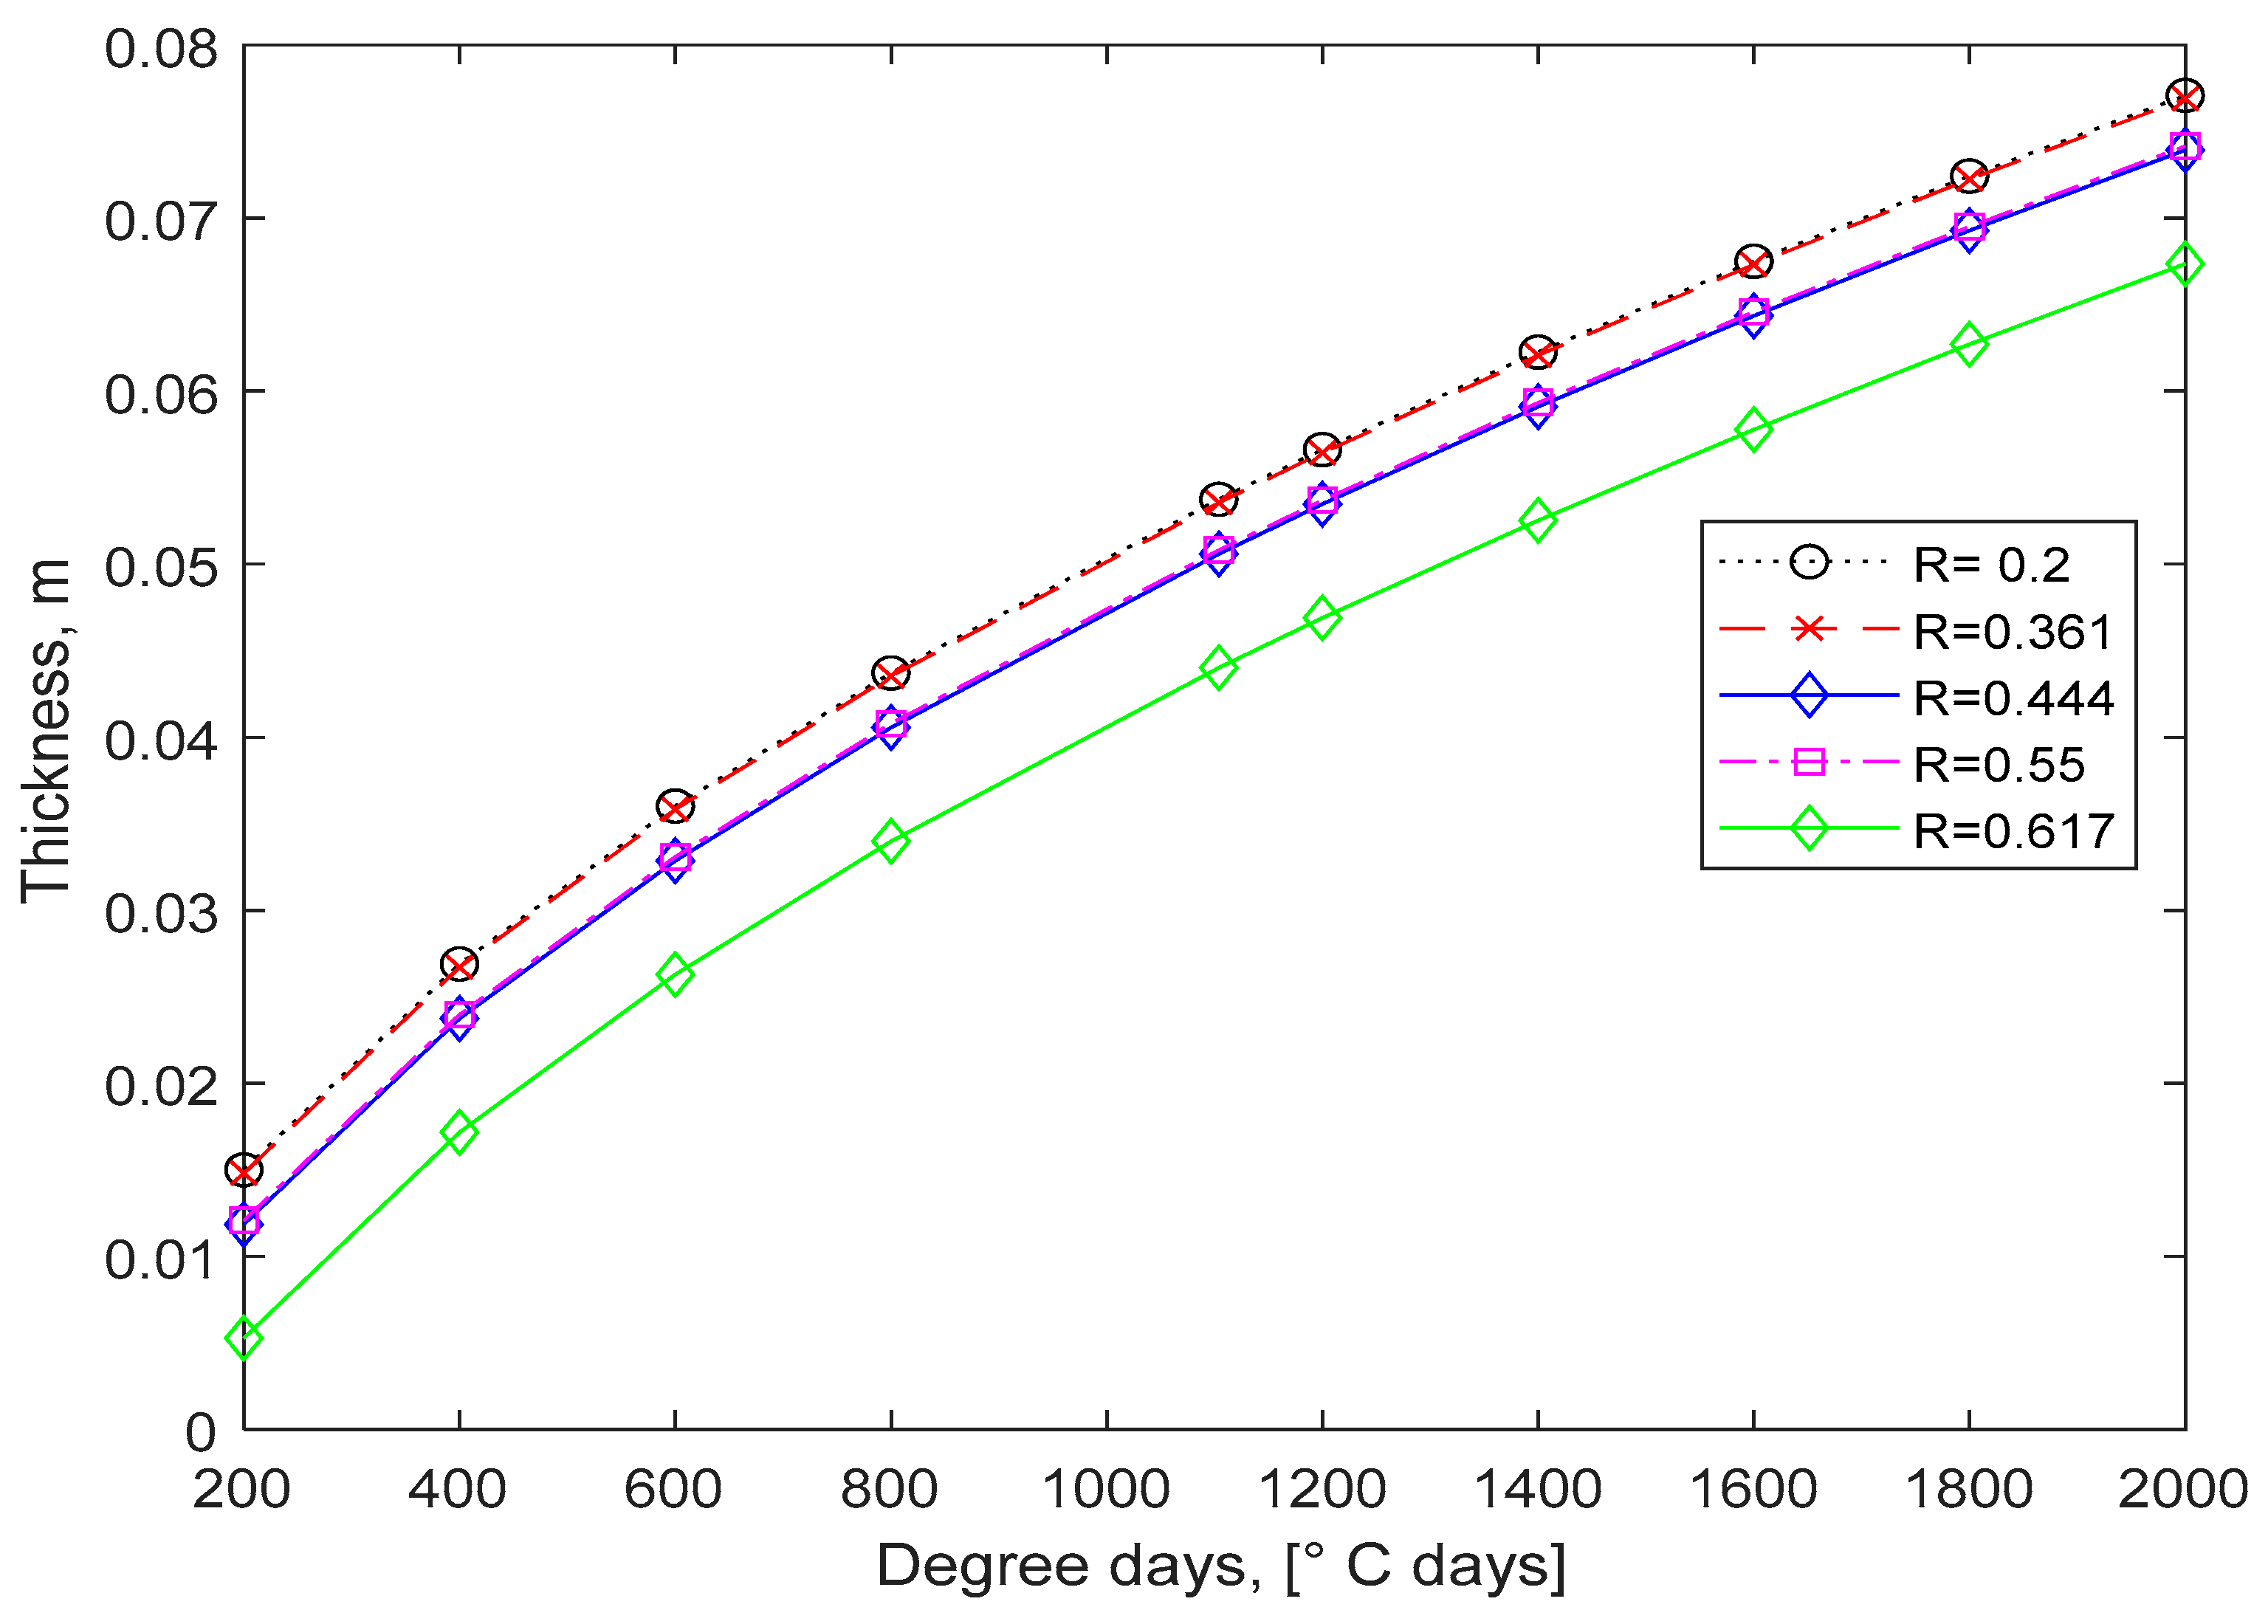
In this study, we employed some secondary data, especially those previously provided by Hasan [2] regarding energy prices and wall characteristics. Some of these are USD 0.38/L, USD 0.38/L, USD 0.57/kg, and USD 0.15/kWh for diesel, kerosene, LPG, and electricity, respectively. The construction materials employed, along with some of their thermal characteristics, are shown in Figure 2.
Figure 2.
Various wall types and their thermal physical characteristics.
2.2. Heating Load
The energy for space heating, requirements are directly proportional to the degree days, required for heating and the wall conductance and inversely proportional to the efficiency of the equipment used. To calculate , the following expression is given in ASHRAE Handbook of Applications [25].
Conductance U, for a typical wall, including the insulating layer in terms of the total resistance of the wall, is given by (see the previous nomenclature)
The wall resistance, including the indoor and outdoor air films, is given by
From Equations (1) and (2), it is not difficult to prove that the load heating, , in terms of the degree days, and the total resistance of the wall, , as also provided by Hasan [2], and Bolatturk [4], is
where k and X are the thermal conductivity and thickness of the insulating material, respectively.
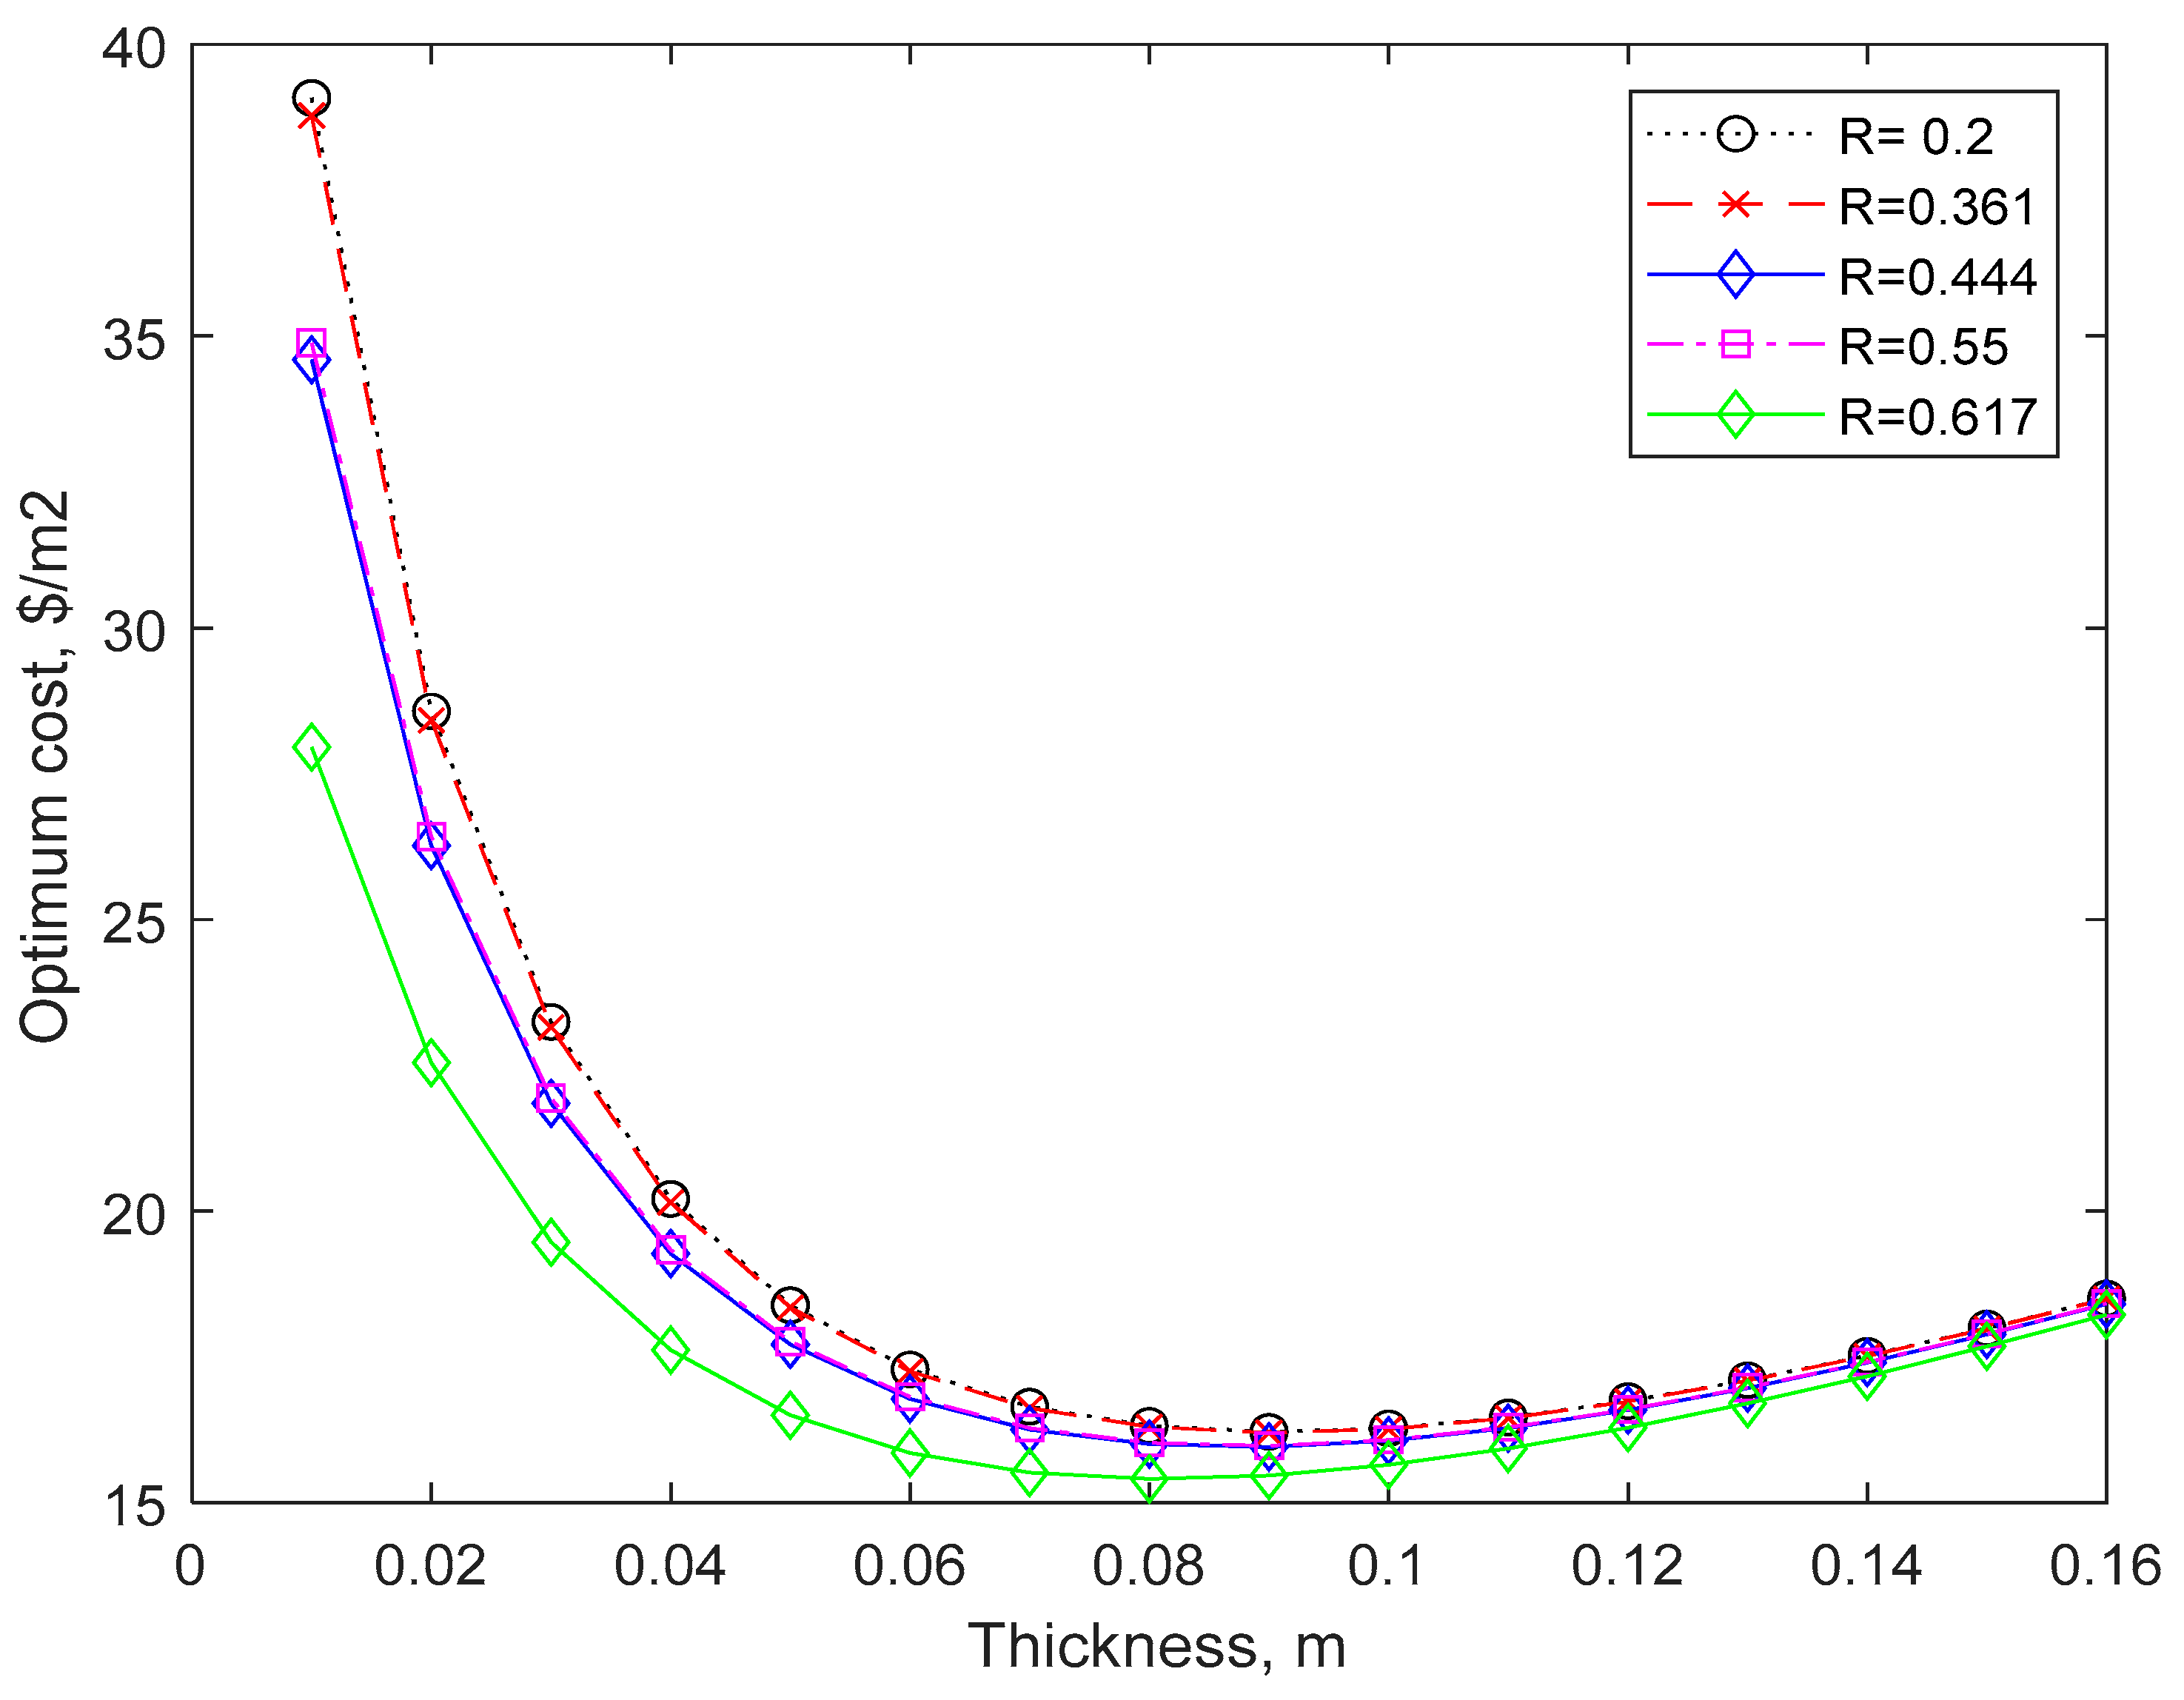
2.3. Optimization of Insulation Thickness
The global cost per unit area, Ch, in terms of the cost of fuel, Cf, and its value of global warming, is then given by
In engineering economics, life cycle cost is the traditional method of evaluating the alternatives of decision whose only differences include the incurred annual costs.
The annual cost of each alternative decision is the present value (PNV) through the factor of the present value (PWF), which, in the field of construction, depends on the rate of inflation, g, the interest rate, I, and the number of years, N, over the project’s life cycle, according to Park [26] and Hasan [2].
The insulation cost is represented by
Thus, the value of the total cost during the cycle of life in USD per unit area is given by
Substituting the value of from Equation (5) into Equation (7),
This function is convex and differentiable for X, which is the thickness of the insulation; therefore, it is possible to find the value of , which is minimized, and is given by
The previous expression is also obtained by Bolatturk [4], who is studying optimal insulation in Turkey. In his study, he uses the P1 − P2 method to derive the expression.
2.4. Deterministic Analyses
The traditional analyses use the expressions below, implicitly considering that the costs of fuel have experienced inflation over the life of the project period, with all other factors remaining constant.
Given that our main interest is to compare the results generated by deterministic and stochastic approaches, we first calculated the optimal thicknesses suggested by Equation (9) for a particular case. The input data used are shown in Table 1.
Table 1.
Parameters used in calculating the optimum thickness.
The results for the optimal thickness, in meters, of the insulating material, considering various resistances of the wall and degree days required, are shown in Figure 3. The optimal costs for four types of walls, including all constant parameters in Table 1 which are between 15 and 17 USD/m2, can be seen in Figure 4.
Figure 3.
Optimum thickness for different walls (life cycle of 50 years).
Figure 4.
Total cost versus thickness for different walls (life cycle of 50 years).
Figure 5 shows the optimal thickness results for various walls across the life cycle period, i.e., 10 years. These figures show a considerable impact on the optimal thickness, as there is a significant difference between them. This difference has implications in terms of establishing a well-defined project life cycle.
Figure 5.
The optimal thickness for different walls (life cycle of 10 years).
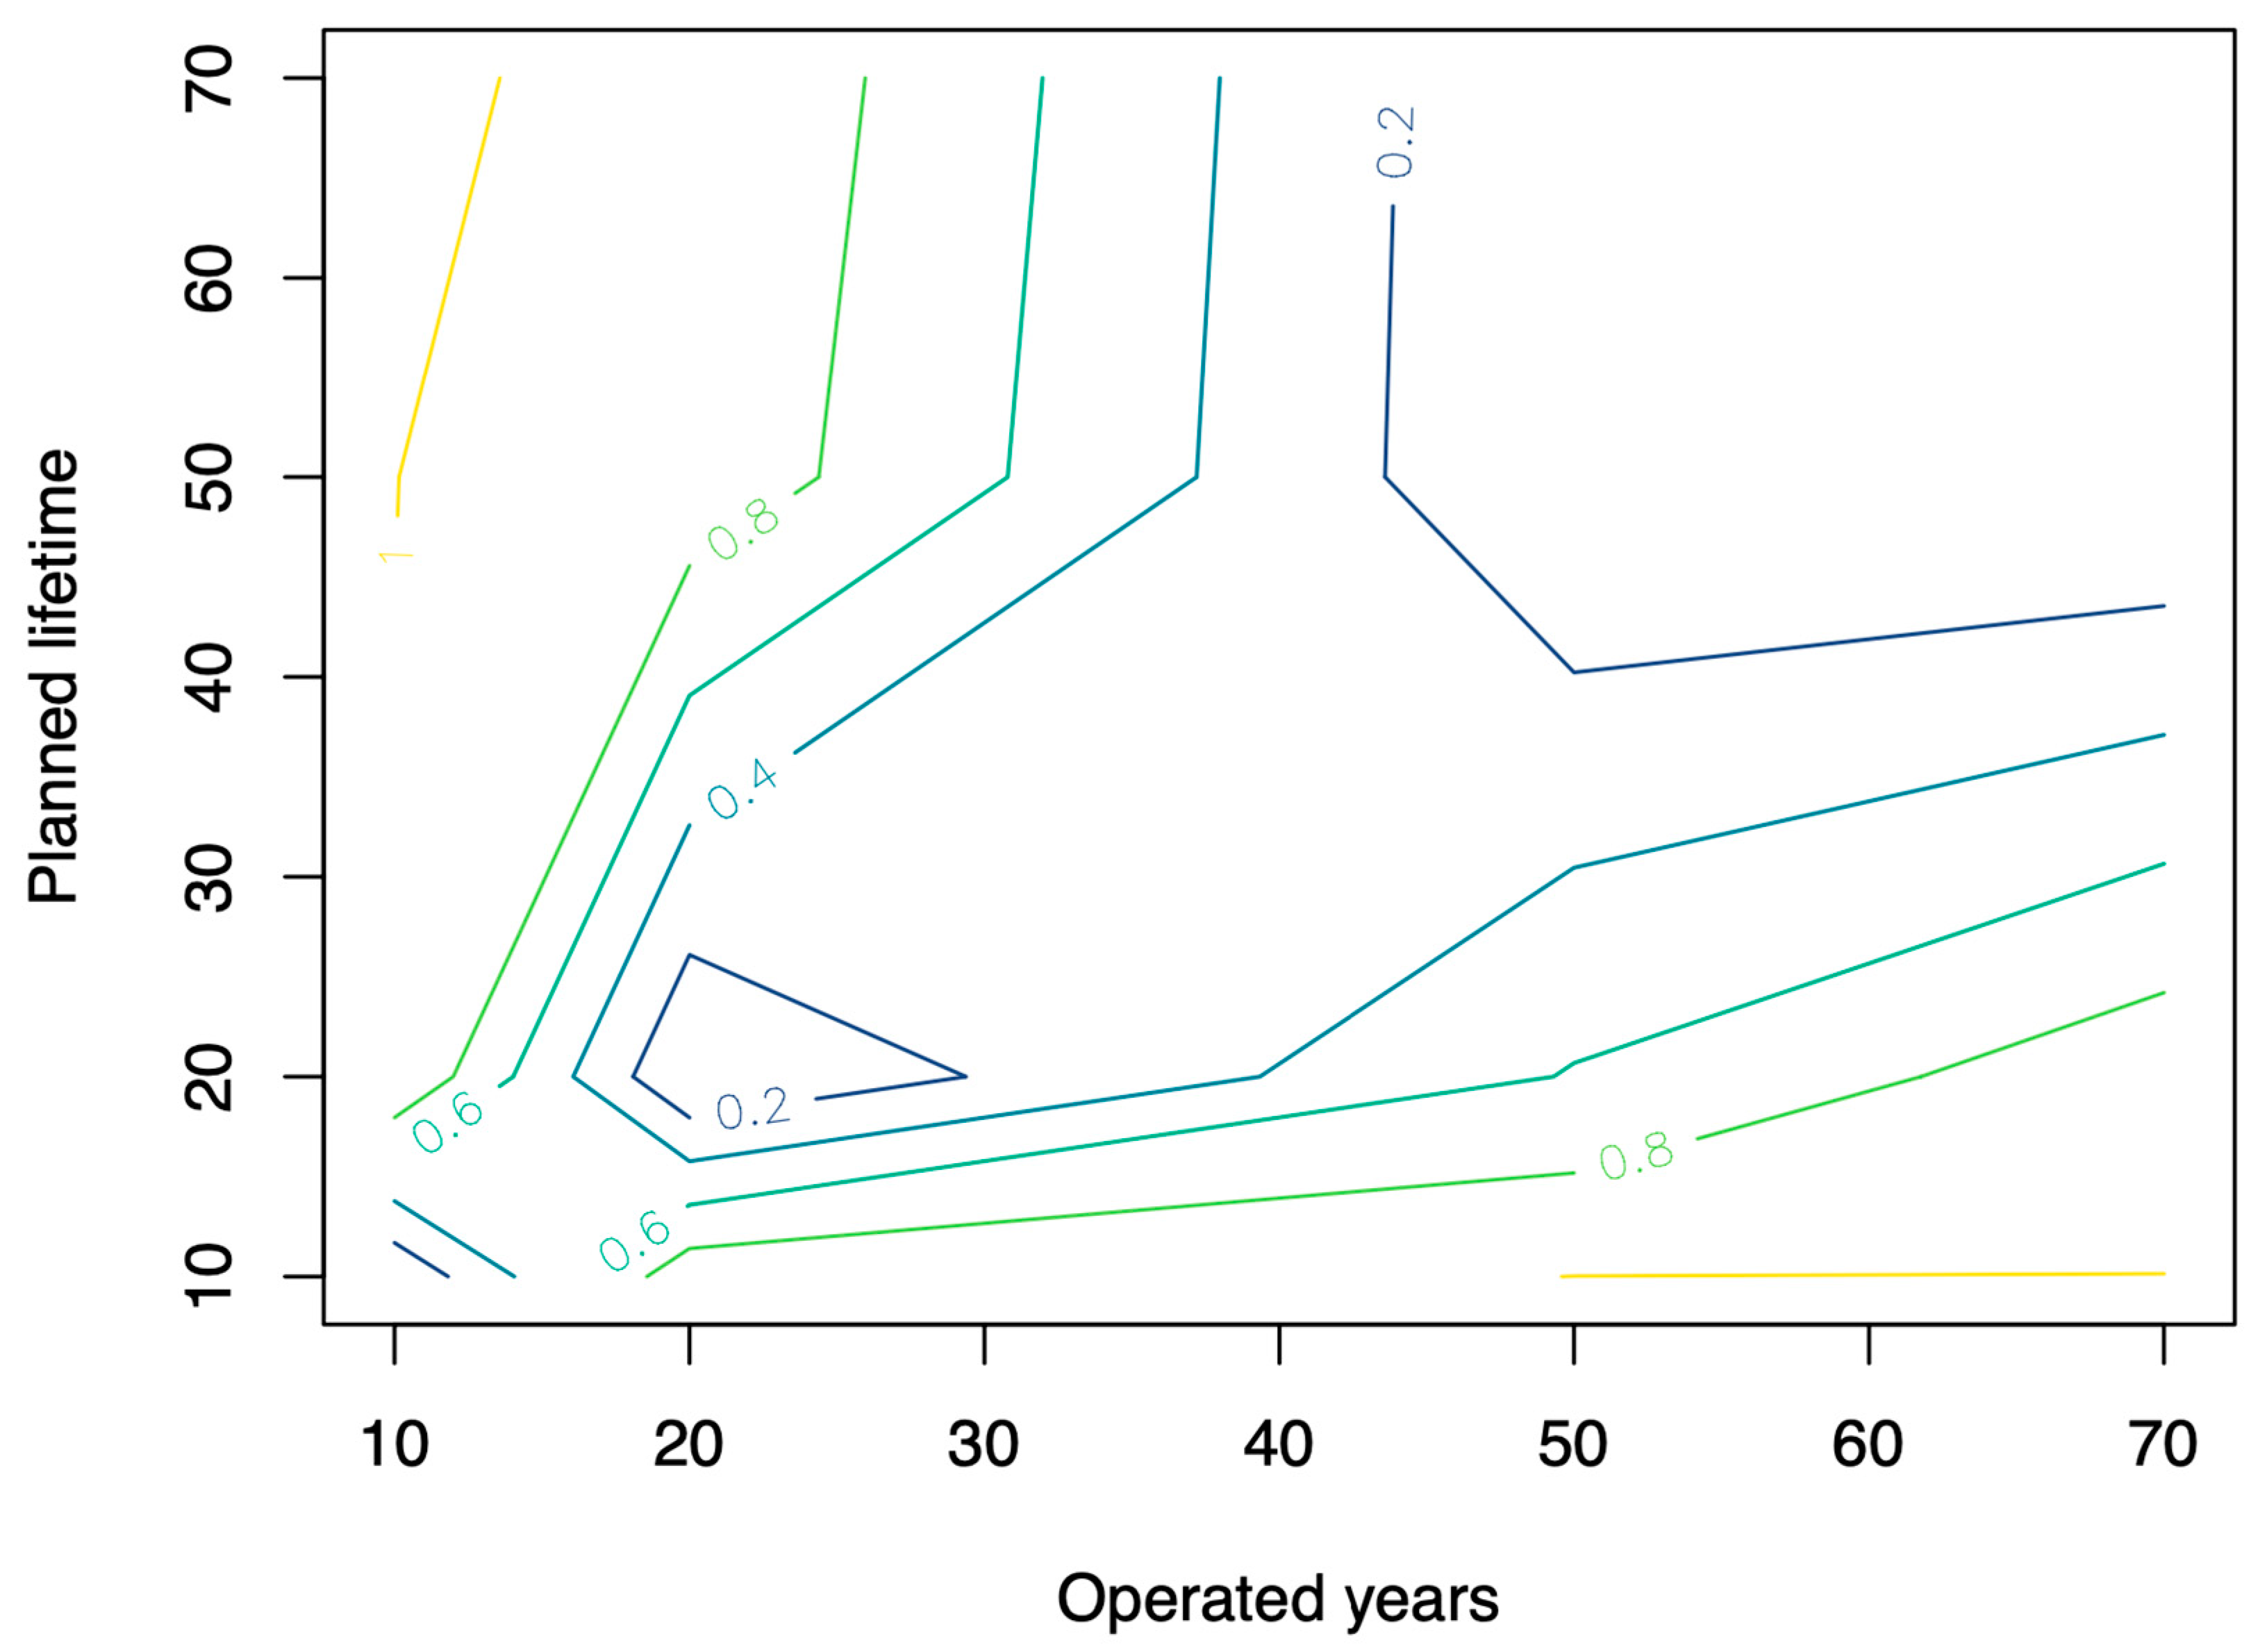
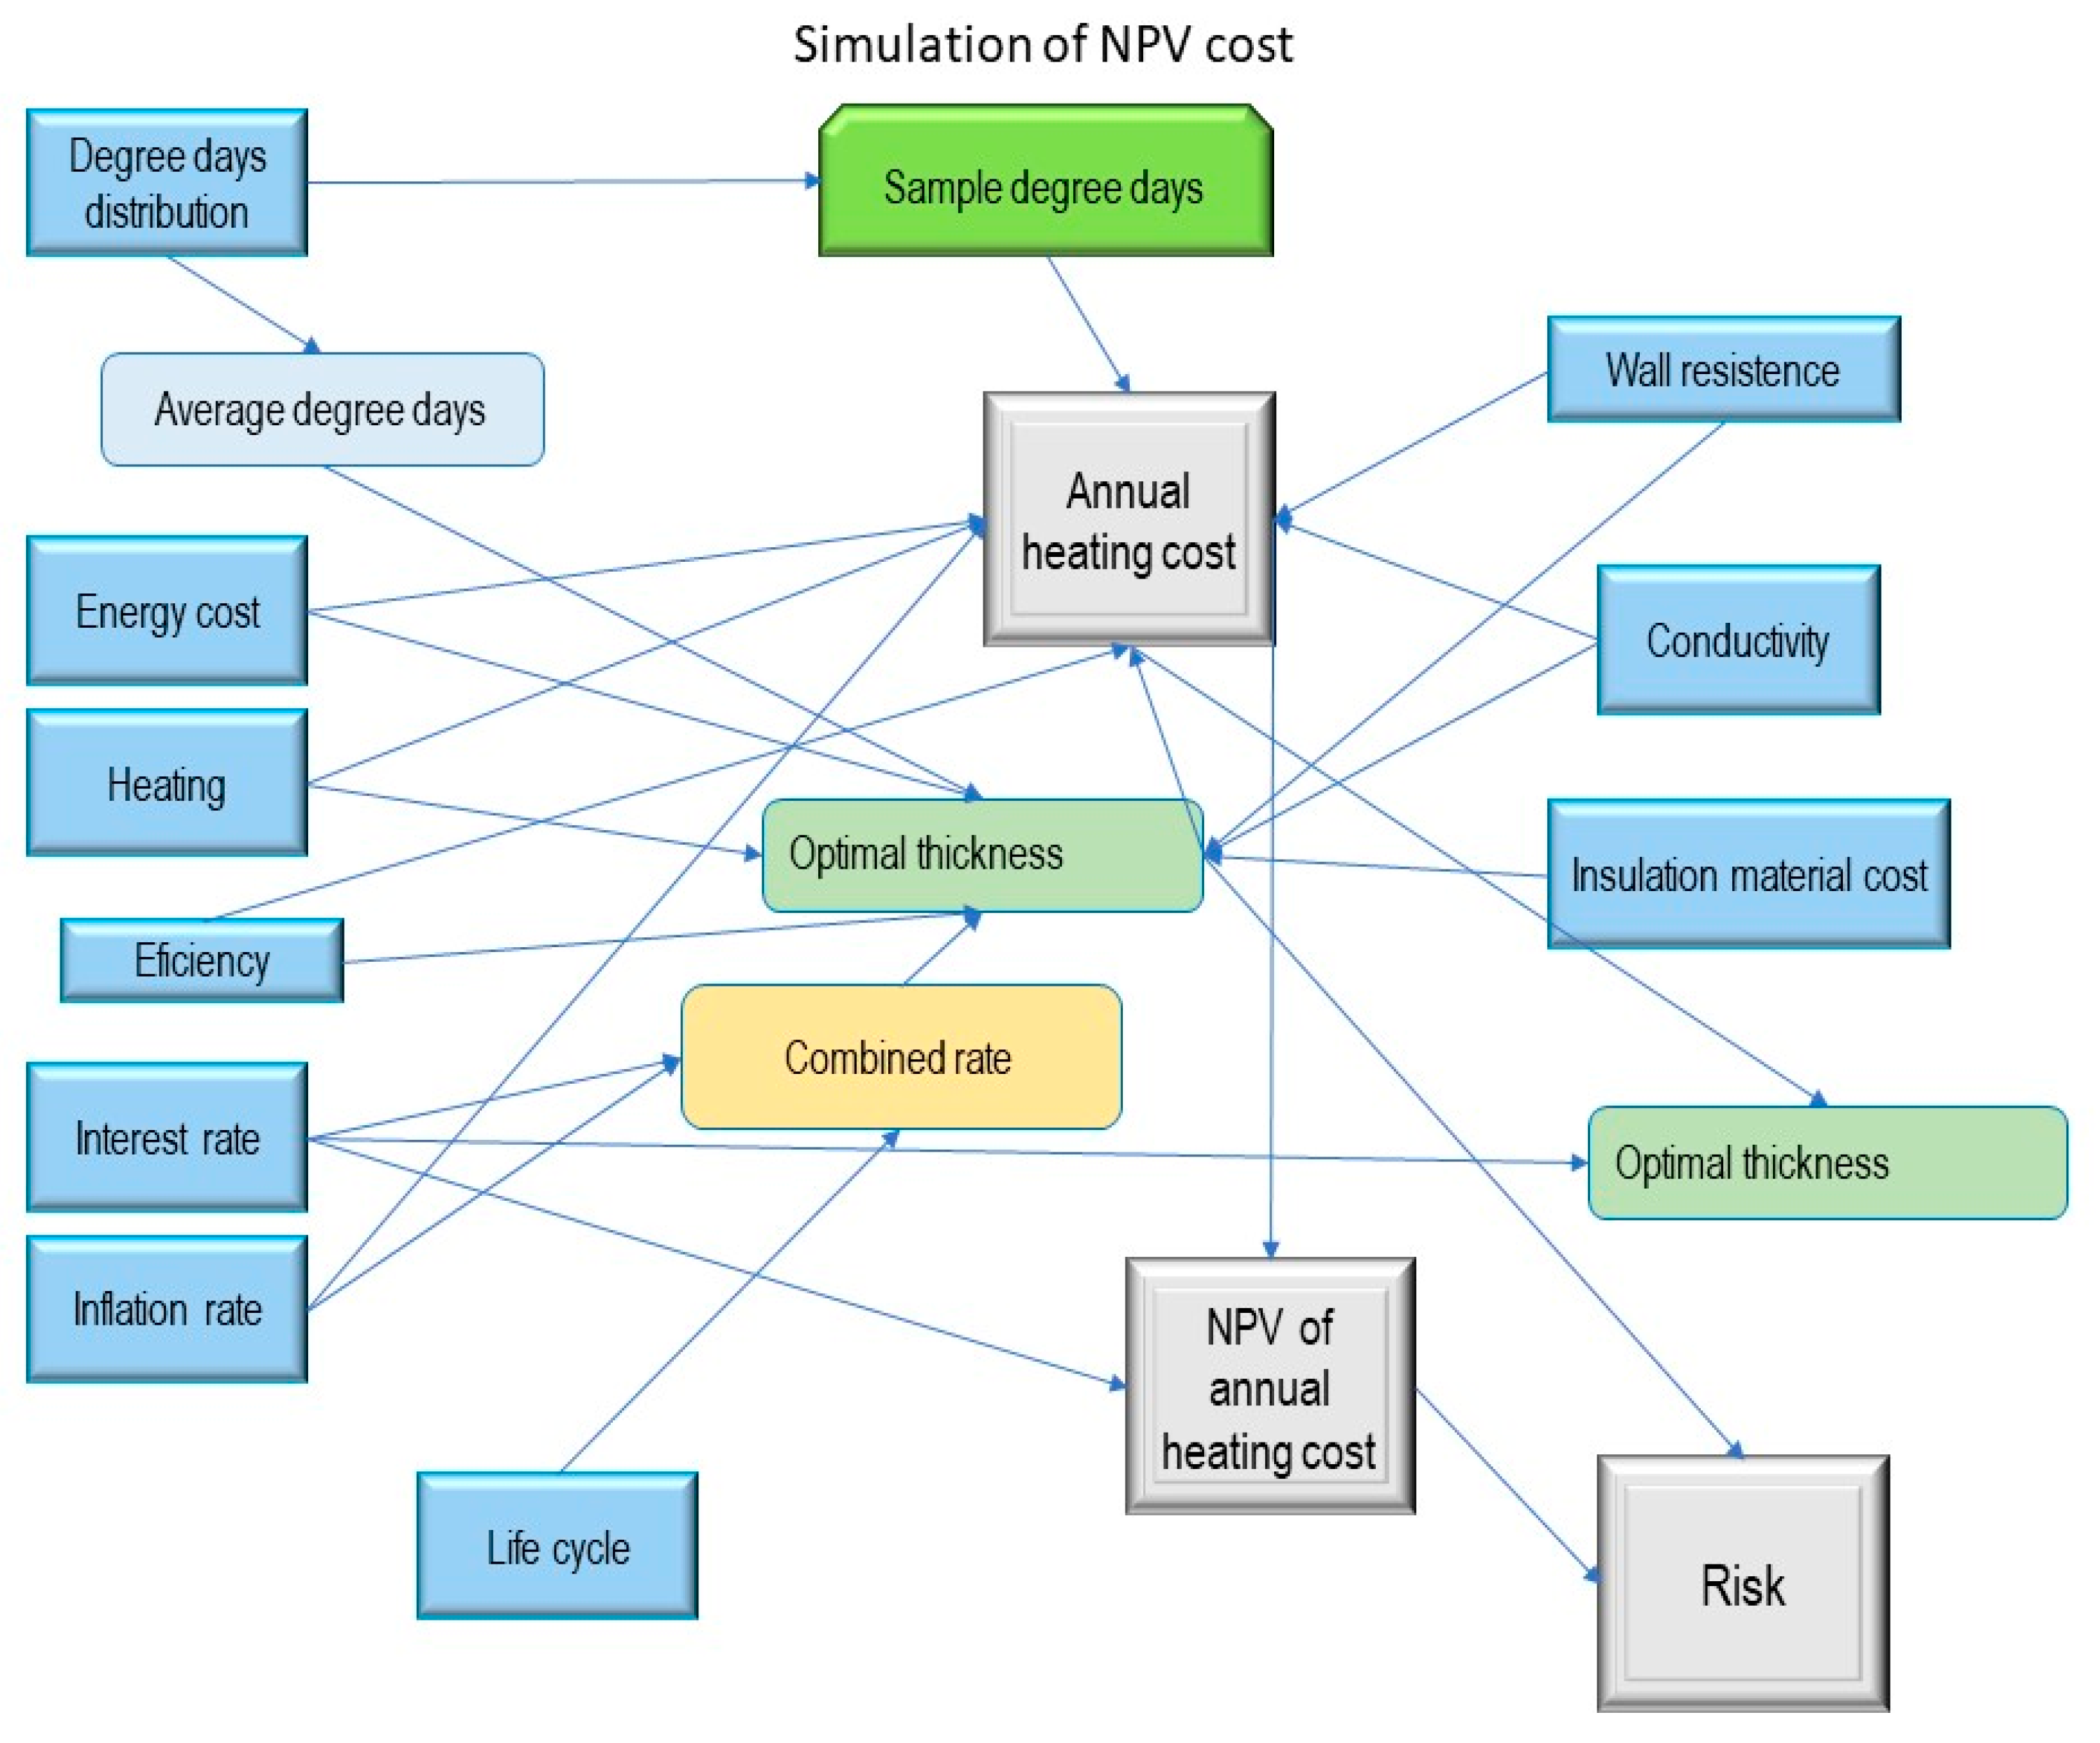
2.5. Stochastic Analysis
Some issues regarding the deterministic analysis are as follows: the degree days may vary from year to year, and these days may also increase because of global warming; moreover, the efficiency of the equipment may be dependent on the use. As a result of this study, a more realistic analysis for calculating the present value cost given by Equation (7) is that the degree days required annually are modeled using a random behavior. The advantages of stochastic analysis in economic studies have been demonstrated in works such as those of Coates and Kuhl [27].
To achieve this analysis, information was obtained from the degree days required in Palestine, available on the website http://www.degreedays.net/#generate (accessed on 1 August 2023) [28]. The data contained 80 records of the degree days required in a specific winter; goodness of fit tests using @RISKTM software, www.palisade.com (accessed on 1 August 2023) [29], were performed, resulting in the best fit beta distribution, with parameters that can be seen in Figure 6.
Figure 6.
Degree days distribution adjusted by @RISKTM.
Given that Equation (7) requires annual degree days, a random sample was generated for an assumed period of two hundred days during the cold season. As expected using the central limit theorem, the sum of these random variables with beta distribution turned out to be a normal distribution, with the mean and standard deviation of 1104 (this value was used in deterministic analysis) and 59.47, respectively.
Therefore, the analysis algorithm used in this study can be summarized in the following steps:
- Step 0: Select the life cycle of the building in years (10, 20, 50, or 70).
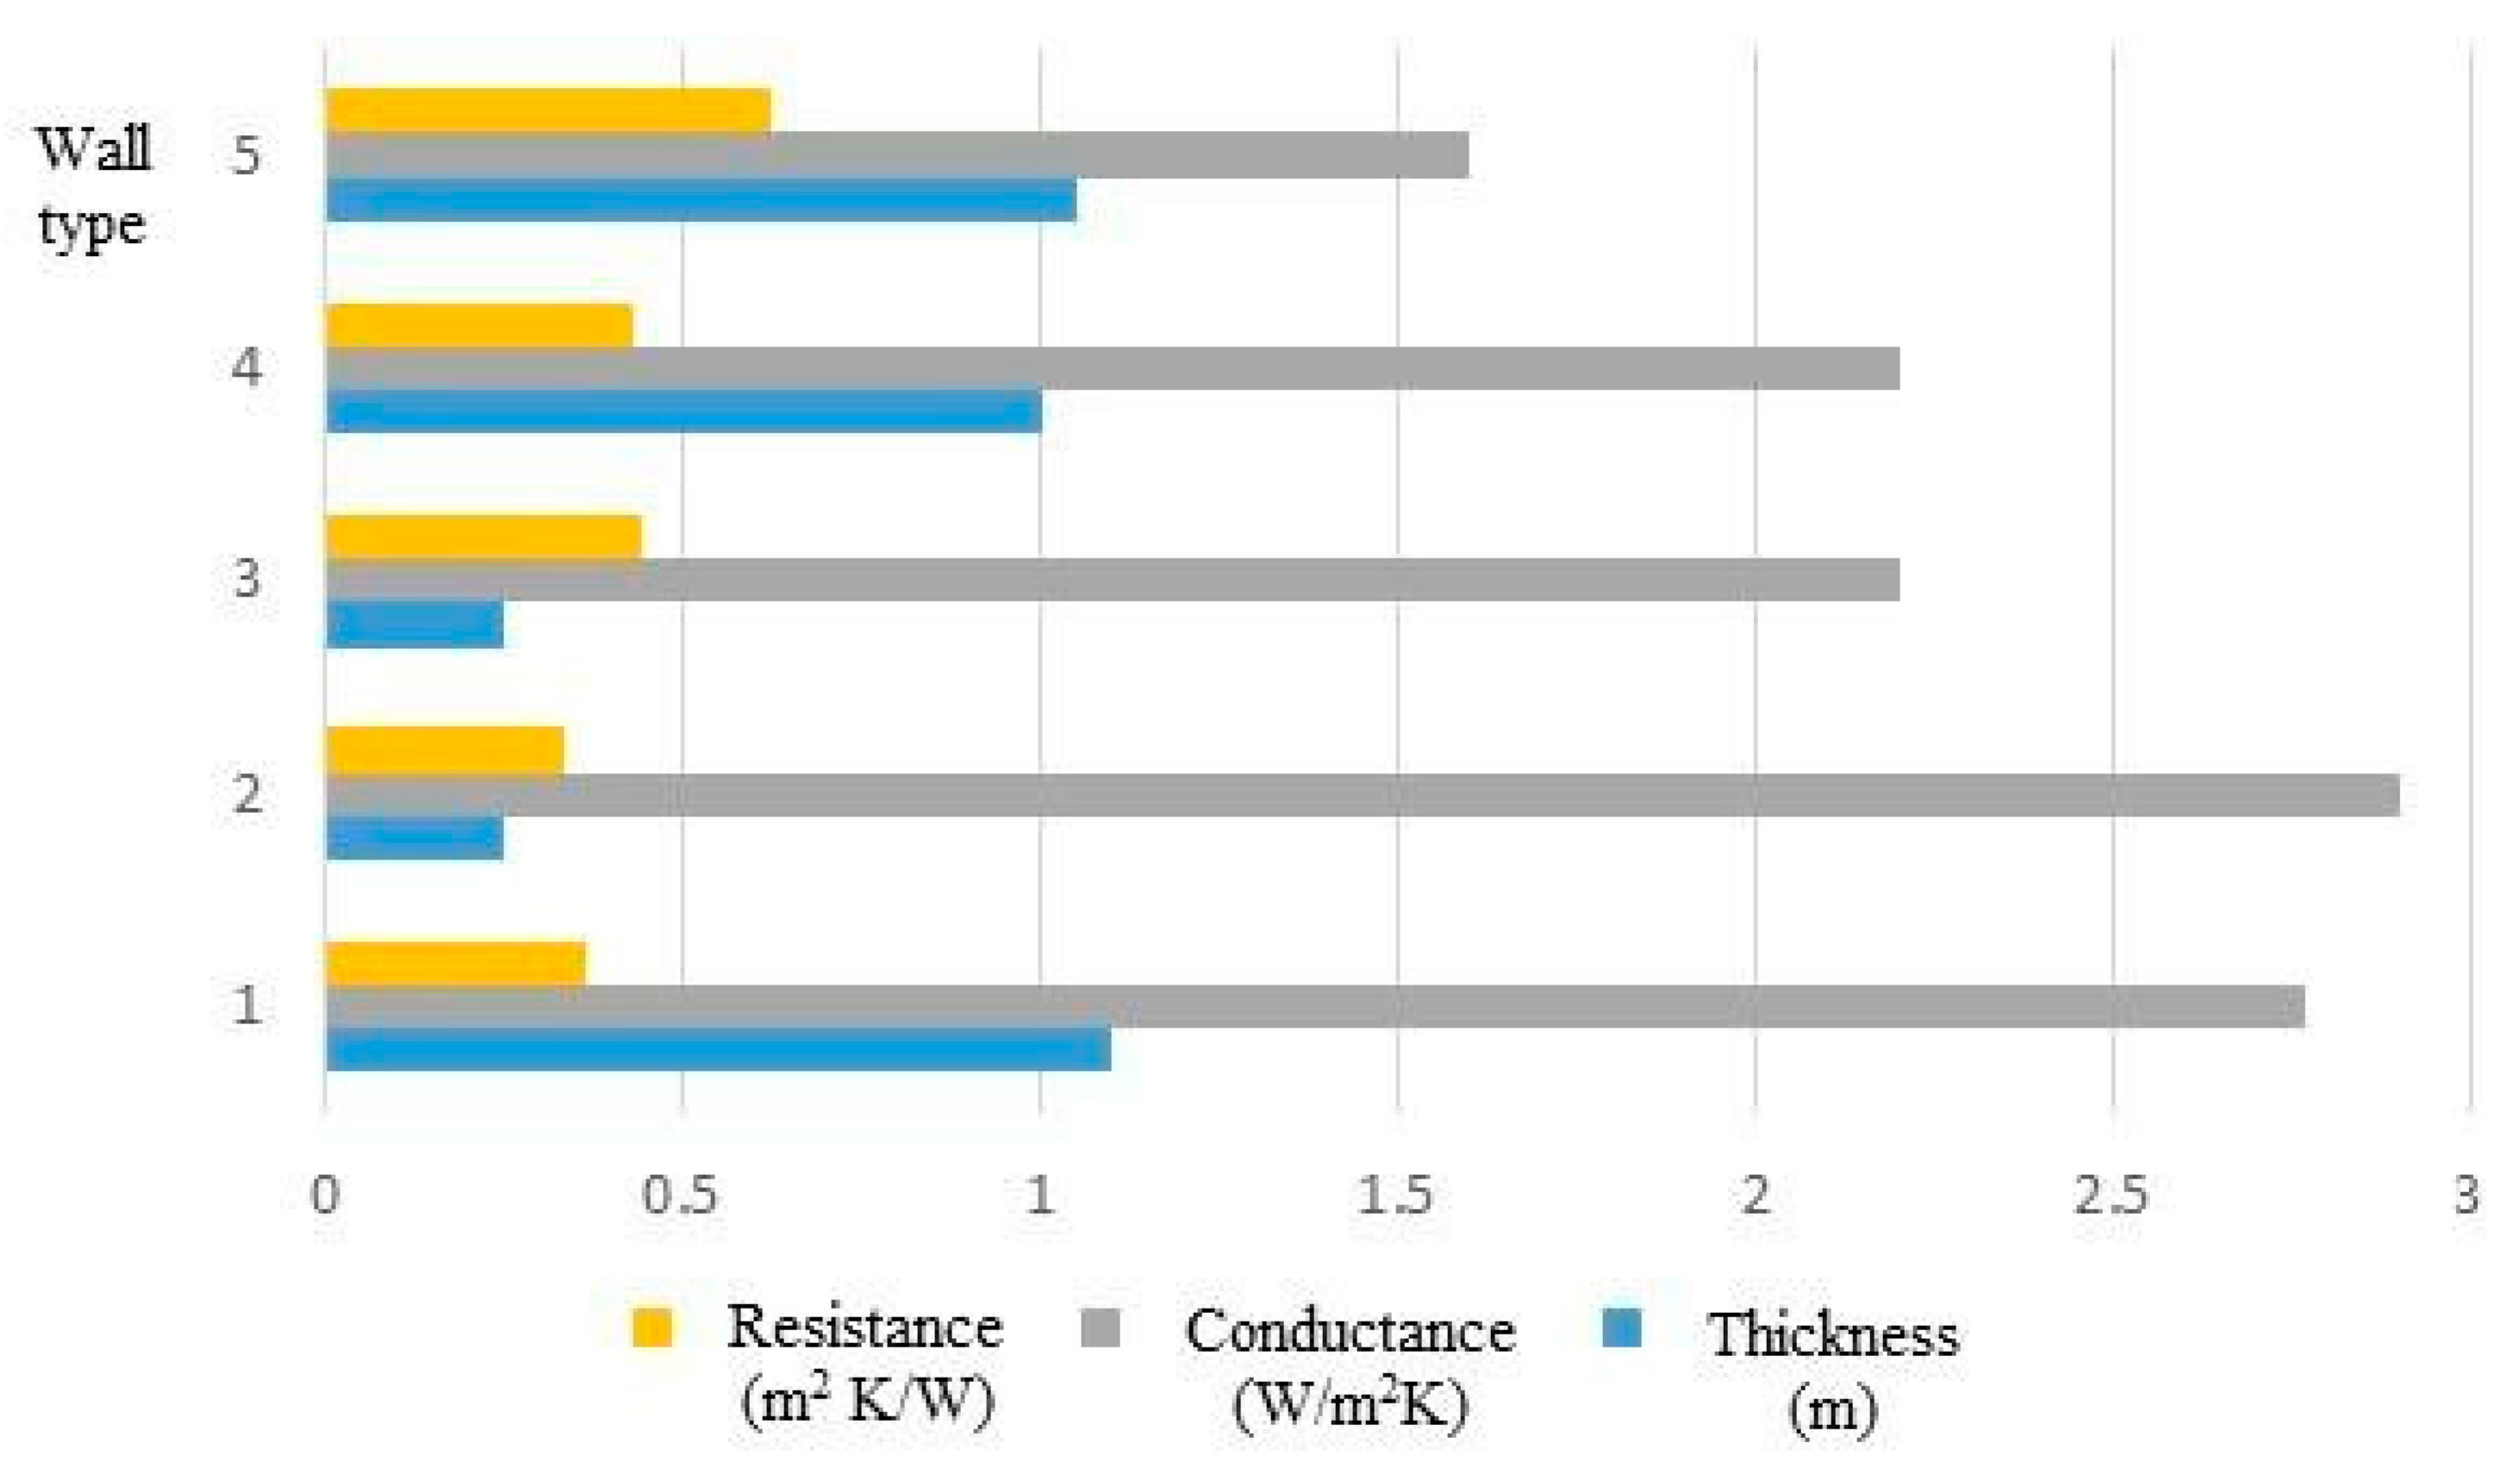
- Step 1: Choose typical wall and insulation materials, along with their respective thermal characteristics.
- Step 2: Select economic data, inlcuding rates of interest and inflation, number, the current price of the used fuel, and the average of the degree days given by the normal distribution. (This generates optimal thickness insulation, and optimal cost, , given by Equations (8) and (7), respectively.)
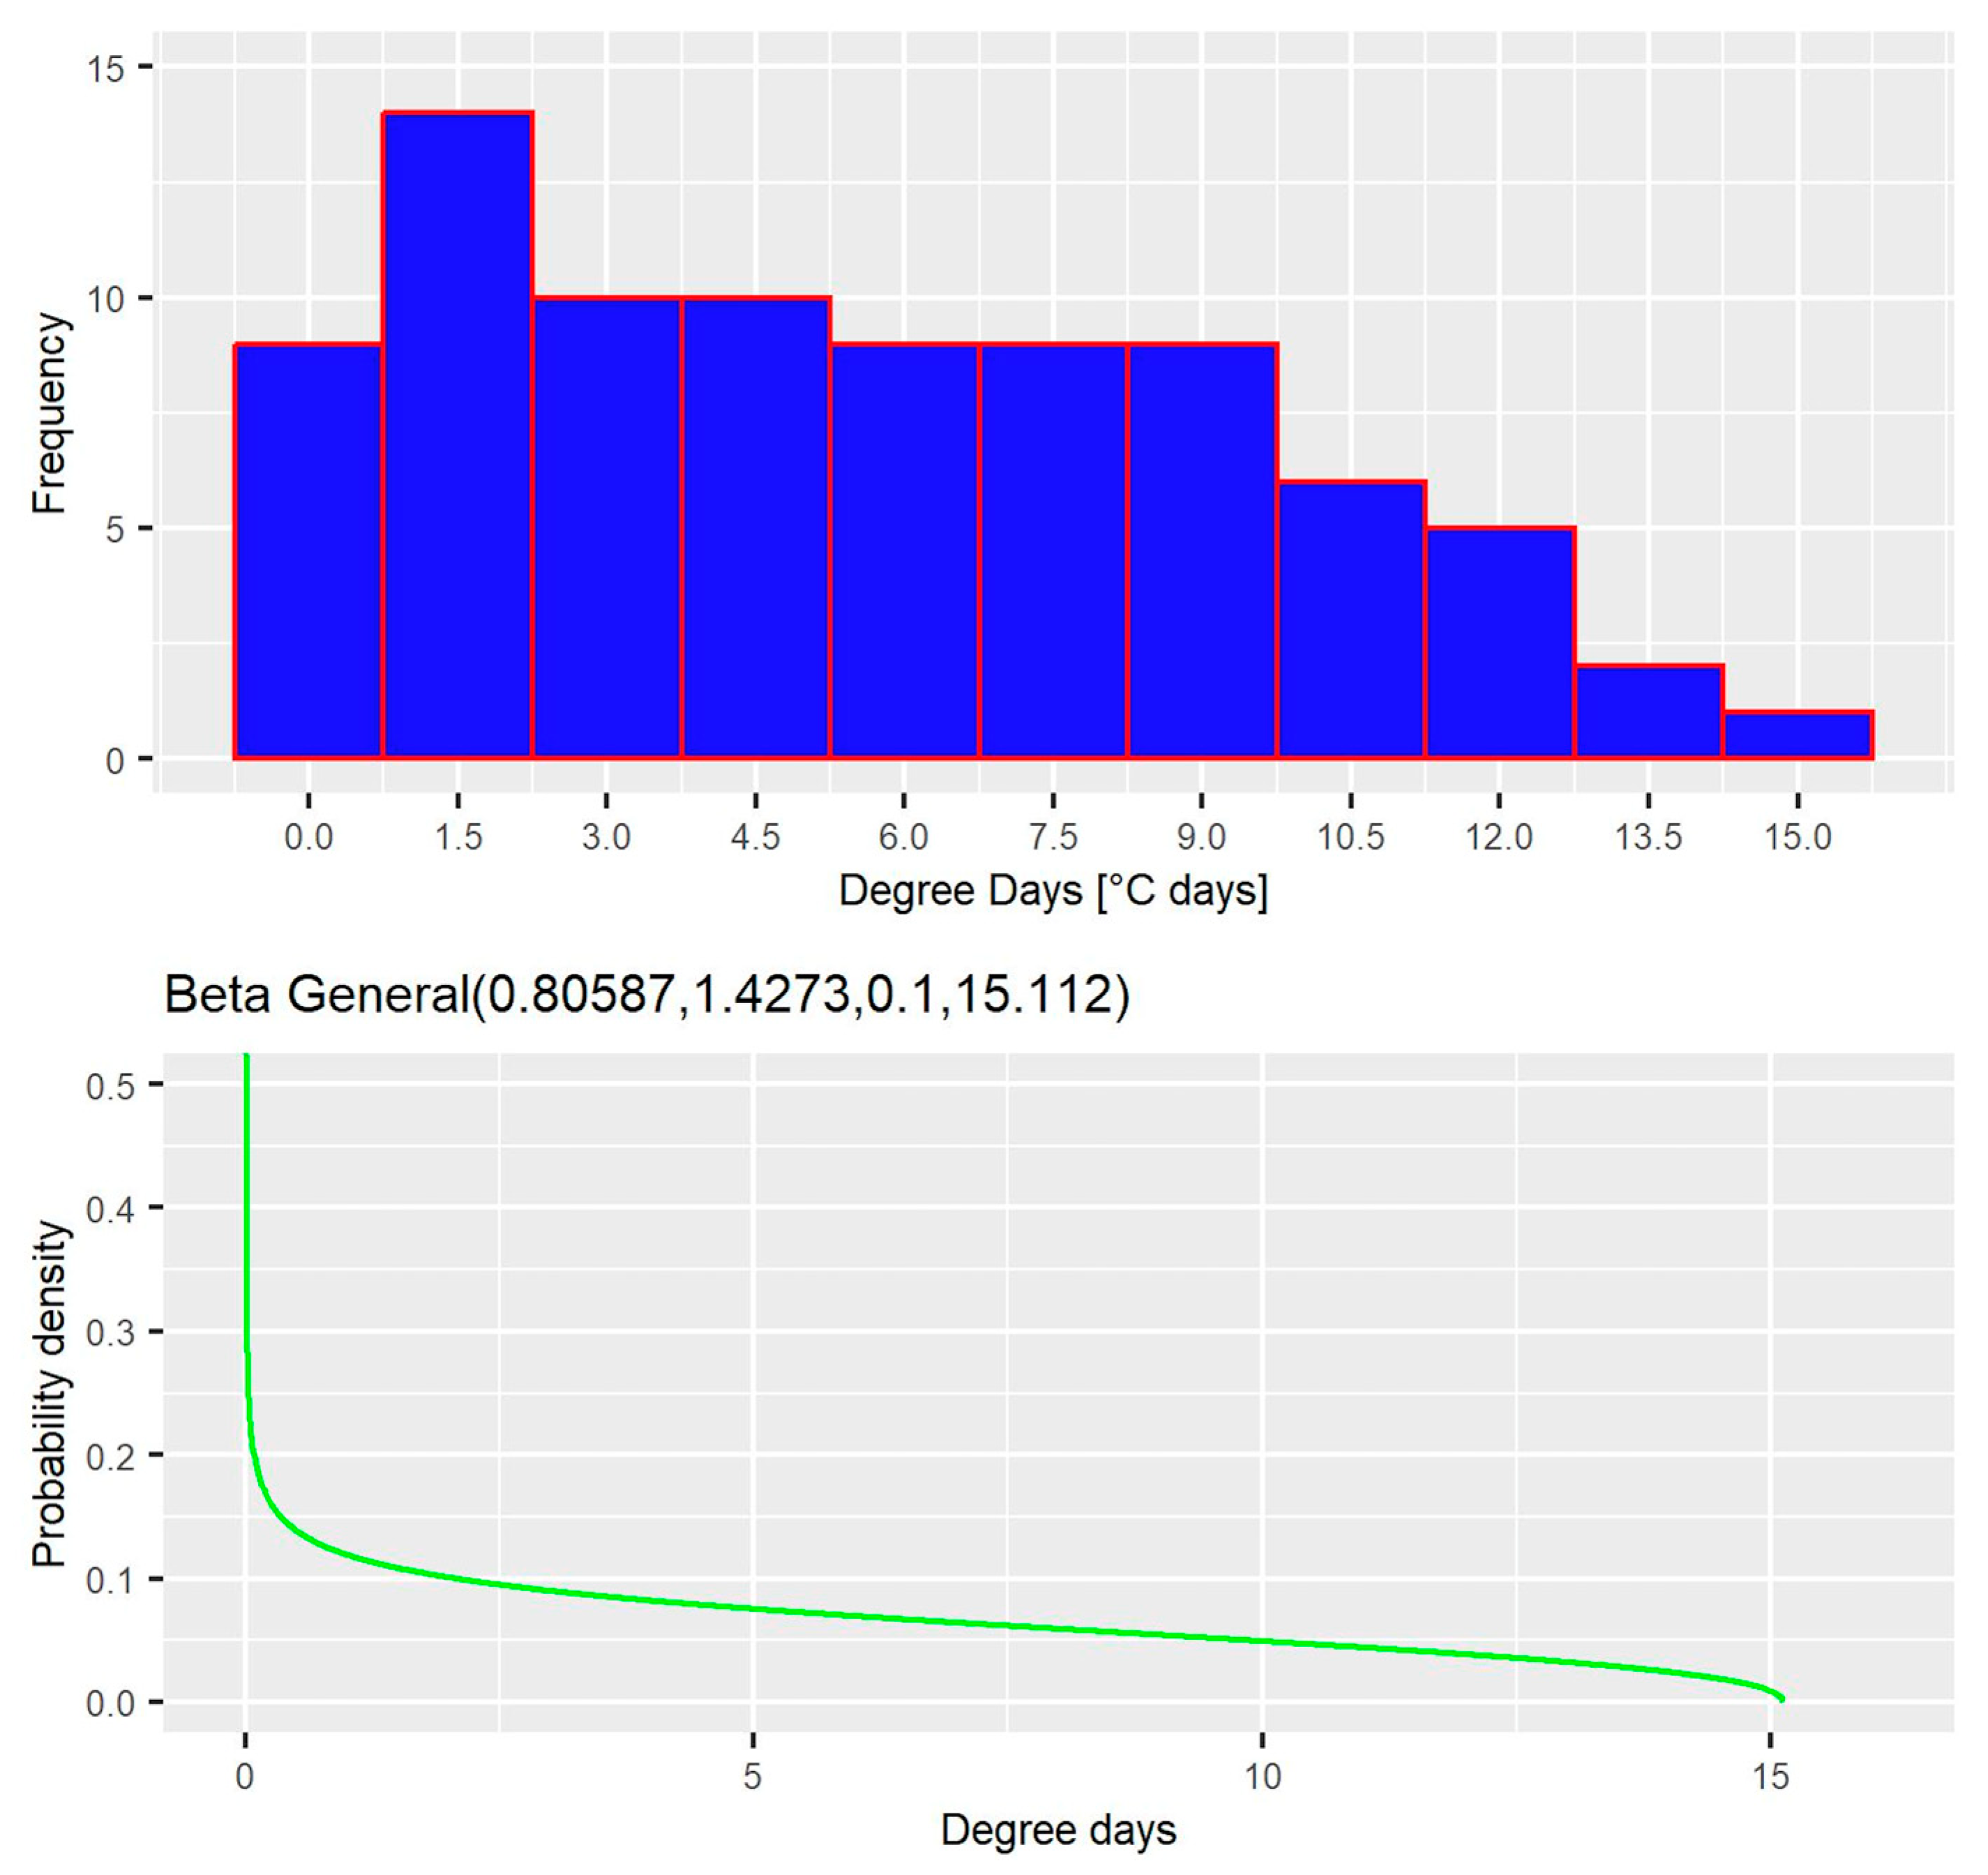
- Step 3: Generate random degree days using the normal distribution required for each different year selected in Step 0.
- Step 4: Note that fuel prices were inflated throughout the analysis period.
- Step 5: Calculate the energy cost for each year using Equation (4) (using the optimal thickness determined in Step 2).
- Step 6: Note that costs used for heating in each year were based on the present value.
- Step 7: Conduct a simulation using 1000 replicas to generate a random sample of net present value costs.
- Step 8: Calculate the risk that the random variable representing the net present value of cost exceeds the value (.
The previous steps were implemented in a spreadsheet in Excel, which is available at the following location: https://tinyurl.com/yvvwbk3z (accessed on 1 August 2023).
Screenshots of the conceptual model (Big PictureTM) and computational models are presented in Figure 7 and Table 2, respectively.
Figure 7.
Big PictureTM of the conceptual model.
Table 2.
Partial computational model in @RiskTM [Own elaboration].
3. Results and Discussion
To make cost comparisons using the deterministic and stochastic approaches, the optimal thickness (in m) and optimal cost (in USD/m2) were calculated using the input data in Table 1, for values of the useful life of 10, 20, 50, and 70 years, and inflation rates of 3%, 0%, and 1.5%. These values can be observed in Table 3.
Table 3.
Optimal cost (USD/m2) for various combinations of inflation rates and planned years of use.
Subsequently, simulations were implemented following the series of steps described above, and the risk defined in Step 8 was calculated for some values of the planned cycle life, operated years, and inflation rate (see Table 4, Table 5 and Table 6).
Table 4.
Risk for planned life cycle versus operated years (inflation rate of 3%).
Table 5.
Risk for planned life cycle versus operated years (inflation rate 0%).
Table 6.
Risk for planned life cycle versus operated years (inflation rate of 1.5%).
Finally, the risk map was created using the values of Table 3, Table 4 and Table 5 to obtain a better perception regarding life cycle building design errors that are not actually incorporated into the buildings (Figure 8, Figure 9 and Figure 10).
Figure 8.
Risk contours for various lifetimes and operated years (inflation rate of 0%).
Figure 9.
Risk contours for various lifetimes and operated years (inflation rate of 1.5%).
Figure 10.
Risk contours for various lifetimes and operated years (inflation rate of 3%).
From these Figures, we can deduce that the risk is always lower when the planned years of the building’s life cycle are equal to the years operated. However, the risk increases considerably when the years of operation are greater or less than the planned life of the building. In particular, the contour graph highlights that when the building is designed for a life cycle of more than 50 years and the it operates for a longer period, the risk is low, while if it is operated for a shorter period, the risk increases considerably. This is because the heating costs of operating the building for more than 50 years, due to the thickness of the insulation implemented, do not exceed the expected costs of the design.
4. Conclusions and Future Studies
The analysis conducted calculated sensitivity using the optimum thickness of the insulating material under deterministic and stochastic conditions. Using a deterministic approach, the thickness may increase by 80% if the useful life ranges from 10 to 50 years. Stochastic analysis, incorporating the variability of the degree days required annually, showed that the probability of exceeding the value of the optimal cost suggested by deterministic analysis can range from 0% to 100%, depending on the designed duration of the project’s lifetime and the building’s operated years. However, if the inflation rate is ignored, the risk increases. This risk is transferred to whomever will pay the operating costs of heating the building. These figures call for a study to consider the financial risks of building designs. In future studies, we propose the use of risk alternative selection methodologies to analyze the tradeoffs between various characteristics of the value of the cost from the stochastic perspective.
Author Contributions
Conceptualization, M.A.M.B.; methodology, J.M.V.; software & formal analysis, J.R.C.E.; writing—review and editing, H.R.G.; investigation, O.M.A. All authors have read and agreed to the published version of the manuscript.
Funding
This research received no external funding.
Informed Consent Statement
Not applicable.
Data Availability Statement
Links to data have been included in this article.
Acknowledgments
The authors thank the following institutions for the support given in the development of this research: Instituto Tecnológico y de Estudios Superiores de Monterrey, Universidad Autónoma del Estado de Hidalgo, and Universidad Cristóbal Colón.
Conflicts of Interest
The authors declare no conflicts of interest.
Nomenclature
| Cf | Fuel cost, USD/L |
| Ch | Annual heating cost, USD/m2 year |
| Ci | Insulation material cost, USD/m3 |
| Cin | Insulation cost, USD/m2 |
| Ct | Total heating cost as present value, USD |
| DD | Degree days, °C days |
| Eh | Required annual heating energy, J/m2 year. |
| g | Inflation rate |
| H | Heating value of fuel, J/L |
| I | Interest rate |
| I* | Interest rate adjusted for inflation (combined rate) |
| k | Thermal conductivity of insulation, W/m K |
| N | Lifetime, years |
| PWF | Present worth factor |
| Ri | Inside air film thermal resistance, m2 K/W |
| Rin | Insulation thermal resistance, m2 K/W |
| Ro | Outside air film thermal resistance, m2 K/W |
| Rw | Composite wall thermal resistance, m2 K/W |
| Rwt | Total wall thermal resistance, excluding the insulation material, m2 K/W |
| X | Insulation thickness, m |
| Xop | Optimum insulation thickness, m |
| β | Efficiency of space heating system |
| NPVC | Random variable representing the net present value of the costs |
References
- Ogulata, R.G. Sectoral energy consumption in Turkey. Renew. Sustain. Energy Rev. 2002, 6, 471–480. [Google Scholar] [CrossRef]
- Hasan, A. Optimizing insulation thickness for buildings using life cycle cost. Appl. Energy 1999, 63, 115–124. [Google Scholar] [CrossRef]
- Ozkahraman, H.T.; Bolatturk, A. The use of tuff stone cladding in buildings for energy conservation. Constr. Build. Mater. 2006, 20, 435–440. [Google Scholar] [CrossRef]
- Bolatturk, A. Optimum insulation thicknesses for building walls with respect to cooling and heating degree-hours in the warmest zone of Turkey. Build. Environ. 2008, 43, 1055–1064. [Google Scholar] [CrossRef]
- Kingdom of Saudi Arabia: Ministry of Industry and Electricity. Studies and Statistics Department, Electrical Affairs Agency. Electricity Growth and Development in the Kingdom of Saudi Arabia up to the Year 1420 H (1999/2000G). 2002. Available online: https://www.researchgate.net/publication/330765354_The_Development_of_Power_Systems_in_Saudi_Arabia (accessed on 1 August 2023).
- Karakaya, H.; Kallioğlu, M.A.; Ercan, U.; Avcı, A.S.; Fidan, C. Empirical modeling between degree days and optimum insulation thickness for external wall. Energy Sources Part A Recovery Util. Environ. Eff. 2020, 42, 1314–1334. [Google Scholar]
- Akpinar, E.; Demir, I. Calculation of Optimum Insulation Thickness and Energy Savings for Different Climatic Regions of Turkey. Turk. J. Sci. Technol. 2018, 13, 15–22. [Google Scholar]
- Balo, F.; Ulutas, A. Energy-Performance Evaluation with Revit Analysis of Mathematical-Model Based Optimal Insulation Thickness. Buildings 2023, 13, 408. [Google Scholar] [CrossRef]
- Anastaselos, D.; Giama, E.; Papadopoulos, A.M. An assessment tool for the energy, economic and environmental evaluation of thermal insulation solutions. Energy Build. 2009, 41, 1165–1171. [Google Scholar] [CrossRef]
- Bakos, G.C. Estudios de protección de aislamiento para el ahorro energético en el sector residencial y terciario. Energy Build. 2000, 31, 251–259. [Google Scholar] [CrossRef]
- Chwieduk, D. Hacia edificios de energía sostenible. Appl. Energy 2003, 76, 211–217. [Google Scholar] [CrossRef]
- Ozbek, K.; Gelis, K.; Ozyurt, O. Optimization of external wall insulation thickness in buildings using response surface methodology. Int. J. Energy Environ. Eng. 2022, 13, 1367–1381. [Google Scholar] [CrossRef]
- Daouas, N.A. Study on optimum insulation thickness in walls and energy savings in Tunisian buildings based on analytical calculation of cooling and heating transmission loads. Appl. Energy 2011, 88, 156–164. [Google Scholar] [CrossRef]
- Küçüktopcu, E.; Cemek, B.; Simsek, H. Application of Spatial Analysis to Determine the Effect of Insulation Thickness on Energy Efficiency and Cost Savings for Cold Storage. Processes 2022, 10, 2393. [Google Scholar] [CrossRef]
- International Energy Agency. Energy Statistics Data Browser. 2023. Available online: https://tinyurl.com/2s4z4tc3 (accessed on 1 August 2023).
- Shaik, S.; Talanki, A.B.P.S. Optimizing the position of insulating materials in flat roofs exposed to sunshine to gain minimum heat into buildings under periodic heat transfer conditions. Environ. Sci. Pollut. Res. 2016, 23, 9334–9344. [Google Scholar] [CrossRef] [PubMed]
- D’Agostino, D.; de’Rossi, F.; Marigliano, M.; Marino, C.; Minichiello, F. Evaluation of the optimal thermal insulation thickness for an office building in different climates by means of the basic and modified “cost-optimal” methodology. J. Build. Eng. 2019, 24, 100743. [Google Scholar] [CrossRef]
- Stazi, F.; Vegliò, A.; Di Perna, C.; Munafò, P. Experimental comparison between 3 different traditional wall constructions and dynamic simulations to identify optimal thermal insulation strategies. Energy Build. 2013, 60, 429–441. [Google Scholar] [CrossRef]
- Bojić, M.; Miletić, M.; Bojić, L. Optimization of thermal insulation to achieve energy savings in low energy houses (refurbishment). Energy Convers. Manag. 2014, 84, 681–690. [Google Scholar] [CrossRef]
- Annibaldi, V.; Cucchiella, F.; De Berardinis, P.; Rotilio, M.; Stornelli, V. Environmental and economic benefits of optimal insulation thickness: A life-cycle cost analysis. Renew. Sustain. Energy Rev. 2019, 116, 109441. [Google Scholar] [CrossRef]
- Idchabania, R.; Khyadb, A.; El Ganaouic, M. Optimizing insulation thickness of external walls in cold region of Morocco based on life cycle cost analysis. Energy Procedia 2017, 139, 117–121. [Google Scholar] [CrossRef]
- Benallel, A.; Tilioua, A.; Mellaikhafi, A.; Alaoui, H. Thickness optimization of exterior wall insulation for different climatic regions in Morocco. Mater. Today Proc. 2022, 58, 1541–1548. [Google Scholar] [CrossRef]
- Acikkalp, E.; Kandemir, S.Y. A method for determining optimum insulation thickness: Combined economic and environmental method. Therm. Sci. Eng. Prog. 2019, 11, 249–253. [Google Scholar] [CrossRef]
- Li, X.; Densley, D. A whole life, national approach to optimize the thickness of wall insulation. Renew. Sustain. Energy Rev. 2023, 174, 113137. [Google Scholar] [CrossRef]
- ASHRAE. ASHRAE Handbook of Applications 1995; ASHRAE: Washington, DC, USA, 1995. [Google Scholar]
- Park, C. Engineering Economics, 4th ed.; Prentice Hall: Hoboken, NJ, USA, 2009. [Google Scholar]
- Coates, E.R.; Kuhl, M.E. Using simulation software to solve engineering economy problems. Comput. Ind. Eng. 2004, 45, 285–294. [Google Scholar] [CrossRef]
- Bizee Degree Days. Available online: http://www.degreedays.net/#generate (accessed on 4 January 2020).
- Palisade|Software Tools for Risk Modeling and Decision Analysis. Available online: www.palisade.com (accessed on 8 January 2020).
Disclaimer/Publisher’s Note: The statements, opinions and data contained in all publications are solely those of the individual author(s) and contributor(s) and not of MDPI and/or the editor(s). MDPI and/or the editor(s) disclaim responsibility for any injury to people or property resulting from any ideas, methods, instructions or products referred to in the content. |
© 2024 by the authors. Licensee MDPI, Basel, Switzerland. This article is an open access article distributed under the terms and conditions of the Creative Commons Attribution (CC BY) license (https://creativecommons.org/licenses/by/4.0/).