Review

The Modelling of Pt-Bearing ORR and OER-Active Alloys

by
Ian Shuttleworth
Milton Keynes Educational Trust, Fyfield Barrow, Walnut Tree, Milton Keynes MK7 7WH, UK
Oxygen 2024, 4(4), 449-469; https://doi.org/10.3390/oxygen4040028
Submission received: 21 September 2024 / Revised: 11 November 2024 / Accepted: 3 December 2024 / Published: 8 December 2024

Abstract

:
Nanoparticles are a mainstay of heterogeneous catalysis. This is in part due to their mesoscopic structure; they can be grown to have large available surface areas which can be both regenerative and durable in reaction. Their utility is possible by the alloys used in their production—however, analysis of their operation is generally at the DFT or molecular dynamics level. This review will present an overview of the post-DFT methods relevant to materials supporting the ORR and OER reactions. Pt-bearing alloys will then be highlighted with a focus on their application in heterogeneous catalysis and the ORR/OER reactions. The current computational approaches to accurately predicting the band properties of the alloys will then be discussed and both the fundamental and applied importance of this modelling will be highlighted.

1. Introduction

Mechanistic and theoretical or computational studies of the processes that occur during catalysis are important to both understanding how the catalyst works and its development. Alloy nanoparticles used in the catalysis and more specifically the oxygen reduction and oxygen evolution reactions (ORR and OER, respectively) are often used in the form of core-shell structures where the bulk of the catalyst is alloy but the surface layer is pure metal. These structures develop because of the thermal processing of the nanoparticles during their production and they affect the performance of the catalyst. Several electronic and mechanistic paradigms arise because of these structures, and both categorising and understanding these paradigms are key development themes.
The ligand effect can be used to explain changes in the electronic structure of the surface of the catalyst by the presence of foreign atoms in the metal surface layer. The effect simply encapsulates the idea that the electronic structure of the clean surface layer of the catalyst will change if foreign atoms are incorporated onto, or into, the surface and the origin of the change is purely electronic. The effect is closely related to the strain effect which describes changes in the electronic structure of the surface arising from local compressive or tensile strains which arise from the lattice mismatch between the foreign and host atoms, or which can arise from the application of external strain or the lattice mismatch between the pure metal surface layer and the alloy bulk. These two effects are summarised in Figure 1. A further effect is the ensemble effect which can be used to classify grouping or clustering of atoms on the surface of the catalyst.
Magnetic Pt-bearing catalysts are popular ORR and OER catalysts because of their high stability, activity and selectivity towards industrial and fuel cell applications [1,2,3,4]. Pt was the first metal to be used in fuel cell catalysts, and to date remains the most ubiquitous. The reason for this is despite the problems associated with its use—notably its scarcity and high financial cost—it fits the profile of an effective catalyst. Pt-based catalysts have high stability, activity and selectivity. This is particularly true for processes involving the oxygen reduction reaction (ORR) which is one of the key reactions in a fuel cell.
Table 1 summarises the solid catalysts used in the reduction and evolution of hydrogen and oxygen, which are key steps in fuel cell operation. During the discharge of a proton exchange membrane fuel cell (PEMFC) or a metal-air battery (MAB), oxygen molecules are reduced by electrons at the cathode. Depending on the operating conditions, the products then either combine with hydrogen to form water if the process is proceeding under acidic conditions, or they combine with water to form O H under alkaline conditions. The actual mechanism involved can be complex though can be classified as 2- or 4-electron processes, giving rise to different intermediates.
Though not naturally magnetic, Pt is often mixed with a ferromagnetic element in these alloys, in particular, Ni but also Fe and Co, to produce catalysts with the required activity; the Ni, Fe and Co atoms retain their magnetic character on alloying and resulting in an alloy which is permanently magnetised.
Figure 2 shows the catalytic behaviour of a number of Pt-based magnetic alloys and highlights where magnetic alloys are those which contain one or more of the naturally ferromagnetic elements Fe, Co, or Ni with wider advances in the field of Pt- and magnetic alloys including the development of perovskite alloys [10,11,12], high-entropy alloys [13,14], the related multi-principal element alloys (MPEA’s), concentrated alloys (CCA’s) [15] and Kagome alloys [16]. These developments are supported by more established works which focused on bimetallic alloys [17] and pre-date the modern theory of magnetism [18,19] and the current refinements to modelling using Density Functional Theory (DFT) and post-DFT methods.
This work will be set out in the following way: an introduction to DFT methods together with a summary of the key band structure studies of both Pt-bearing and related systems. The current state-of-the-art modelling approaches to surface adsorption will then be presented followed by a summary review of the impact of these models on systems appropriate to the ORR and OER. This work will then summarise the field and discuss areas for development.

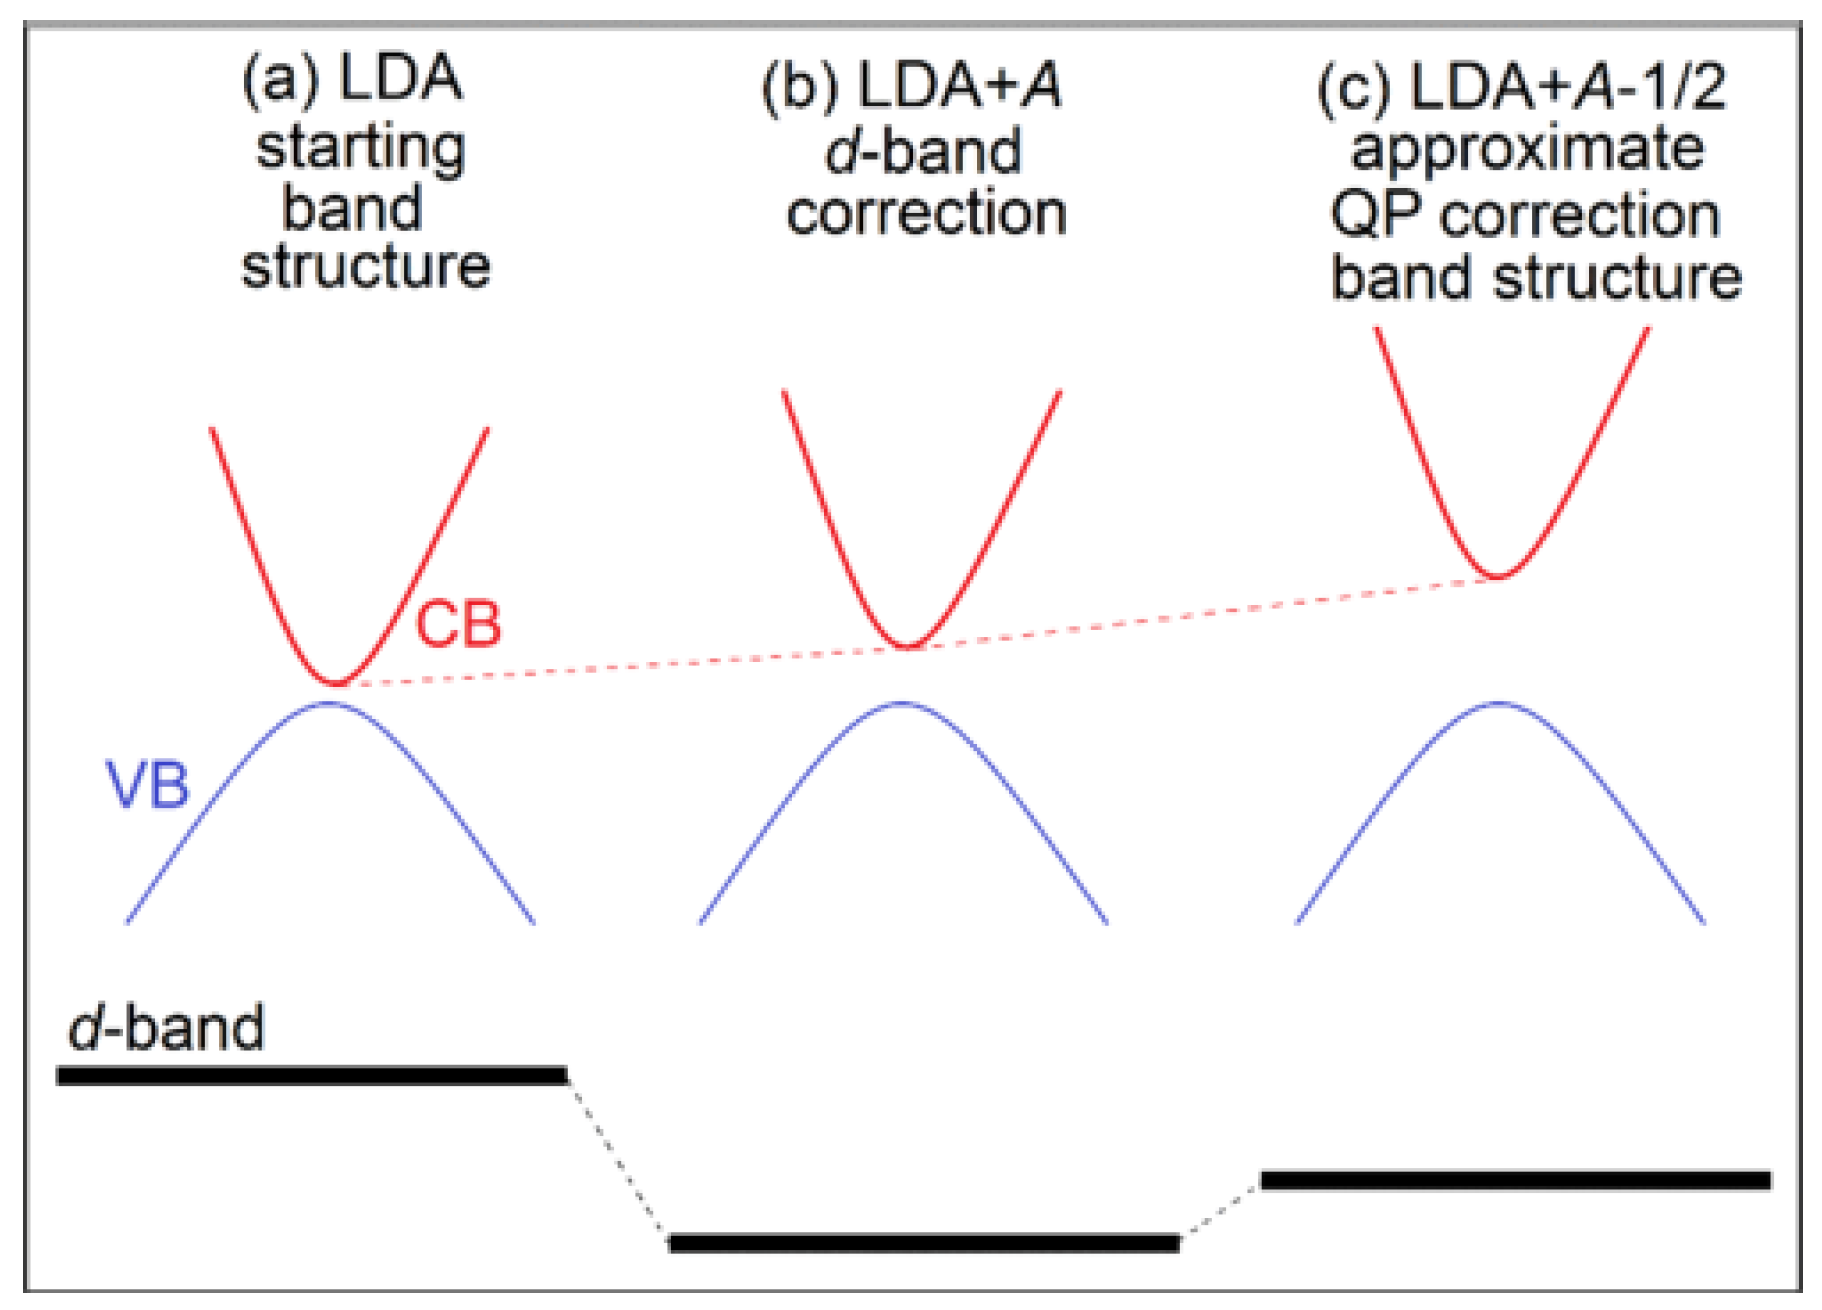
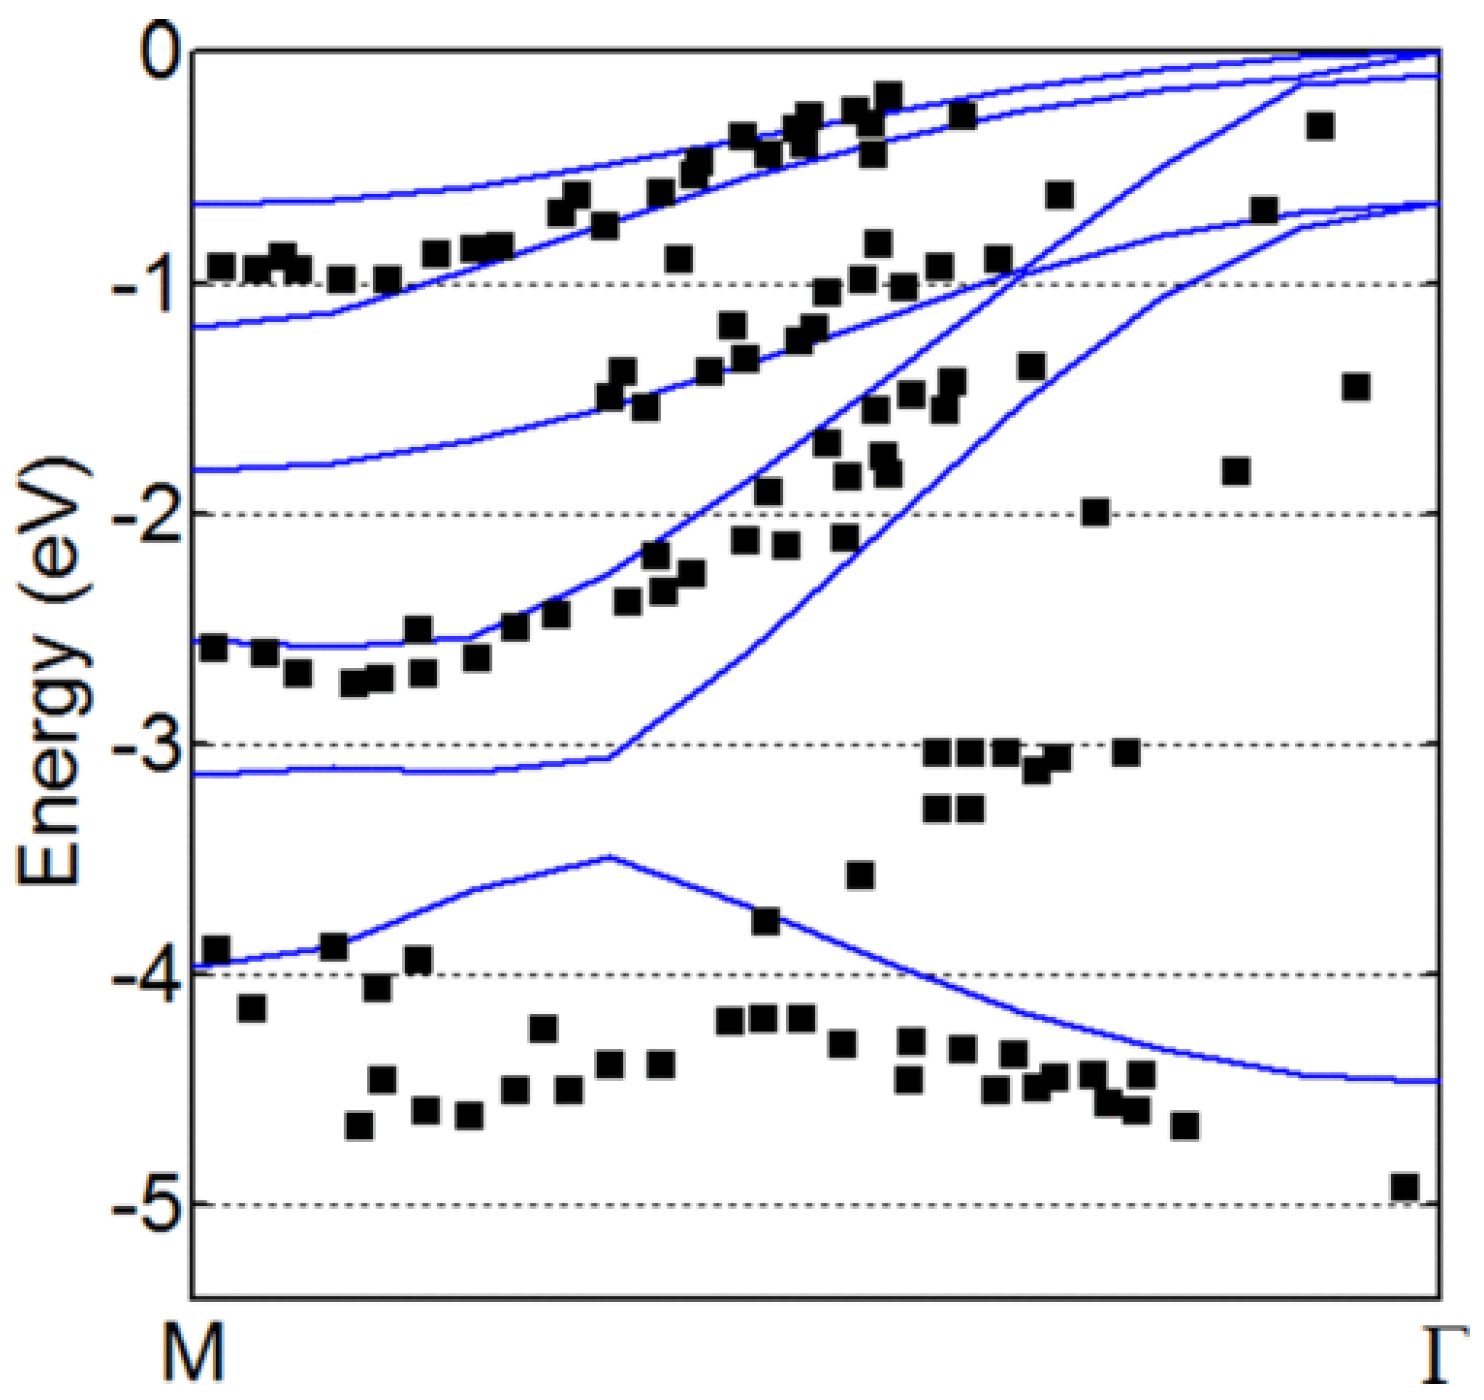
2. Band Structure Estimation Using DFT and Post-DFT Methods

Density Functional Theory (DFT) is a popular tool to model atomic-scale interactions. To understand the limitations of DFT, we first consider Equation (1), the Schrödinger equation, for a single particle moving in an external potential v e x t r
1 2 2 + v e x t r Ψ r = ε Ψ r
For a system of N-electrons, Equation (1) generalises to the many-body form shown in Equation (2)
i = 1 N 1 2 i 2 + v e x t r i + i < j V r i , r j Ψ r 1 , r 2 , , r N = E Ψ r 1 , r 2 , , r N
The formula for the N-electron Hamiltonian can be written in operator form to highlight the key interactions. This is shown in Equation (3),
H ^ = T ^ e + V ^ e x t + V ^ e e
T ^ e , V ^ e x t and V ^ e e are the operators for the electron kinetic energy, the external (electron-ion core) and electron-electron potentials, respectively.
T ^ e = 1 2 i = 1 N i 2
V ^ e x t = I = 1 N i o n i = 1 N Z I r i R I
V ^ e e = i < j V r i , r j = i < j 1 r i r j
The ion core-ion core interactions are ignored as they are assumed constant by virtue of the Born-Oppenheimer approximation. This approximation can be relieved, and the motion of the ion cores can be included in simulations; however, this is a separate topic of molecular dynamics and will not be considered in this review.
The many-body formulation in Equation (3) is not practicable; V ^ e e can generate many terms which computationally makes the routine solution of Equation (3) unfeasible. DFT is a formally exact way of restating Equation (3) to a more tractable form. A key step is the definition of the electron density n r
n r = N d 3 r 2 d 3 r 3 d 3 r N Ψ * r , r 2 r N Ψ r , r 2 r N
n r collates much of the complexity of the electron wavefunction Ψ r 1 , r 2 , , r N . The Hohenberg-Kohn theorems state that the ground state energy of an interacting electron system is identical to that of a non-interacting system which experiences the same external potential. It is possible to state the total energy within the DFT as
E n r , v r = T n r + V H n r + E X C n r + v e x t r n r d r
Though computationally tractable, there are limitations to the formulation presented in Equation (8). Though formally exact, it requires that the exact exchange-correlation functional E X C n r be known. However, the exact value is not known and approximate values are used. This is one of the inherent limitations of the DFT method.
Within the Local Density Approximation (LDA), the exchange-correlation functional is,
E x c L D A n r = ϵ x c H E G n r n r d r
ϵ x c H E G is the exchange-correlation energy per electron for a homogeneous electron gas (HEG). As an HEG will only slowly vary with position, gradient terms are not required in Equation (9) but this also gives a limit to the approximation. Gradient terms can be added and the resulting exchange-correlation functional is shown in Equation (9).
E x c G G A n r = ϵ x c n r , n r n r d r
Equation (10) expresses the exchange-correlation functional for the Generalized Gradient Approximation (GGA), and ϵ x c n r , n r is the exchange-correlation energy per electron for the inhomogeneous case within the GGA. The approximation relieves the requirement for a homogeneous electron gas and accounts for the slow variation of the electron gas with position.
The process of refinement of the exchange-correlation functional can be continued and there is a ‘Jacob’s ladder’ of local, non-local and hybrid functionals of increasing accuracy and computational expense [21,22]. An arguably more challenging refinement is the replacement of the electron with its quasiparticle [23,24]. The physical justification for this replacement has similar origins to the external potential. As an electron moves through a crystal, it experiences interactions with the ion cores and the other electrons. It therefore acquires an effective mass which is different from that of an electron which is isolated in a vacuum.
The electronic band structure is a convenient way to visualise the effect of the quasiparticle approach. The importance of the curvature d 2 E d k 2   of the electronic band structure is shown by considering the effective mass m *
m * = 2 d 2 E d k 2
This well-known relation demonstrates that the density of states at a certain energy and momentum depends directly on m * so the accurate estimation of this quantity is central to predicting quantities which depend on the electronic density of states. The quasiparticle approach corrects the band structure by building on the energy predicted from a conventional DFT calculation and adds terms that, in part, depend on the exchange and correlation of self-energies. Corrections of the electronic band structure are obviously mirrored in the electron density which, following the arguments presented in the ‘Introduction’ section of this manuscript will directly affect the reactivity of the surface of the catalyst towards gas-phase oxygen and other molecules. Just like changes in the single electron mass, corrections to the electron density and band structure can improve the description of the electron exchange mechanisms, e.g., superexchange [25], as well as improve the description of electroluminescence seen in solar cells [26]. Practically, the quasiparticle correction is performed by reading the output wavefunctions from a DFT calculation, and then correcting the generated set of wavefunctions, and this can be done by applying the Yambo code [27,28] to the output from Quantum Espresso DFT calculations [29], or by using the BerkeleyGW [30] or the ABINIT [31] packages.

3. The Band Structures of Crystals for the ORR/OER

3.1. Oxidic Crystals

Ni–M–H energy storage units are routinely constructed from RNi5 materials—where R is a Y, La, or a rare earth element. Though similar in function to the Pt-bearing devices highlighted earlier in this manuscript, the interplay between the f-electrons of the RNi5 can produce complex phase diagrams and exotic behaviour not seen in the Pt case. High-resolution angle-resolved photoemission spectroscopy (ARPES) and Dynamical Mean Field Theory (DMFT) calculations of the CePt5/Pt(111) system [32] have shown that heavy fermion bands exist close to the Fermi level. ARPES studies of the strongly correlated CeMIn5 (M = Rh, Ir and Co) and YbRh2Si2 [33] have shown that the electronic states of the 5f materials in these compounds can exist in itinerant and localised states. The localised states are formed from heavy fermions. The Dynamical Mean Field Theory (DMFT) approach maps a many-body lattice problem to a many-body local problem. Though the former problem is intractable, the mapped problem is tractable. Using DMFT and neutron scattering [34], a temperature-dependent transition with coherent f-electron bands forming at low temperatures has been identified in CePd3.
Using band structure analysis, heavy fermion regions have been identified for CeCoIn5 [35] and CeIn3 [36]. A weakly dispersive (i.e., low curvature) quasiparticle band has been identified in CeI n3 [37], indicating only a weak interaction between the localised f-electrons and the conduction electrons when compared to CeCoI n5 and CeIrI n5. Dispersion-free bands have also been observed for R Co5 (R = rare earth) compounds [38] suggesting the possibility of flat-band engineering.
The preceding section has focused on materials containing 4- and 5-f electron bands. Oxide materials containing Ga, Al, In, Zn, Sn, Cd, Ni, Cu and Sc are of current interest [39] because of their conducting and semiconducting character and the applications that they have in e.g., power electronics, solar cells, and optical detection and sensing. One of the more widely investigated of these is Ga2O3 [40] which has five polymorphs which are labelled as α, β, γ, δ and ε. The study of the band structure of this material is important because of the dependence of its conductivity on its band structure. The band structure of β-Ga2O3 has been extensively studied and has a valence band maximum which is formed predominantly of weakly interacting oxygen 2p states, and a conduction band minimum which is formed of gallium 4s states.
Figure 3 shows the time evolution of the luminescence spectrum from as-grown β-Ga2O3 which results in the emission of blue light whose intensity increases with the time delay. These material absorption measurements [40] have shown that though the fundamental band gap is indirect, the minimum direct band gap is only 29 meV higher in energy. This results in a predicted deep-UV luminescence and strong near-edge adsorption. The structural characterisation of these materials has been complicated in part by the presence of disordered phases and by the onset of the disorder as the material approaches a phase transition. Three of the five phases of Ga2O3 are inherently disordered [41] meaning that a characterisation of the band structure of the material is both conceptually challenging and difficult to verify experimentally. For this type of study, emission experiments generally require high-quality single crystal samples which are difficult to both produce and characterise with the complicated phase diagram demonstrated by Ga2O3.
Zinc oxide (ZnO) crystallises in three main forms: the low-pressure hexagonal wurtzite, the metastable zinc-blende and high-pressure rock-salt forms. X-ray diffraction studies of ZnO [43] have demonstrated that there is a transition from the wurtzite to a rock salt structure at the high pressure of (9.1 ± 0.2) GPa. The band structure of this system has been investigated on a number of occasions using the quasiparticle approach [44]. The correction is however problematic as GW calculations have predicted a band gap of 1.36 eV for the zinc-blende structure which compares poorly with the experimental value of 3.27 eV.
Figure 4 shows schematically how the different approximation levels affect the predicted band gap for this oxide and CdO. In both schemes, LDA+A denotes a scheme which corrects for the self-interaction energy within the metal d-bands. The origin of this spurious computational energy arises from Equation (7). DFT works in part by transforming the electron wavefunctions into an electron density. This density contains all the wavefunctions. However, for each eigenfunction equation formed using Equation (8), the wavefunction acting as the eigenfunction will be operating on the component of itself embedded in the electron density n r . This is an error as v e x t r n r d r is a potential external to the eigenfunction, and so any component of the eigenfunction in n r requires correction.
Figure 5 shows the k-resolved electronic band structure for ZnO in the wurtzite form, taken along the ΓM direction. The size and position of the band gap affect the reactivity of the material toward oxygen, so it is significant that an unshielded electron prediction of the band gap is significantly in error when compared to the experimental value. Qualitative insights can be more confidently made. The application of pressure to these oxides transforms them into a rock salt structure [46] where the valence band maximum is no longer at the Γ point of the band structure. This arises from the symmetry of the unit cell in the rock salt structure and the effect that it has on the hybridization between the oxygen 2p and the metal d-states. This computational prediction has been confirmed experimentally [47] where a direct to indirect band gap has been measured during the transition of ZnO between the wurtzite and rock salt phase using a pressure up to 14 GPa [47].

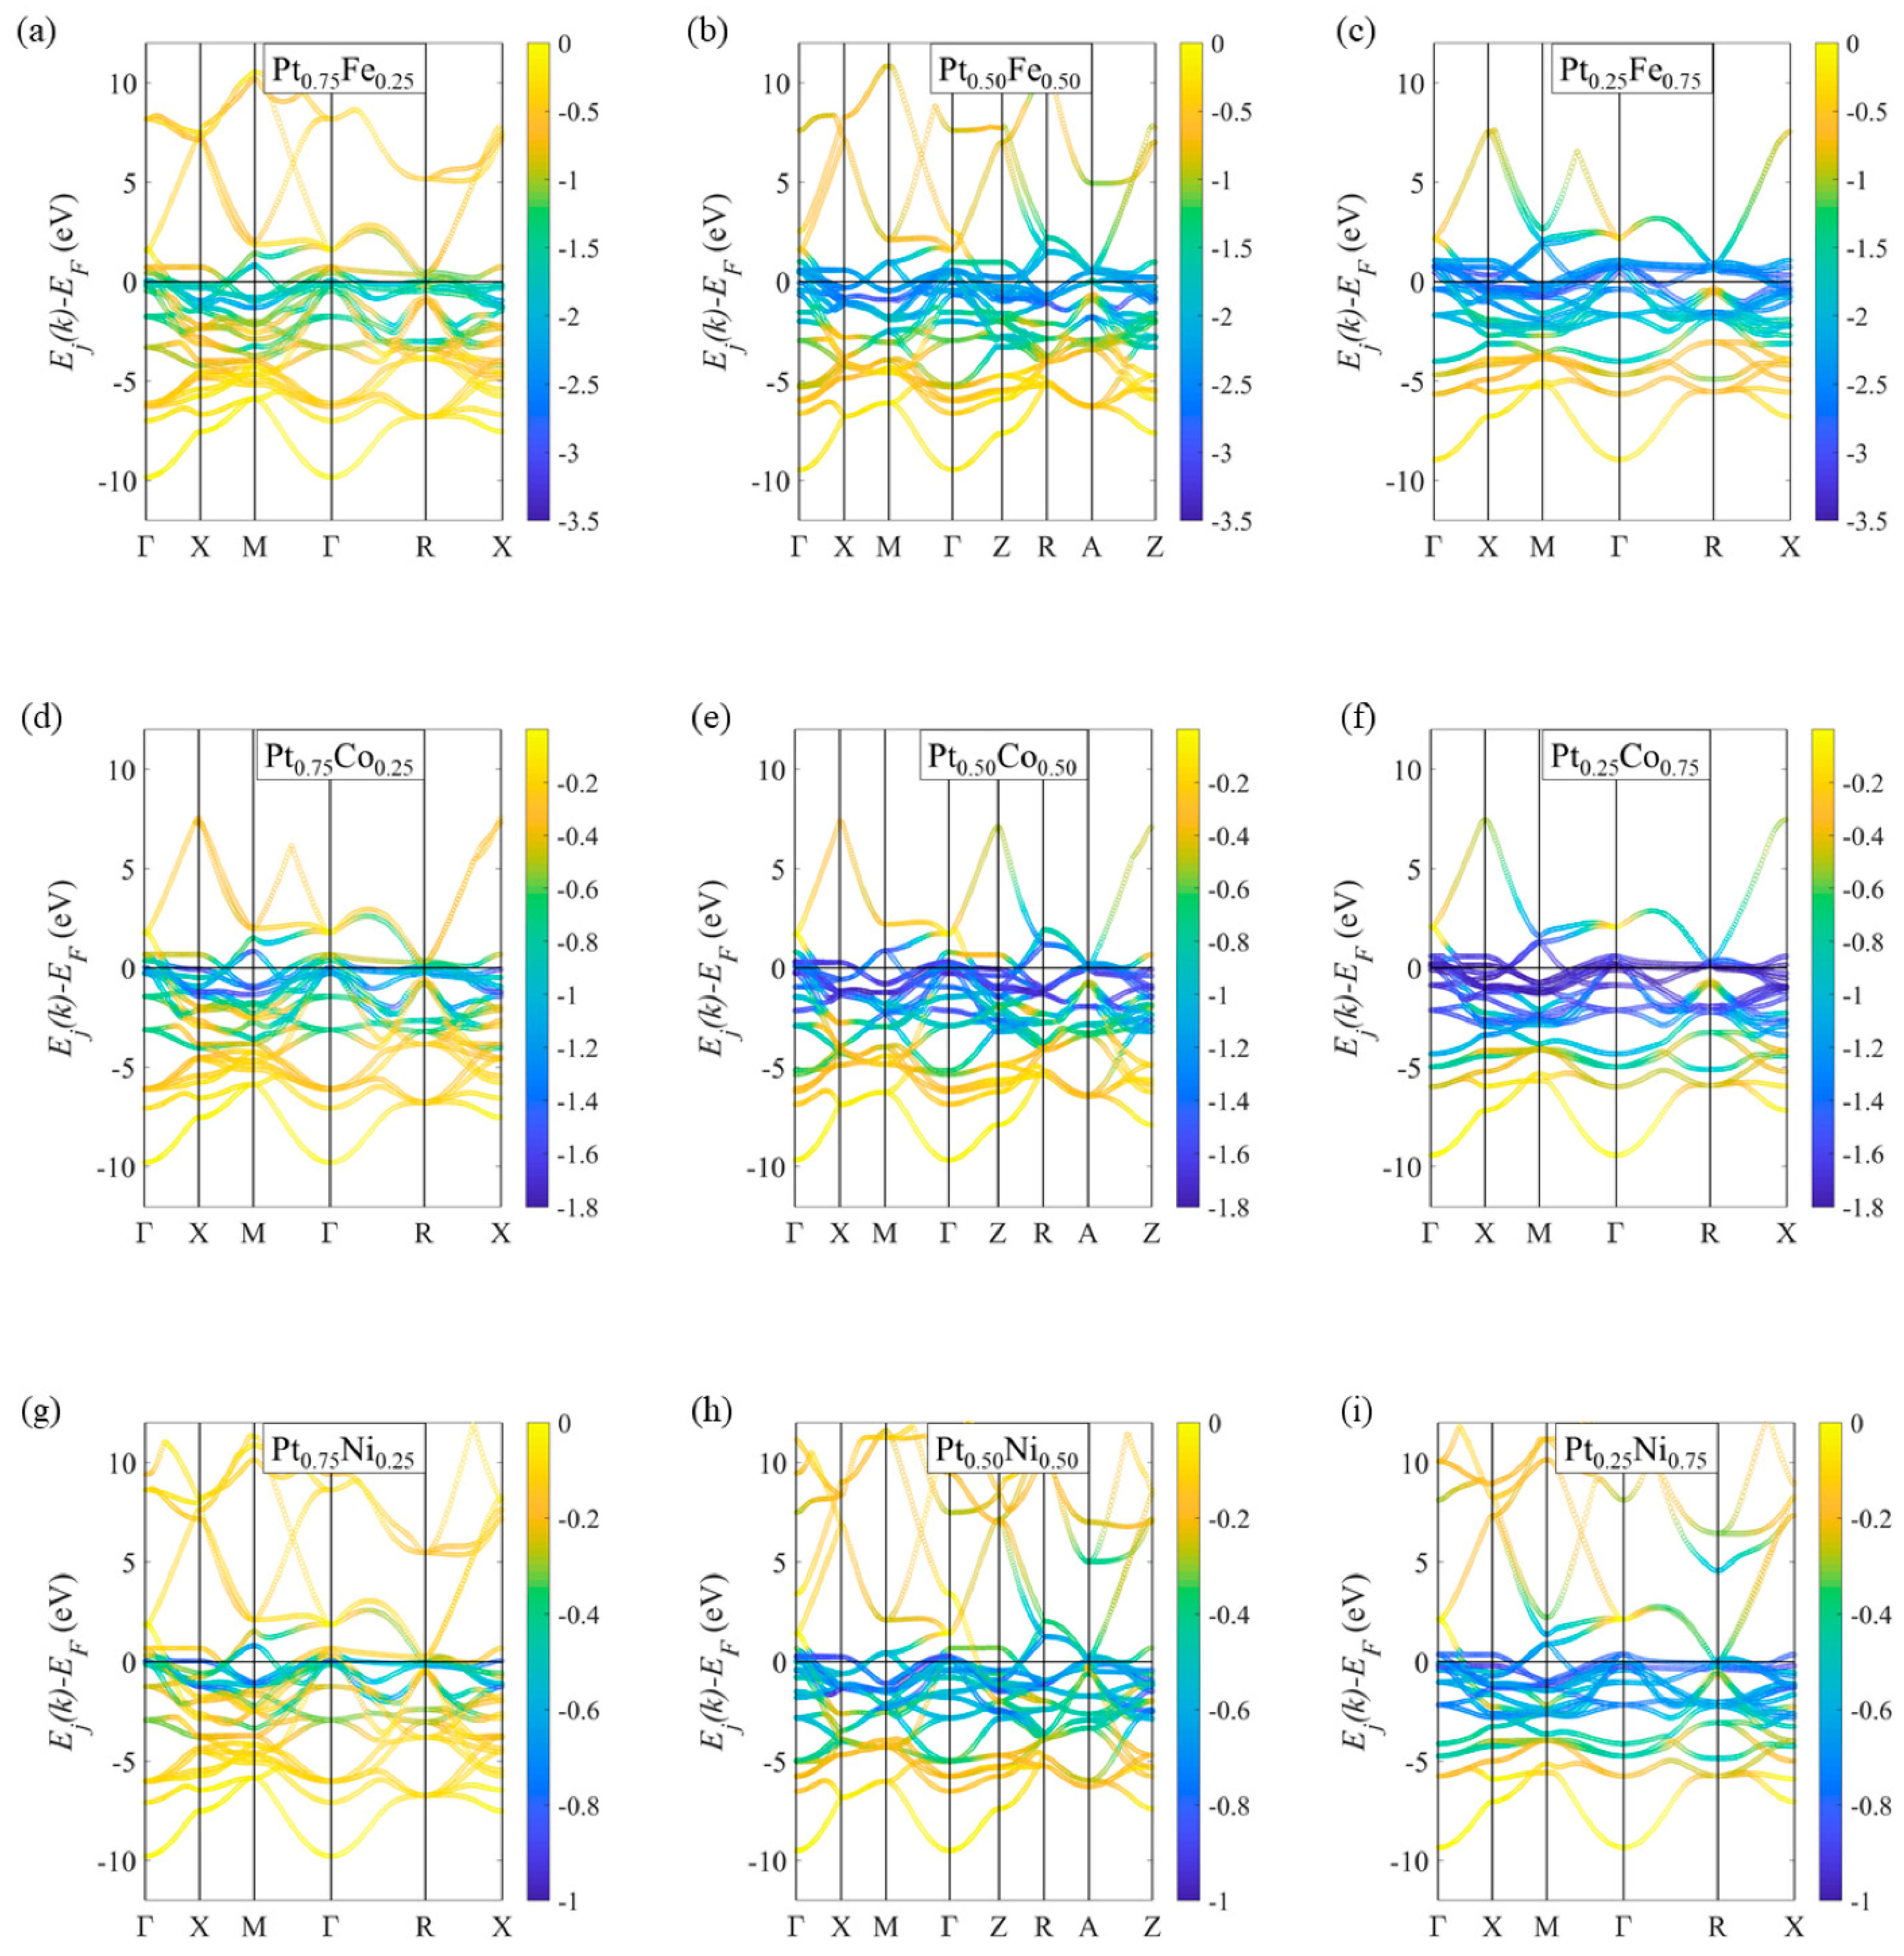
3.2. Metallic Alloy Crystals

The proton exchange membrane fuel cell (PEMFC) relies on Pt electrodes because of the corrosive nature of the electrolyte used in the device. Pt-alloys are part of a family of alloys that undergo an order-disorder transition with increasing temperature though they can undergo phase transitions with changes in temperature, pressure or stoichiometry. By appropriately tuning temperature, pressure and stoichiometry, combining Pt with permanently magnetised elements produces ordered Ni-Pt, Co-Pt and Fe-Pt alloys. These alloys have a structure which is either CuAu type (L10 or P4/mmm) or a Cu3Au (L12) structure depending on the stoichiometry. In the disordered structure, atoms occupy substitutional positions on the FCC lattice sites resulting in crystals which have short-range order but long-range disorder.
Experimental studies of the Ni-Pt alloy [48,49] have shown that magnetisation of the alloy is sensitive to its stoichiometry and to the degree of disorder in the alloy. Experimental observations agree with theoretical studies of Ni0.50Pt0.50 [50] which predicted an ordered L10 structure. These results compare to earlier theoretical studies of the NicPt1-c randomly-substituted alloy [51] which showed that despite the scant reporting of experimental photoemission and band structure data, the electronic structure and band surface of the alloy is complex and depends sensitively on the stoichiometry of the alloy.
More recent theoretical studies have investigated the magnetic band structures of the ordered phases of PtxFe1−x, PtxCo1−x and PtxNi1−x where x = 0.25, 0.50 and 0.75 [52]. The studies investigated ordered phases rather than the large number of possible quasi-random sequences, or the larger set of all possible random structures highlighting the practical limitations of this type of investigation. First-principles electronic band structure calculations are in themselves computationally expensive particularly as they require a higher k-point sampling than structural relaxation or optimisation calculations. Post-DFT approaches to the electronic band-structure problem may further require an order of magnitude more computational time; this highlights the main practical limitation of this type of study.
Figure 6 shows spin-resolved electronic band structures for varying stoichiometries of the three Pt-bearing alloys Pt-Fe, Pt-Co and Pt-Ni. Each of these three alloys is magnetic because of the permanently magnetised Fe, Co, or Ni atoms in them. The total magnetisation of each alloy increases as the fraction of the Fe, Co, or Ni increases compared to the fraction of Pt atoms. A quantitative analysis of the k-resolved magnetic moments which are presented in Figure 6 shows that the magnetisation is composed of an itinerant (Stoner) component and a localised component. The latter quantity produces the large magnitude spin-splitting components shown in Figure 6, which are generally coloured dark blue. They are centred on the d-bands of the magnetic Fe, Ni, and Co atoms. This localisation is suggestive of a magnetisation-driven local mechanism for reactions that occur at the surface of these alloys. The reason for this deduction is that reactions involving electron exchange such as those in the ORR and OER will occur at energies close to the Fermi level. In this case, however, the action of the delocalised electron is not precluded; the shading used in Figure 6 will necessarily highlight the local components and it is possible that a non-local mechanism might be present. Further investigations would be necessary to prove this. Further, the band structures in Figure 6 are for unshielded electrons; adding the quasiparticle approximation might alter the quantitative understanding of these systems, particularly with predictions of the reaction rate, however, to the best of the knowledge of the author, these studies have not been attempted.
Supporting investigations of the Co-Pt and Ni-Pt alloys [53] have shown that the alloys are preferentially ferromagnetic. These magnetic effects work in combination with an electric model of the surface to model the reaction of oxygen with the surface, which is the first step of the ORR. The conventional model of adsorption is one where computationally an external electric field is applied. This electric field arises from various interactions between oxygen, water and the surface and between co-adsorbed oxygen and water. The resulting shift in energy levels between the adsorbates and the surface determines the strength of binding between the two and consequently the rate of the ORR. The effects of adding magnetic terms to the reaction Hamiltonian are most explicitly analysed using the band structure. This is because more directly observable quantities such as the binding energy of the reactants are determined by that band structure albeit not always directly.
A clear fundamental understanding of the surface band structure of the Ni-Pt bearing alloys has been beneficial in developing an accurate picture of why this alloy is such an effective catalyst towards the ORR. Studies of the L10 and L12 phases of PtxNi1−x (x = 0.25, 0.5 and 0.75) [54,55] have demonstrated that adding the spin-orbit corrected (SOC) orders the local magnetic moment vector along ΓR (ΓA) diagonal of the L12 (L10) phase of this alloy. Applying tensile strain to these phases increases the magnetic moment, and compressive strain decreases the moment. This may be thought of as evidence that moments are localised and prone to overlap under compressive strain. This overlap causes frustration between adjacent moments which reduces the net moment.
Ni-Pt alloys are among the few ORR/OER materials which have—in full or in part—received investigation or analysis of their electronic band structures [56,57]. Figure 7 shows the effect of the quasiparticle approximation on the band structure of Ni-Pt alloys [57].
To reduce the complexity of quasiparticle and unshielded electron band structures and to establish a benchmark for quantitative energy, two empirical fits were performed. The dashed lines are linear fits to the raw quasiparticle energies Eqp and unshielded electron energies Ebare which are plotted in Figure 7. These values of Eqp and Ebare were extracted directly from the Γ-points of the raw band structures and are plotted as the addition signs in Figure 7. Their correlation is clear from the figure. The linear fit was not exact and higher-order polynomial fits were attempted. Numerically, higher-order polynomial models will always be expected to improve the quality of fit as long as the number of fitting terms in the polynomial does not exceed the number of fitting points, and the problem remains well-defined. In this case, a significant improvement in the order of the fitting polynomial was not apparent. Because of earlier observations of the dependence of the adsorption processes in regions dominated by particular bands—for example, the magnetic d-bands which lie close to the Fermi level in Figure 6, which were discussed earlier in this text—the problem was rephrased and the Ni and Pt s and d-wave coefficients were combined and are presented as the ‘diamond’ data in Figure 7. This model is more linear than the direct energy model suggesting that accurate and numerically accessible models of these systems may be better investigated using the wavefunction coefficients rather than the band structure energies directly.

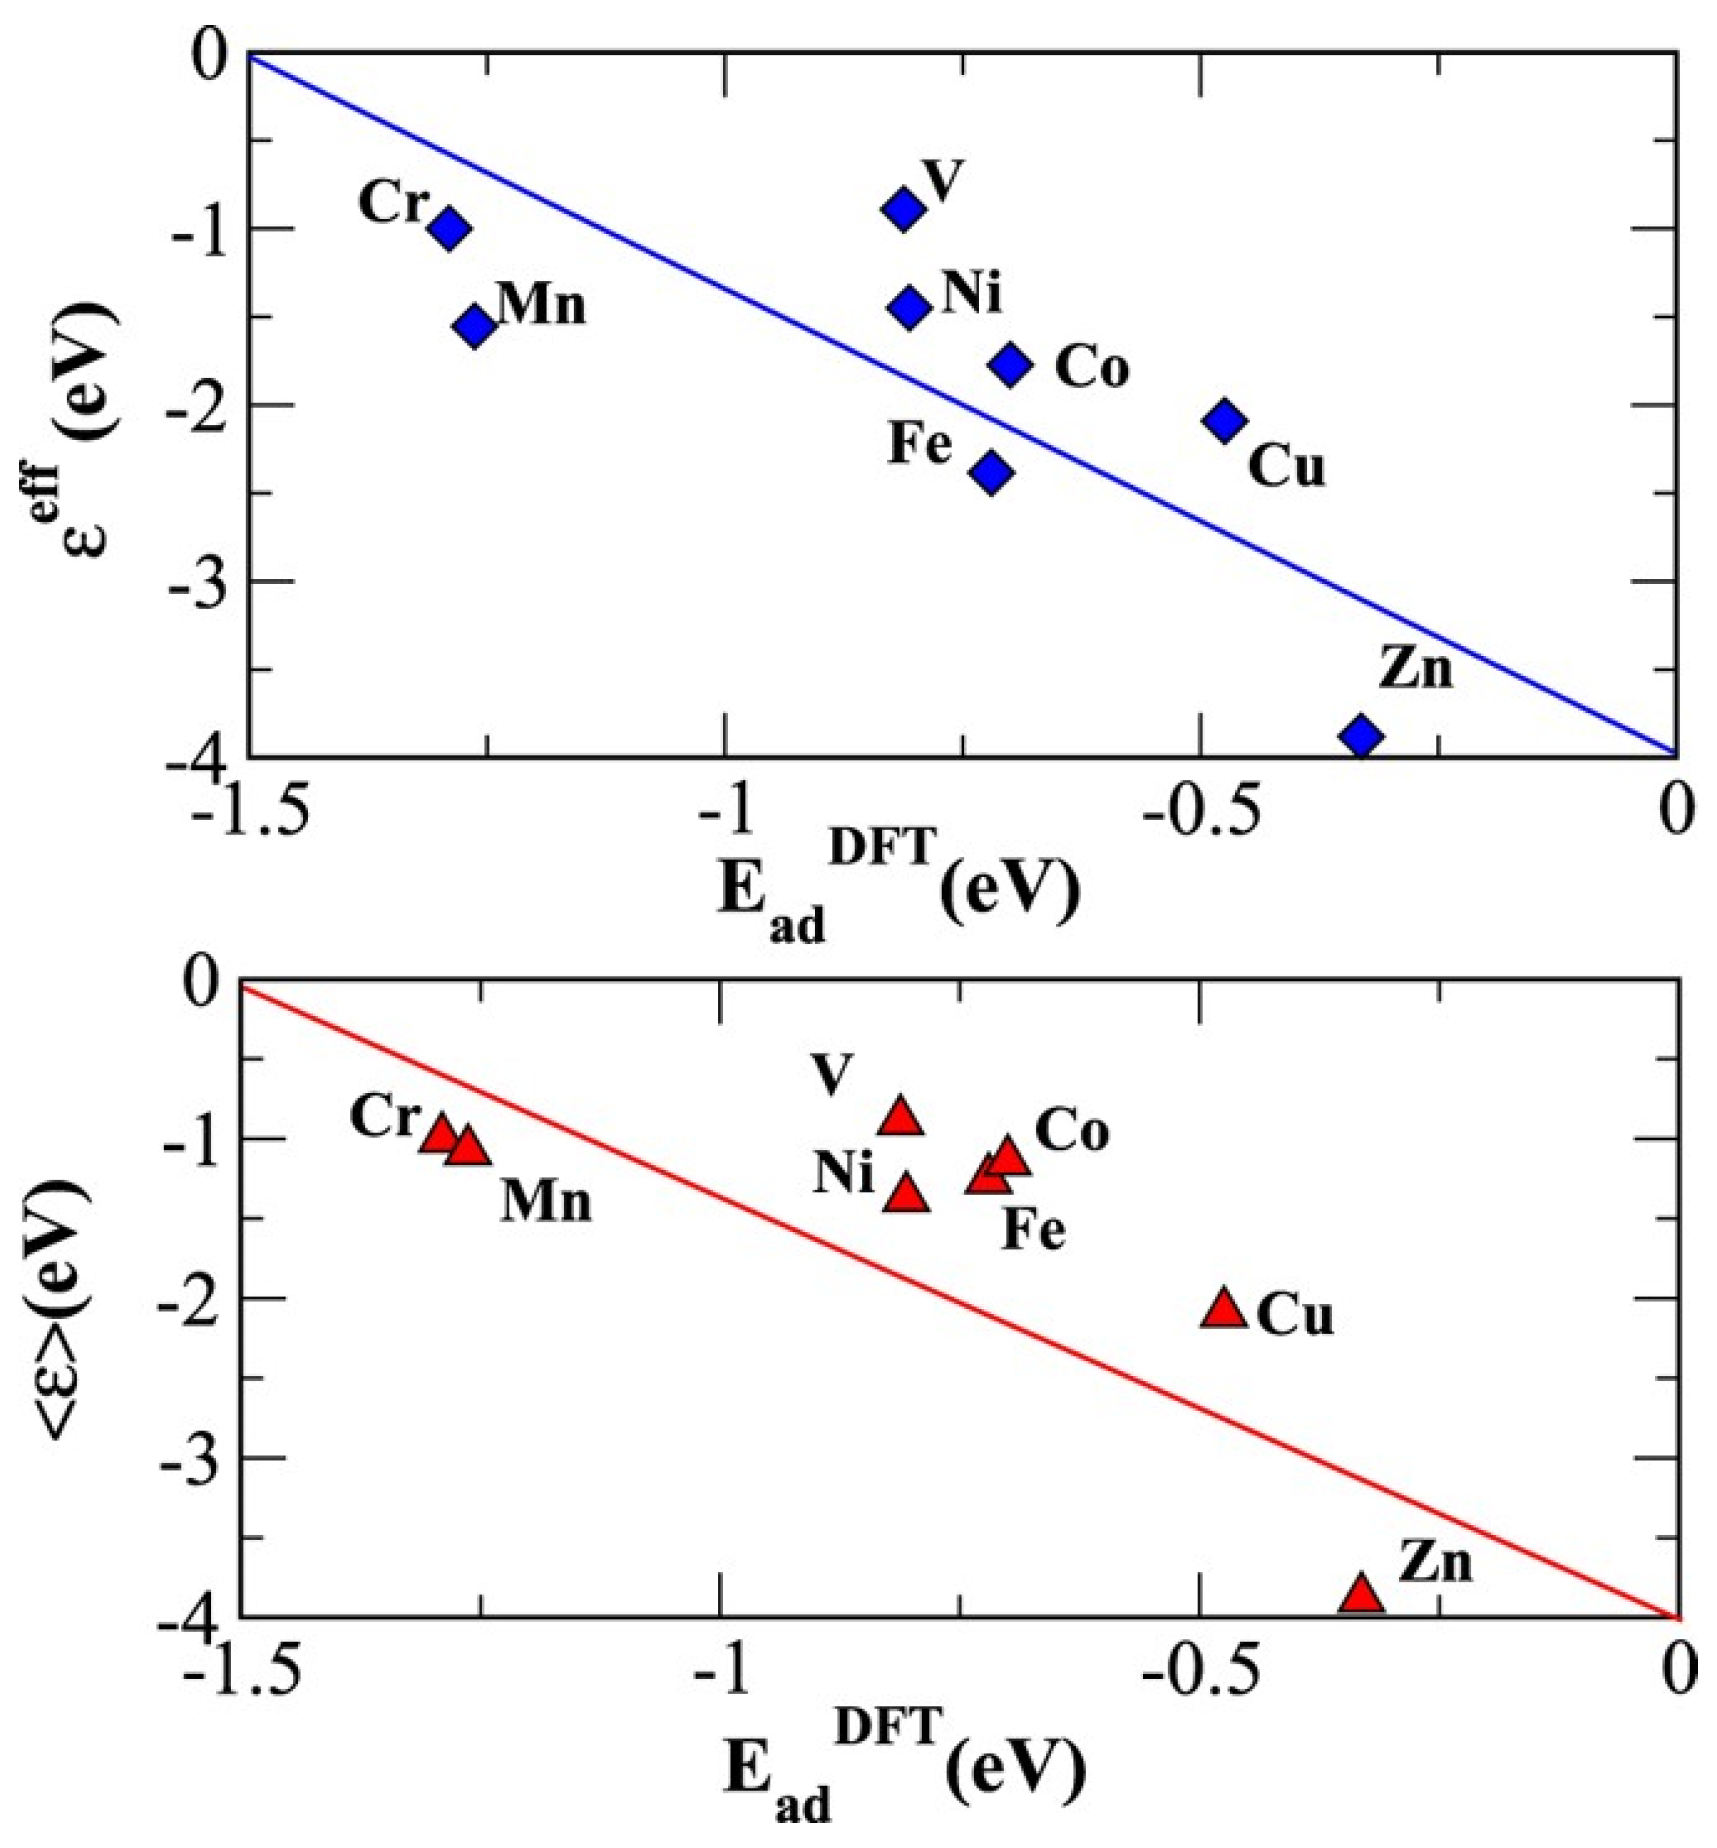
4. Energetic and Structural Models of the ORR/OER and Its Reactants

Understanding the behaviour of solid catalysts which contain d-block transition metals requires an analysis of the outer shell d-electrons which both carry the magnetic moment of the material and form chemical bonds within the catalyst. In most catalytic processes, the operation and life cycle of the catalyst are reliant on the breaking and formation of chemical bonds, meaning that electrons which carry the moment of the material are dynamically changing during the operation of the catalyst. It is therefore highly appropriate to consider the magnetic character of the material throughout its operation as well as the accurate modelling of the magnetism of the alloy. In addition, an appreciation of the limitations of those models is germane.
The d-band model of adsorption [58] is a common descriptor of the interaction and bonding between small molecules and surfaces. The model approximates the d-band states participating in bonding as a single state of energy ε d . By approximating two d-states—corresponding to spins up and down—the model has been extended to magnetic systems [59].
Figure 8 shows the effect of adding a spin-polarised component to the d-band model for the case of NH3 adsorption on a series of different d-block transition metals. In this example, the effect of adding a spin-polarised term to the d-band model is to push the d-band centre to lower energy, reducing the adsorption energy.
The effects of pressure are another key part of modelling the alloy activity. Using a tight binding approach, applying tensile (compressive) stress to a d-block solid will make the d-states widen (contract) in energy. Schnur and Groß [60] then applied conservation of charge arguments to explain why there is a concurrent shift in the centre of the d-band corresponding to a change in the activity of the surface and is shown in Figure 9.
Both strain and magnetisation have been included in a more general model treatment of the d-band model which removes the single-state approximation [61,62]. In this model, the higher moments of the electronic charge are included rather than just the first moment of charge μ1 (i.e., the centre of the charge distribution). The higher moments μ2, μ3 and μ4 are the width, skewness and bimodality, respectively, and their inclusion reduces the RMS error of the model to order 10−6 eV.
These investigations have firmly established the importance of the d-states in modelling the activity of each of these catalysts. It has also been seen that though a good metric of these models is their estimate of adsorption energy, a better and more sensitive metric is the band structure, which is also more sensitive to chemical changes during adsorption. For this reason, the remainder of this section will focus on methods of estimating the electronic band structure.
The use of Pt-bearing alloys in catalysis is based on the effectiveness of these materials—that is, their high stability, activity and selectivity—during operation [63]. The cost of Pt- and noble metal catalysts is often prohibitive both to initially produce the catalyst and then to maintain it, as the material itself degrades during use. This is not surprising as it undergoes dynamic structural change during operation, effects which can be exacerbated with the conventional use of high temperatures. The concomitant loss of Pt leaves a two-fold problem—how to implement an effective dynamic restoration of the catalyst, and how to either limit the amount of Pt loss or to replenish the Pt load. Accelerated durability testing (ADT) [64] protocols are used to determine the lifetime of a catalyst. Testing protocols submit the catalysts to repeated operation cycles using different potentials, number and duration of cycles and number of start/stop events. Standardised approaches to quantifying the effects of these cycles on the catalyst performance then measure the electrochemical surface area (ECSA) or the amount of downstream product, and in situ structural characterisation using transmission electron microscopy (TEM) or X-ray photoelectron spectrometer (XPS) [65,66].
The actual mechanisms which affect catalyst performance are closely related to its shape and structure. In general, nanoparticle (NP) catalysts [67,68] change their performance due to Ostwald ripening, agglomeration, shape change and dissolution of their active component (e.g., Pt). To mediate these effects, the same active component can be used in single-atom form. Single-atom catalysts (SACs) reduce the noble atom loading of each catalyst. Their operation has been seen to be effective—for example, Pd and Pt atoms grown on MoSSe monolayers [69] have demonstrated excellent bifunctional catalytic performance towards the oxygen reduction and oxygen evolution reactions (ORR and OER, respectively). Fundamentally, SACs increase active site availability and selectivity by separating the active noble atoms on a bystander surface, and progress has been made notably using Pt/C as well as more complicated materials TM-N-C, where TM is a transition metal such as Fe, Co, Ni, Cu or Mn.
Changing the binding position of the reactants will affect their reactivity. Qualitatively, the reasons for these changes are due to the change in valence between the reactant and the host as the reactant changes position, which produces a change in the amount of valence charge that the reactant carries. There are several different mechanisms to effect these changes, and fundamental studies have tended to focus on the binding positions of oxygen and hydrogen because of their relative simplicity. The binding energy of oxygen to Pt3Ni is 3.50 eV [70] at the FCC binding position and the diffusion barrier is 0.53–0.56 eV from that site to other high symmetry sites on the surface, which is significantly greater energy than the diffusion barrier on pure Pt (0.20 eV). This demonstrates that mechanistically the oxygen atoms are more localised on the alloy surface making site change more difficult. It is, however, not impossible—PEMFC fuel cells operate at temperatures up to 394 K [63] so the thermal energy of the atoms can enable migration between sites.
A systematic Density Functional Theory (DFT) study of the binding position of H and O atoms on transition metal surfaces [71,72] has shown that the lowest-energy structure of hydrogenated Pd(100), Ir(111) and Pt(111) changes under strain. The ranges of strain used in the studies reflect the strains that Pt atoms experience when they are alloyed, of order 5–10%. Experimentally, cantilever methods can be used to strain the material by the same amount without the need for alloying. This reduces the complexity of the interaction as the substrate is a pure metal rather than an alloy, so ligand effects are removed. The effects of alloy in the second and deeper layers can still be significant; a comparative study [73] has shown that O and H tend to bind more strongly to (111)-Pt/Ni/Pt3Ni, and less strongly to (111)-Pt/Ni/PtNi3 when compared to the equivalently strained Pt(111) surface. The effect of d-orbital permeance is therefore present in these catalysts. Experimentally, applying strain can alter the magnetisation of an alloy; Fe-Ni [74] undergoes a ferromagnetic-paramagnetic transition at 54 GPa and experiences a concurrent reduction in Curie temperature. A similar effect occurred during computational studies of CeNi5 [75] where a significant strain-dependent interaction was shown to exist between the Ce 6s and the Ni 4s states. These examples show that the structure, composition and strain state of an alloy all influence activity and magnetization of the alloy. This effects of structure, composition and strain will sensitively manifest in the band structure of the material. This highlights the utility of the electronic band structure in explaining why these phenomena occur as well as identifying the energetics of these phenomena.
The effect of subsurface structure can affect the surface reactivity; cluster expansion calculations [76] have shown that the Pt3Ni(111) surfaces have substantial subsurface disorder which changes the ORR activity between surface sites by up to three orders of magnitude. Studies on Pt3Ni(111), Pt2Ni2(111) and PtNi3(111) [77] have shown that alloying Pt with Ni moves the d-band centre, increasing the reactivity of the surface towards the ORR when compared to Pt(111). These effects and the effect of surface defects have also been shown [78] to enhance the activity of CoPt, CoFePt2 and CoNiPt2 alloys towards the ORR. Consequently, knowledge of the structural state of the alloy is central to developing models of the electronic band structure of the alloy, as the energies involved in the band structure will be those that determine the catalysts’ activity.
Figure 10 shows the L12 and L10 Pt-Ni alloys considered in this manuscript that have stoichiometries Ni0.25Pt0.75, Ni0.75Pt0.25 and Ni0.50Pt0.50, respectively.
Using these structures, Table 2 summarises the lattice parameters (a and c), cohesive energies (Etot), magnetic moments (μP and μNi) and formation energies (ΔHf) of the Pt-Ni alloys considered in this manuscript.
Table 3 shows the surface energies of the pure Pt ai metals, and demonstrates that there is good agreement in the quantity across force-field (modified embedded atom method, MEAM), first principles and experimental estimates of these quantities. The surface energy of both metals is quite close but the lattice constants—which were presented in Table 2—are notably different. One consequence of this is that segregating Pt atoms to the surface reduces strain energy in the crystal without significantly altering the surface energy. This effect is seen experimentally where nanoparticles of these materials tend to form core-shell structures with the bulk alloy covered with a pure Pt surface.
The d-band centre shows more variation and is summarised in Table 4. The position of the centre for alloyed surfaces is more difficult to predict based on the values for the clean surfaces. For example, clean Pt(111) and Ni(111) were initially estimated to have d-band centres at −2.42 and −1.59 eV, respectively [85]. These estimates were obtained using DFT.
Table 4 demonstrates that DFT estimates of the clean surface centres are significantly in error when compared to the experimental values. The table demonstrates that simple averaging of the d-band centres is insufficient to provide an estimate of the alloy quantities. These two observations underline the importance of developing the computational models used for predicting this quantity.
Surprisingly, there is no current consensus over the structural phase diagram for bulk Pt-Ni alloys. The structural paradigm is inherently complex—the alloy can take different forms as the composition changes, and the phases that form are dependent on temperature and pressure, and they can have short- or long-range order. Generally, substitutional alloys of the form AxB1−x can become disordered at elevated temperatures and then order as the temperature is lowered. Though Bloch’s theorem starts to break down for more disordered cases [86], an effective band structure is still plausible [87,88], which uses a large supercell approach to model the band structure. This review will focus on the low-temperature, ordered phases as a way of simplifying the problem; using the smaller unit cells allows greater computational expense because of the reduction of the number of atoms in the unit cell. This means that higher levels of approximation and computationally more exact models can be used. These models will be presented in the next section.
The Ni1−xPtx phase diagram [89] has recently been reinvestigated experimentally using X-ray diffraction (XRD) [90]. The proposed Ni-Pt phase diagram is shown in Figure 11, and the temperature range of the phase diagram was extended to 0 K by extrapolation [91]. The phase diagram shows the expected disordered Ni1−xPtx alloy at higher temperatures. This phase has the form of an FCC substitutional solid solution across all stoichiometries. The ordered Ni3Pt and NiPt3 phases have an AuCu3-type structure (L12) and are separated by a NiPt phase with an AuCu-type structure (L10). The phase diagram shown in Figure 11 extends the more established diagram of Cadeville et al. [92,93] though it no longer shows the NiPt3 phase schematically which was a limitation of the previous work.
The phase diagram also shows a pair of reaction sequences associated with the regions of three-phase equilibrium and are a peritectoid (NiPt + Ni1−xPtx → NiPt3) [90] and a eutectoid reaction (NiPt + NiPt3 → Ni1−xPtx) [92]. This compares to some other alloys in the same family, for example, Pt-Rh, which only shows peritectic behaviour. The significance that the Ni-Pt alloys have—potentially—both eutectoid and peritectoid processes is significant as the presence of these properties does potentially affect the mechanical, thermal and electrical properties of the alloy. These reactions contribute to the complexity of the Ni–Pt phase diagram. The reason for this is because of the complexity that they add to the ordering reactions and the effect that this complexity has on the thermodynamic modelling of the phase diagram [94]. However, despite this complexity, some of the most recent publications in the field [95] have demonstrated how chemical ordering can be achieved on Pt-Ni nano-facets enabling the practical use—if not complete characterisation—of the material as an effective catalyst.

5. Summary and Future Directions

This review has surveyed catalysts for the oxygen reduction and oxygen evolution reactions (ORR and OER, respectively) with a focus on the computational aspects of these materials, specifically on the estimation of their band structure and the influence of this structure on the reactivity of these materials.
Pt-based alloys are the most effective catalysts towards the ORR/OER. Fundamental models of their reactivity have shown that their band gaps tend to increase as the level of approximation used in the estimation of their electronic band structures is improved, and the bare electrons are replaced by their quasiparticle equivalents. The effects of this increase in band gap, as well as a more complete survey at the DFT and post-DFT level, remains an open question. Much of the modelling of this type of reaction is at the force-field or molecular dynamics level which can accommodate the moderations to oxygen binding energy which the quasiparticle models require, but the force-field models themselves cannot predict them or more esoteric mechanisms accompanying movements in energy of the reactive bands with respect to the Fermi level at the surface of the catalyst.
Future research directions have been suggested in the manuscript. Throughout the review, the interplay between the structural and electronic/mechanistic state of the surface of the catalysts has been presented. From a computational perspective, knowledge of the ion core locations in a reacting system is particularly necessary when doing quasiparticle modelling because of the effect of the locations of the ion cores on the band structure predictions. This is a more acute problem than with the DFT and force-field calculations and it is computationally impractical to generate QP data sets over an exhaustive phase space as well as impossible to draw definitive conclusions from that type of survey.
The computational and experimental expense of establishing a clear structural model of each is potentially with reward, as even with the few existing examples of successful QP modelling that are currently in the literature, it is becoming clear that the effect on the reactivity of the computational system is more aligned with that of the experimental system supporting the predictive ideal of these computational models.

Funding

This research received no external funding.

Data Availability Statement

No new data were created or analysed in this study. Data sharing is not applicable to this article.

Conflicts of Interest

The author declares no conflicts of interest.

References

  1. Lim, C.; Fairhurst, A.R.; Ransom, B.J.; Haering, D.; Stamenkovic, V.R. Role of Transition Metals in Pt Alloy Catalysts for the Oxygen Reduction Reaction. ACS Catal. 2023, 13, 14874–14893. [Google Scholar] [CrossRef] [PubMed]
  2. Stamenkovic, V.R.; Fowler, B.; Mun, B.S.; Wang, G.; Ross, P.N.; Lucas, C.A.; Marković, N.M. Improved Oxygen Reduction Activity on Pt3Ni(111) via Increased Surface Site Availability. Science 2007, 315, 493–497. [Google Scholar] [CrossRef] [PubMed]
  3. Stamenkovic, V.R.; Mun, S.B.; Arenz, M.; Mayrhofer, K.J.J.; Lucas, C.A.; Wang, G.; Ross, P.N.; Markovic, N.M. Trends in electrocatalysis on extended and nanoscale Pt-bimetallic alloy surfaces. Nat. Mater. 2007, 6, 241–247. [Google Scholar] [CrossRef] [PubMed]
  4. Shuttleworth, I.G. The Catalytic Activity of Magnetic Surfaces. Magnetochemistry 2024, 10, 40. [Google Scholar] [CrossRef]
  5. Biz, C.; Gracia, J.; Fianchini, M. Experimental Evidences on Magnetism-Covalent Bonding Interplay in Structural Properties of Solids and during Chemisorption. Int. J. Mol. Sci. 2024, 25, 1793. [Google Scholar] [CrossRef]
  6. Alaswad, A.; Omran, A.; Sodre, J.R.; Wilberforce, T.; Pignatelli, G.; Dassisti, M.; Baroutaji, A.; Olabi, A.G. Technical and Commercial Challenges of Proton-Exchange Membrane (PEM) Fuel Cells. Energies 2021, 14, 144. [Google Scholar] [CrossRef]
  7. Cullen, D.A.; Neyerlin, K.C.; Ahluwalia, R.K.; Mukundan, R.; More, K.L.; Borup, R.L.; Weber, A.Z.; Myers, D.J.; Kusoglu, A. New roads and challenges for fuel cells in heavy-duty transportation. Nat. Energy 2021, 6, 462–474. [Google Scholar] [CrossRef]
  8. Wang, X.X.; Swihart, M.T.; Wu, G. Achievements, challenges and perspectives on cathode catalysts in proton exchange membrane fuel cells for transportation. Nat. Catal. 2019, 2, 578–589. [Google Scholar] [CrossRef]
  9. Grigoriev, S.A.; Fateev, V.N.; Bessarabov, D.G.; Millet, P. Current status, research trends, and challenges in water electrolysis science and technology. Int. J. Hydrog. Energy 2020, 45, 26036–26058. [Google Scholar] [CrossRef]
  10. Santos, R.M.D.; Ornelas, I.; Dias, A.C.; Lima, M.P.; Da Silva, J.L.F. Theoretical Investigation of the Role of Mixed A+ Cations in the Structure, Stability, and Electronic Properties of Perovskite Alloys. ACS Appl. Energy Mater. 2023, 6, 5259–5273. [Google Scholar] [CrossRef]
  11. Noman, M.; Khan, Z.; Jan, S.T. A comprehensive review on the advancements and challenges in perovskite solar cell technology. RSC Adv. 2024, 14, 5085–5131. [Google Scholar] [CrossRef] [PubMed]
  12. Afre, R.A.; Pugliese, D. Perovskite Solar Cells: A Review of the Latest Advances in Materials, Fabrication Techniques, and Stability Enhancement Strategies. Micromachines 2024, 15, 192. [Google Scholar] [CrossRef] [PubMed]
  13. Kumari, P.; Gupta, A.K.; Mishra, R.K.; Ahmad, M.S.; Shahi, R.R. A Comprehensive Review: Recent Progress on Magnetic High Entropy Alloys and Oxides. J. Magn. Magn. Mater. 2022, 554, 169142. [Google Scholar] [CrossRef]
  14. George, E.P.; Raabe, D.; Ritchie, R.O. High-entropy alloys. Nat. Rev. Mater. 2019, 4, 515–534. [Google Scholar] [CrossRef]
  15. Miracle, D.B.; Senkov, O.N. A critical review of high entropy alloys and related concepts. Acta Mater. 2017, 122, 448–511. [Google Scholar] [CrossRef]
  16. Zhang, D.; Hou, Z.; Mi, W. Progress in magnetic alloys with kagome structure: Materials, fabrications and physical properties. J. Mater. Chem. C 2022, 10, 7748–7770. [Google Scholar] [CrossRef]
  17. Staunton, J.B.; Razee, S.S.A.; Ling, M.F.; Johnson, D.D.; Pinski, F.J. Magnetic alloys, their electronic structure and micromagnetic and microstructural models. J. Phys. D Appl. Phys. 1998, 31, 2355. [Google Scholar] [CrossRef]
  18. Thonhauser, T. Theory of Orbital Magnetization in Solids. Int. J. Mod. Phys. B 2011, 25, 1429–1458. [Google Scholar] [CrossRef]
  19. Kakehashi, Y. Modern Theory of Magnetism in Metals and Alloys; Springer Series in Solid-State Sciences 175; Springer: Berlin/Heidelberg, Germany, 2013; ISBN 9783642334009. [Google Scholar]
  20. Wang, C.; Li, D.; Chi, M.; Pearson, J.; Rankin, R.B.; Greeley, J.; Duan, Z.; Wang, G.; van der Vliet, D.; More, K.L.; et al. Rational Development of Ternary Alloy Electrocatalysts. J. Phys. Chem. Lett. 2012, 3, 1668–1673. [Google Scholar] [CrossRef]
  21. Perdew, J.P.; Schmidt, K. Jacob’s ladder of density functional approximations for the exchange-correlation energy. AIP Conf. Proc. 2001, 577, 1–20. [Google Scholar] [CrossRef]
  22. Borlido, P.; Schmidt, J.; Huran, A.W.; Tran, F.; Marques, M.A.L.; Botti, S. Exchange-correlation functionals for band gaps of solids: Benchmark, reparametrization and machine learning. NPJ Comput. Mater. 2020, 6, 96. [Google Scholar] [CrossRef]
  23. Aulbur, W.G.; Jönsson, L.; Wilkins, J.W. Quasiparticle calculations in solids. In Solid State Physics; Academic Press: San Diego, CA, USA, 2000; Volume 54, pp. 1–218. [Google Scholar] [CrossRef]
  24. Onida, G.; Reining, L.; Rubio, A. Electronic excitations: Density-functional versus many-body Green’s-function approaches. Rev. Mod. Phys. 2002, 74, 601–659. [Google Scholar] [CrossRef]
  25. López, N.; Reichertz, L.A.; Yu, K.M.; Campman, K.; Walukiewicz, W. Engineering the Electronic Band Structure for Multiband Solar Cells. Phys. Rev. Lett. 2011, 106, 028701. [Google Scholar] [CrossRef]
  26. Curély, J. The Microscopic Mechanisms Involved in Superexchange. Magnetochemistry 2022, 8, 6. [Google Scholar] [CrossRef]
  27. Marini, A.; Hogan, C.; Grüning, M.; Varsano, D. Yambo: An ab initio tool for excited state calculations. Comput. Phys. Commun. 2009, 180, 1392–1403. [Google Scholar] [CrossRef]
  28. Sangalli, D.; Ferretti, A.; Miranda, H.; Attaccalite, C.; Marri, I.; Cannuccia, E.; Melo, P.; Marsili, M.; Paleari, F.; Marrazzo, A.; et al. Many-body perturbation theory calculations using the yambo code. J. Phys. Condens. Matter 2019, 31, 325902. [Google Scholar] [CrossRef]
  29. Giannozzi, P.; Andreussi, O.; Brumme, T.; Bunau, O.; Nardelli, M.B.; Calandra, M.; Car, R.; Cavazzoni, C.; Ceresoli, D.; Cococcioni, M.; et al. Advanced capabilities for materials modelling with Quantum ESPRESSO. J. Phys. Condens. Matter 2017, 29, 465901. [Google Scholar] [CrossRef]
  30. Deslippe, J.; Samsonidze, G.; Strubbe, D.A.; Jain, M.; Cohen, M.L.; Louie, S.G. BerkeleyGW: A massively parallel computer package for the calculation of the quasiparticle and optical properties of materials and nanostructures. Comput. Phys. Commun. 2012, 183, 1269–1289. [Google Scholar] [CrossRef]
  31. Gonze, X.; Amadon, B.; Anglade, P.-M.; Beuken, J.-M.; Bottin, F.; Boulanger, P.; Bruneval, F.; Caliste, D.; Caracas, R.; Côté, M.; et al. ABINIT: First-principles approach to material and nanosystem properties. Comput. Phys. Commun. 2009, 180, 2582–2615. [Google Scholar] [CrossRef]
  32. Klein, M.; Nuber, A.; Schwab, H.; Albers, C.; Tobita, N.; Higashiguchi, M.; Jiang, J.; Fukuda, S.; Tanaka, K.; Shimada, K.; et al. Coherent Heavy Quasiparticles in a CePt5 Surface Alloy. Phys. Rev. Lett. 2011, 106, 186407. [Google Scholar] [CrossRef]
  33. Fujimori, S. Band structures of 4f and 5f materials studied by angle-resolved photoelectron spectroscopy. J. Phys. Condens. Mat. 2016, 28, 153002. [Google Scholar] [CrossRef]
  34. Goremychkin, E.A.; Park, H.; Osborn, R.; Rosenkranz, S.; Castellan, J.-P.; Fanelli, V.R.; Christianson, A.D.; Stone, M.B.; Bauer, E.D.; McClellan, K.J.; et al. Coherent band excitations in CePd3: A comparison of neutron scattering and ab initio theory. Science 2018, 359, 186–191. [Google Scholar] [CrossRef]
  35. Koitzsch, A.; Kim, T.K.; Treske, U.; Knupfer, M.; Büchner, B.; Richter, M.; Opahle, I.; Follath, R.; Bauer, E.D.; Sarrao, J.L. Band-dependent emergence of heavy quasiparticles in CeCoIn5. Phys. Rev. B 2013, 88, 035124. [Google Scholar] [CrossRef]
  36. Iizuka, T.; Mizuno, T.; Min, B.H.; Kwon, Y.S.; Kimura, S. Existence of Heavy Fermions in the Antiferromagnetic Phase of CeIn3. J. Phys. Soc. Jpn. 2012, 81, 043703. [Google Scholar] [CrossRef]
  37. Zhang, Y.; Feng, W.; Lou, X.; Yu, T.; Zhu, X.; Tan, S.; Yuan, B.; Liu, Y.; Lu, H.; Xie, D.; et al. Direct observation of heavy quasiparticles in the Kondo-lattice compound CeIn3. Phys. Rev. B 2018, 97, 045128. [Google Scholar] [CrossRef]
  38. Ochi, M.; Arita, R.; Matsumoto, M.; Kino, H.; Miyake, T. Robust flat bands in R Co5 (R = rare earth) compounds. Phys. Rev. B 2015, 91, 165137. [Google Scholar] [CrossRef]
  39. Spencer, J.A.; Mock, A.L.; Jacobs, A.G.; Schubert, M.; Zhang, Y.; Tadjer, M.J. A review of band structure and material properties of transparent conducting and semiconducting oxides: Ga2O3, Al2O3, In2O3, ZnO, SnO2, CdO, NiO, CuO, and Sc2O3. Appl. Phys. Rev. 2022, 9, 011315. [Google Scholar] [CrossRef]
  40. Pearton, S.J.; Yang, J.; Cary, P.H., IV; Ren, F.; Kim, J.; Tadjer, M.J.; Mastro, M.A. A review of Ga2O3 materials, processing, and devices. Appl. Phys. Rev. 2018, 5, 011301. [Google Scholar] [CrossRef]
  41. Playford, H.Y.; Hannon, A.C.; Barney, E.R.; Walton, R.I. Structures of Uncharacterized Polymorphs of Gallium Oxide from Total Neutron Diffraction. Chem. Eur. J. 2013, 19, 2803–2813. [Google Scholar] [CrossRef]
  42. Binet, L.; Gourier, D. Origin of the blue luminescence of β-Ga2O3. J. Phys. Chem. Solids 1998, 59, 1241–1249. [Google Scholar] [CrossRef]
  43. Desgreniers, S. High-density phases of ZnO: Structural and compressive parameters. Phys. Rev. B 1998, 58, 14102. [Google Scholar] [CrossRef]
  44. Ni, H.Q.; Lu, Y.F.; Ren, Z.M. Quasiparticle band structures of wurtzite and rock-salt ZnO. J. Appl. Phys.  2002, 91, 1339–1343. [Google Scholar] [CrossRef]
  45. Ataide, C.A.; Pelá, R.R.; Marques, M.; Teles, L.K.; Furthmüller, J.; Bechstedt, F. Fast and accurate approximate quasiparticle band structure calculations of ZnO, CdO, and MgO polymorphs. Phys. Rev. B 2017, 95, 045126. [Google Scholar] [CrossRef]
  46. Jaffe, J.E.; Pandey, R.; Kunz, A.B. Kunz Electronic structure of the rocksalt-structure semiconductors ZnO and CdO. Phys. Rev. B 1991, 43, 14030. [Google Scholar] [CrossRef]
  47. Sans, J.; Segura, A.; Manjón, F.; Marí, B.; Muñoz, A.; Herrera-Cabrera, M. Optical properties of wurtzite and rock-salt ZnO under pressure. Microelectron. J.  2005, 36, 928–932. [Google Scholar] [CrossRef]
  48. Nahm, T.-U.; Noh, J.; Kim, J.-Y.; Oh, S.-J. Electron spectroscopic evidence of electron correlation in Ni-Pt alloys: Comparison with specific heat measurement. J. Phys. Condens. Mat. 2003, 15, 3191. [Google Scholar] [CrossRef]
  49. Kumar, U.; Mukhopadhyay, P.K.; Sanyal, B.; Eriksson, O.; Nordblad, P.; Paudyal, D.; Tarafder, K.; Mookerjee, A. Experimental and theoretical study of annealed Ni-Pt alloys. Phys. Rev. B 2006, 74, 064401. [Google Scholar] [CrossRef]
  50. Pinski, F.J.; Ginatempo, B.; Johnson, D.D.; Staunton, J.B.; Stocks, G.M.; Gyorffy, B.L. Origins of compositional order in NiPt alloys. Phys. Rev. Lett. 1991, 66, 766. [Google Scholar] [CrossRef]
  51. Staunton, J.; Weinberger, P.; Gyorffy, B.L. On the electronic structure of paramagnetic NicPt1-c alloys: A relativistic calculation. J. Phys. F Met. Phys. 1983, 13, 779. [Google Scholar] [CrossRef]
  52. Shuttleworth, I.G. The magnetic band-structures of ordered PtxFe1−x, PtxCo1−x, and PtxNi1−x (x = 0.25, 0.50, and 0.75). Magnetochemistry 2020, 6, 61. [Google Scholar] [CrossRef]
  53. Aledealat, K.; Aladerah, B.; Obeidat, A. Study of structural, electronic, and magnetic properties of L10-ordered CoPt and NiPt: An ab initio calculations and Monte Carlo simulation. Solid. State Commun. 2023, 363, 115112. [Google Scholar] [CrossRef]
  54. Shuttleworth, I.G. The effects of strain on the ordered phases of NixPt1−x (x = 0.25, 0.5, and 0.75). Chem. Phys. Lett. 2017, 689, 41–47. [Google Scholar] [CrossRef]
  55. Shuttleworth, I.G. Magnetism in the strained ordered phases of PtxFe1−x and PtxCo1−x. (x = 0.25, 0.5, and 0.75). J. Phys. Chem. Solids 2018, 114, 153–162. [Google Scholar] [CrossRef]
  56. Pisanty, A.; Amador, C.; Ruiz, Y.; de la Vega, M. Band structures of Ni3Pt and NiPt3. Z. Phys. B Condens. Matter 1990, 80, 237–239. [Google Scholar] [CrossRef]
  57. Shuttleworth, I.G. The quasiparticle band structures of ordered NixPt1−x (x = 0.25, 0.5, and 0.75). Heliyon 2018, 4, e01000. [Google Scholar] [CrossRef]
  58. Hammer, B.; Nørskov, J.K. Electronic factors determining the reactivity of metal surfaces. Surf. Sci. 1995, 343, 211–220. [Google Scholar] [CrossRef]
  59. Bhattacharjee, S.; Waghmare, U.V.; Lee, S.-C. An improved d-band model of the catalytic activity of magnetic transition metal surfaces. Sci. Rep. 2016, 6, 35916. [Google Scholar] [CrossRef]
  60. Schnur, S.; Groß, A. Strain and coordination effects in the adsorption properties of early transition metals: A density-functional theory study. Phys. Rev. B 2010, 81, 033402. [Google Scholar] [CrossRef]
  61. Shuttleworth, I.G. Non-linear moments modelling of metal, oxygen and hydrogen binding to strained FCC (111) and (100) surfaces. Chem. Phys. Lett. 2023, 813, 140310. [Google Scholar] [CrossRef]
  62. Shuttleworth, I.G. Moments analysis of the binding of metal, oxygen and hydrogen atoms to strained Co(0001), Ru(0001) and Os(0001). Chem. Phys. 2023, 566, 111788. [Google Scholar] [CrossRef]
  63. Biz, C.; Gracia, J.; Fianchini, M. Review on Magnetism in Catalysis: From Theory to PEMFC Applications of 3d Metal Pt-Based Alloys. Int. J. Mol. Sci. 2022, 23, 14768. [Google Scholar] [CrossRef] [PubMed]
  64. Moguchikh, E.; Paperzh, K.; Pankov, I.; Belenov, S.; Alekseenko, A. Durability of Commercial Catalysts within Relevant Stress Testing Protocols. Catalysts 2023, 13, 923. [Google Scholar] [CrossRef]
  65. Zlatar, M.; Escalera-López, D.; Rodríguez, M.G.; Hrbek, T.; Götz, C.; Joy, R.M.; Savan, A.; Tran, H.P.; Nong, H.N.; Pobedinskas, P.; et al. Standardizing OER Electrocatalyst Benchmarking in Aqueous Electrolytes: Comprehensive Guidelines for Accelerated Stress Tests and Backing Electrodes. ACS Catal. 2023, 13, 15375–15392. [Google Scholar] [CrossRef]
  66. Zhang, Y.; Chen, S.; Wang, Y.; Ding, W.; Wu, R.; Li, L.; Qi, X.; Wei, Z. Study of the degradation mechanisms of carbon-supported platinum fuel cells catalyst via different accelerated stress test. J. Power Sources 2015, 273, 62–69. [Google Scholar] [CrossRef]
  67. Yang, X.; Lin, L.; Guo, X.; Zhang, S. Design of Multifunctional Electrocatalysts for ORR/OER/HER/HOR: Janus Makes Difference. Small 2024, 20, e2404000. [Google Scholar] [CrossRef]
  68. Sun, T.; Zang, W.; Sun, J.; Li, C.; Fan, J.; Liu, E.; Wang, J. SACs on Non-Carbon Substrates: Can They Outperform for Water Splitting? Adv. Funct. Mater. 2023, 33, 2301526. [Google Scholar] [CrossRef]
  69. Guo, J.-X.; Wu, S.-Y.; Zhang, G.-J.; Yan, L.; Hu, J.-G.; Li, X.-Y. Single noble metals (Pd, Pt and Ir) anchored Janus MoSSe monolayers: Efficient oxygen reduction/evolution reaction bifunctional electrocatalysts and harmful gas detectors. J. Colloid. Interf. Sci. 2022, 616, 177–188. [Google Scholar] [CrossRef]
  70. Jacob, T.; Goddard, W.A., III. Adsorption of atomic H and O on the (111) surface of Pt3Ni alloys. J. Phys. Chem. B 2004, 108, 8311–8323. [Google Scholar] [CrossRef]
  71. Shuttleworth, I.G. Strain engineering of H/transition metal systems. Surf. Sci. 2017, 661, 49–59. [Google Scholar] [CrossRef]
  72. Shuttleworth, I.G. Controlled FCC/on-top binding of H/Pt(111) using surface stress. App Surf. Sci. 2016, 378, 286–292. [Google Scholar] [CrossRef]
  73. Shuttleworth, I.G. A comparative study of oxygen and hydrogen adsorption on strained and alloy-supported Pt(111) monolayers. Magnetochemistry 2021, 7, 101. [Google Scholar] [CrossRef]
  74. Aladerah, B.; Obeidat, A. Pressure-dependent magnetic properties of FeNi alloy: Theoretical study. Solid. State Sci. 2024, 148, 107437. [Google Scholar] [CrossRef]
  75. Shuttleworth, I.G. Strain engineering of the CeNi5 system. Magnetochemistry 2016, 2, 39. [Google Scholar] [CrossRef]
  76. Cao, L.; Mueller, T. Rational Design of Pt3Ni Surface Structures for the Oxygen Reduction Reaction. J. Phys. Chem. C 2015, 119, 17735–17747. [Google Scholar] [CrossRef]
  77. Zhao, L.; Liu, H.; Liu, Y.; Han, X.; Xu, J.; Xing, W.; Guo, W. Mechanistic Insights into the Hydrogen Oxidation Reaction on PtNi Alloys in Alkaline Media: A First-Principles Investigation. ACS Appl. Mater. Interfaces 2020, 12, 40248–40260. [Google Scholar] [CrossRef] [PubMed]
  78. Aledealat, K.; Aladerah, B.; Obeidat, A.; Rawashdeh, A.-M.M. Enhancing the performance of rare-earth free permanent magnets: A computational study of nitrogen and oxygen defects in CoPt, CoFePt2, and CoNiPt2 alloys. J. Phys. Chem. Solids 2023, 183, 111649. [Google Scholar] [CrossRef]
  79. Hizi, A.; Garbouj, H.; Mottet, C.; Said, M. Chemical ordering and surface segregation in Ni1-cPtc system: A theoretical study from the alloys to the nanoalloys. Results Phys. 2019, 14, 102493. [Google Scholar] [CrossRef]
  80. Amador, C.; Lambrecht, W.R.L.; van Schilfgaarde, M.; Segall, B. Internal strain effects on the phase diagram of Ni-Pt alloys. Phys. Rev. B 1993, 47, 15276. [Google Scholar] [CrossRef]
  81. Wang, G.; Van Hove, M.A.; Ross, P.N.; Baskes, M.I. Quantitative prediction of surface segregation in bimetallic Pt-M alloy nanoparticles (M = Ni, Re, Mo). Prog. Surf. Sci. 2005, 79, 28–45. [Google Scholar] [CrossRef]
  82. Vitos, L.; Ruban, A.V.; Skriver, H.L.; Kollár, J. The surface energy of metals. Surf. Sci. 1998, 411, 186. [Google Scholar] [CrossRef]
  83. Tyson, W.R.; Miller, W.A. Surface free energies of solid metals: Estimation from liquid surface tension measurements. Surf. Sci. 1977, 62, 267. [Google Scholar] [CrossRef]
  84. de Boer, F.R.; Room, R.; Mattens, W.C.; Miedema, A.R.; Niessen, A.K. Cohesion in Metals. Transition Metal Alloys; North Holland: Amsterdam, The Netherlands, 1988. [Google Scholar]
  85. Vojvodic, A.; Nørskov, J.K.; Abild-Pedersen, F. Electronic Structure Effects in Transition Metal Surface Chemistry. Top. Catal. 2014, 57, 25–32. [Google Scholar] [CrossRef]
  86. Ehrenreich, H.; Schwartz, L.M. The Electronic Structure of Alloys. Solid. State Phys. 1976, 31, 149–286. [Google Scholar] [CrossRef]
  87. Popescu, V.; Zunger, A. Effective Band Structure of Random Alloys. Phys. Rev. Lett. 2010, 104, 236403. [Google Scholar] [CrossRef] [PubMed]
  88. Popescu, V.; Zunger, A. Extracting E versus k effective band structure from supercell calculations on alloys and impurities. Phys. Rev. B 2012, 85, 085201. [Google Scholar] [CrossRef]
  89. Massalski, T.B.; Okamoto, H.; Subramanian, P.R.; Kacprzak, L. (Eds.) Binary Alloy Phase Diagrams, 2nd ed.; ASM International: Materials Park, Ohio, USA, 1990; p. 2844. [Google Scholar] [CrossRef]
  90. Popov, A.A.; Varygin, A.D.; Plyusnin, P.E.; Sharafutdinov, M.R.; Korenev, S.V.; Serkova, A.N.; Shubin, Y.V. X-ray diffraction reinvestigation of the Ni-Pt phase diagram. J. Alloy Compd. 2022, 891, 161974. [Google Scholar] [CrossRef]
  91. Fedorov, P.P.; Popov, A.A.; Shubin, Y.V.; Chernova, E.V. Phase Diagram of the Nickel—Platinum System. Russ. J. Inorg. Chem. 2022, 67, 2018–2022. [Google Scholar] [CrossRef]
  92. Cadeville, M.; Dahmani, C.; Kern, F. Magnetism and spatial order in Ni-Pt and Co-Pt alloys. Magn. Magn. Mater. 1986, 54–57, 1055–1056. [Google Scholar] [CrossRef]
  93. Cadeville, M.C.; Morán-López, J.L. Magnetism and spatial order in transition metal alloys: Experimental and theoretical aspects. Phys. Rep. 1987, 153, 331–399. [Google Scholar] [CrossRef]
  94. Lu, X.-G.; Sundman, B.; Ågren, J. Thermodynamic assessments of the Ni-Pt and Al-Ni-Pt systems. Calphad 2009, 33, 450–456. [Google Scholar] [CrossRef]
  95. Camilos, P.; Varvenne, C.; Mottet, C. Size and shape effects on chemical ordering in Ni-Pt nanoalloys. Phys. Chem. Chem. Phys. 2024, 26, 15192–15204. [Google Scholar] [CrossRef] [PubMed]
Figure 1. Diagram summarising the strain and ligand effects during the oxygen reduction reaction (ORR) on clean Pt and Pt alloys. Reprinted with permission from [1].
Oxygen 04 00028 g001
Figure 2. Graph showing the catalytic performance versus oxygen binding energy for a selection of bi- and tri-metallic Pt-based catalysts. Reprinted with permission from [20], 2012, American Chemical Society.
Oxygen 04 00028 g002
Figure 3. Time evolution luminescence spectrum of an as-grown β-Ga2O3 single crystal at room temperature after a laser pulse at 4.67 eV. The time delay for each spectrum is (a) t = 0.5 μs, (b) t = 0.75 μs, (c) t = 1 μs, (d) t = 2 μs, (e) t = 5 μs, (f) t = 7 μs, (g) t = 10 μs, (h) t = 20 μs and (i) t = 50 μs. Reprinted with permission from [42].
Oxygen 04 00028 g003
Figure 4. Schematic diagram showing how the computational band gap estimates for ZnO and CdO vary with different levels of approximation. (a) shows the unshielded Local Density Approximation (LDA) prediction, with (b,c) showing the predictions with increasing levels of approximation. ‘CB’ and ‘VB’ denote the conduction band and valence band, respectively, and ‘QP’ denotes quasi-particle. Reprinted with permission from [45].
Oxygen 04 00028 g004
Figure 5. Comparison of the experimental ARPES (black squares) and the LDA+A−1/2 computational band structure taken from wurtzite ZnO. Reprinted with permission from [45].
Oxygen 04 00028 g005
Figure 6. The spin-resolved electronic band structures of (ac) PtxFe1−x, (df) PtxCo1−x and (gi) PtxNi1−x. In (b) Pt0.50Fe0.50, (e) Pt0.50Co0.50 and (h) Pt0.50Ni0.50 the alloys have L12 structures, whereas the alloys used to generate the dispersions for the remaining alloys are L10. The legends show the amount of exchange spitting in eV, and EF denotes the Fermi energy. Reprinted with permission from [52].
Oxygen 04 00028 g006
Figure 7. Summary of the Γ point quasiparticle energies Eqp versus the unshielded electron energies Ebare for the ordered (a) Ni0.25Pt0.75, (b) Ni0.75Pt0.25 and (c) Ni0.50Pt0.50 alloys. The addition signs (‘+’) were taken directly from the electronic band structures generated using quasiparticle and DFT calculations whereas the dashed lines and diamond symbols were obtained by fitting (see text). Reprinted with permission from [57].
Oxygen 04 00028 g007
Figure 8. The upper and lower panels show the spin-polarised and spin-averaged adsorption energies— ε e f f and ε , respectively—of NH3 on various d-block transition metals. The abscissa is the corresponding spin-polarised adsorption energy estimated by DFT. Reprinted with permission from [59].
Oxygen 04 00028 g008
Figure 9. Schematic diagram showing the effects of compressive and tensile on the centre and width of the d-band. Reprinted with permission from [60].
Oxygen 04 00028 g009
Figure 10. The (a) L12 and (b) L10 Pt-Ni alloys considered in this manuscript have stoichiometries Ni0.25Pt0.75, Ni0.75Pt0.25 and Ni0.50Pt0.50, respectively. The Ni0.75Pt0.25 structure is obtained by replacing each Ni (Pt) atom in the Ni0.25Pt0.75 structure with a Pt (Ni) atom. From [57] with permission.
Oxygen 04 00028 g010
Figure 11. The proposed structural phase diagram for Ni1−xPtx. Reprinted with permission from [90].
Oxygen 04 00028 g011
Table 1. Survey of the use of solid-state catalysts during the oxygen reduction and evolution reactions (ORR/OER) and the hydrogen evolution reaction (HER) (adapted from [5] with permission).
Catalytic reactionCatalystReference
Oxygen reduction reaction (ORR)Platinum (Pt)[6]
L10 Platinum-Cobalt (PtCo)[7,8]
Hydrogen evolution reaction (HER)Platinum (Pt)[9]
Nickel-Molybdenum (Ni-Mo) alloys
Nickel (Ni), Nickel (Ni) foam
Oxygen evolution reaction (OER)Iridium dioxide (IrO2)[9]
Ruthenium dioxide (RuO2)
Cobalt nickel oxide (CoNi2O4)
Table 2. Summary of the lattice parameters (a and c), cohesive energies (Etot), magnetic moments (μP and μNi) and formation energies (ΔHf) of the Pt-Ni alloys considered in this manuscript. The source of the entries in the columns for the lattice constants a and c columns and for the formation energy are shown explicitly; the entries in the columns for the magnetic moment are from [57] and cohesive energies are from [79]. Adapted from [57,79] with permission.
a (Å)c (Å)Etot
(eV/Atom)
μPtB)μNiB)ΔHf
(eV/atom)
Ni
DFT (GGA)3.51 [79]
3.517 [61]
−5.467
Exp3.524 [61] −4.44
Pt
DFT (GGA)3.98 [79]
3.963 [61]
−6.097
Exp3.9242 [61] −5.84
NiPt3 (L12)
DFT (GGA)3.88 [79]
3.919 [57]
0.3481.284−0.068 [79]
(LDA)3.825 [57] 0.2621.043
Exp3.836 [56] −0.063 [80]
NiPt (L10)
DFT (GGA)3.84 [79]
3.922 [57]
3.644 [57] 0.3971.243−0.096 [79]
(LDA)3.812 [57]3.539 [57] 0.4181.044
Exp3.814 [56]3.533 [56] −0.096 [80]
Ni3Pt (L12)
DFT (GGA)3.66 [79]
3.752 [57]
0.1771.198−0.072 [79]
(LDA)3.604 [57] 0.3840.973
Exp3.645 [56] −0.07 [80]
Table 3. Surface energies of Pt and Ni metals were estimated using modified embedded atom methods (MEAM), first-principles calculations and compared to experimental values. The surface energies are in units of m J / m 2 . From [81] with permission.
ElementLatticeSurfaceMEAM [81]First Principles [82]Experiment
PtFCC(111)165122992489 [83]
2475 [84]
(100)21552734
(110)19632819
NiFCC(111)203920112380 [83]
2450 [84]
(100)24382426
(110)23622368
Table 4. Summary of the d-band centre for a series of pure Pt, Ni and alloyed facets determined experimentally using UPS spectra. DFT estimates of the same quantity for the Pt(111) are also shown.
FacetPt3Ni(111)Pt(111)Pt3Ni(111)Pt(100)Pt3Ni(111)Pt(110)
d-band centre (eV)−3.10−2.76 (Expt)
−2.42 (DFT, [85])
−3.14−2.90−2.70−2.54
Disclaimer/Publisher’s Note: The statements, opinions and data contained in all publications are solely those of the individual author(s) and contributor(s) and not of MDPI and/or the editor(s). MDPI and/or the editor(s) disclaim responsibility for any injury to people or property resulting from any ideas, methods, instructions or products referred to in the content.

