Article

Wind Vorticity and Upwelling along the Coast of South Africa

1
Geography Department, University Zululand, KwaDlangezwa 3886, South Africa
2
Physics Department, University Puerto Rico, Mayaguez, PR 00681, USA
Coasts 2024, 4(3), 619-637; https://doi.org/10.3390/coasts4030032
Submission received: 29 May 2024 / Revised: 13 August 2024 / Accepted: 4 September 2024 / Published: 13 September 2024

Abstract

:
Coastal upwelling that cools sea temperatures and nutrifies the euphotic layer is the focus of this research, motivated by how these processes benefit the marine ecosystem. Here, atmosphere–ocean reanalysis fields and satellite radiance data are employed to link South African coastal upwelling with nearshore winds and currents in the 2000–2021 period. Temporal behavior is quantified in three regimes—Benguela, transition, and Agulhas—to distinguish the influence of offshore transport, vertical pumping, and dynamic uplift. These three mechanisms of coastal upwelling are compared to reveal a leading role for cyclonic wind vorticity. Daily time series at west, south, and east coast sites exhibit pulsing of upwelling-favorable winds during summer. Over the western shelf, horizontal transport and vertical motion are in phase. The south and east shelf experience greater cyclonic wind vorticity in late winter, due to land breezes under the Mascarene high. Ekman transport and pumping are out of phase there, but dynamic uplift is sustained by cyclonic shear from the shelf-edge Agulhas current. Temporal analysis of longshore wind stress and cyclonic vorticity determined that vertical motion of ~5 m/day is pulsed at 4- to 11-day intervals due to passing marine high/coastal low-pressure cells. Height sections reveal that 15 m/s low-level wind jets diminish rapidly inshore due to topographic shearing by South Africa’s convex mountainous coastline. Mean maps of potential wind vorticity show a concentration around capes and at nighttime, due to land breezes. Air–land–sea coupling and frequent coastal lows leave a cyclonic footprint on the coast of South Africa that benefits marine productivity, especially during dry spells with a strengthened subtropical atmospheric ridge. This work has, for the first time, revealed that South Africa is uniquely endowed with three overlapping mechanisms that sustain upwelling along the entire coastline. Amongst those, cyclonic potential vorticity prevails due to the frequent passage of coastal lows that initiate downslope airflows. No other coastal upwelling zone exhibits such a persistent feature.

1. Introduction

Wind-driven offshore Ekman transport induces coastal upwelling, cool sea surface temperatures (SST), and nutrification of the euphotic layer, which benefits the marine ecosystem. These air–sea interactions tend to be spatially concentrated and temporally pulsed. Hilly subtropical coasts surrounded by marine high-pressure cells have shallow airflow that is channelized. Venturi acceleration occurs near convex promontories and mountainous capes, particularly during summer [1,2,3,4]. Downstream from capes, the airflow diverges amidst negative surface heat fluxes [5,6,7], creating a stable atmospheric boundary layer capped by a subsidence inversion. Wind shadows in the lee of capes allow currents to recirculate [8,9,10], supporting phytoplankton blooms that form the base of the marine food web [11,12,13].
Along coasts backed by mountains such as in South Africa, downslope airflow leads to the formation of lee-side troughs or coastal lows [14] due to cyclonic vorticity from vertical stretching and lower density from compression warming. The downslope airflow sweeps eastward along the South African coast following a marine high-pressure cell. Coupled with the coastal lows are continental shelf waves that pulse the upwelling [15].
While seasonal longshore wind stress induces Ekman transport and pumping in the surface mixed layer, the deep ~1 m/s Agulhas current on the southeast coast of South Africa can also induce upwelling [16,17,18]. Cyclonic shear draws water off the shelf, independent of wind forcing, and intensifies when the Agulhas current meanders shoreward [19,20,21].
Hence, coastal upwelling is supported by steady oceanic and transient atmospheric forcing that stimulates marine productivity along the entire South African coast. Even during winter and periods of upslope airflow, the near-surface wind vorticity over the shelf is seldom anticyclonic. This asymmetric response motivates this research.
This study considers the structure, pulsing, and drivers of upwelling along the coast of South Africa, comparing the following in three distinct regimes along the west, south, and east coasts: (i) longshore wind stress frequency/intensity, (ii) cross-shore wind shear or vorticity, and (iii) longshore currents at the shelf edge. These processes can act collectively to lift water over the shelf and enhance marine productivity. The research will demonstrate that South Africa is unique among global upwelling zones: all three processes affect shelf nutrification, and cyclonic wind vorticity is a persistent background condition.

2. Data and Methods

Our geographic focus is the coastal plains and shelf of South Africa (27–37 S,16–33.5 E). Ocean variables include near-surface sea temperature, currents, and vertical motion derived from global daily data assimilation by GODAS and SODA3 reanalysis [22,23]. Atmospheric parameters include near-surface wind, 975 hPa potential vorticity (our focus), boundary layer height, sea level (S.L.) air pressure, and net solar radiation, from hourly data assimilation by CFS2, ERA5, MERRA2 reanalysis [24,25,26], respectively. Infrared SST and green-band chlorophyll fields derive from monthly declouded MODIS satellite radiance data [27,28]. Acronym definitions and data resolution are listed in Table 1. All analyses are based on publicly available data, as noted in the acknowledgments.
This study encompasses 2000–2021, when retrievals of wind velocity and dynamic topography are supported by multiple high-resolution satellites. Long-term average maps, annual cycles, and depth/height sections were analyzed and time series were extracted at monthly, daily, and hourly intervals for three 50 × 50 km areas centered on inshore shelf zones separated by 800 km, each located <50 km downstream of cape-induced upwelling (Figure 1a) as follows: 32 S, 18 E (west), 34.25 S, 25.25 E (south), and 29.25 S, 31.5 E (east). These three areas represent focal points for marine productivity just downstream from capes and exhibit contrasting air-sea interactions next to the Benguela current (west), in a transition zone (south), and next to the Agulhas current (east).
Offshore Ekman transport in the (~30 m deep) ocean mixed layer is driven by upwelling-favorable longshore wind stress on the west coast +V, south coast –U, and east coast –U–V (normal orientation), with sign adjusted for a positive metric. Ʈ calculations utilize Cd = 0.0015, ρa = 1.2 kg m−3, and U102 (e.g., 5 m/s = 0.045 Pa). Given the fluctuating nature of South African coastal winds, monthly time series reflect the cumulative sum (Ʃ) of daily longshore wind stress (above threshold 0.007 Pa) to estimate offshore Ekman transport from Ʈ/f ρw, wind stress divided by Coriolis and seawater density. Daily and hourly time series do not require manipulation, except to adjust the sign of wind stress to upwelling favorable (+).
Potential vorticity is −g(ζθ + f)(dPθ) following the airflow, g is gravity, ζθ is relative wind vorticity dV/dx–dU/dy in the isentropic layer (975 hPa, ~300 m), f is planetary vorticity or Coriolis, and dPθ is change of isentropic thickness [29,30,31,32], with units 10−6 K·m2/kg·s. Wind shear tends to dominate, thus in air–sea interactions, the potential vorticity describes the curl-induced Ekman pumping from ∂/∂x(Ʈy/f ρw) − ∂/∂y(Ʈx/f ρw), the relative vorticity of wind stress divided by Coriolis and seawater density, where f and ρw are assumed to be steady. The 975 hPa level is employed to study the inshore environment in the presence of steep topography, and units are converted to wind stress curl using a standard drag coefficient.
The longshore currents were estimated from the cross-shore slope of η dynamic topography via multi-satellite altimeter reanalysis [33]. Values were extracted along three sections (cf. Figure 1b) at inshore and offshore points separated by 50 km. Given the coastal orientation, the estimated near-surface longshore current is g/f ∂η/∂x (west coast), ∂η/∂y (south coast), ∂η/∂n (east coast, 45° angle, normal). The inshore decrease of a westward longshore current (cyclonic shear) generates dynamic uplift.
The forcing of upward motion over the shelf is segregated into three mechanisms, as outlined above: (i) offshore transport due to cumulative upwelling-favorable wind, (ii) Ekman pumping via wind vorticity, and (iii) shear inside the longshore current. These are scaled according to relative influence, as described above and in [34]. Empirical techniques are underpinned by ocean models (e.g., CFS2, GODAS, SODA3) that simulate vertical motion over the shelf based on data assimilation. Validations have been reported in earlier work [10] that compared model outputs with moored buoys in the transition region. Here, our analysis of the 2000–2021 period is covered by multiple satellite altimeters and scatterometers for currents and winds over the shelf. Among the three ocean reanalyses, GODAS has limitations due to its resolution that necessitate the use of CFS2 and SODA3 to quantify shelf-edge current shear, vertical motion, and coastal upwelling.
Statistical methods include cross-correlation of monthly time series 2000–2021: Ʃ longshore wind stress, vorticity, longshore current, SST anomaly, and chlorophyll. These have ~40 degrees of freedom and require a Pearson-product moment r > |0.25| for 90% confidence. Lag auto-correlation and lag cross-correlation of daily potential vorticity time series for January 2016–December 2018 are calculated to define intraseasonal pulsing and eastward propagation. These have ~100 degrees of freedom and require r >|0.16| for 90% confidence. Daily vorticity time series (1 January 2016–31 December 2018) were regressed onto SLP air pressure fields to understand regional weather controls on cyclonic signals in each area.
Transient cyclonic events were identified in the daily potential vorticity time series, and case study features were analyzed as maps, sections, and hourly time series. The designated cases are as follows: west coast, 11 January 2016; south coast, 3 November 2018; and east coast, 26 September 2016. Evolution of the longshore wind jet was analyzed for the west case, radiosonde wind and temperature profiles were obtained for the south case, and Hysplit back-trajectories of near-surface airflow reaching 29.25 S, 31.5 E were simulated for the east case.
The mean diurnal cycle of MERRA2 3-hourly potential vorticity was analyzed from 1 January 2016 to 31 December 2018 via time series for the three areas. Daytime sea breezes/nocturnal land breezes appear to suppress/enhance vertical motion over the shelf. Maps of summer 12:00–18:00 and winter 00:00–06:00 h “residual” winds were calculated by subtracting the all-hour mean. These describe how cross-shore airflow affects relative vorticity according to d/dt(ζ + f)/H [14]. Changes in relative and planetary vorticity are conserved following the airflow, so increasing H thickness under a land-to-sea downslope wind gains cyclonic spin.
To determine the interannual influence of the regional climate on marine productivity, MODIS chlorophyll estimates were subjected to empirical orthogonal function (EOF) analysis for 2000–2021. The mode-1 loading pattern hugs the entire coast and accounts for 70% of the standardized variance. Its time score was extracted and regressed onto fields of air pressure reduced to sea level (SLP) and net solar radiation for 2000–2021 across the region: 17–47 S, 6–43.5 E. The point-to-field outcomes link regional weather to wind vorticity and (indirectly to) productivity over the South African shelf.

3. Results

3.1. Study Area and Mean Maps

Maps of 975 hPa potential vorticity and wind, atmospheric boundary layer height, and SST (Figure 1a–c) reflect a thermally stable atmospheric circulation over the coastal upwelling zone. The long-term average potential vorticity is cyclonic over the coast and shelf, indicative of coastal lows and shear during easterly airflow. The great longshore extent of this cyclonic feature is globally unique and is a key finding of this research. The annual average near-surface winds (Figure 1a) reflect distinct regimes: the west coast under the South Atlantic high-pressure cell, the south coast under mid-latitude westerlies, and the east coast under the Southwest Indian (Mascarene) high-pressure cell. The south-to-east transition (27–29 E) shows weak airflow between the marine highs. The atmospheric boundary layer height (Figure 1b) averages ~500 m over the coast, being deeper near the Agulhas current. A shallow boundary layer height over the Benguela current helps channel and accelerate longshore winds near capes. The annual average satellite SST map (Figure 1c) exhibits the well-known inshore upwelling, which broadens westward with shelf width. Topographic gradients are steep along the South African coast (Figure 1c), so cross-shore airflow will undergo thickness change (dPθ~104 Pa, H~103 m) within a few hours.
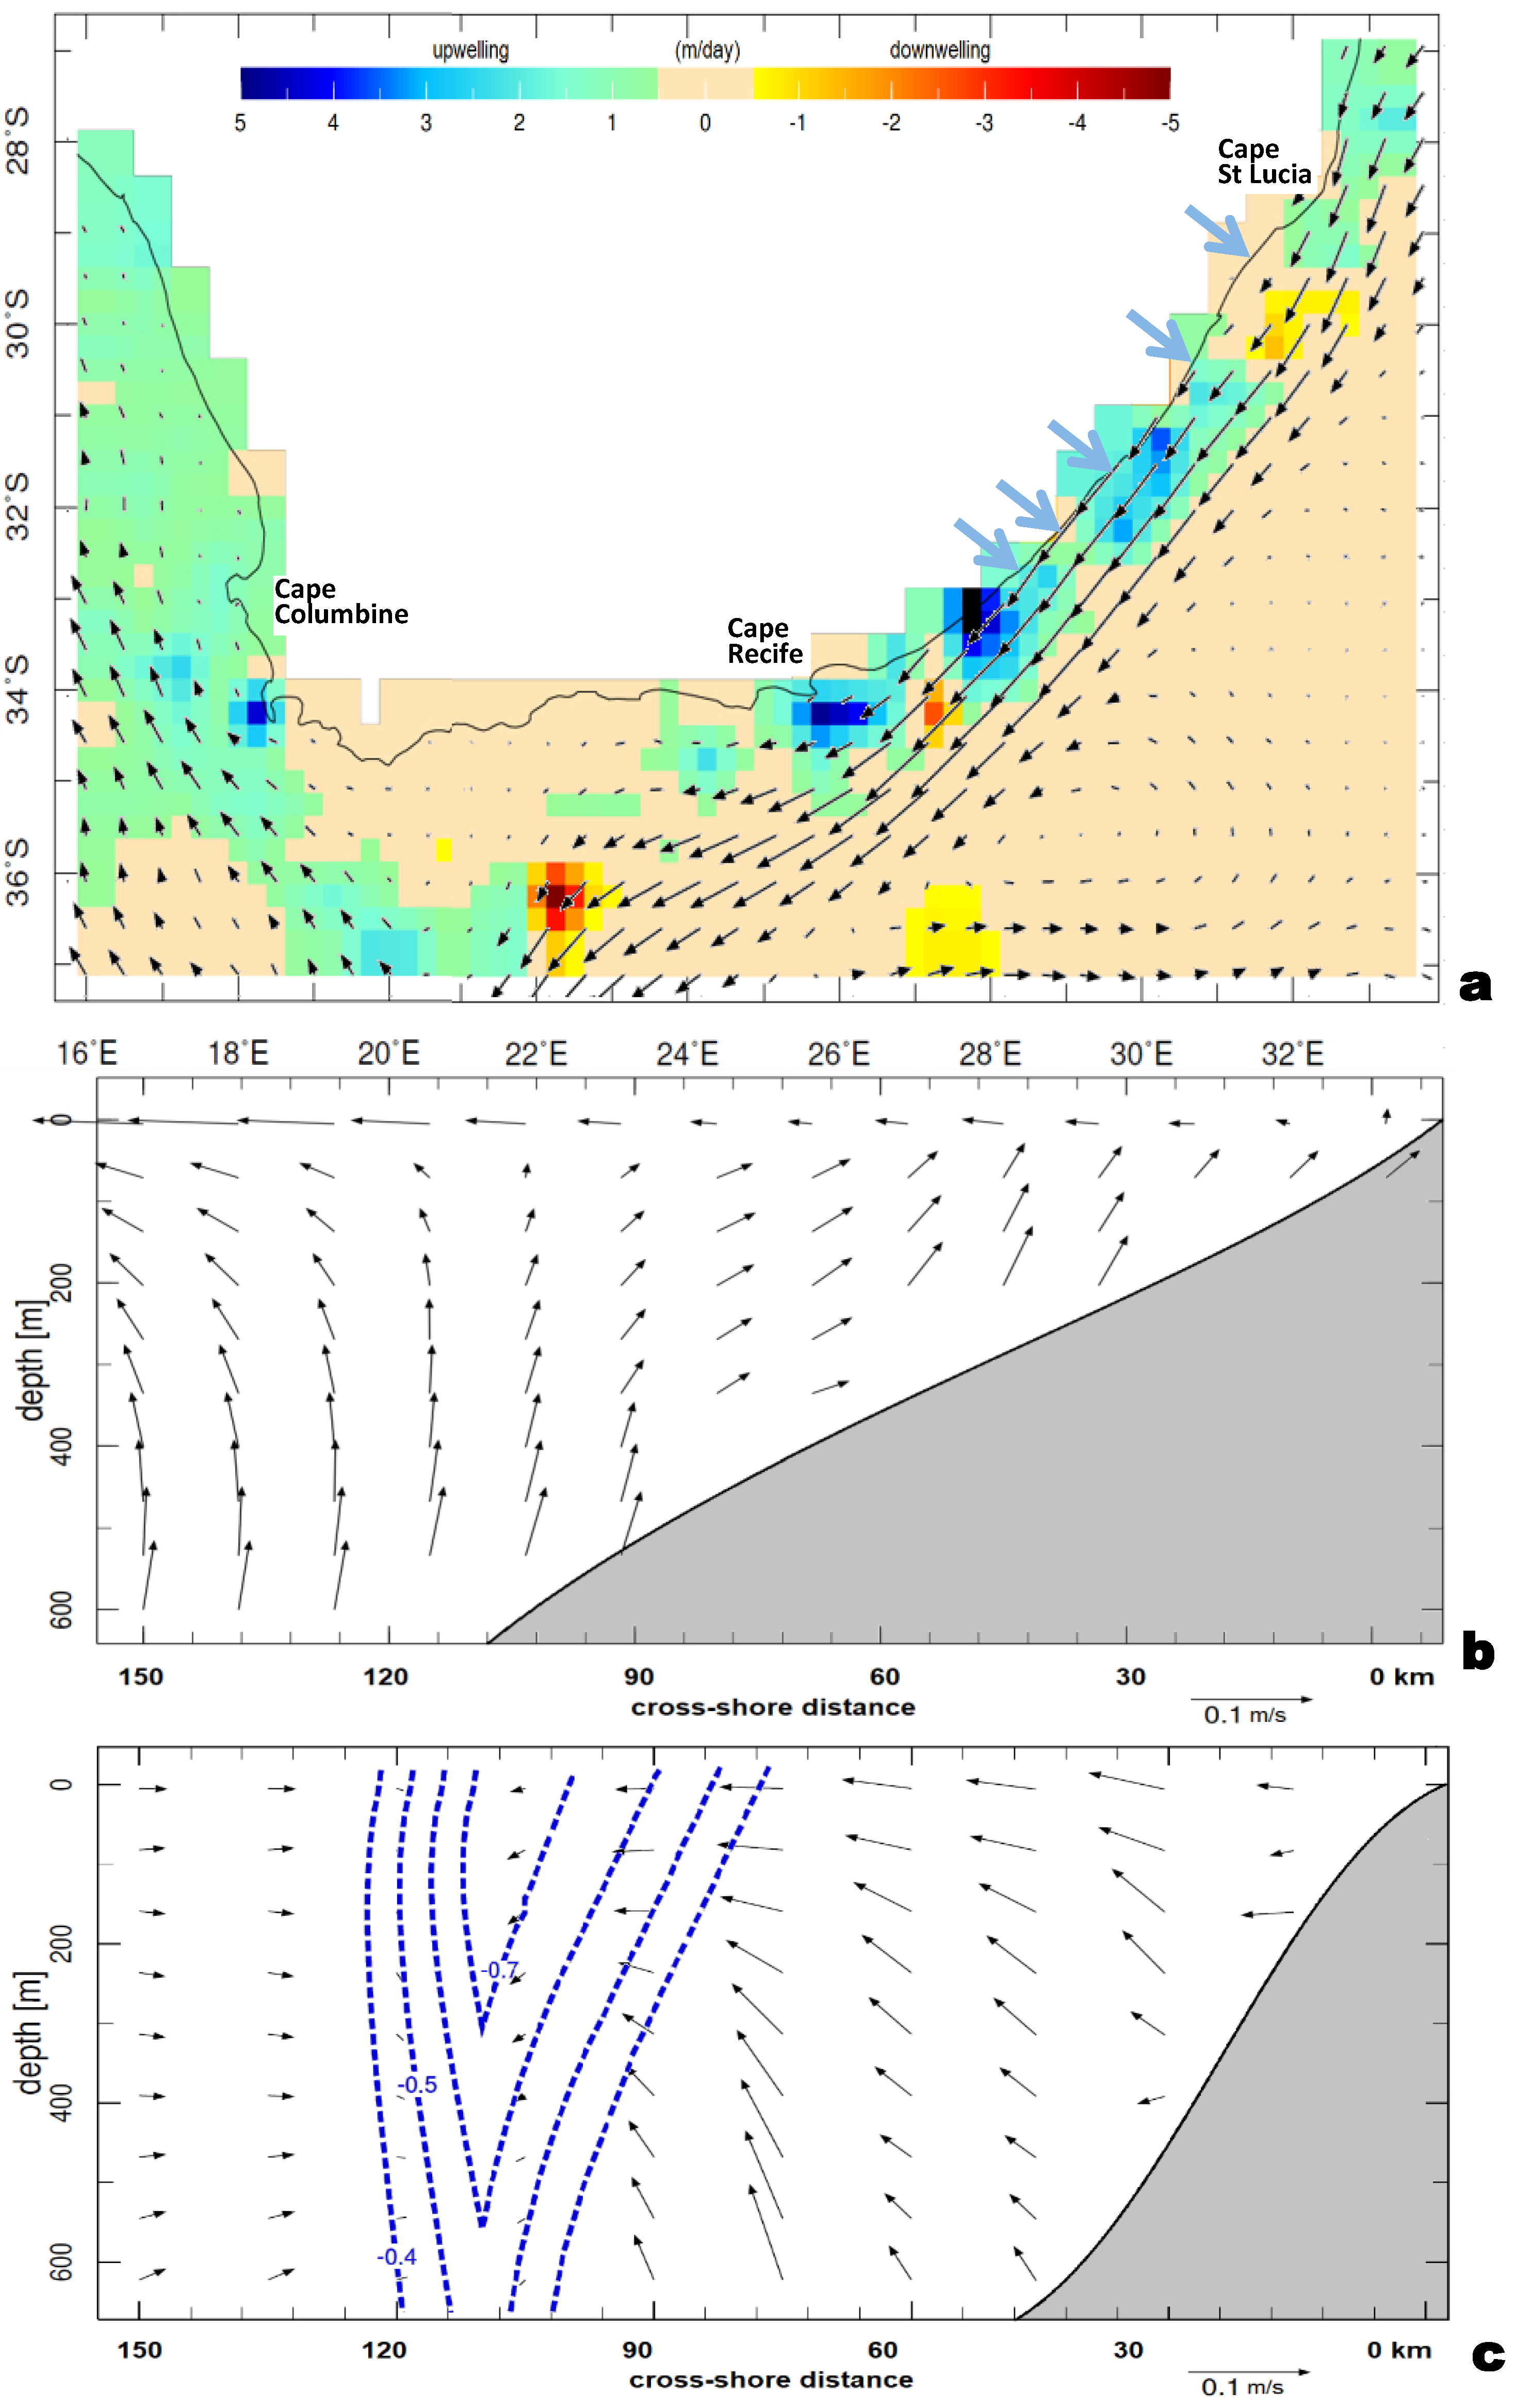
Upper ocean maps and sections of annual average vertical motion and near-surface currents are presented in Figure 2a–c based on GODAS-SODA3 reanalysis for 2000–2021. Uplift occurs along the South African coast, at convex points next to the fast-flowing Agulhas current 26 E, 28 E, 30 E, and at Cape Point 18 E (Figure 2a). Over the Agulhas bank (19–23 E) and Benguela shelf, dynamic uplift is weak because currents are sluggish. In the west-facing depth section (Figure 2b), offshore Ekman transport in the mixed layer (~30 m) strengthens seaward and the shelf is broad; a diffluent ocean circulation induces uplift ~100 km offshore, similar to [35]. From 30 to 90 km, the sub-surface circulation is drawn coastward by the mass deficit and penetrates St. Helena Bay. In contrast, the south coast depth section (Figure 2c) exhibits the shelf-edge Agulhas current (~0.7 m/s, 90–120 km offshore). Uplift is generated below 200 m from 30 to 90 km and the circulation pulls seawater away from the shelf. Currents converge onto the longshore current, causing upwelling on the inshore edge. Rivers discharge plumes of freshwater along the southeast coast during summer (arrows in Figure 2a), spreading nutrients into the euphotic zone.

3.2. Temporal Characteristics and Seasonality

Figure 3 illustrates the monthly time series of Ʃ wind stress, vorticity, and current shear that forces vertical motion (uplift) over the shelf. The west area exhibits upwelling-favorable longshore wind stress that crests in summer together with vorticity. There is a minor influence for the Benguela current due to df/dy and a wide shelf. The south area has little seasonality and longshore wind stress and vorticity are out-of-phase, being upwelling favorable in summer but more cyclonic in winter. By contrast, the sea surface slope is steep, and longshore currents sustain upwelling inshore. The east area has moderate seasonality, but longshore wind stress and vorticity are out of phase, similar to the south coast. Northeasterly winds induce summer upwelling, while vorticity boosts vertical motion in winter and spring. The shelf-edge Agulhas current sustains dynamic uplift off the east coast.
Cross-correlations of monthly time series in each area are listed in Table 2. The sum of upwelling-favorable winds is well correlated with potential vorticity (r = 0.68) on the west coast, and to a lesser degree with local SST anomalies (−0.22) and chlorophyll (0.30), in the absence of wind–current feedback. In contrast, longshore wind stress on the south coast is inversely related to vorticity (−0.43) and weakly associated with SSTa and CHL. Wind–current feedback is noteworthy (r = 0.25). On the east coast, upwelling-favorable wind stress and vorticity are poorly associated, but the cyclonic shear within northeasterly winds correlates with SST anomalies (−0.33). Chlorophyll on the southeast coast exhibits a weak relationship with most variables.
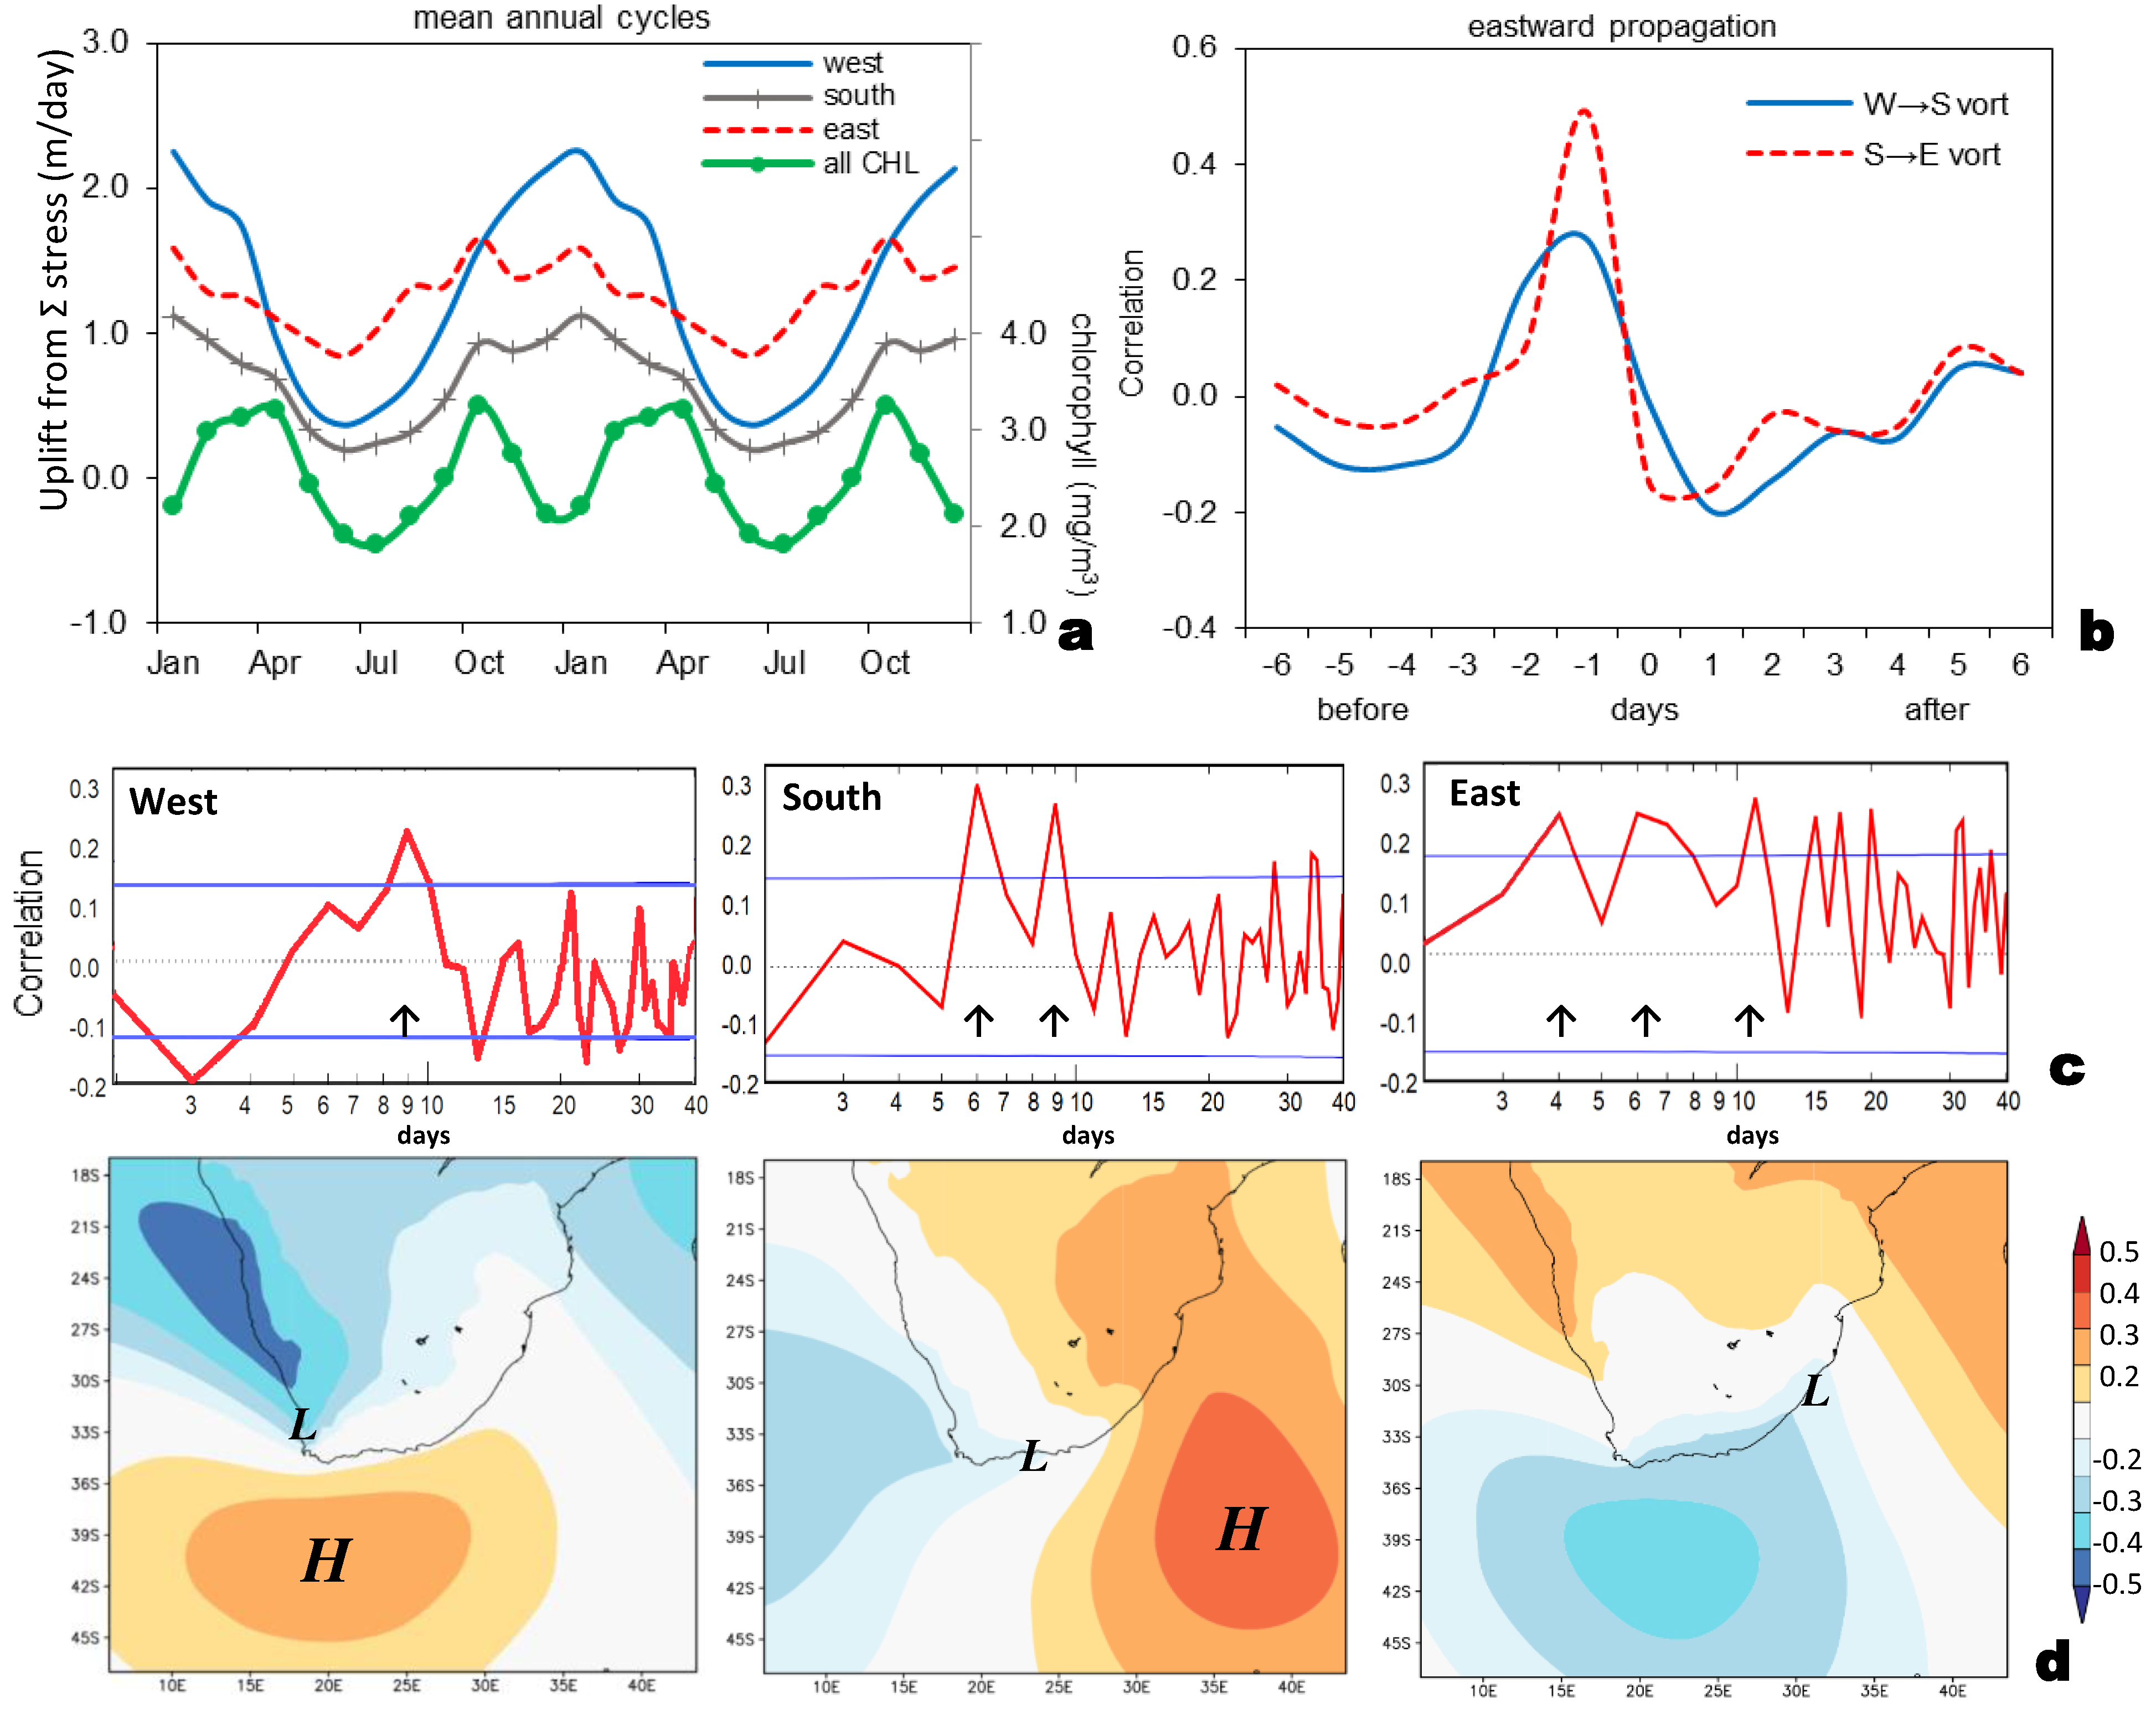
Annual cycling of wind-driven upwelling and chlorophyll is analyzed in Figure 4a; longshore wind stress is upwelling favorable during summer in all three areas. The subtropical ridge moves poleward from October to April, enhancing offshore Ekman transport. The annual cycle decreases in size from west to east. South coast winds are least favorable for summer upwelling due to the intrusion of mid-latitude westerlies. Despite longshore wind stress forcing, the mean annual cycle of all-coast chlorophyll crests in spring (October) and autumn (February–April). It is speculated that the bi-modal character relates to phytoplankton depletion during summer (December–January) stratification and winter (June–August) mixing.

3.3. Intraseasonal Pulsing

The eastward propagation of potential wind vorticity signals is analyzed from daily time series in the January 2016–December 2018 period (Figure 4b). The west-to-south lag correlation crests at 0.30 from −2 to −1 days, indicating phase speeds of 5–9 m/s. The south-to-east lag correlation peaks at 0.50 on −1 day (~9 m/s). Thus, coastal low-induced cyclonic pulses are speedy and coherent between the Drakensberg mountains and Agulhas current. Intraseasonal pulsing of vorticity is analyzed by lag auto-correlation in Figure 4c. Each area has a distinct character: the west has a singular peak at 9 days, and the south has two peaks at 6 and 9 days. The east area has broader intraseasonal pulsing at 4, 6, and 11 days. Low-frequency oscillations of wind vorticity on the southeast coast (15–35 days) could relate to Mascarene high response to troughs in the Mozambique Channel.
Correlating the daily potential wind vorticity time series with SLP air pressure fields in the January 2016–December 2018 period (Figure 4d) reveals marine high/coastal low pairs rotating counterclockwise around the coast. Vorticity is pulsed in the west with a high at 41 S, 20 E, in the south with a high at 39 S, 37 E, and in the east with a high over the Mozambique Channel. Offshore airflow preceding coastal lows will push easterlies to the shelf edge, causing Ekman pumping inshore. The coastal low reaches the W, S, and E key areas simultaneously with the cyclonic pulse, as expected. In the west case, there is a lee-side trough along the Namib coast at 25 S, 15 E, whereas in the east case, local cyclonic wind vorticity links with a mid-latitude low at 40 S, 22 E (Figure 4d).

3.4. Local Scenario of Cyclonic Cases

Leading cyclonic cases were determined by ranking the daily potential wind vorticity time series. In the west case of 10–12 January 2016, longshore winds and cross-shore circulations are analyzed as height sections seaward of 32 S and 25.25 E (Figure 5a,b). During this sequence, airflow in the 1–3 km layer is directed offshore ~2 m/s and subsides at −0.02 m/s. The wind jet on 10 January is shallow at ~1 km, intense at ~18 m/s, and >90 km seaward of St. Helena Bay. Maximum cyclonic wind shear is ~60 km offshore. Two days later, along the south coast, the wind jet is deeper and closer to shore at 60–90 km (St. Francis Bay) and ~14 m/s. The easterly wind has evolved due to changes in topography and the horizontal pressure gradient; the strongest wind shear is located inshore.
Hourly time series at the two sites are presented in Figure 5c. On the west coast, upwelling favorable winds exceed 10 m/s from 7 to 10 January and vertical motion reaches 10 m/day. On the south coast, upwelling favorable winds prevail from 11 to 13 January, with a ridging high-pressure cell. Vertical motion exhibits inertial and diurnal oscillations; the weakest and strongest wind-driven transport occurs near sunrise and sunset, respectively. Cyclonic wind vorticity reaches a maximum at 21:00; vertical motion lags wind forcing by a few hours.
Equatorward airflow along the west coast becomes shallow due to negative heat fluxes and decreasing Coriolis df/dy. Atmospheric subsidence W = V(H)(β/f) [14] derives from wind V +15 m/s, H ~1.5 × 10³ m thickness, β df/dy ~0.7 × 10⁻¹¹ s−1, and f −8 × 10⁻⁵ s−1, which yields a value of −0.02 m/s over the western shelf. The CFS2 sensible heat flux on 10 January 2016 averaged −46 W/m2 upstream from 32 S to 34 S. Together, these processes (Coriolis and flux) create a shallow wind jet, resulting in calm conditions downstream over St. Helena Bay (cf. Figure 5a). In contrast, easterly winds along the southern shelf (–U) experience a steady Coriolis and weak sensible heat flux −9 W/m2 upstream from 25 E to 27 E, so the wind jet evolves on 12 January 2016 (cf. Figure 5b) by weakening and deepening.
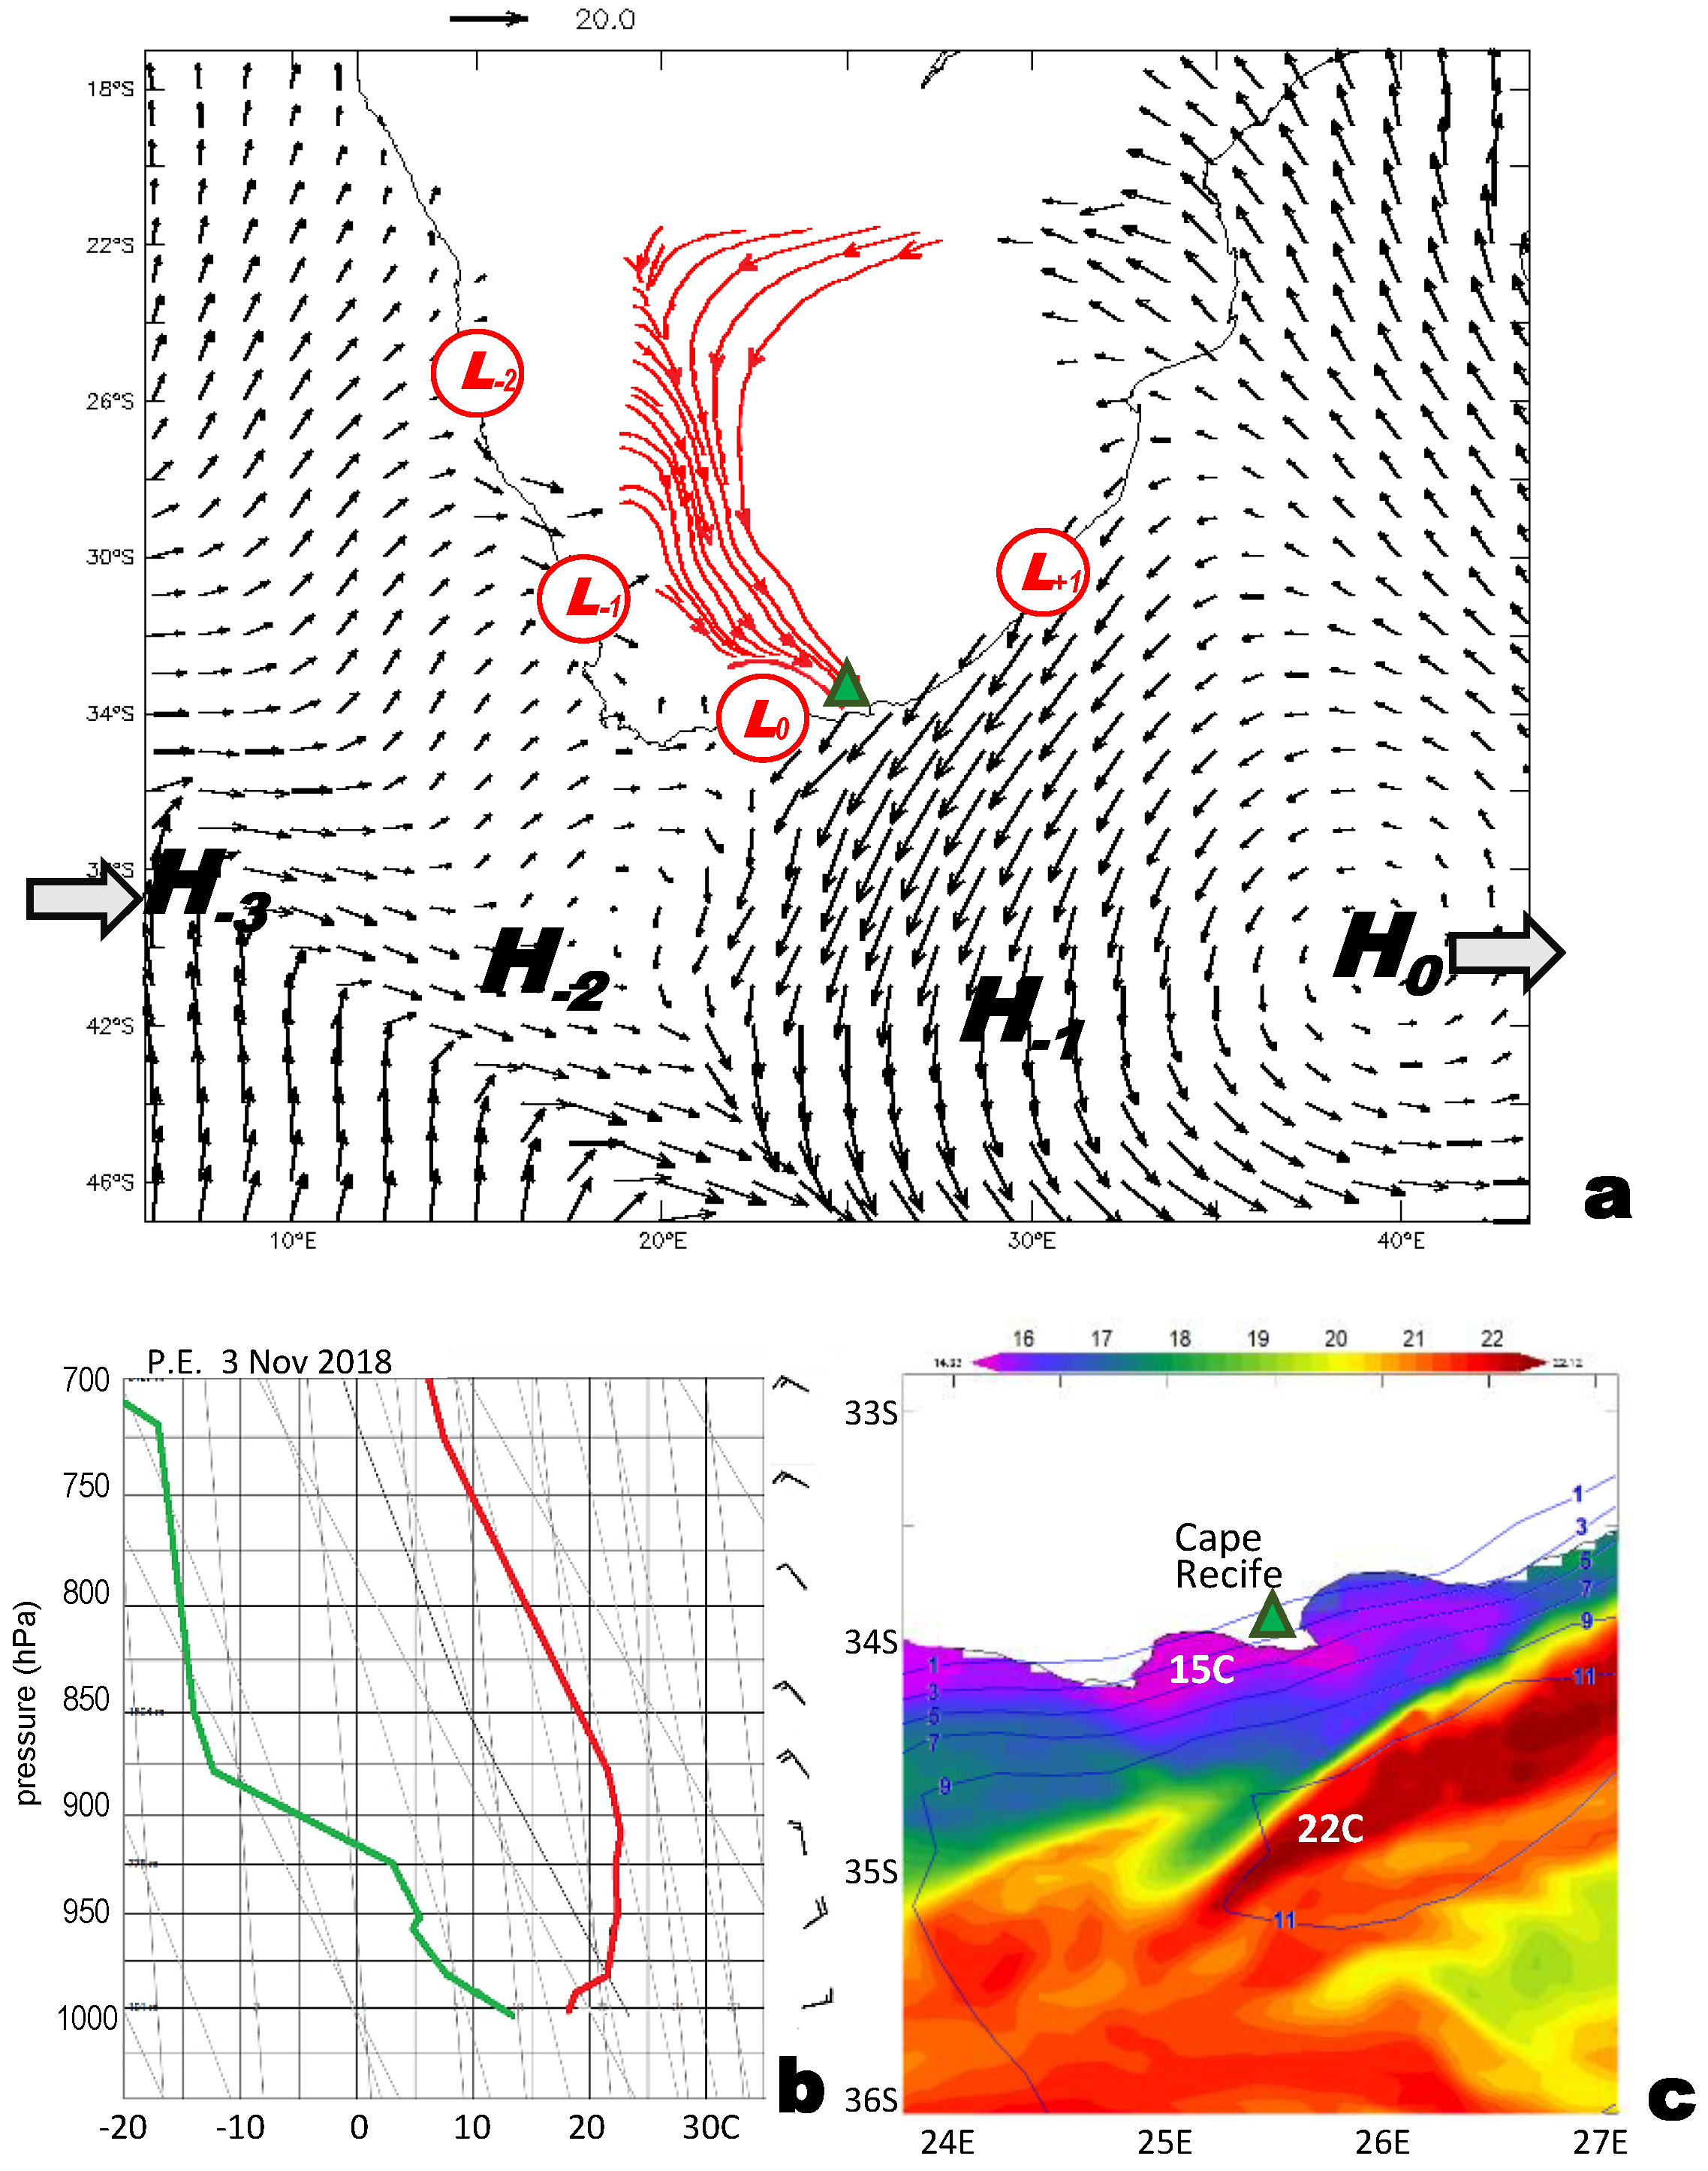
A leading cyclonic case on the south coast is 3 November 2018; the regional 975 hPa wind map and 850 hPa downslope airflow are presented in Figure 6a. Marine high/coastal low positions indicate eastward progression of the high cell from 39 S, 6 E (day −3), 41 S, 16 E (day −2), 42 S, 39 E (day −1), to 40 S, 40 E (day 0), averaging 11 m/s. Eastward movement of the coastal low is from 26 S, 15 E (day −2), 32 S, 18 E (day −1), 34 S, 24 E (day 0), to 31 S, 31 E (day +1), averaging ~9 m/s. Coastally channeled easterly winds are overlain by offshore airflow. The radiosonde profile at Port Elizabeth (Figure 6b) reflects dry and thermally stable conditions with northwest winds above 900 hPa (~1 km). The dewpoint depression reaches 30 °C at 850 hPa. SSTs along the coast (Figure 6c) are 15 °C next to the shelf-edge Agulhas current. The intense upwelling is sustained by offshore Ekman transport on 2–3 November 2018 (~2000 kg/m s), with cyclonic wind stress curl (~2 × 10⁻⁶ Pa/m) and vertical motion (~6 m/day) according to CFS2 estimates.
The airflow passing Cape Recife on 3 November 2018 is characterized by Froude number F = U/N Hm, where U is near-surface wind (10 m/s), N is B-V frequency from the radiosonde profile (0.017 s−1), and Hm is upstream topography (~500 m). The outcome is F ~1.2, a super-critical value that indicates coastal channeled winds in a thermally stable atmospheric boundary layer will undergo acceleration by expansion fan downstream of a convex promontory [36]. The wind remains sheared downstream, the dU/dy gradient is −2 to −12 m/s from 34 S to 34.5 S, and the shadow zone is sustained >100 km (cf. Figure 6c).
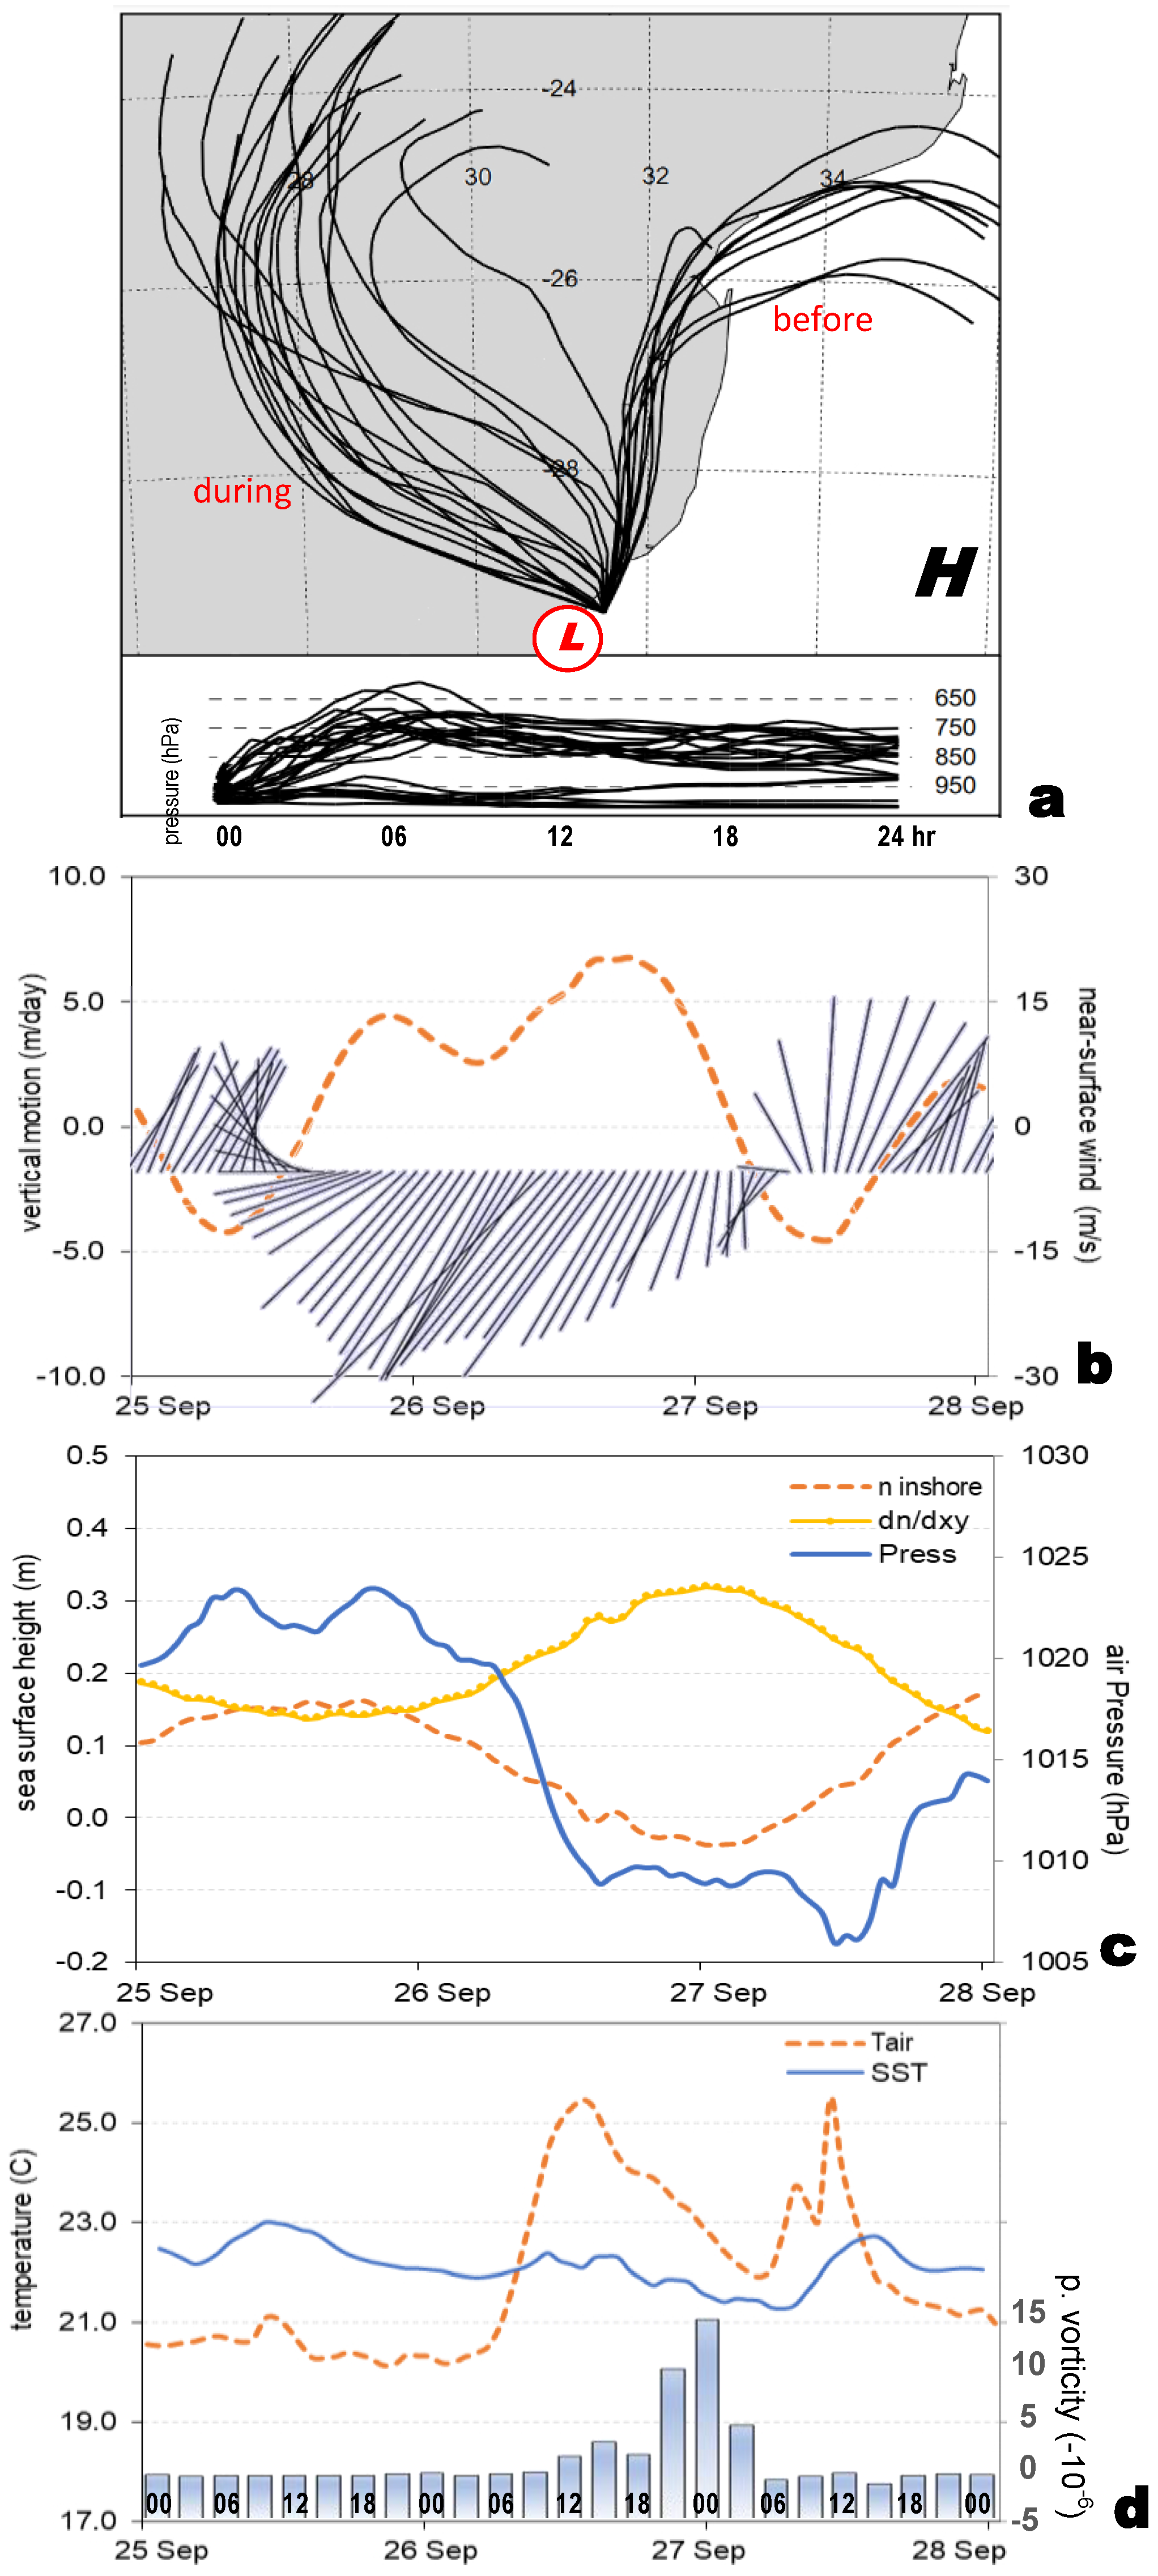
A leading cyclonic case on the east coast is 26 September 2016. Hourly back-trajectories of airflow reaching the shelf at 29.25 S, 31.5 E (Figure 7a) reveal winds initially from the northern coastal plains. As the coastal low approaches and the marine high retreats, airflow descends from the interior plateau dPθ 750–950 hPa over a 6 h period. Hourly marine wind stick vectors and CFS2 vertical motion over the shelf (Figure 7b) show 15 m/s northeasterlies (-UV) generating ~5 m/day uplift on 26 September. Hourly time series of sea surface height (SSH) and S.L. air pressure (Figure 7c) indicate the passage of a coastal low and continental shelf wave; pressure declines from 1022 to 1008 hPa and inshore SSH declines 0.1 m, thereby accelerating the longshore current. Hourly time series of temperatures and relative vorticity over the shelf (Figure 7d) show that Tair is below SST on 25 September. As upwelling induces a 2 °C drop in sea temperature from 25 to 27 September, the air temperature rises 6 °C under warm downslope “berg” winds. During the night of 26–27 September, land breezes accentuate cyclonic potential vorticity and vertical motion. Air density declines according to Δρ = P∕R ΔTair, with R = 287 J/kg K about 5% over the shelf. The downslope wind thickens the isentropes dPθ ~200 hPa (~2 km), spinning up the coastal low and continental shelf wave. Figure 7b,d shows how vorticity becomes increasingly cyclonic at the end of the northeast wind event.

3.5. Diurnal Cycling of Wind Vorticity

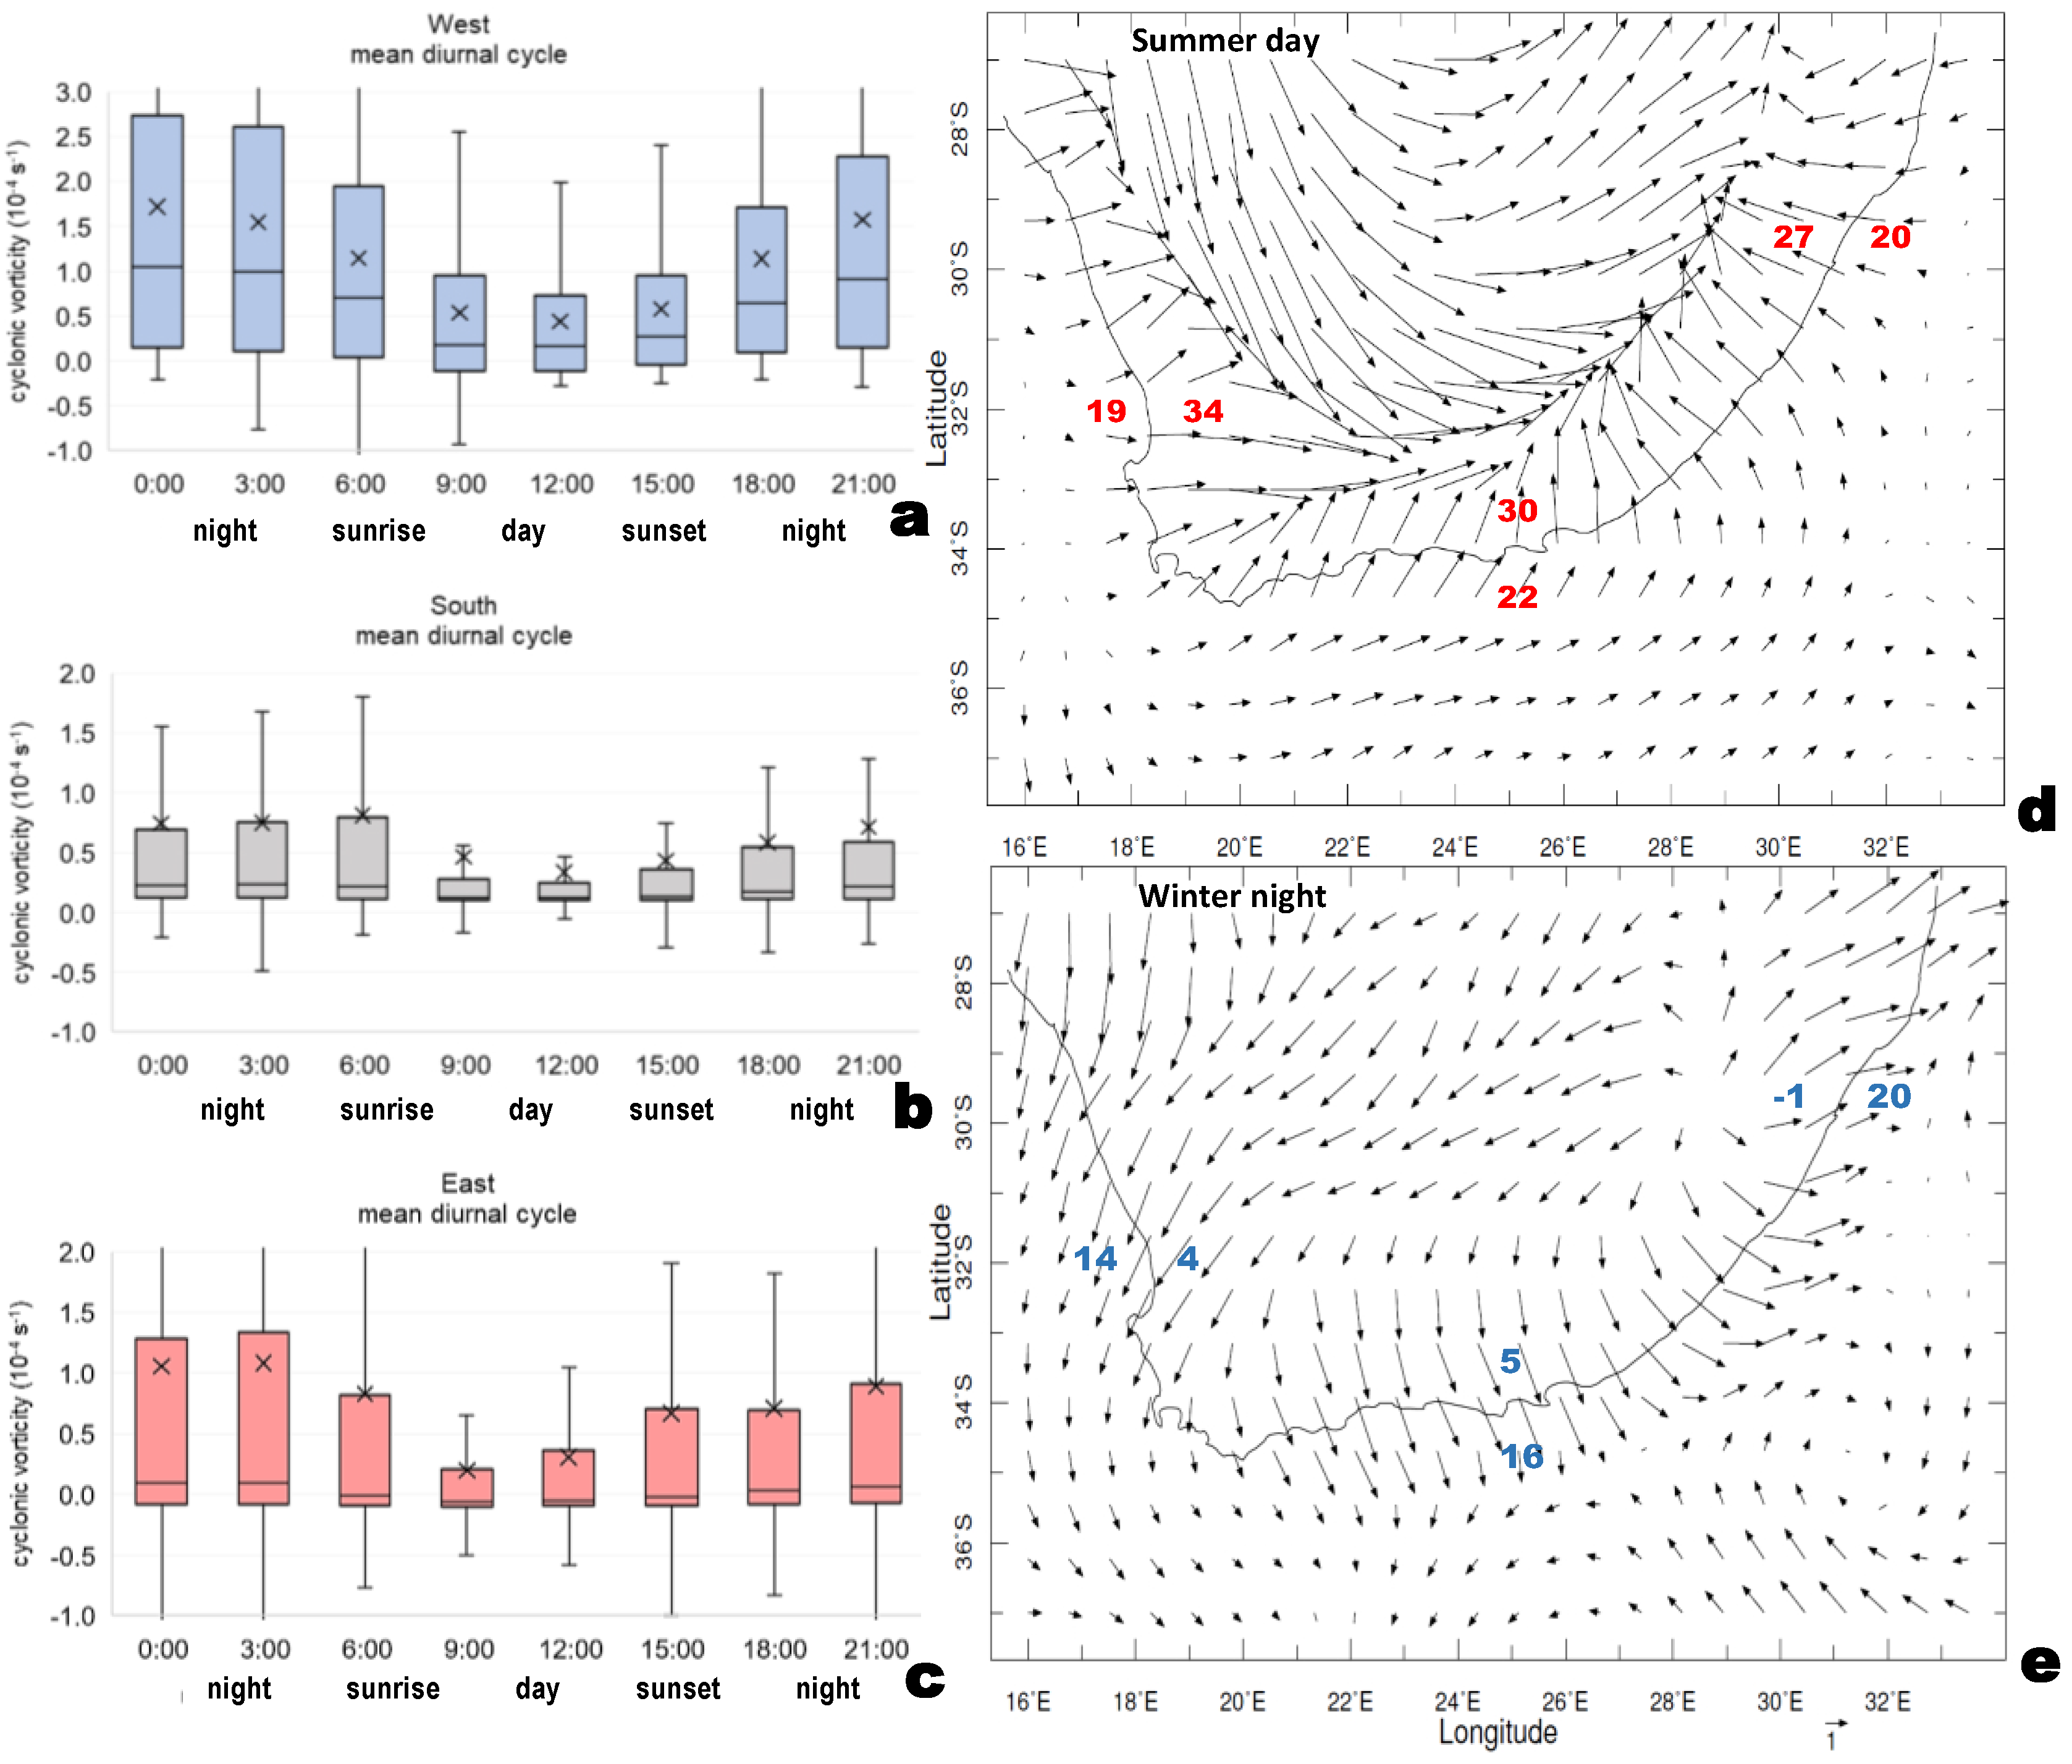
The influence of land–sea breezes is considered by calculating the mean diurnal cycle of potential wind vorticity from 3 hourly time series in the three key areas (Figure 8a–c). All three box–whisker plots show cyclonic values >10−6 from 21:00 to 03:00 h when the land breeze prevails, and values near zero from 09:00–15:00 h when the sea breeze prevails. Diurnal amplitude is highest in the west, followed by the east, then the south. The inertial oscillation is close to the 24 h thermal cycle, so reinforces the diurnal amplitude.
Thermal influences on coastal airflow were analyzed by calculating the diurnal residual winds for summer 12:00–18:00 h and winter 00:00–06:00 h (Figure 8d,e). Warming of the interior plateau on summer days draws sea breezes across the coastal plains. This has two effects: vertically contracting the isentropic layer and pulling longshore winds to the coast. Conversely, cooling of the interior plateau on winter nights induces land breezes that drain downslope, stretching the isentropic layer and pushing longshore winds to the shelf edge. Air temperature differences drive cross-shore airflow according to U′ = ((g h⁄θ)∂θ⁄∂x) ∂t [37], where surface layer h ~20 m, θ ~280–300 K, and ∂θ ⁄∂x is the land–sea temperature differential over ∂t ~2 × 10⁴ s (6 h). During summer days, ∂θ ⁄∂x increases landward >10 °C from the shelf to the escarpment (105 m), while the opposing condition occurs on winter nights. The outcome is cross-shore airflow of ~3 m/s in the form of sea breezes on summer days (especially in the west), and land breezes on winter nights (especially in the east). The residual airflow patterns (Figure 8d,e) exhibit confluence/diffluence over the escarpment and land–sea breezes that extend ~50 km seaward over the shelf, to a greater extent than previously thought. Vertical motion over the shelf intensifies during the night. Ekman pumping via wind shear is minimal during the day, as summer sea breezes draw airflow onto the coastal plains and reduce wind shadows downstream of capes. During winter on the southeast coast, the warm Agulhas current enhances land breezes, which vertically stretches the airflow. Thermal forcing keeps upwelling-favorable winds and vorticity (Ekman transport and pumping) out of phase in the south and east areas (cf. Figure 3).

3.6. Chlorophyll and Interannual Climate

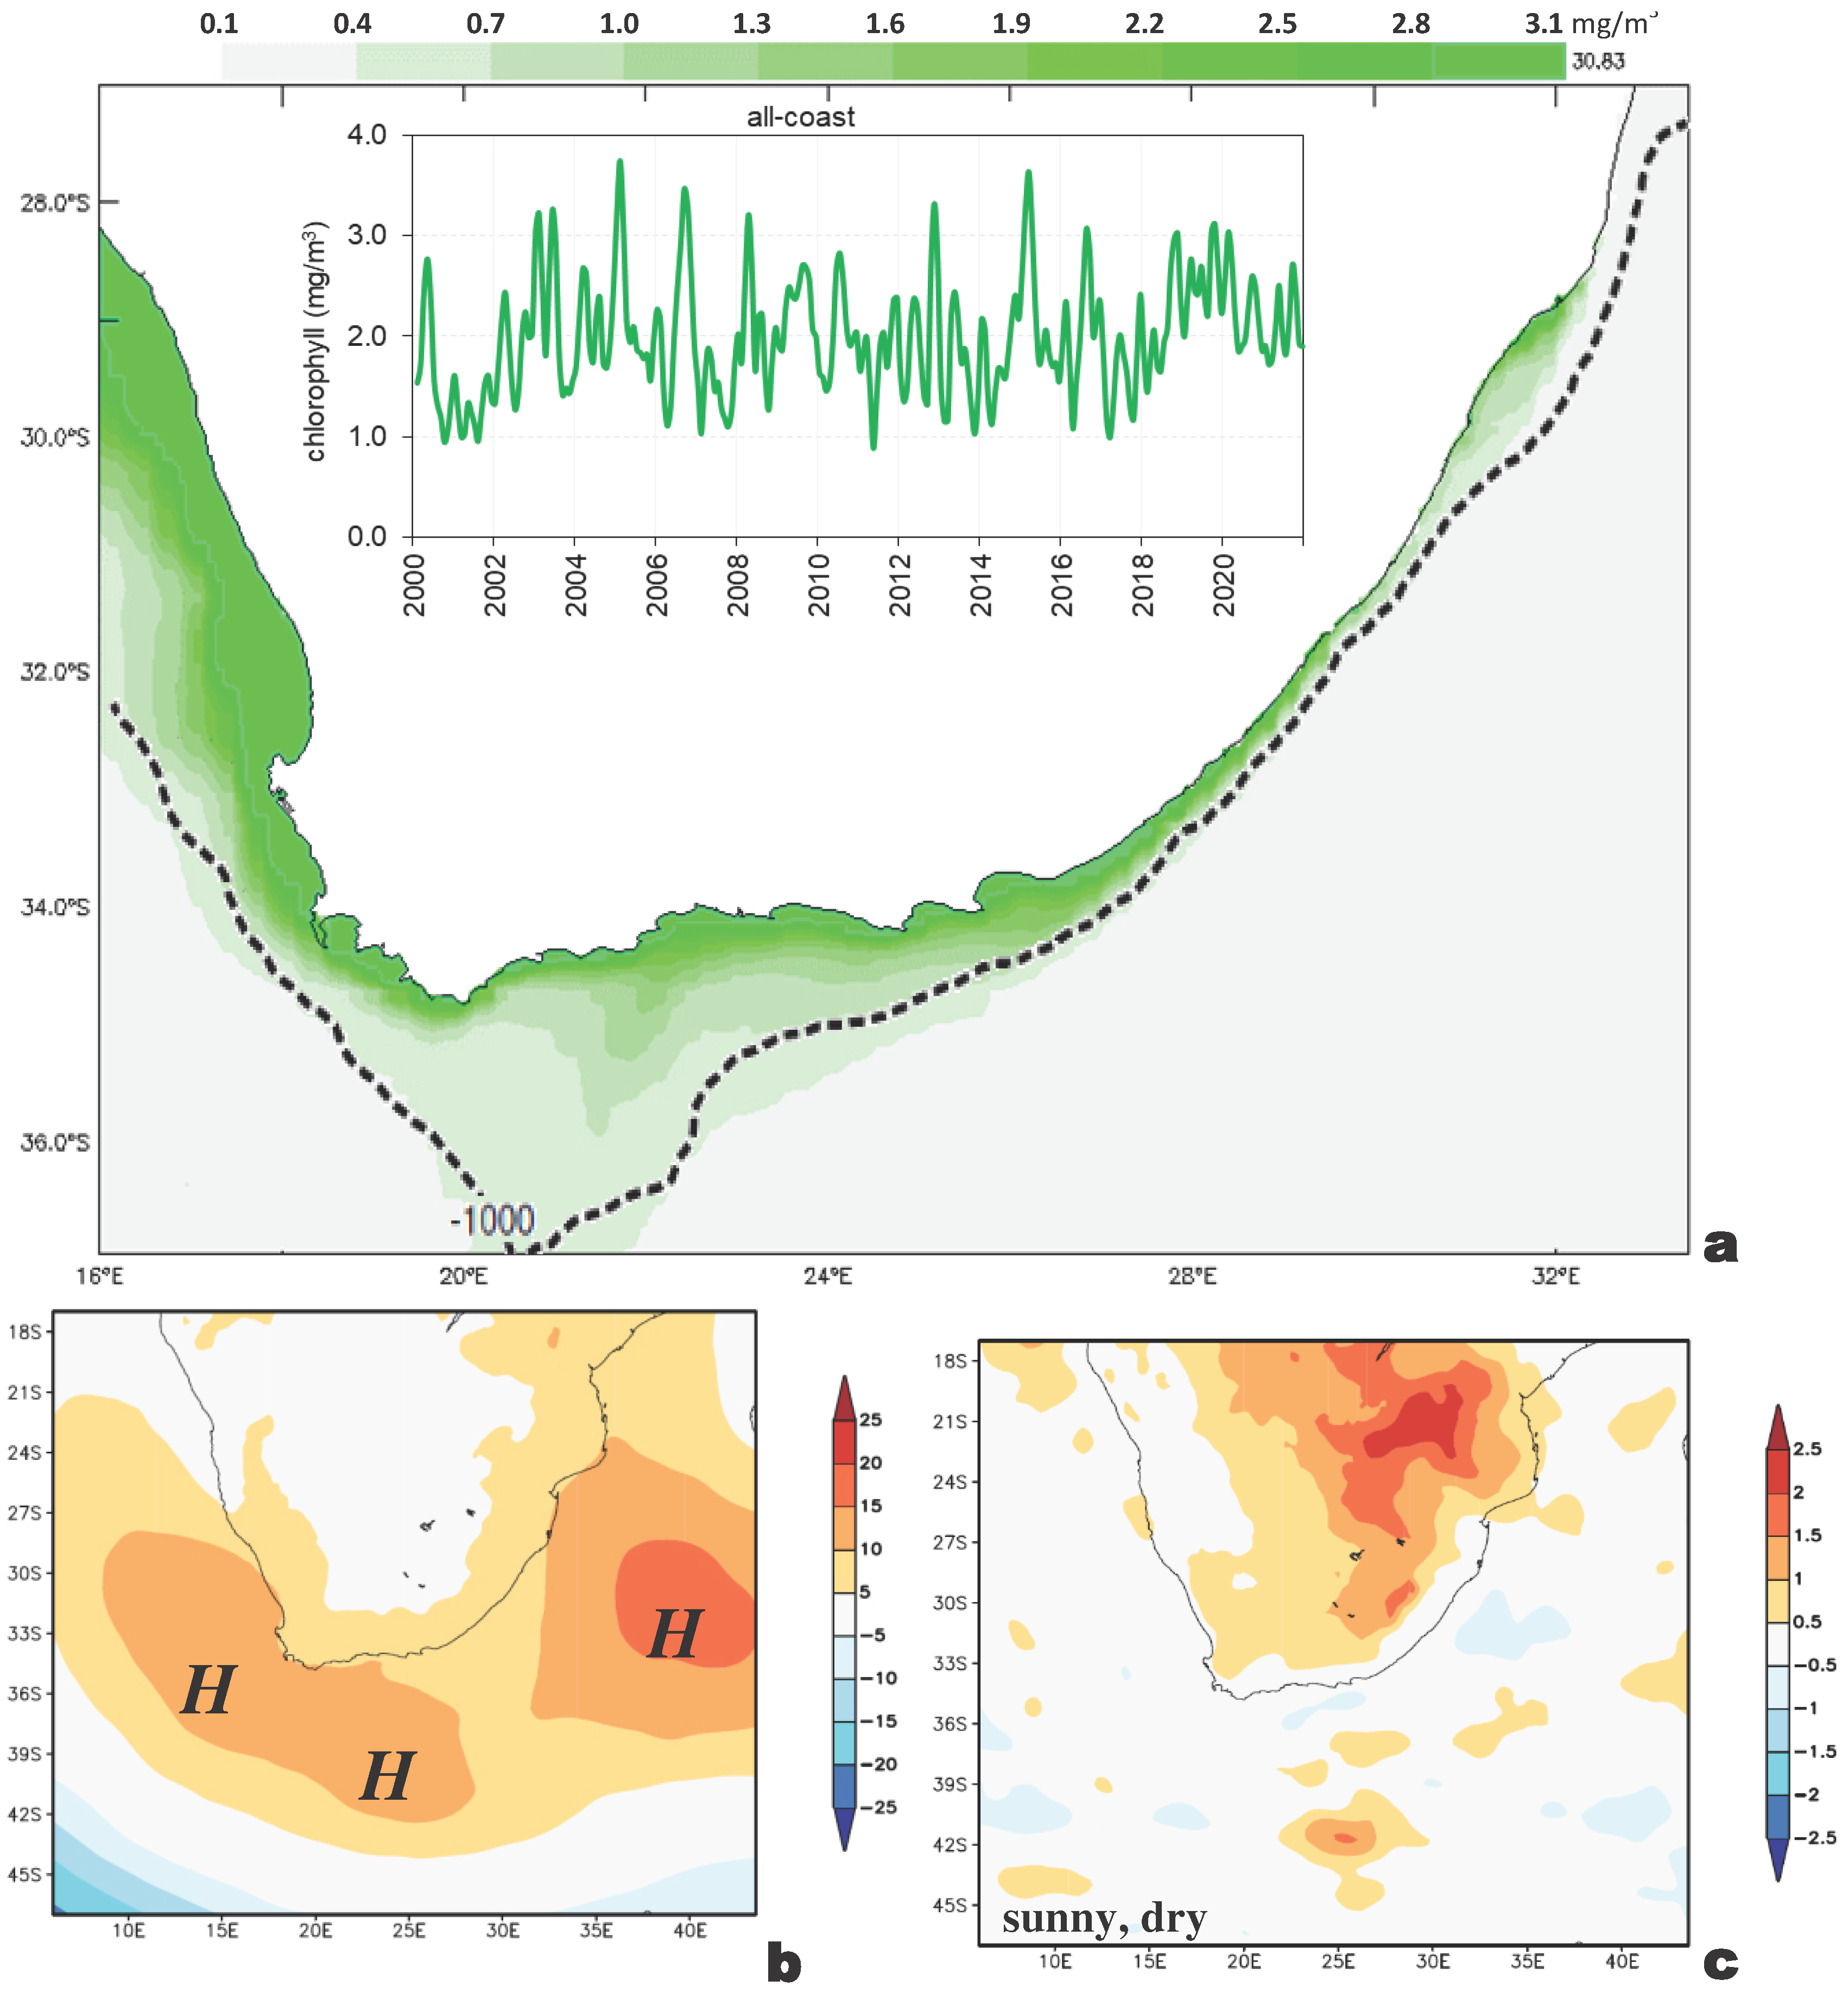
To link coastal upwelling and productivity, we analyze satellite-estimated chlorophyll via EOF-1 loading patterns and time scores in Figure 9a. Maximum concentrations hug the entire coast and indicate that productivity in the Benguela and Agulhas regimes are in phase under cyclonic shear. The EOF-1 chlorophyll time score crests in spring/autumn. Interannual fluctuations are associated with climatic features, according to field regressions with S.L. air pressure and net solar radiation (Figure 9b,c). Coastal chlorophyll rises during years when marine high-pressure cells surround South Africa, and the subtropical ridge inhibits intrusions of mid-latitude westerlies. Regression of the EOF-1 chlorophyll time score onto the net solar radiation field indicates sunny skies and a drier-than-normal climate; hence, interior troughs/cut-off lows are less frequent. The marine highs deliver easterly winds, offshore transport, cyclonic shear, and vertical motion, whose nutrification enhances phytoplankton blooms. The analysis links low-frequency climate and cyclonic wind vorticity (cf. Figure 4d).

4. Concluding Discussion

High-resolution atmosphere–ocean reanalysis fields that assimilate in situ and satellite measurements demonstrate the well-known upwelling of nutrient-rich water along the South African coast (cf. Figure 1c and Figure 6c). The nearshore wind structure, its space-time variability, and cyclonic events in the period 2000–2021 were analyzed for three mechanisms: (i) offshore Ekman transport from upwelling-favorable longshore wind stress, (ii) Ekman pumping from cyclonic wind stress curl or vorticity, and (iii) dynamic shear from shelf-edge currents. As the ocean’s wind-mixed layer is pulled away from the coast, mass divergence is compensated by inshore upwelling. A new finding here is that cyclonic wind vorticity is the natural background condition due to coastal lows that follow ridging of high-pressure cells. Consequently, upward motion is sustained and accelerated near capes that channel the airflow [4,5,38]. These effects were contrasted in three regimes: Benguela, transition, and Agulhas. Marine productivity depends on feedback between wind shear, cool SST, negative air-sea heat fluxes, and a shallow atmospheric boundary layer. In addition to wind-driven upwelling, the southeast-facing coast has deep shelf-edge currents of ~1 m/s. The downcoast mass deficit leads to the shoaling of the thermocline [16], which sustains upwelling inside the Agulhas current.
The west coast of South Africa, like Chile and Peru [39], exhibited offshore transport in summer and weak longshore currents. Cold inshore SST prevailed under the South Atlantic high, characterized by an equatorward wind jet on the shelf edge. The south and east coasts also had more upwelling-favorable winds in summer due to the poleward shift of the subtropical ridge, but there were differences in vorticity. The western shelf had more cyclonic vorticity in summer; thus, offshore transport and vertical uplift were in phase. The southeastern shelf had more cyclonic vorticity in late winter, due to land breezes under the Mascarene high (cf. Figure 8e). Although transport and entrainment were out of phase, dynamic uplift by the Agulhas current (cf. Figure 2a,c) provided a year-round mechanism for nutrification over the shelf, aided by discharges from the Tugela River 29.5S, 31E to the Fish River 33S, 28E (cf. arrows in Figure 2a).
Statistical methods addressed the annual cycle, intraseasonal pulsing, and interannual forcing. Daily time series of potential wind curl or vorticity exhibited cyclonic pulses at 4- to 11-day intervals due to the eastward passage of marine highs and coastal lows (cf. Figure 4c). Offshore transport and entrainment, coupled with continental shelf waves and longshore currents, sustained upwelling of ~5 m/day for brief spells (cf. Figure 7b). Nearshore phytoplankton blooms (from satellite chlorophyll) crest in spring and autumn, especially when marine high-pressure cells surround the coast and generate upwelling-favorable westward airflow and currents with cyclonic vorticity, as noted elsewhere [40,41,42,43].
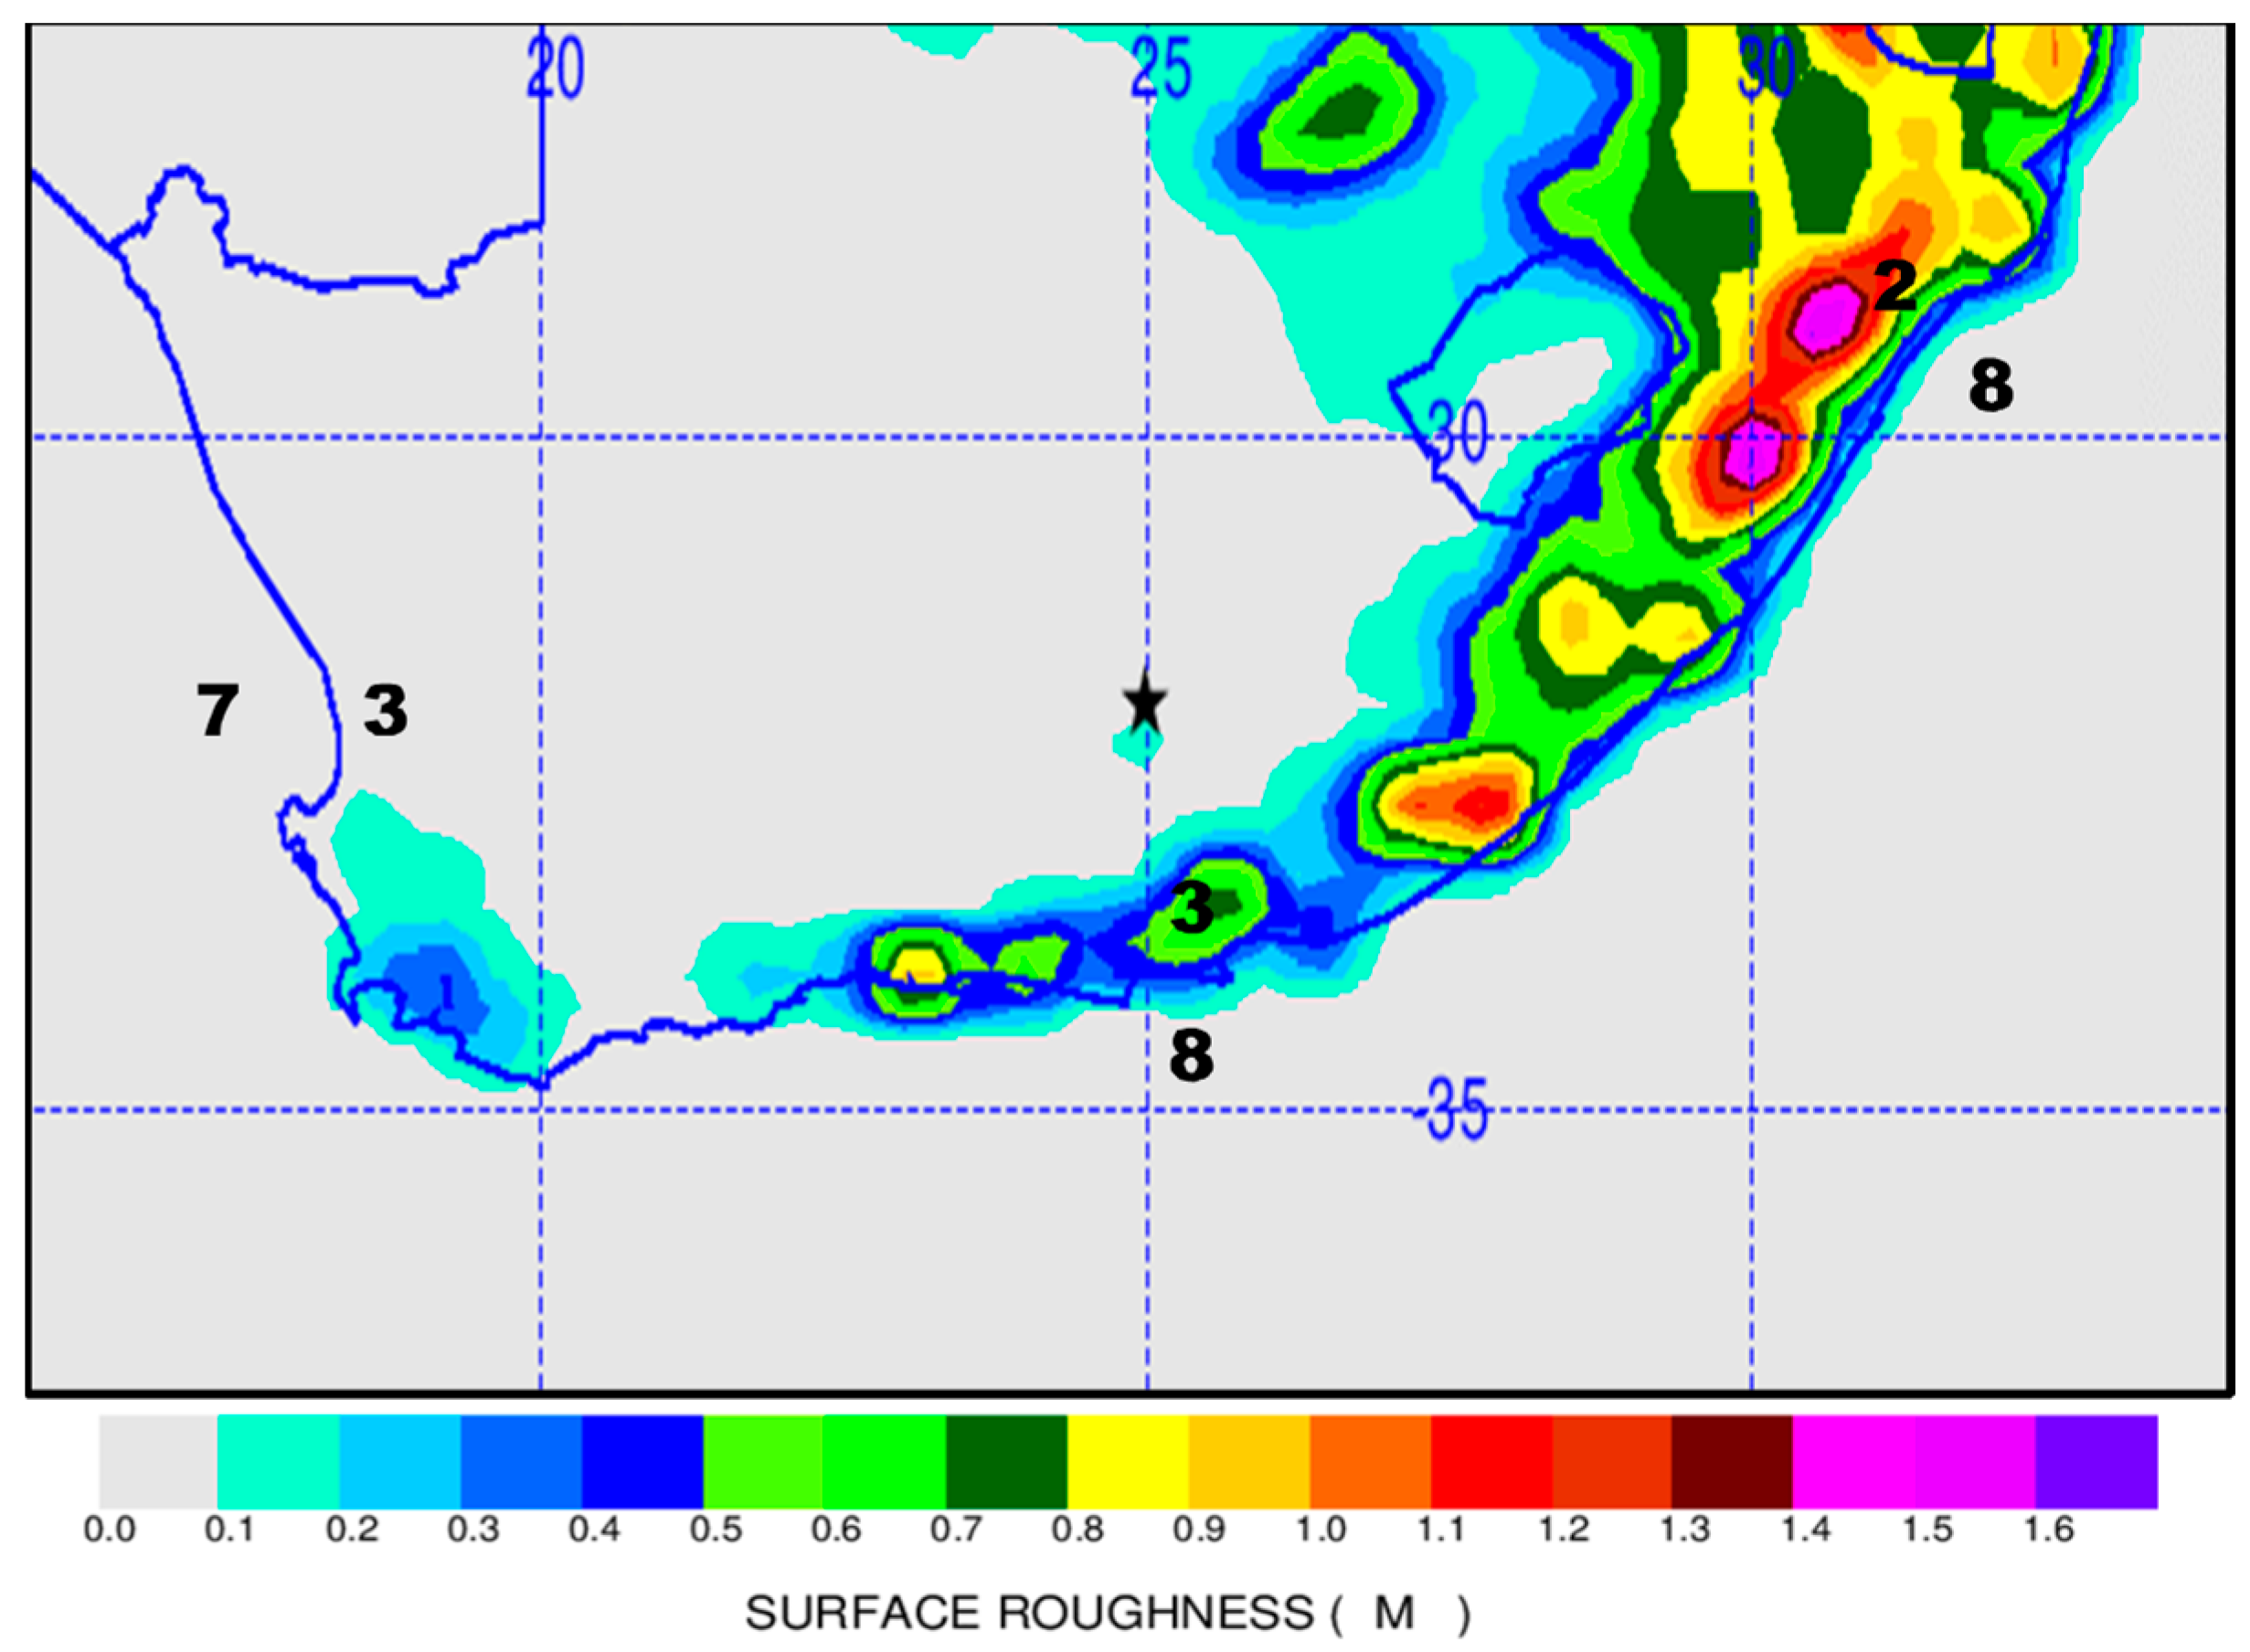
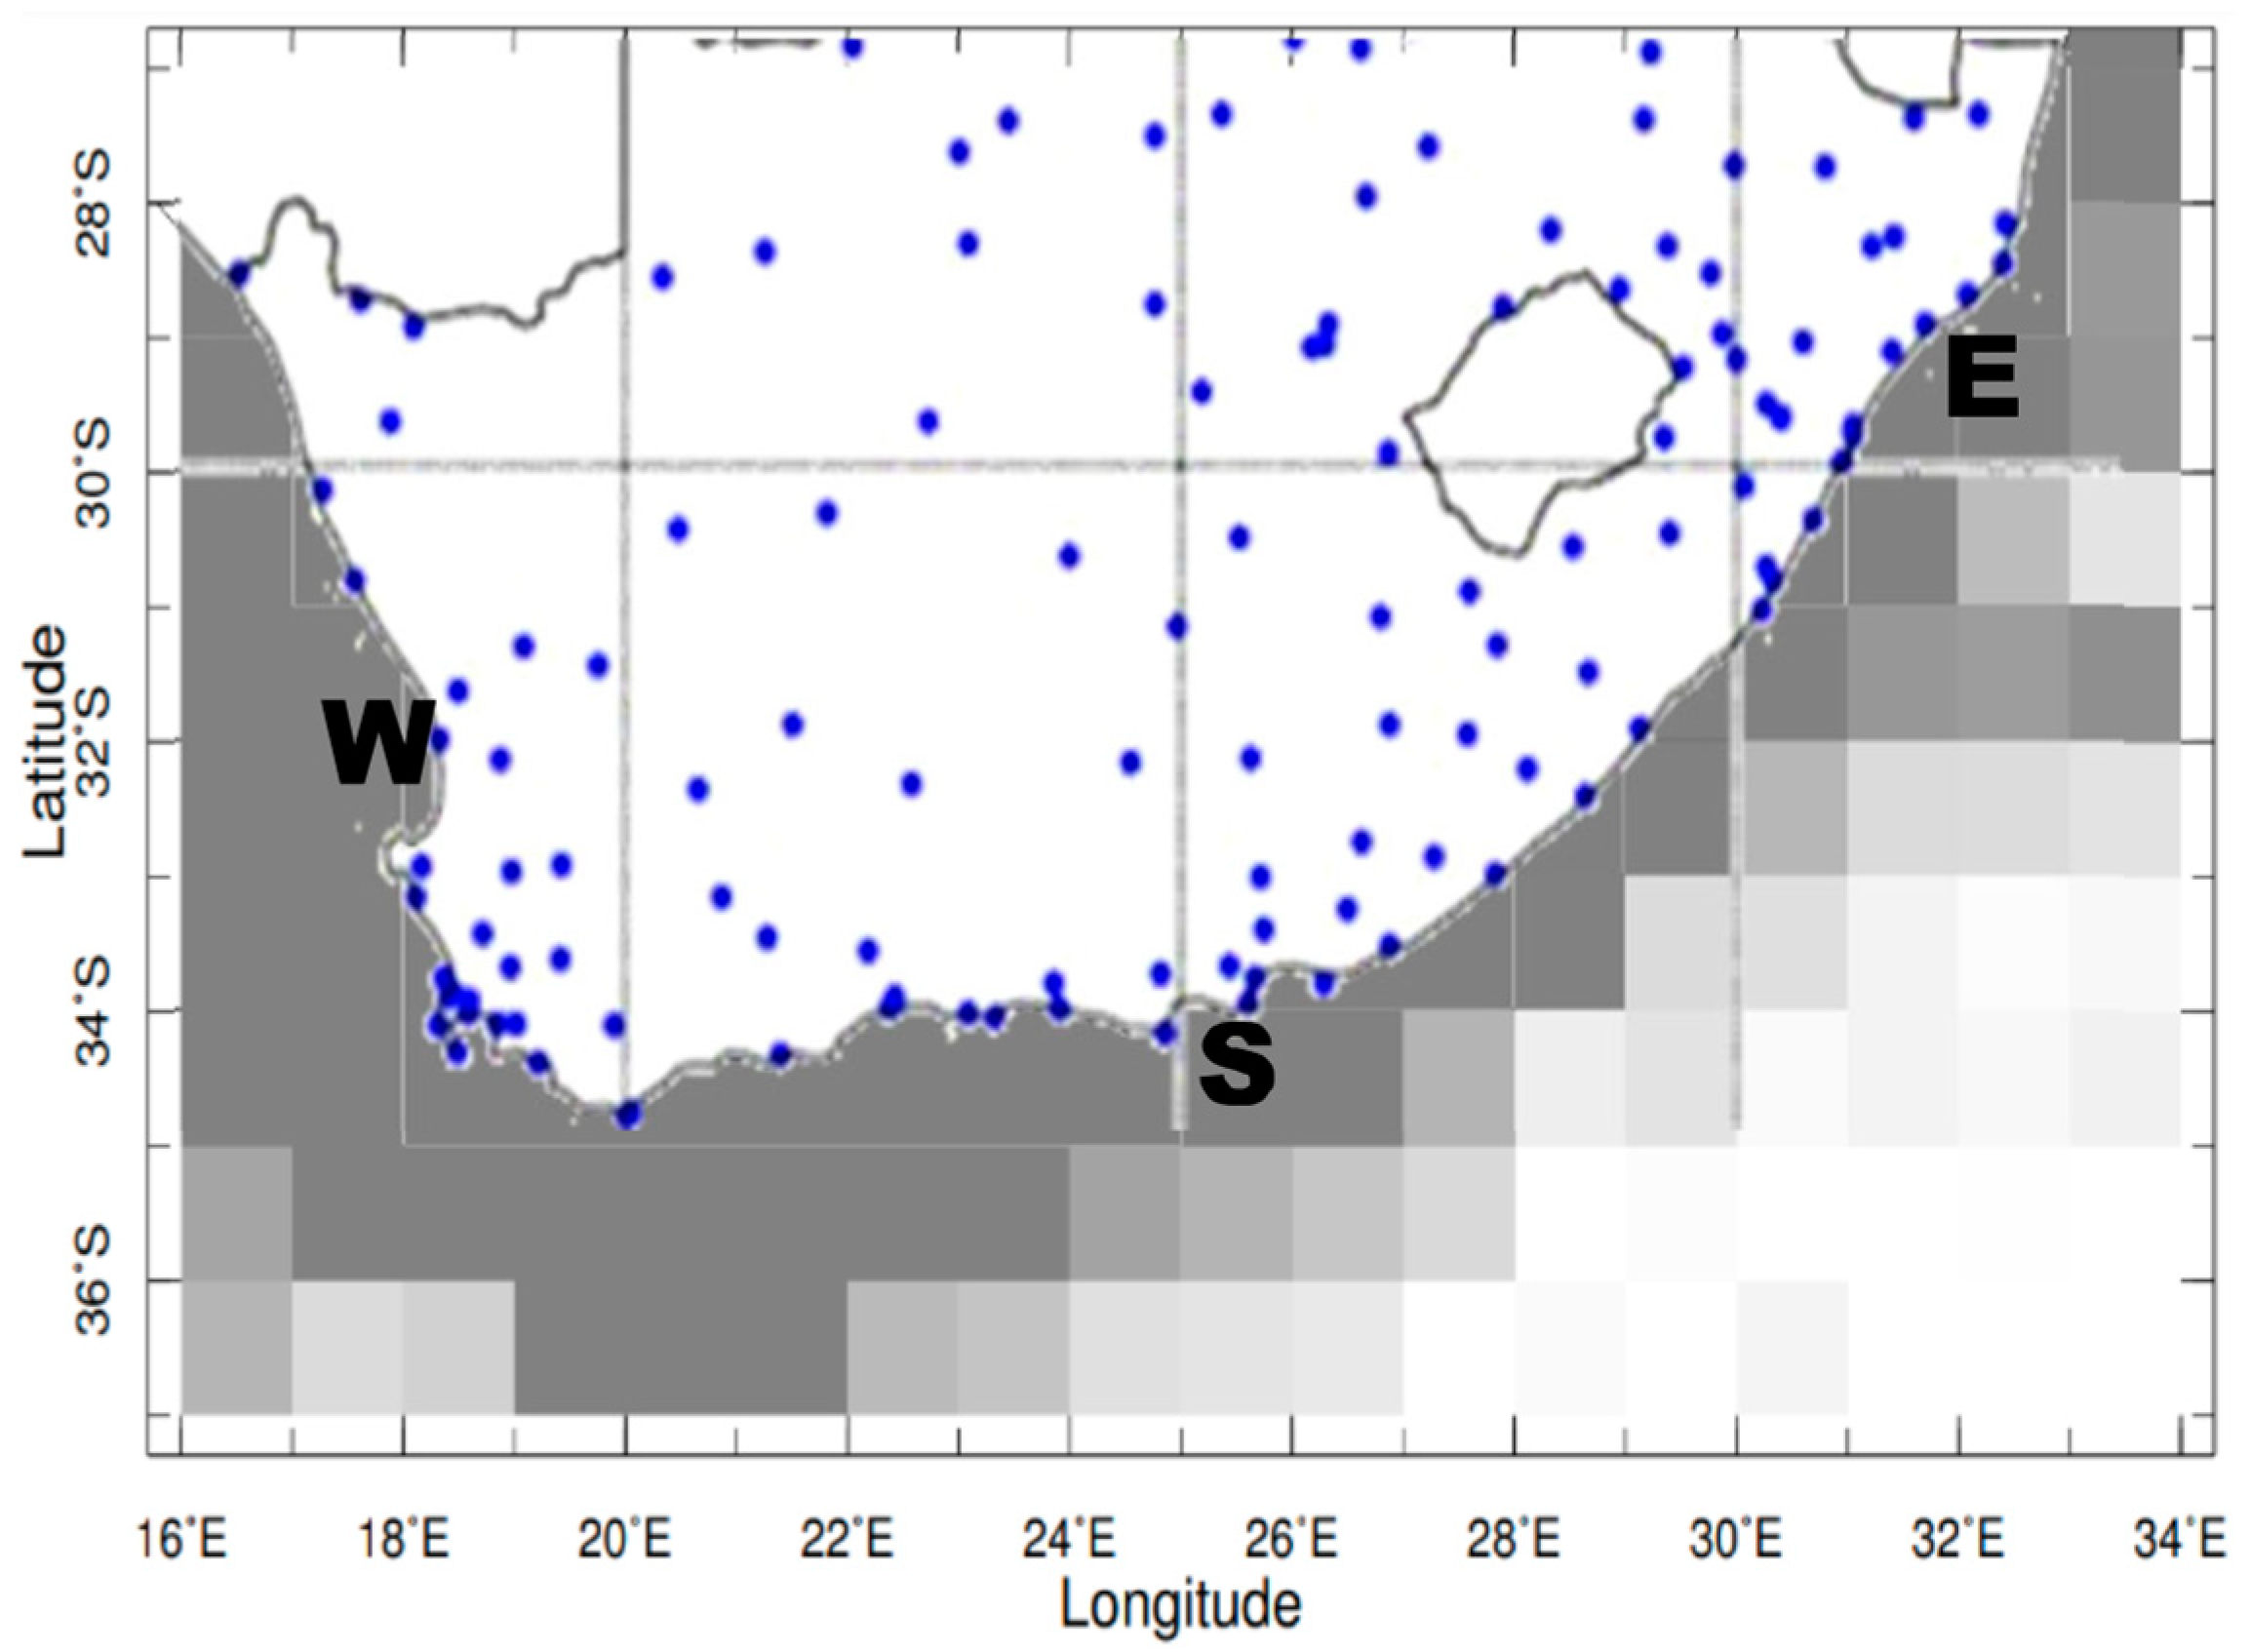
New findings here derive from the analysis of potential wind vorticity over the coast, where significant roughness (Figure A1) induces wind shadows that cover the inner shelf under easterly airflow, as in [44]. Embayments downstream of capes have mean annual longshore winds less than half the shelf edge, e.g., 3 vs. 8 m/s. The coastal plains and inner shelf are well observed (Figure A2) and coupled data assimilation builds confidence in wind derivatives that would not be possible with satellite-only products. South Africa’s convex mountainous coastline generates cyclonic wind vorticity that extends ~50 km offshore (cf. Figure 1a). Another new finding is that thermal gradients over the coastal plains instill ~3 m/s land–sea breezes that push and pull the longshore airflow across the shelf. Ekman pumping is strengthened at night, and further supported by inertial oscillations aligned to the diurnal cycle.
This work has, for the first time, revealed that South Africa is uniquely endowed with three overlapping mechanisms that sustain upwelling along the entire coastline. Amongst those, cyclonic potential vorticity prevails due to the frequent passage of coastal lows that initiate downslope airflows. No other coastal upwelling zone has this feature as a mean condition for Ekman pumping over the shelf. Further work will use HYCOM ocean reanalysis and local buoy data to understand the shelf response to these phenomena. As global warming expands the subtropical ridge poleward [45], upwelling-favorable easterly winds could become more frequent.

Funding

This research received no prior funding.

Institutional Review Board Statement

Not applicable.

Informed Consent Statement

Not applicable.

Data Availability Statement

A spreadsheet is available on request.

Acknowledgments

The author receives outcome-based support from the South African Dept. of Higher Education via the University of Zululand. Websites used to extract and analyze data include Climate Explorer KNMI, CoastWatch-Erddap, IRI Climate Library, NASA-Giovanni, NOAA Ready ARL, Univ. Hawaii APDRC, and Univ. Wyoming Radiosonde.

Conflicts of Interest

The author declares no conflict of interest.

Appendix A

Figure A1. Static surface roughness length (CFS2) quantifying the undulating nature of South Africa’s coastal mountains that induce wind shadows. Labels refer to mean coast and shelf-edge wind (m/s).
Coasts 04 00032 g0a1
Figure A2. In situ data density of ships (grey shaded 10–100/month/degree) and automatic weather stations (blue dots) operationally reporting winds; key areas are labeled.
Coasts 04 00032 g0a2

References

  1. Burk, S.D.; Thompson, W.T. The summertime low-level jet and marine boundary layer structure along the California coast. Mon. Weather Rev. 1996, 124, 668–686. [Google Scholar] [CrossRef]
  2. Rogerson, A.M. Trans-critical flows in the coastal marine atmospheric boundary layer. J. Atmos. Sci. 1999, 56, 2761–2779. [Google Scholar] [CrossRef]
  3. Edwards, K.A.; Rogerson, A.M.; Winant, C.D.; Rogers, D.P. Adjustment of the marine atmospheric boundary layer to a coastal cape. J. Atmos. Sci. 2001, 58, 1511–1528. [Google Scholar] [CrossRef]
  4. Perlin, N.; Skyllingstad, E.D.; Samelson, R.M. Coastal atmospheric circulation around an idealized cape during wind-driven upwelling studied from a coupled ocean–atmosphere model. Mon. Weather Rev. 2011, 139, 809–829. [Google Scholar] [CrossRef]
  5. Enriquez, A.G.; Friehe, C.A. Effects of wind stress and wind stress curl variability on coastal upwelling. J. Phys. Oceanogr. 1995, 25, 1651–1671. [Google Scholar] [CrossRef]
  6. Bielli, S.; Barbour, P.L.; Samelson, R.M.; Skyllingstad, E.; Wilczak, J. Numerical study of the diurnal cycle along the central Oregon coast during summertime northerly flow. Mon. Weather Rev. 2002, 130, 992–1008. [Google Scholar] [CrossRef]
  7. Castelao, R.; Barth, J.A. The role of wind stress curl in jet separation at a cape. J. Phys. Oceanogr. 2007, 37, 2652–2671. [Google Scholar] [CrossRef]
  8. Skyllingstad, E.D.; Samelson, R.M.; Mahrt, L.; Barbour, P. A numerical modeling study of warm offshore flow over cool water. Mon. Weather Rev. 2005, 133, 345–361. [Google Scholar] [CrossRef]
  9. Song, Q.; Chelton, D.B.; Esbensen, S.K.; Thum, N.; O’Neill, L.W. Coupling between sea surface temperature and low-level winds in mesoscale numerical models. J. Clim. 2009, 22, 146–164. [Google Scholar] [CrossRef]
  10. Jury, M.R.; Goschen, W. Inter-relationships between physical ocean-atmosphere variables over the shelf south of South Africa from reanalysis products. Cont. Shelf Res. 2020, 202, 104135. [Google Scholar] [CrossRef]
  11. Bakun, A.; Nelson, C.S. The seasonal cycle of wind stress curl in subtropical eastern boundary current regions. J. Phys. Oceanogr. 1991, 21, 1815–1834. [Google Scholar] [CrossRef]
  12. Rueda-Roa, D.T.; Muller-Karger, F.E. The southern Caribbean upwelling system: Sea surface temperature, wind forcing and chlorophyll concentration patterns. Deep Sea Res. I 2013, 78, 102–114. [Google Scholar] [CrossRef]
  13. Bordbar, M.H.; Mohrholz, V.; Schmidt, M. The relation of wind-driven coastal and offshore upwelling in the Benguela System. J. Phys. Oceanogr. 2021, 51, 3117–3133. [Google Scholar] [CrossRef]
  14. Holton, J.R. An Introduction to Dynamic Meteorology, 3rd ed.; Academic Press: New York, NY, USA, 1992; p. 511. [Google Scholar]
  15. Schumann, E.H.; Brink, K.H. Coastal trapped waves off the coast of South Africa: Generation, propagation and current structures. J. Phys. Oceanogr. 1990, 20, 1206–1218. [Google Scholar] [CrossRef]
  16. Lutjeharms, J.R.E.; Cooper, J.; Roberts, M.J. Upwelling at the inshore edge of the Agulhas Current. Cont. Shelf Res. 2000, 20, 737–761. [Google Scholar] [CrossRef]
  17. Lutjeharms, J.R.E. The Agulhas Current; Springer: Berlin/Heidelberg, Germany, 2006; p. 329. [Google Scholar]
  18. Goschen, W.S.; Bornman, T.G.; Deyzel, S.H.P.; Schumann, E.H. Coastal upwelling on the far eastern Agulhas Bank associated with large meanders in the Agulhas Current. Cont. Shelf Res. 2015, 101, 34–46. [Google Scholar] [CrossRef]
  19. DeRuijter, W.P.M.; VanLeeuwen, J.P.; Lutjeharms, J.R.E. Generation and evolution of Natal pulses: Solitary meanders in the Agulhas Current. J. Phys. Oceanogr. 1999, 29, 3043–3055. [Google Scholar] [CrossRef]
  20. Tsugawa, M.; Hasumi, H. Generation and growth mechanism of the Natal Pulse. J. Phys. Oceanogr. 2010, 40, 1597–1612. [Google Scholar] [CrossRef]
  21. Jury, M.R. Modulation of currents near Durban. Reg. Stud. Mar. Sci. 2018, 18, 208–218. [Google Scholar] [CrossRef]
  22. Behringer, D.W. The Global Ocean Data Assimilation System (GODAS) at NCEP. In Proceedings of the 11th Symposium on Integrated Observing and Assimilation Systems for the Atmosphere, Oceans, and Land Surface, San Antonio, TX, USA, 14–18 January 2007. [Google Scholar]
  23. Carton, J.A.; Chepurin, G.A.; Chen, L. SODA-3 a new ocean climate reanalysis. J. Clim. 2018, 31, 6967–6983. [Google Scholar] [CrossRef]
  24. Saha, S.; Moorthi, S.; Wu, X.; Wang, J.; Nadiga, S.; Tripp, P.; Behringer, D.; Hou, Y.-T.; Chuang, H.-Y.; Iredell, M.; et al. The NCEP climate forecast system version 2. J. Clim. 2014, 27, 2185–2208. [Google Scholar] [CrossRef]
  25. Hersbach, H.; Bell, B.; Berrisford, P.; Hirahara, S.; Horányi, A.; Muñoz-Sabater, J.; Nicolas, J.; Peubey, C.; Radu, R.; Schepers, D.; et al. The ERA5 global reanalysis. Q. J. R. Meteol. Soc. 2020, 146, 1999–2049. [Google Scholar] [CrossRef]
  26. Gelaro, R.; McCarty, W.; Suárez, M.J.; Todling, R.; Molod, A.; Takacs, L.; Randles, C.A.; Darmenov, A.; Bosilovich, M.G.; Reichle, R.; et al. The modern-era retrospective analysis for research and applications, version 2 (MERRA-2). J. Clim. 2017, 30, 5419–5454. [Google Scholar] [CrossRef] [PubMed]
  27. Chin, T.M.; Vazquez-Cuervo, J.; Armstrong, E.M. A multi-scale high-resolution analysis of global sea surface temperature. Remote Sens. Environ. 2017, 200, 154–169. [Google Scholar] [CrossRef]
  28. O’Rielly, J.E.; Werdell, P.J. Chlorophyll algorithms for ocean color sensors. Remote Sens. Environ. 2019, 229, 32–47. [Google Scholar]
  29. Rossby, C.G. Planetary flow patterns in the atmosphere. Q. J. R. Meteorol. Soc. 1940, 66, 68–87. [Google Scholar] [CrossRef]
  30. Ertel, H. A new form of hydrodynamic vorticity. Meteorol. Z. 1942, 59, 277–281. [Google Scholar]
  31. Thorpe, A.J.; Volkert, H. Potential vorticity: A short history of its definitions and uses. Meteorol. Z. 1997, 6, 275–280. [Google Scholar] [CrossRef]
  32. Cao, J.; Xu, Q. Computing hydrostatic potential vorticity in terrain-following coordinates. Mon. Weather Rev. 2011, 139, 2955–2961. [Google Scholar] [CrossRef]
  33. Legeais, J.-F.; Ablain, M.; Zawadzki, L.; Zuo, H.; Johannessen, J.A.; Scharffenberg, M.G.; Fenoglio-Marc, L.; Fernandes, M.J.; Andersen, O.B.; Rudenko, S.; et al. An improved and homogeneous altimeter sea level record from the ESA climate change initiative. Earth Syst. Sci. Data 2018, 10, 281–301. [Google Scholar] [CrossRef]
  34. Rueda-Roa, D.T.; Ezer, T.; Muller-Karger, F.E. Description and mechanisms of the mid-year upwelling in the southern Caribbean Sea from remote sensing and local data. J. Mar. Sci. Eng. 2018, 6, 36. [Google Scholar] [CrossRef]
  35. Jacox, M.G.; Edwards, C.A. Upwelling source depth in the presence of nearshore wind stress curl. J. Geophys. Res. 2012, 117, C05008. [Google Scholar] [CrossRef]
  36. Söderberg, S.; Tjernström, M. Supercritical channel flow in the coastal atmospheric boundary layer: Idealized numerical simulations. J. Geophys. Res. 2001, 106, 17811–17830. [Google Scholar] [CrossRef]
  37. Pielke, R.A.; Segal, M. Mesoscale circulations forced by differential terrain heating. In Mesoscale Meteorology and Forecasting; Ray, P., Ed.; AMS: Providence, RI, USA, 1986; pp. 516–548. [Google Scholar]
  38. Koracin, D.R.; Dorman, C.E.; Dever, E.P. Coastal perturbations of marine layer wind stress and wind stress curl along California and Baja California in June 1999. J. Phys. Ocean. 2004, 34, 1152–1173. [Google Scholar] [CrossRef]
  39. Bravo, L.; Ramos, M.; Astudillo, O.; DeWitte, B.; Goubanova, K. Seasonal variability of the Ekman transport and pumping in the upwelling system off central-northern Chile (30S) based on a high-resolution atmospheric regional model (WRF). Ocean Sci. 2016, 12, 1049–1065. [Google Scholar] [CrossRef]
  40. Capet, X.J.; Marchesiello, P.; McWilliams, J.C. Upwelling response to coastal wind profiles. Geophys. Res. Lett. 2004, 31, L13311. [Google Scholar] [CrossRef]
  41. Dever, E.P.; Dorman, C.E.; Largier, J.L. Surface boundary-layer variability off Northern California, during upwelling. Deep. Sea Res. II Top. Stud. Oceanogr. 2006, 53, 2887–2905. [Google Scholar] [CrossRef]
  42. Song, H.; Miller, A.J.; Cornuelle, B.D.; DiLorenzo, E. Changes in upwelling and its water sources in the California Current system driven by different wind forcing. Dyn. Atmos. Oceans 2011, 52, 170–191. [Google Scholar] [CrossRef]
  43. Brandt, P.; Bordbar, M.H.; Coelho, P.; Koungue, R.A.; Körner, M.; Lamont, T.; Lübbecke, J.F.; Mohrholz, V.; Prigent, A.; Roch, M.; et al. Physical drivers of southwest African coastal upwelling and its response to climate variability and change. In Sustainability of Southern African Ecosystems under Global Change, Ecol. Studies, 248; von Maltitz, G.P., Ed.; Springer: Berlin/Heidelberg, Germany, 2024. [Google Scholar] [CrossRef]
  44. Shan, S.; Sheng, J. Numerical Study of Topographic Effects on Wind-Driven Coastal Upwelling on the Scotian Shelf. J. Mar. Sci. Eng. 2022, 10, 497. [Google Scholar] [CrossRef]
  45. Jury, M.R. Marine climate change over the eastern Agulhas Bank of South Africa. Ocean. Sci. 2020, 16, 1529–1544. [Google Scholar] [CrossRef]
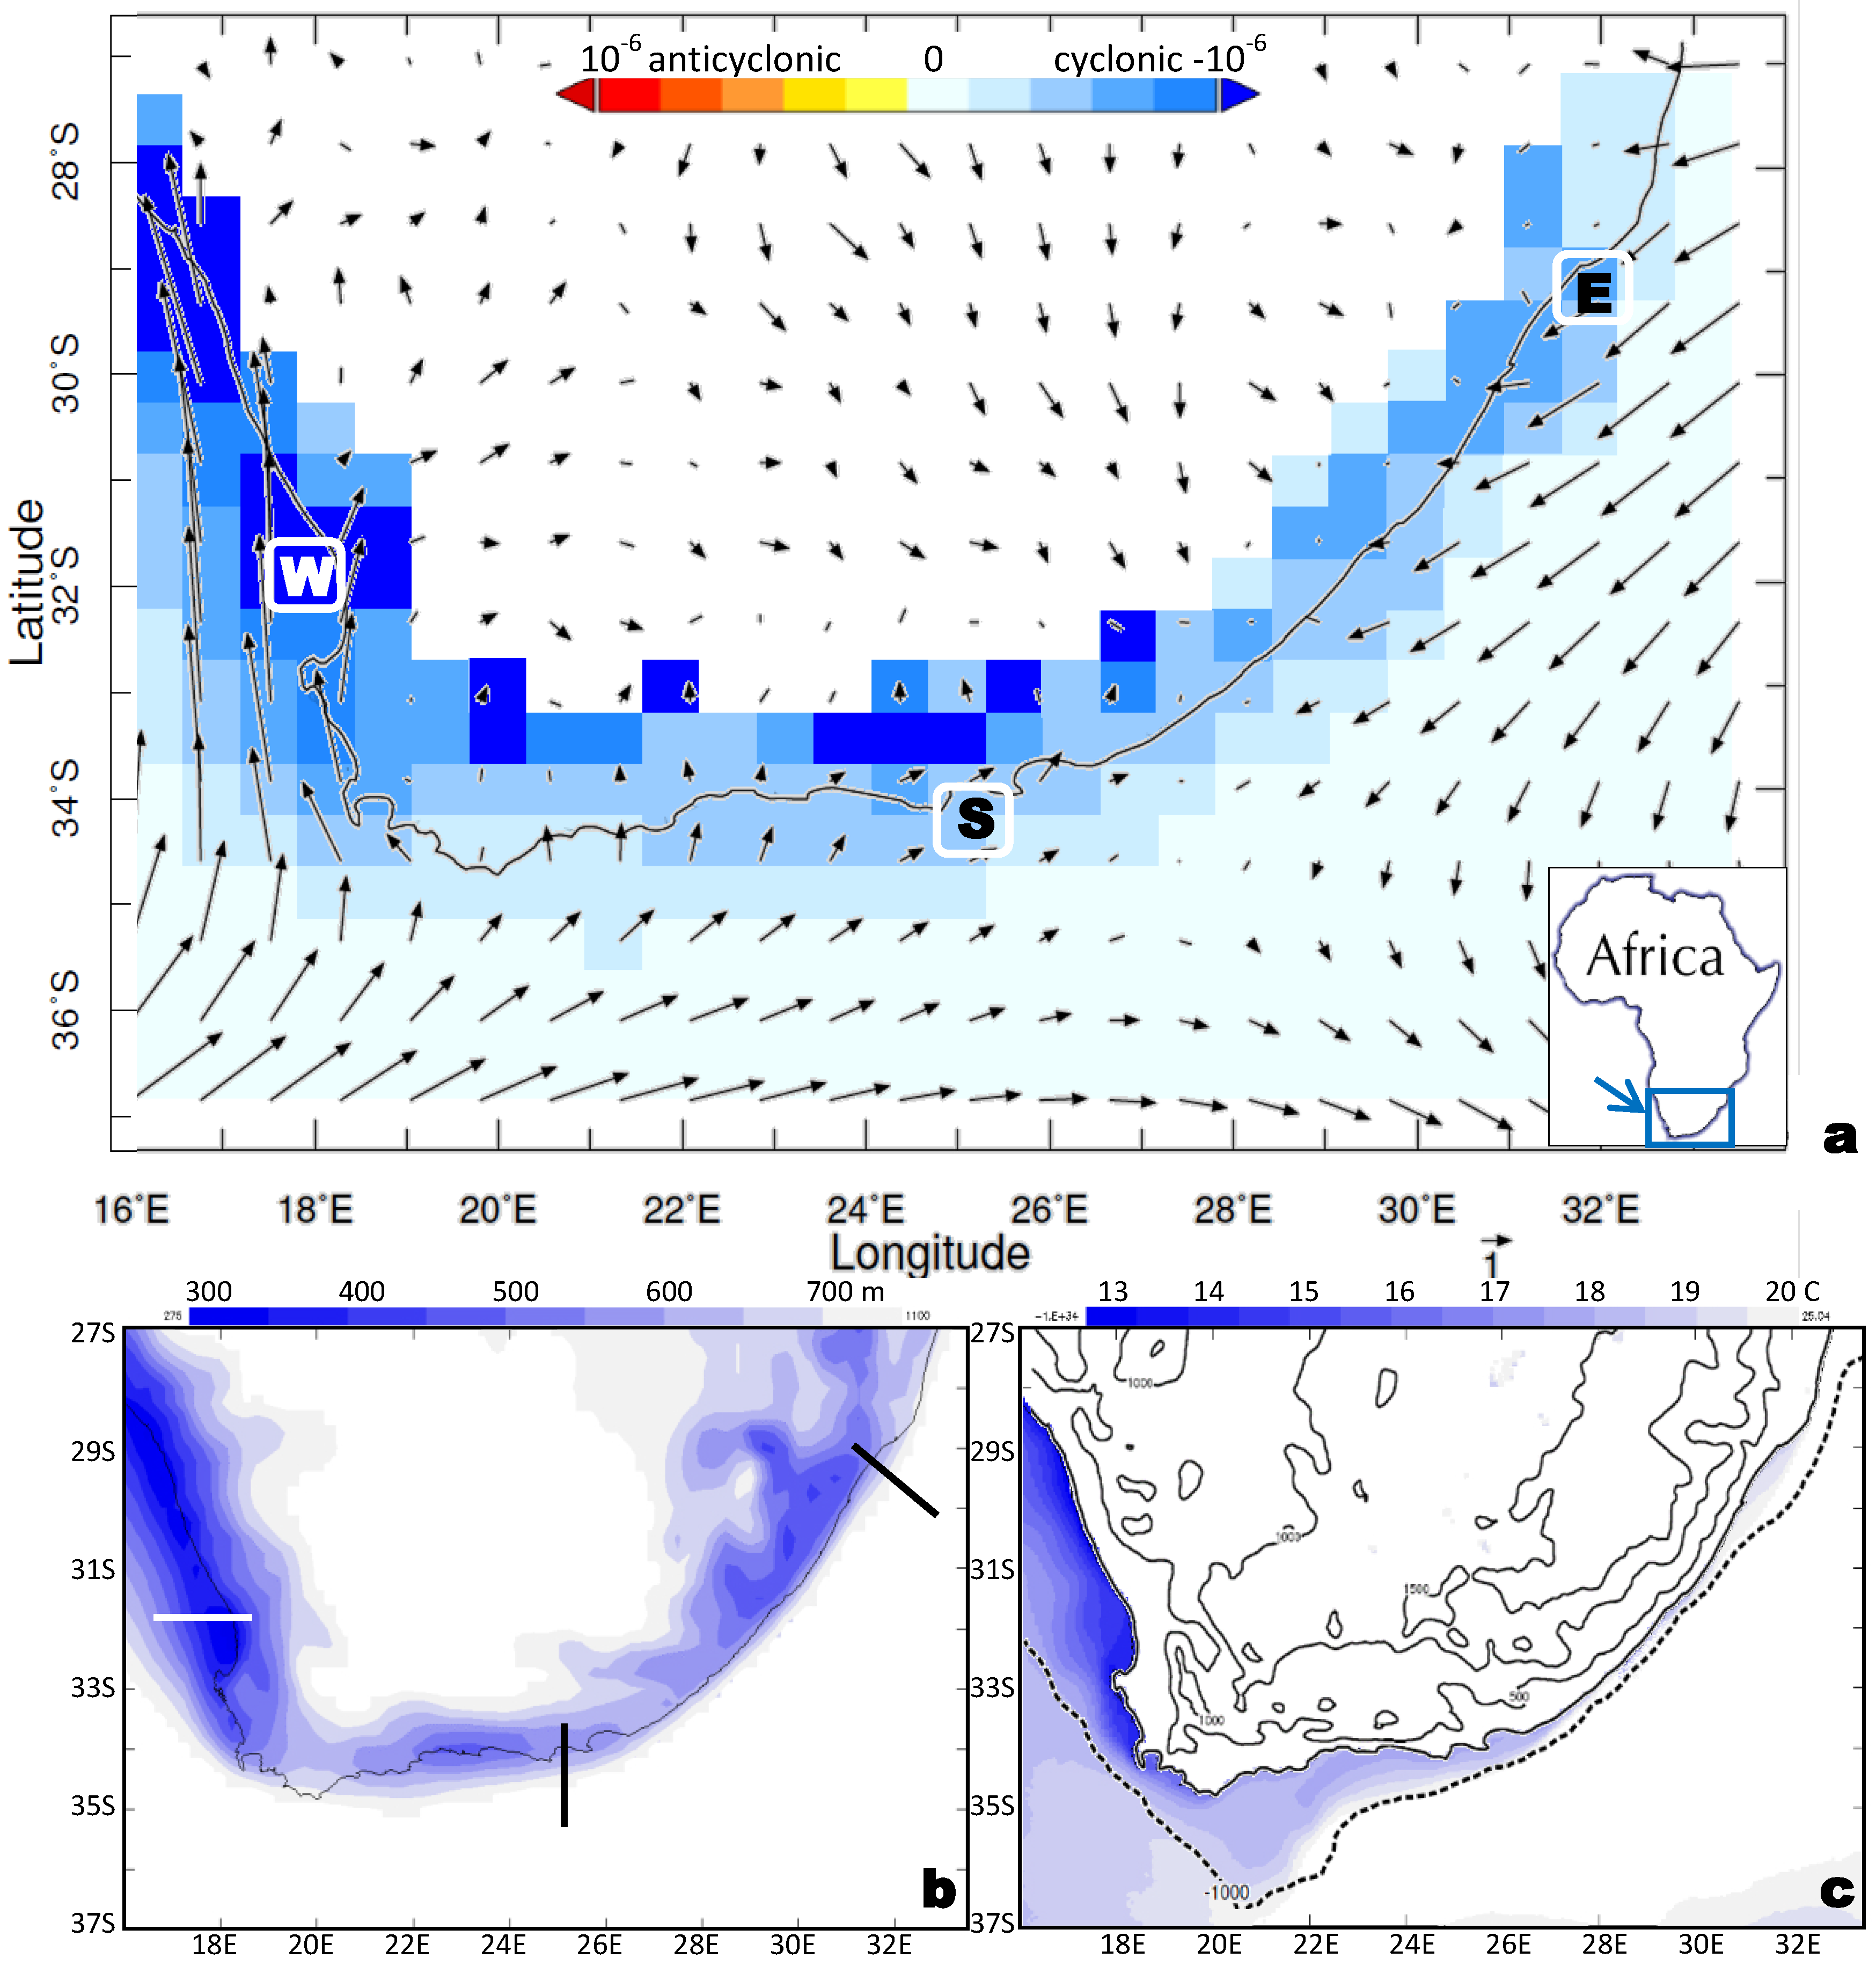
Figure 1. Mean maps of: (a) MERRA2 975 hPa potential vorticity (10−6 K·m2/kg·s) and wind vectors (largest 7 m/s) with 3 key areas (boxed), (b) ERA5 atmospheric boundary layer height <700 m and section lines, (c) satellite SST < 19 °C with topography and shelf edge, all averaged 2000–2021. Inset in (a), lower right, identifies the study area comprising the southern tip of Africa.
Coasts 04 00032 g001
Figure 2. (a) GODAS-SODA3 vertical entrainment (shaded m/day) and currents (largest vector 0.8 m/s) in 1–200 m layer. Depth section of cross-shore ocean circulation on (b) 32 S (west) and (c) 25.25 E (south) with longshore current dashed, and smoothed shelf profile; all averaged 2000–2021. Annual river discharge >500 m3/s is shown by blue arrows in (a) together with capes; vertical motions in (b,c) are exaggerated 100-fold.
Coasts 04 00032 g002
Figure 3. Monthly time series in each area (top to bottom: W, S, E) of MERRA2 potential vorticity (black line), the sum of daily ERA5 upwelling-favorable wind stress (thin red line), and EC offshore sea-slope representing the longshore current (thick aqua line, lower). The vertical motion over the shelf (WE) is derived from theoretical influence, with y-axis units of m/day (+upward). Legend: -vort refers to cyclonic wind stress curl, which is upwelling favorable.
Coasts 04 00032 g003
Figure 4. (a) Mean annual cycle of coastal upwelling from the sum of daily longshore wind stress per area and all-coast chlorophyll. (b) Lag cross-correlation of MERRA2 daily potential vorticity from one area to the next. (c) Lag auto-correlation of daily potential vorticity time series in each area in January 2016–December 2018, where N = 1096, 90% confidence (blue), and arrows indicate significant pulsing. (d) Simultaneous correlation of daily vorticity time series with S.L. air pressure field, where icons highlight marine high/coastal low per area (left–right): west, south, east.
Coasts 04 00032 g004
Figure 5. The sequence of cyclonic cases transiting from west to south coast. Height section of ERA5 longshore wind (shaded) and cross-shore airflow (largest vectors 2 m/s) on (a) 32 S west 10 January 2016, and (b) 25.25 E south 12 January 2016. The rotational arrow highlights cyclonic vorticity, with upstream topography overlain and vertical atmospheric motion exaggerated 30-fold. (c) CFS2 vertical motion W (m/day) and upwelling favorable wind +V, -U (m/s) at the two sites; with night indicated by grey shading lower and western 21:00 potential vorticity listed (10−6 K·m2/kg·s).
Coasts 04 00032 g005
Figure 6. Cyclonic case on the south coast: (a) map of 975 hPa winds (black vectors) and 850 hPa airflow (red streamlines) at 18:00 3 November 2018, with icons showing eastward movement of marine high and coastal low in days before/after; (b) skew-T radiosonde profile of temperature (red), dewpoint (green), wind (barbs) at Port Elizabeth airport 34 S, 25.6 E, 61 m (green triangle) at 12:00 3 November 2018, and (c) map on same date of daily SST (shaded) and wind (thin lines, m/s) increasing from 1 inshore to 11 offshore.
Coasts 04 00032 g006
Figure 7. Cyclonic case on the east coast: (a) plan and section view of 24 hourly ensemble Hysplit back-trajectories of near-surface airflow arriving at the east area on 26 September 2016. Hourly time series on 25–28 September at 29.25 S, 31.5 E of (b) CFS2 vertical entrainment (averaged 40–70 m) and surface wind stick vectors (−UV upwelling favorable), (c) satellite dynamic topography (ƞ) inshore/offshore, and S.L. air pressure, and (d) CFS2 air temperature, SST, and MERRA2 potential wind vorticity (bars, cyclonic upward), with times labeled.
Coasts 04 00032 g007
Figure 8. (ac) Box–whisker plots of the mean diurnal cycle of MERRA2 975 hPa potential vorticity per area. Maps of mean wind departures from all hours for (d) summer days 12:00–18:00, and (e) winter nights 00:00–06:00 h. Mean summer day (red) and winter night (blue) surface air temperature differentials along sections are listed.
Coasts 04 00032 g008
Figure 9. (a) Map of EOF-1 loading pattern for satellite chlorophyll and its monthly time score (inset). Regression of time score onto annual fields of (b) sea-level air pressure (Pa) and (c) net solar radiation (W/m2), 2000–2021.
Coasts 04 00032 g009
Table 1. Acronyms, reanalysis products, and approximate horizontal resolution.
AcronymName VersionHoriz. Res.
CFS2Coupled forecast system reanalysis v2, meteorology25 km
ECEuropean Centre satellite dynamic topography25 km
ERA5European Centre reanalysis v5, meteorology25 km
GODASGlobal Ocean Data Assimilation system (NOAA)50 km
MERRA2Modern Era Reanalysis for Research and Applications v250 km
MODISModerate Imaging Sensor, SST and chlorophyll10 km
SODA3Simple Ocean Data Assimilation v325 km
Table 2. Cross-correlation of monthly time series (Figure 3) per area, where the sign of vorticity and wind stress are altered to + upwelling favorable, and −SST anomalies reflect upwelling. Derivatives refer to slices normal to the coast, as indicated in Figure 1b.
West-VortƩ Stressy∂η/∂xSSTa
Ʃ stressy0.68   
∂η/∂x−0.040.10  
SSTa−0.22−0.230.07 
CHL0.290.300.01−0.17
South-vortƩ stressx∂η/∂ySSTa
Ʃ stressx−0.43   
∂η/∂y−0.110.25  
SSTa−0.16−0.16−0.08 
CHL−0.040.170.01−0.20
East-vortƩ stressn∂η/∂nSSTa
Ʃ stressn0.18   
∂η/∂n−0.120.05  
SSTa−0.10−0.33−0.28 
CHL0.180.01−0.02−0.03
Disclaimer/Publisher’s Note: The statements, opinions and data contained in all publications are solely those of the individual author(s) and contributor(s) and not of MDPI and/or the editor(s). MDPI and/or the editor(s) disclaim responsibility for any injury to people or property resulting from any ideas, methods, instructions or products referred to in the content.