
Hydrodynamic and Sediment Transport Patterns in the Minho and Douro Estuaries (NW Portugal) Based on ADCP Monitoring Data: Part 1-Tidal Sediment Exchanges


Abstract
:1. Introduction
2. Data and Methods
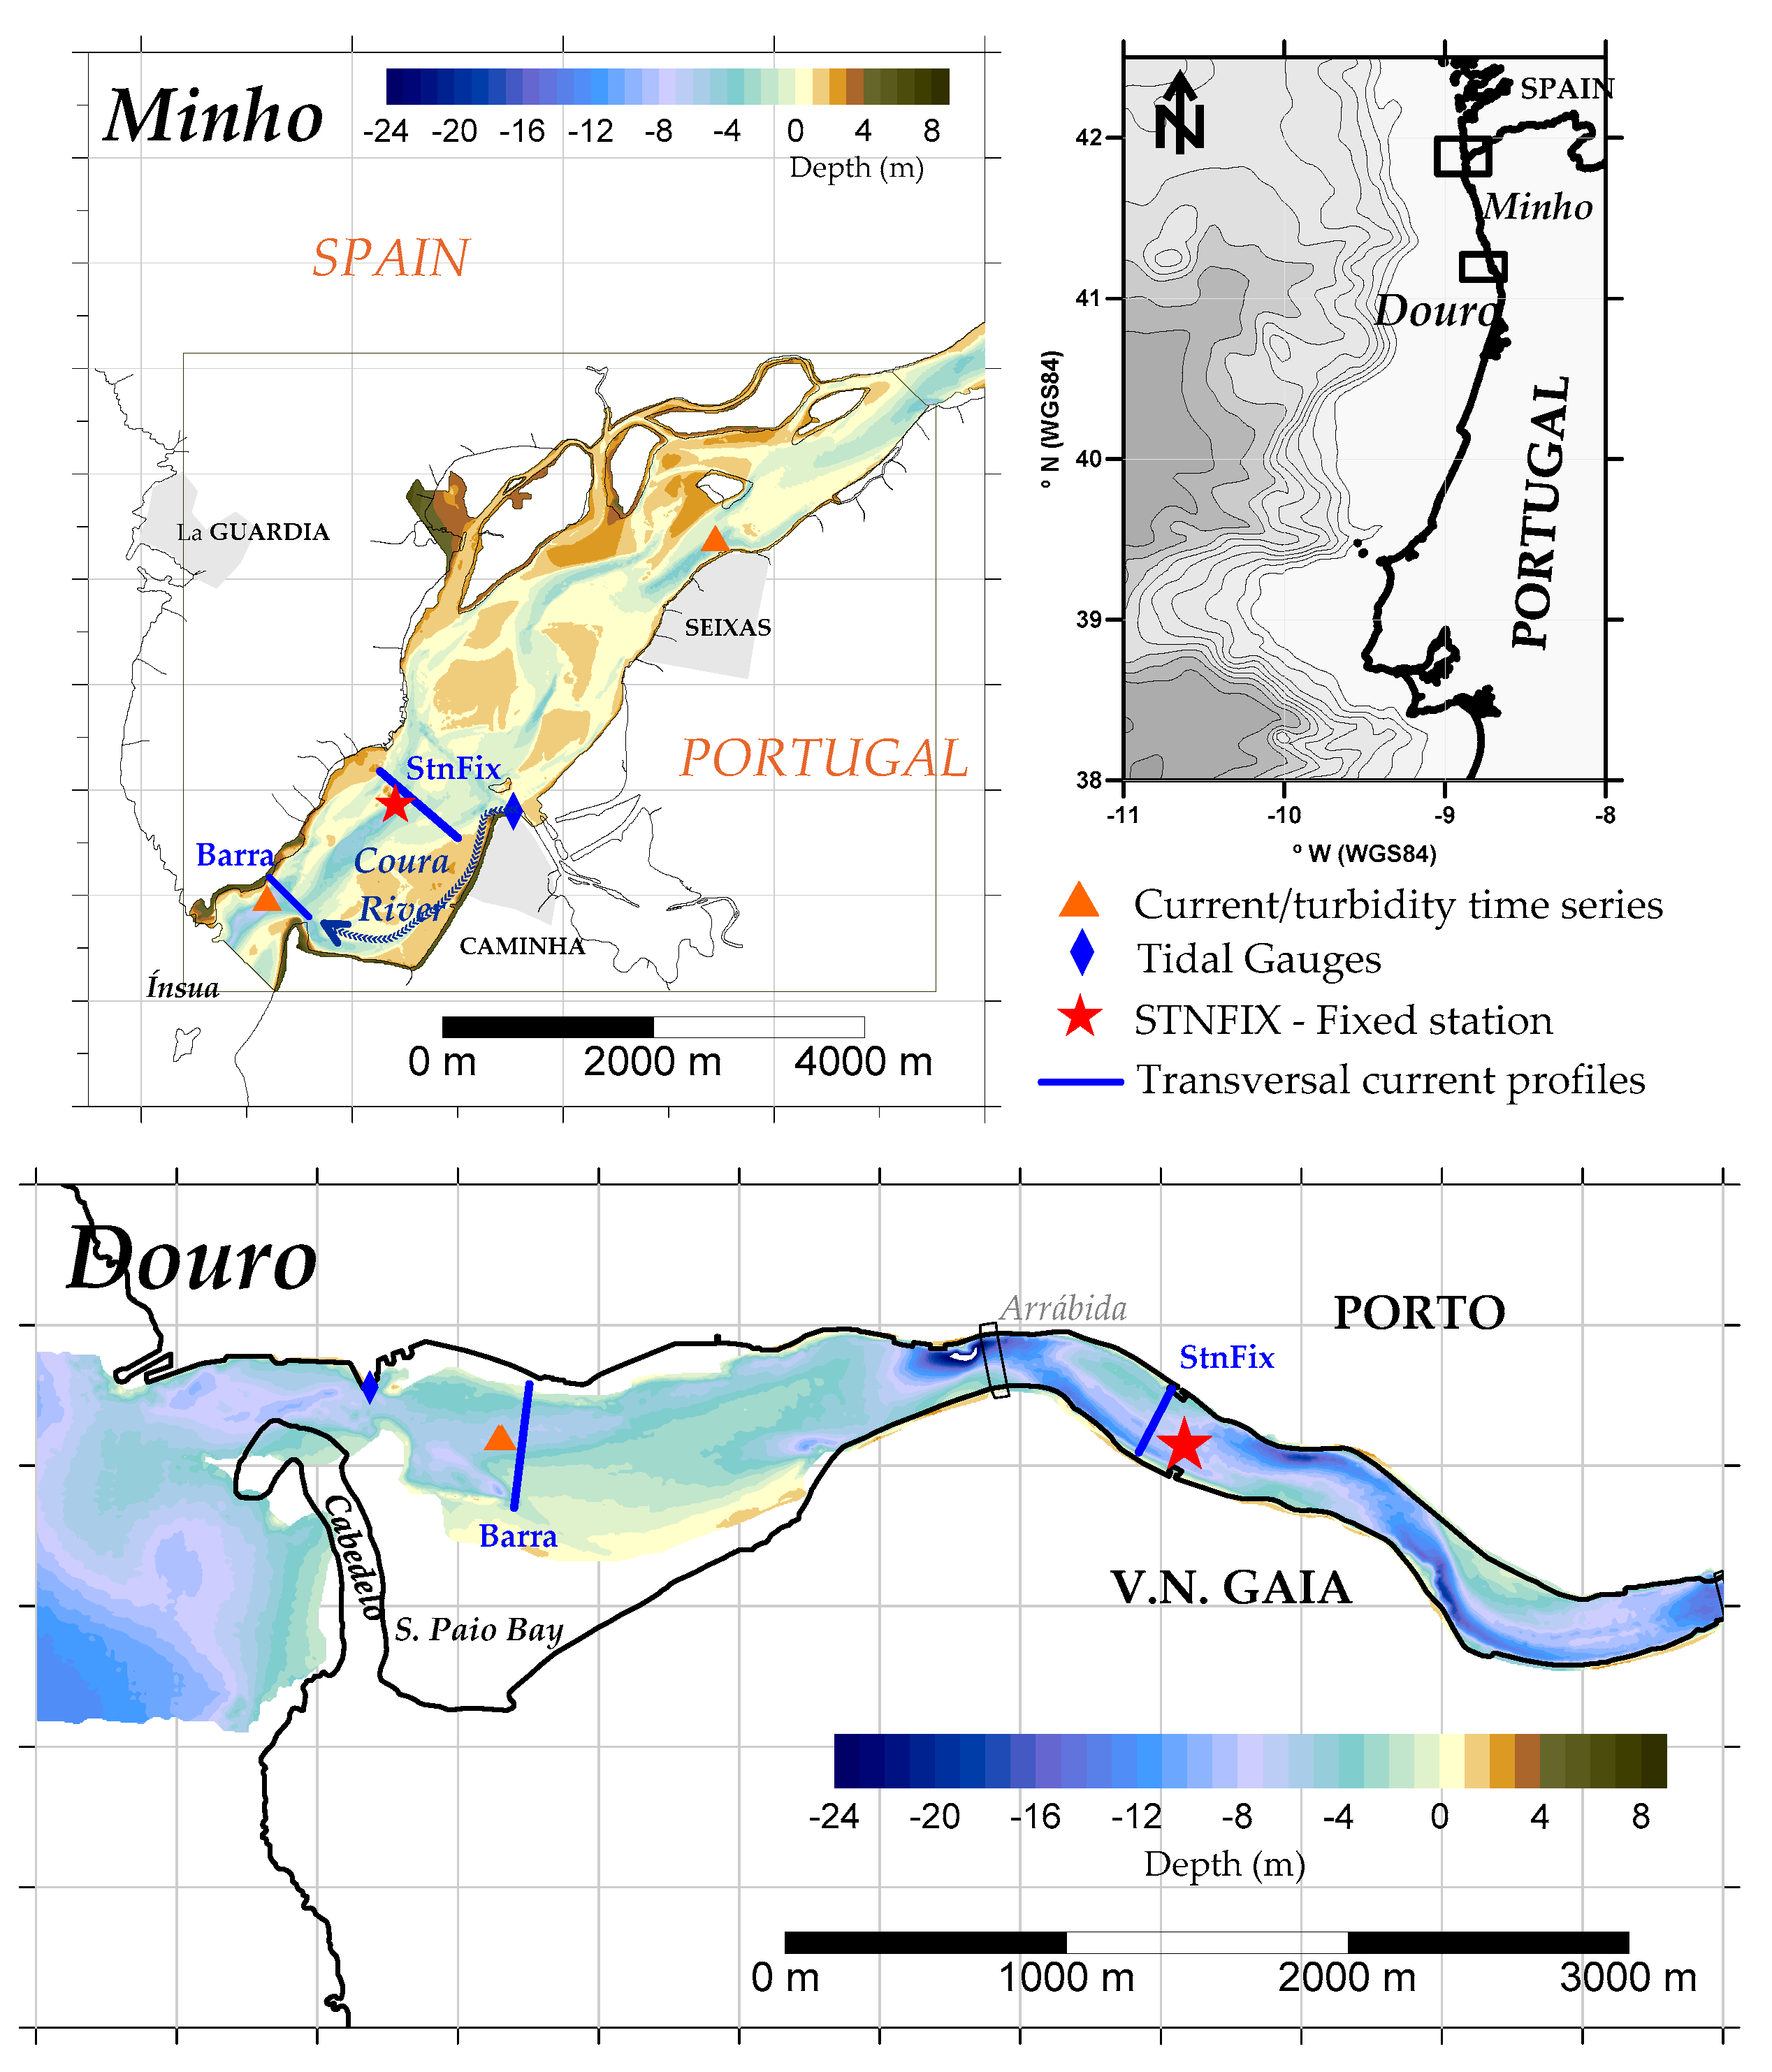
2.1. Study Area
2.2. Data Collection and Processing
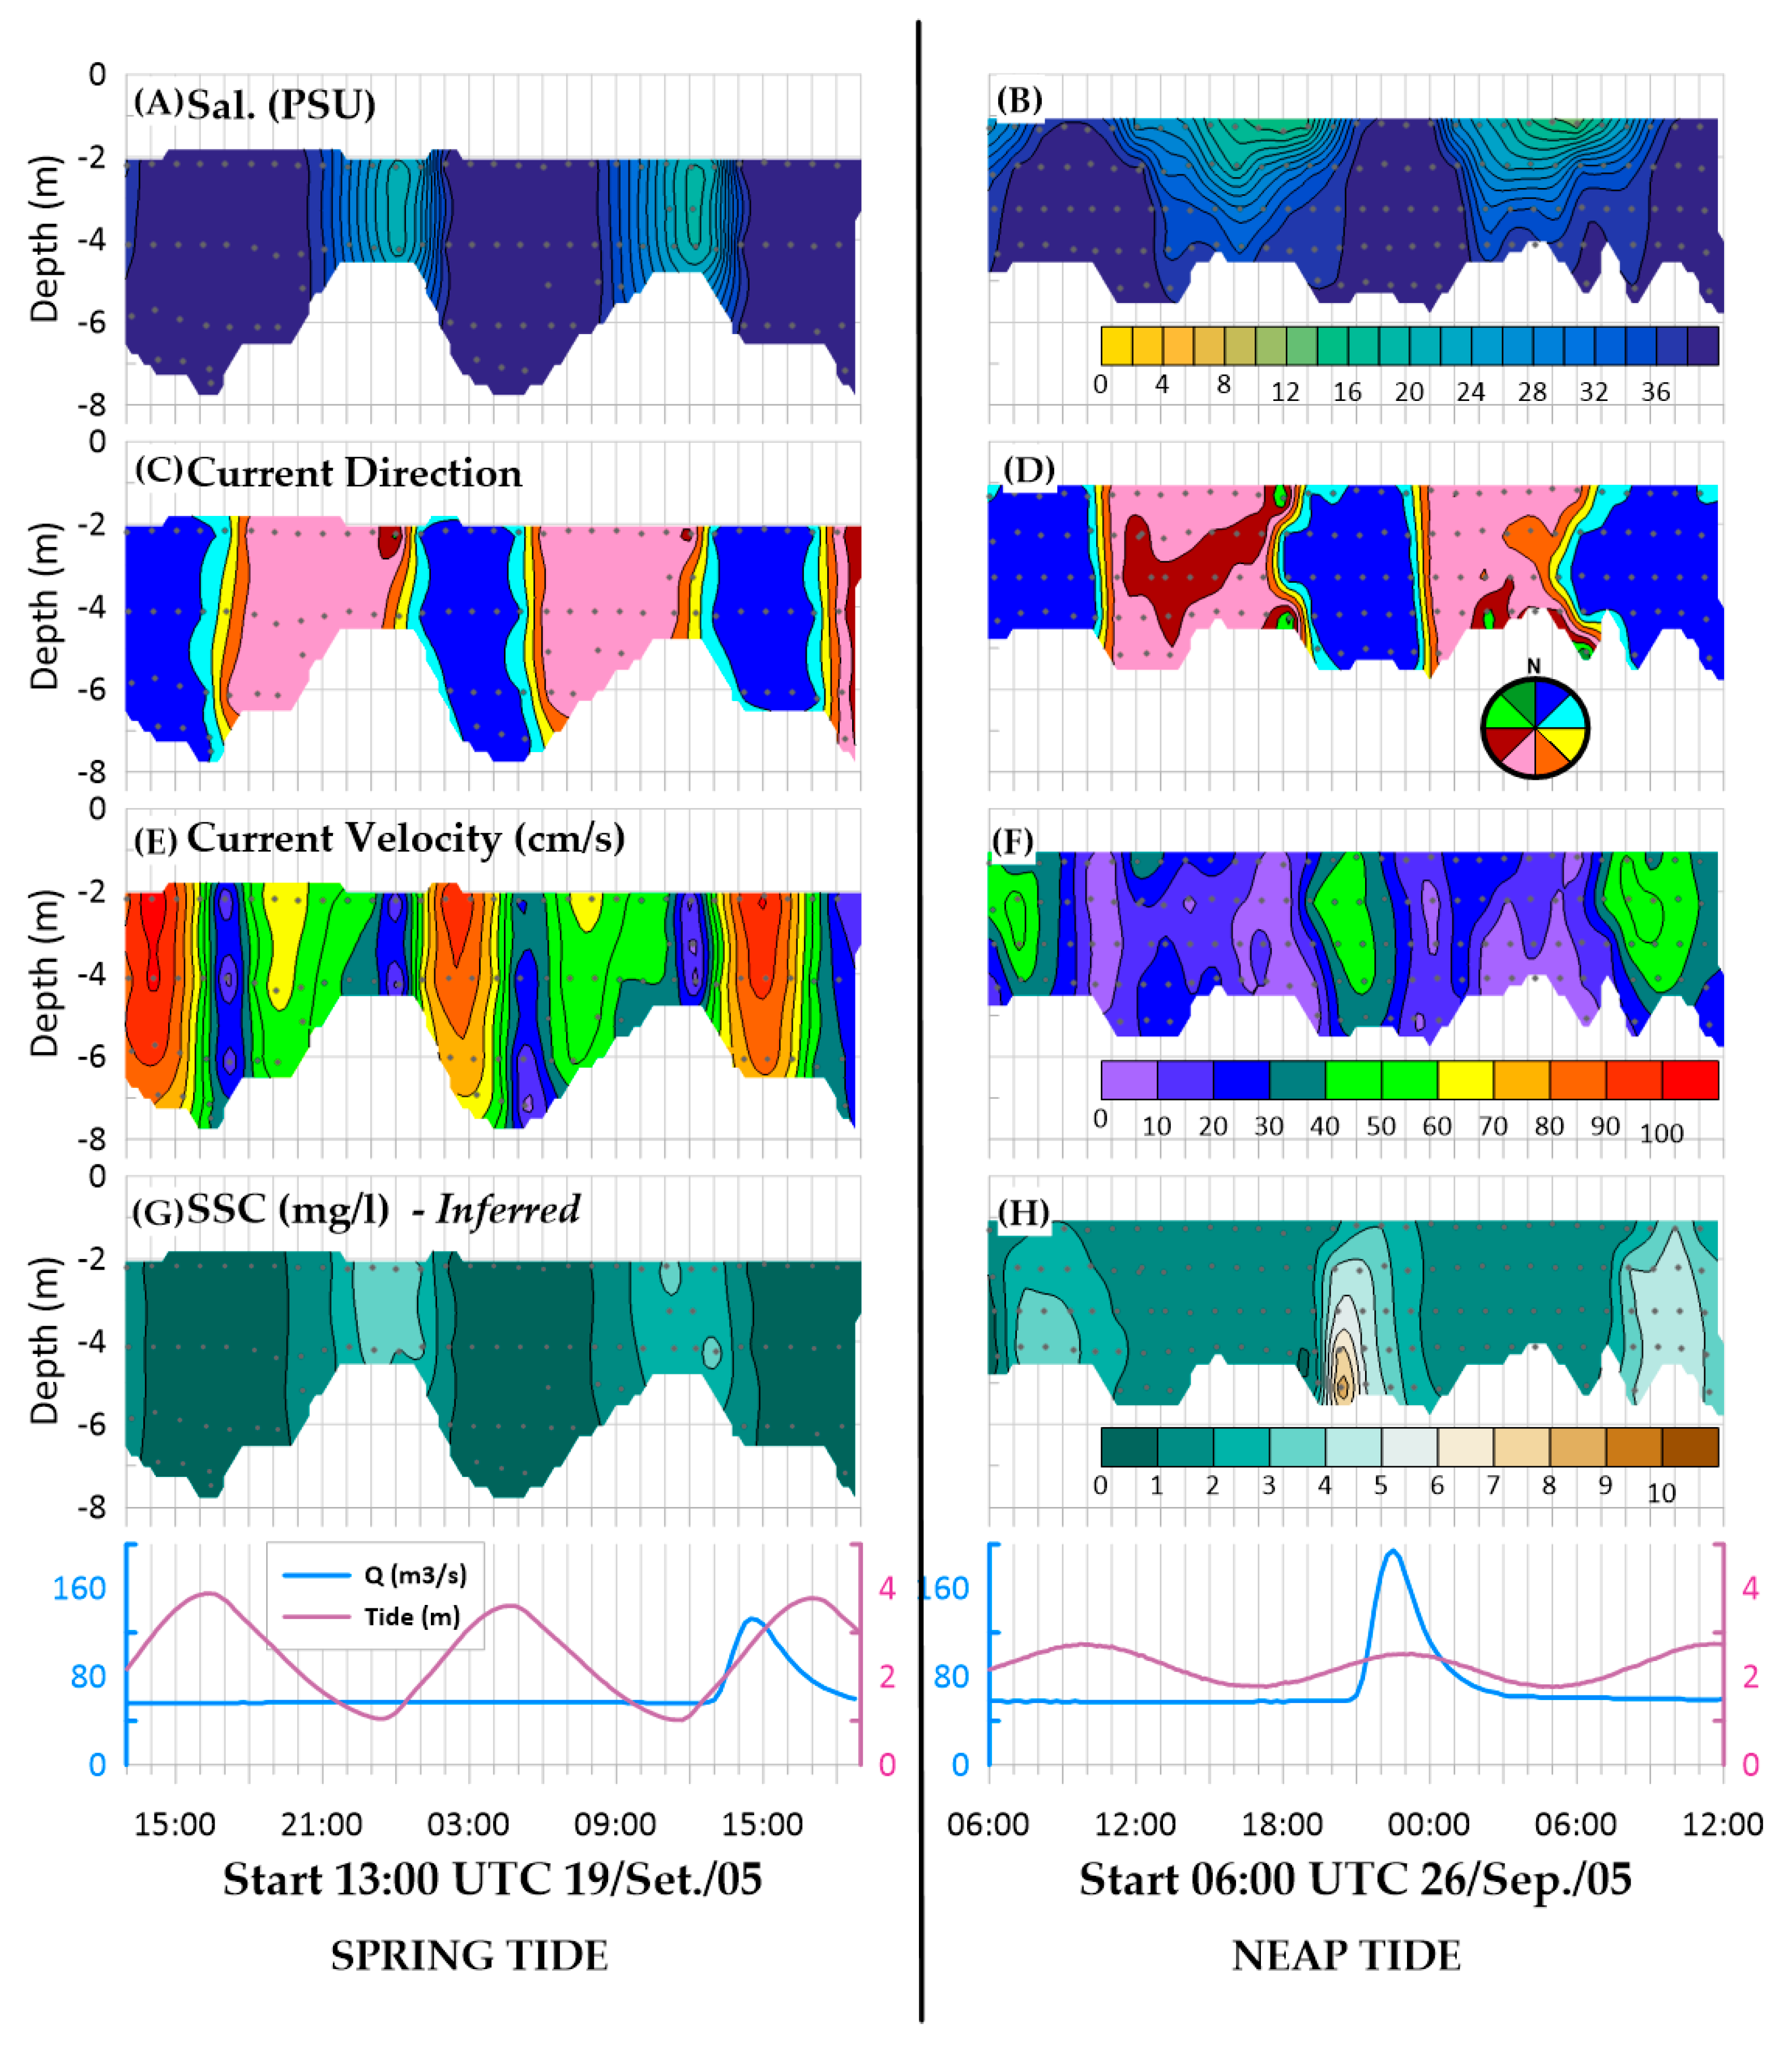
- Current and hydrological water column profile observations at a fixed station, covering a semi-diurnal tidal cycle (both spring and neaps) and complemented with water sampling for suspended sediment assessment;
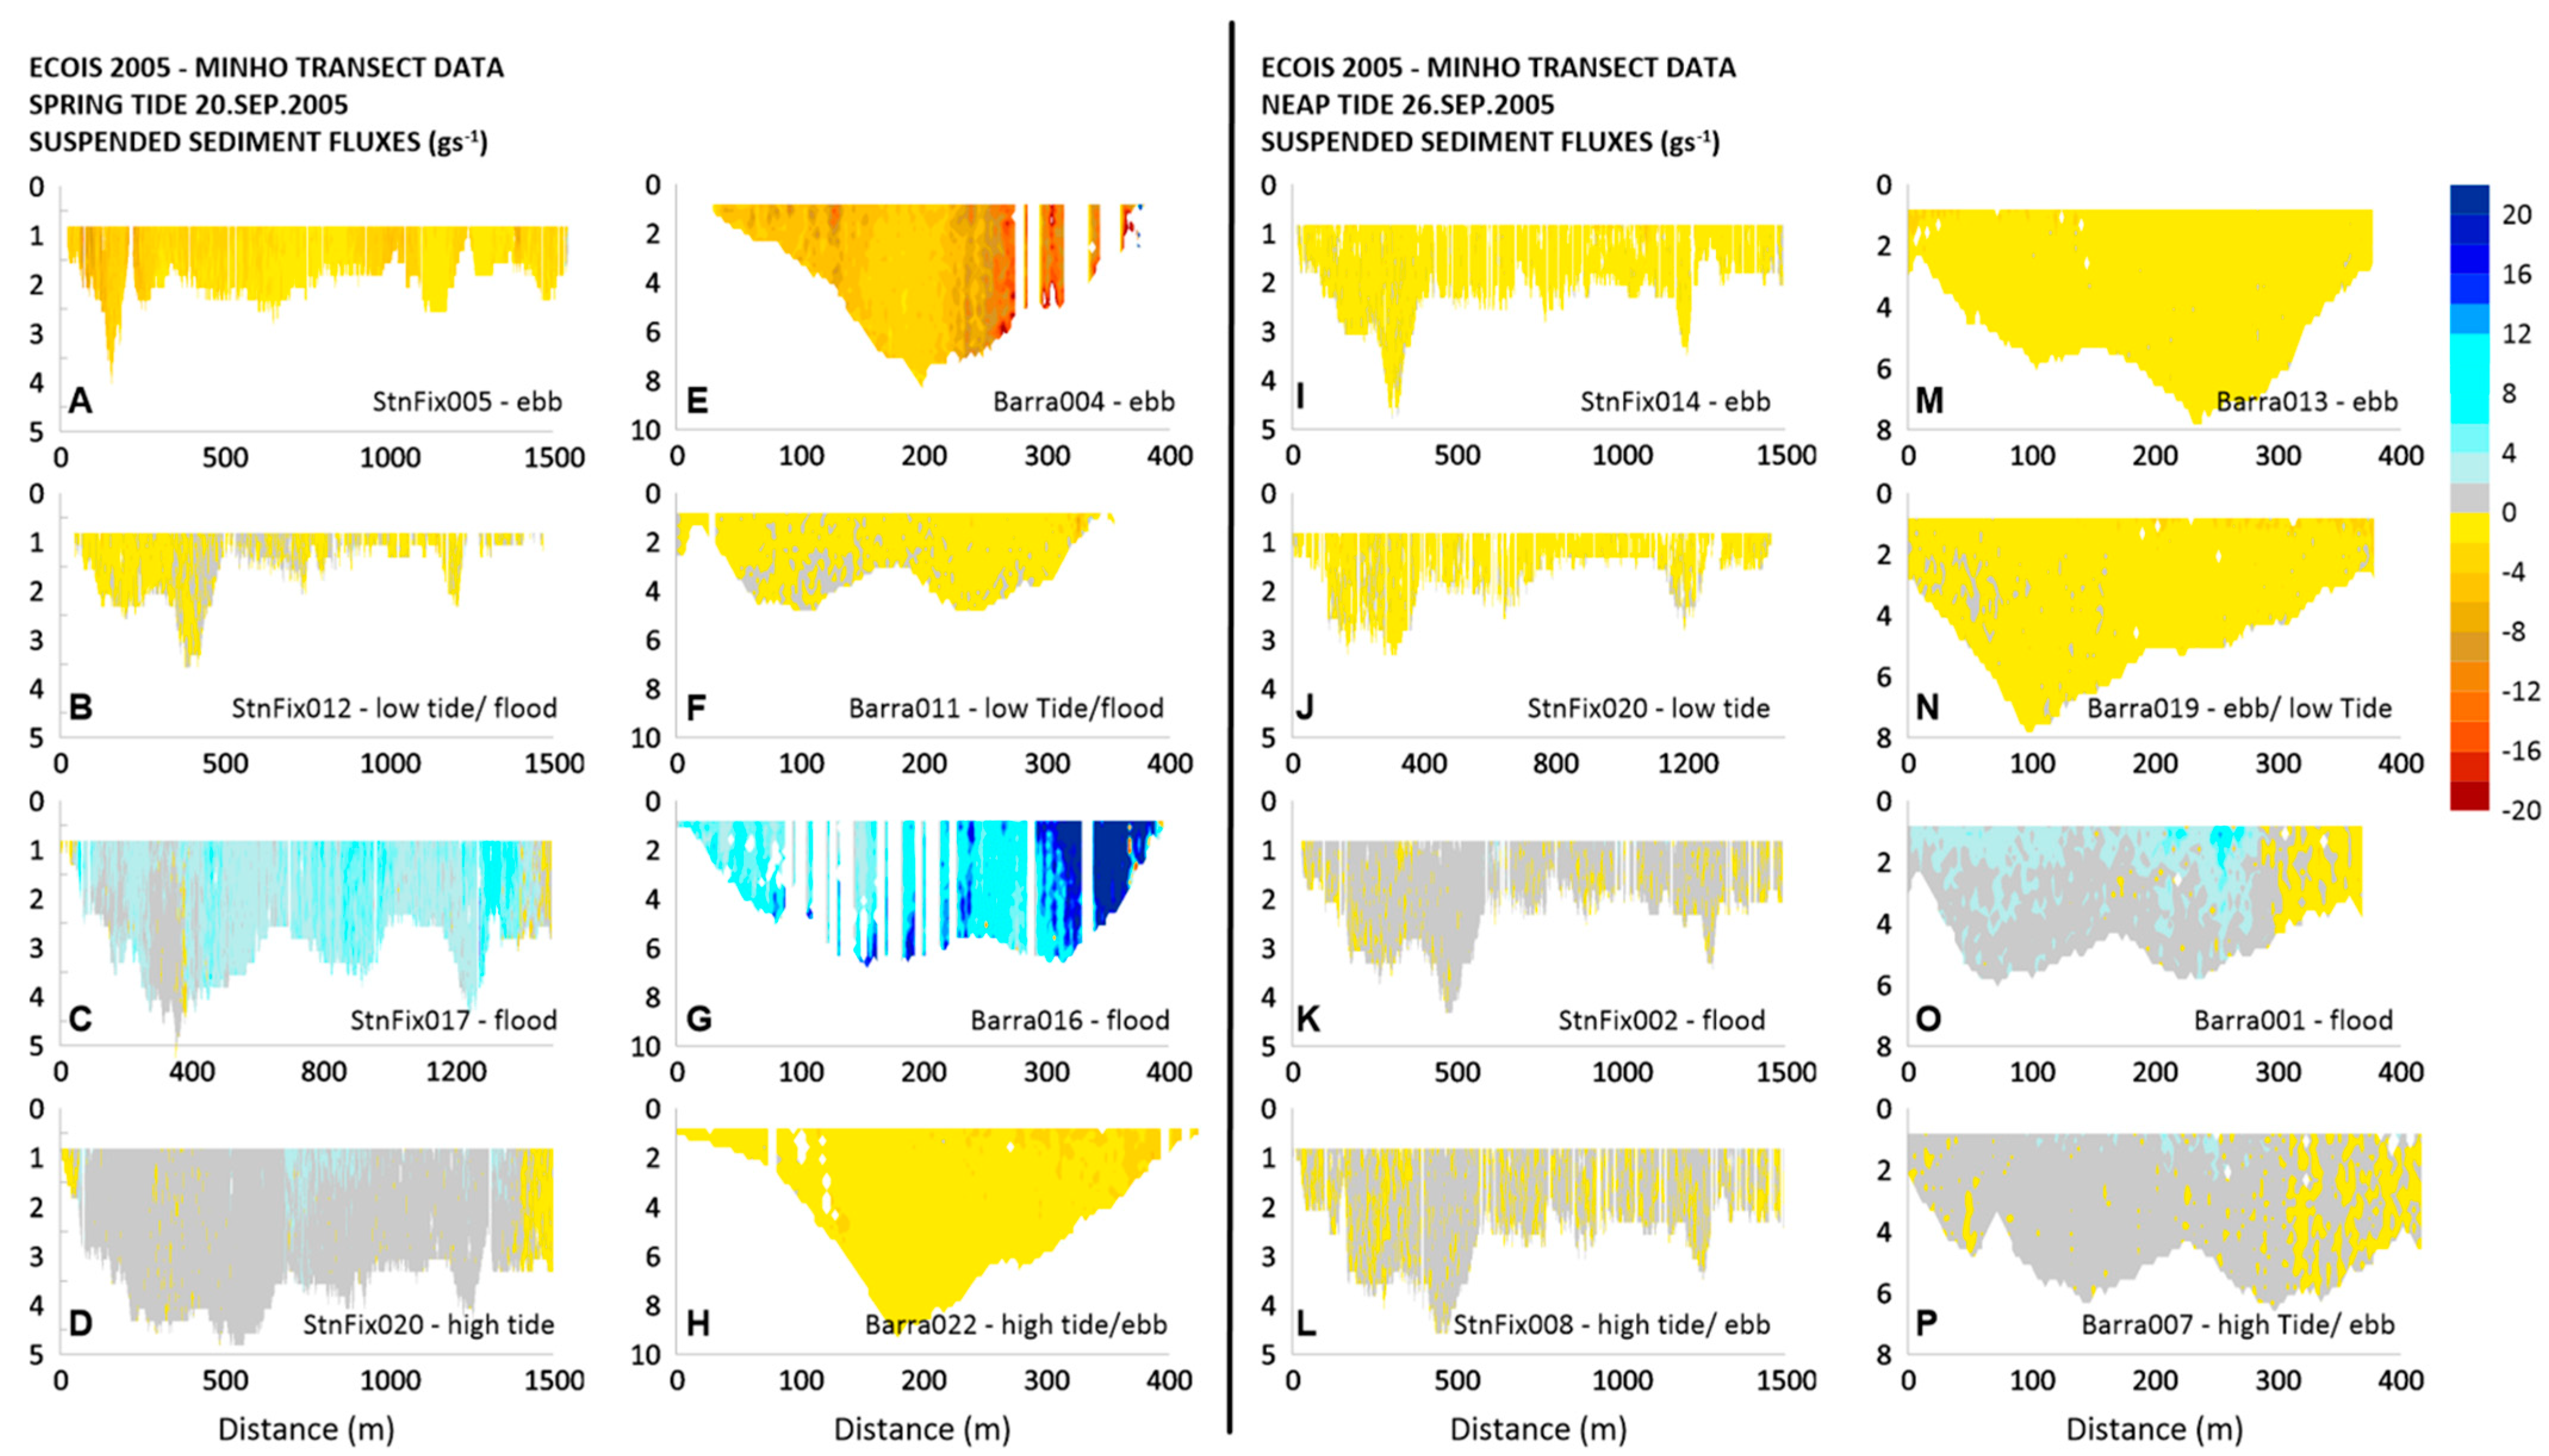
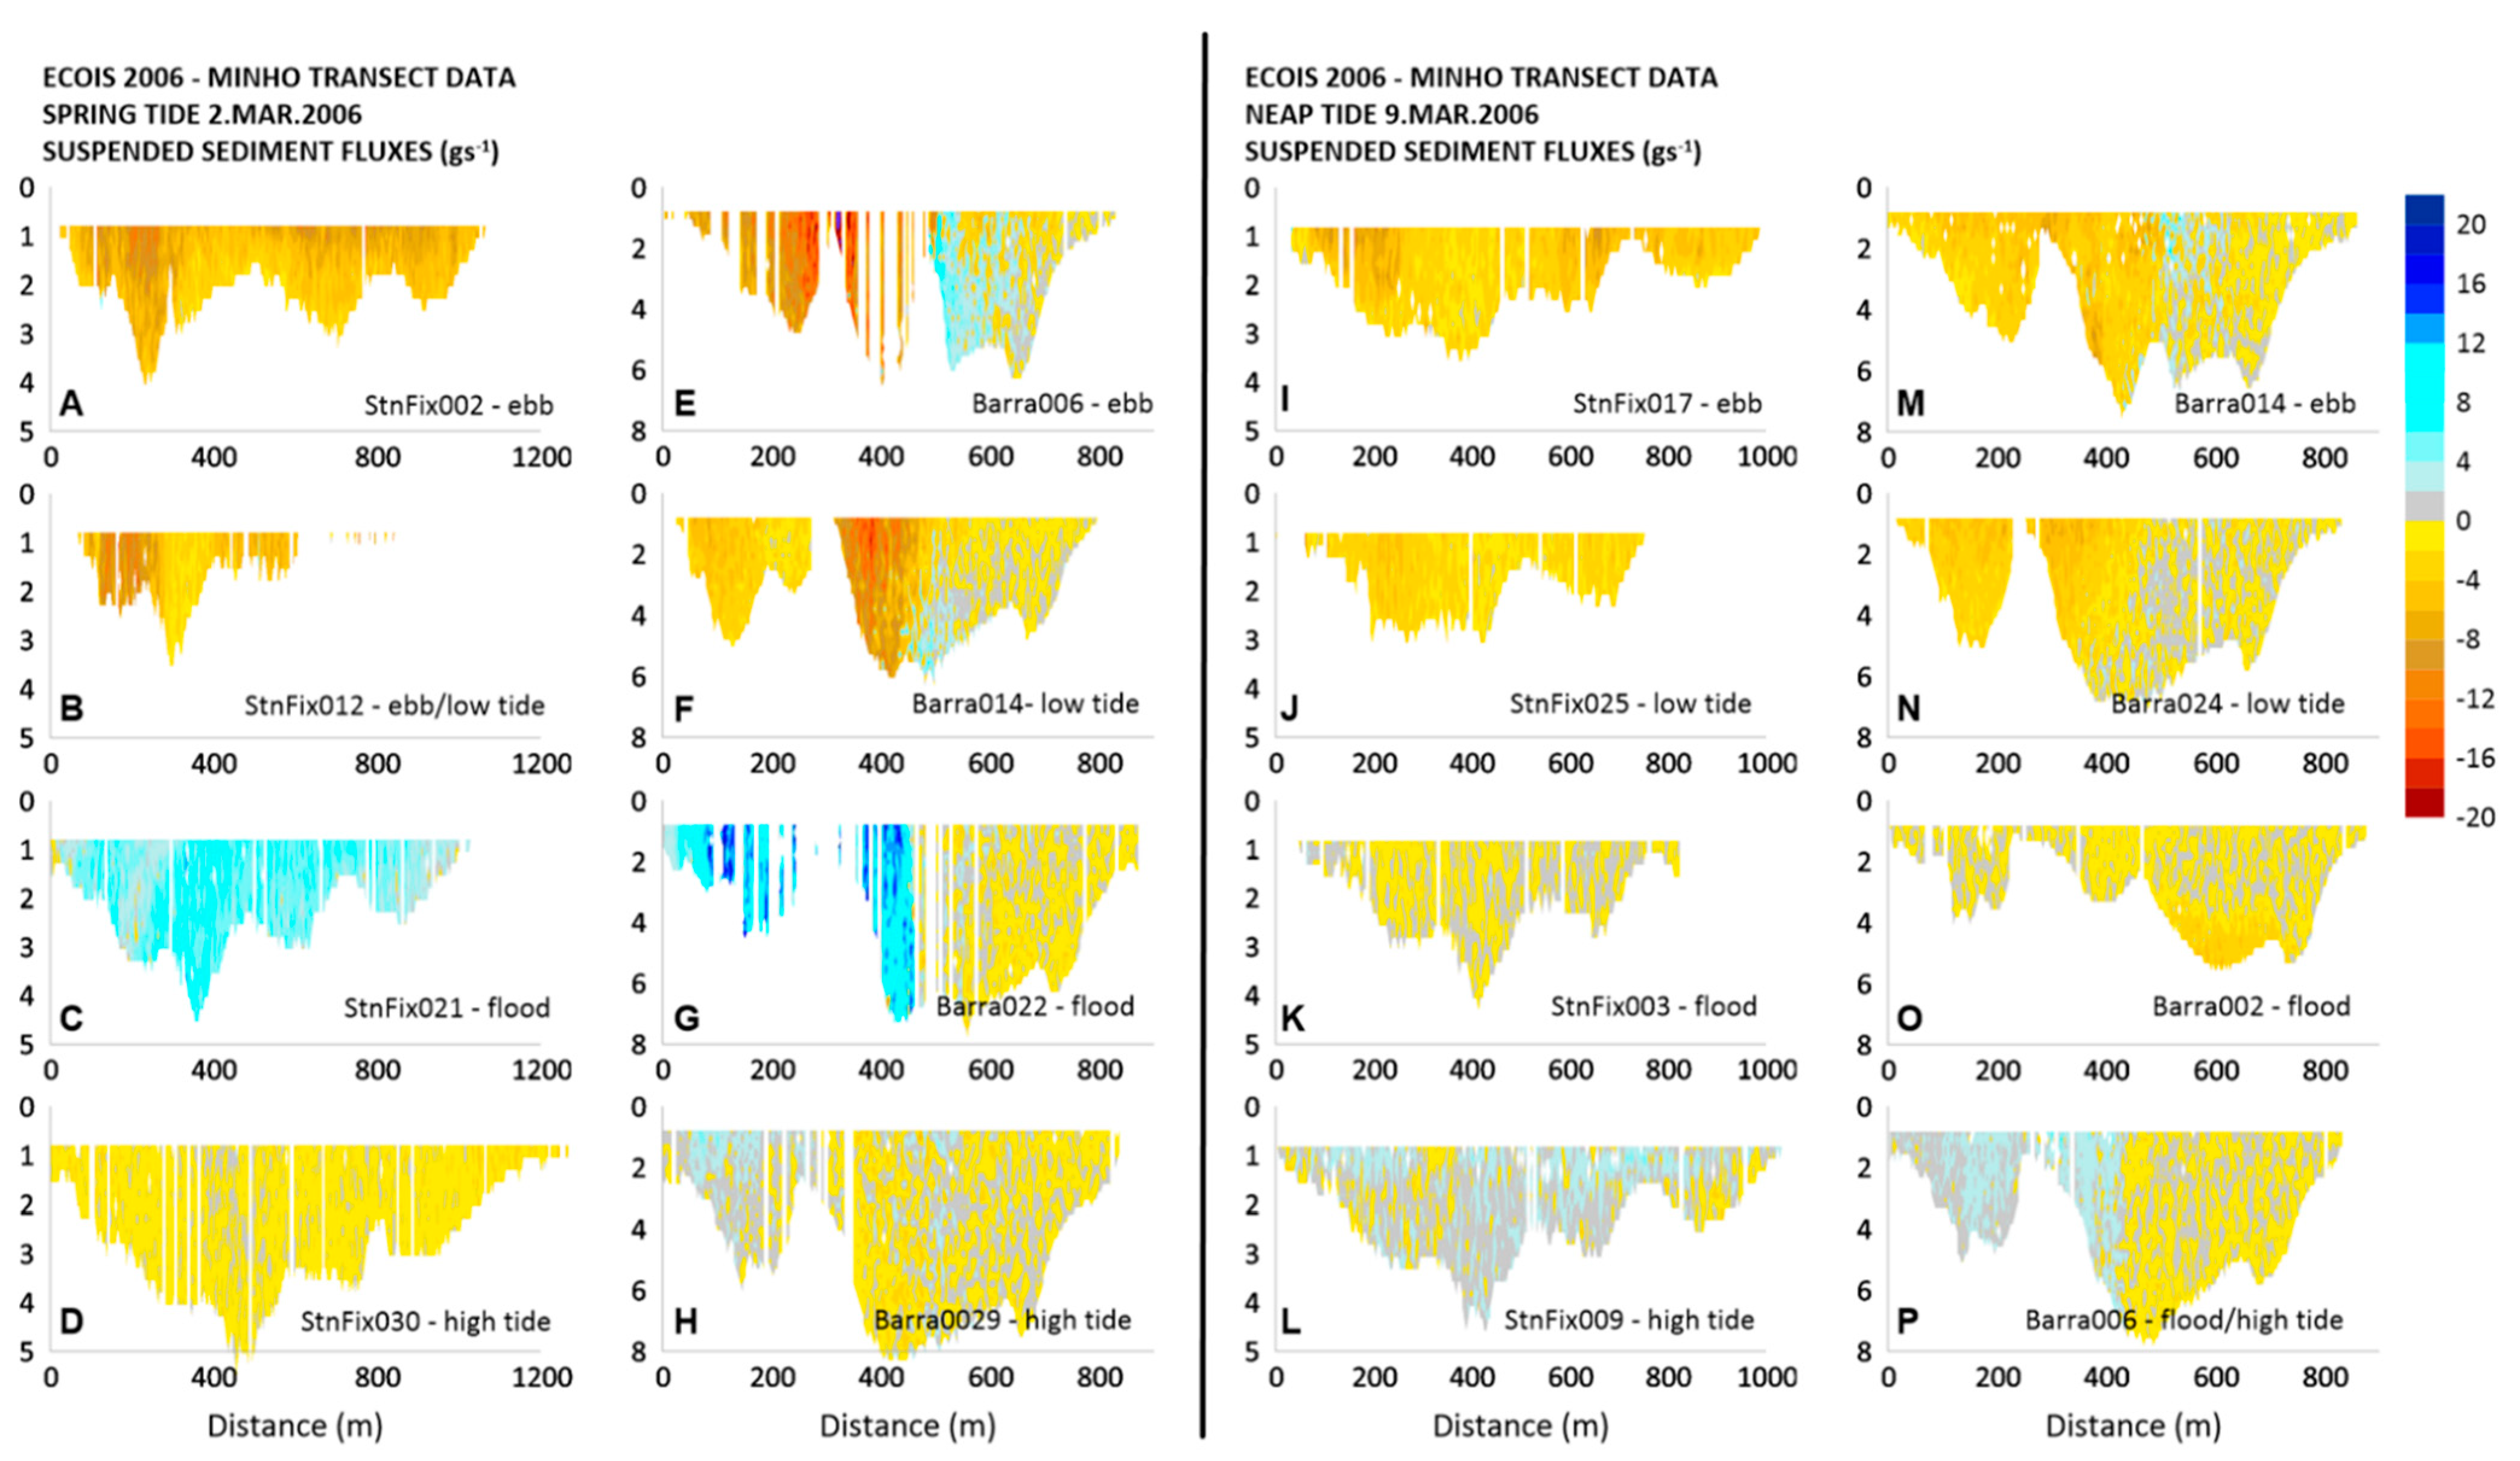
- Acoustic measurements (currents and backscatter intensity) of two lower estuary transects during the same semi-diurnal spring and neap tidal cycle using acoustic profilers (ADCP);
- Bottom-moored ADCPs providing continuous time series of tides (pressure sensors) and current and acoustic backscatter profiles planned to extend for periods longer than the two week fortnightly tidal cycle (discussed in Part 2).
2.3. Tidal Cycle Water and Sediment Fluxes
3. Results
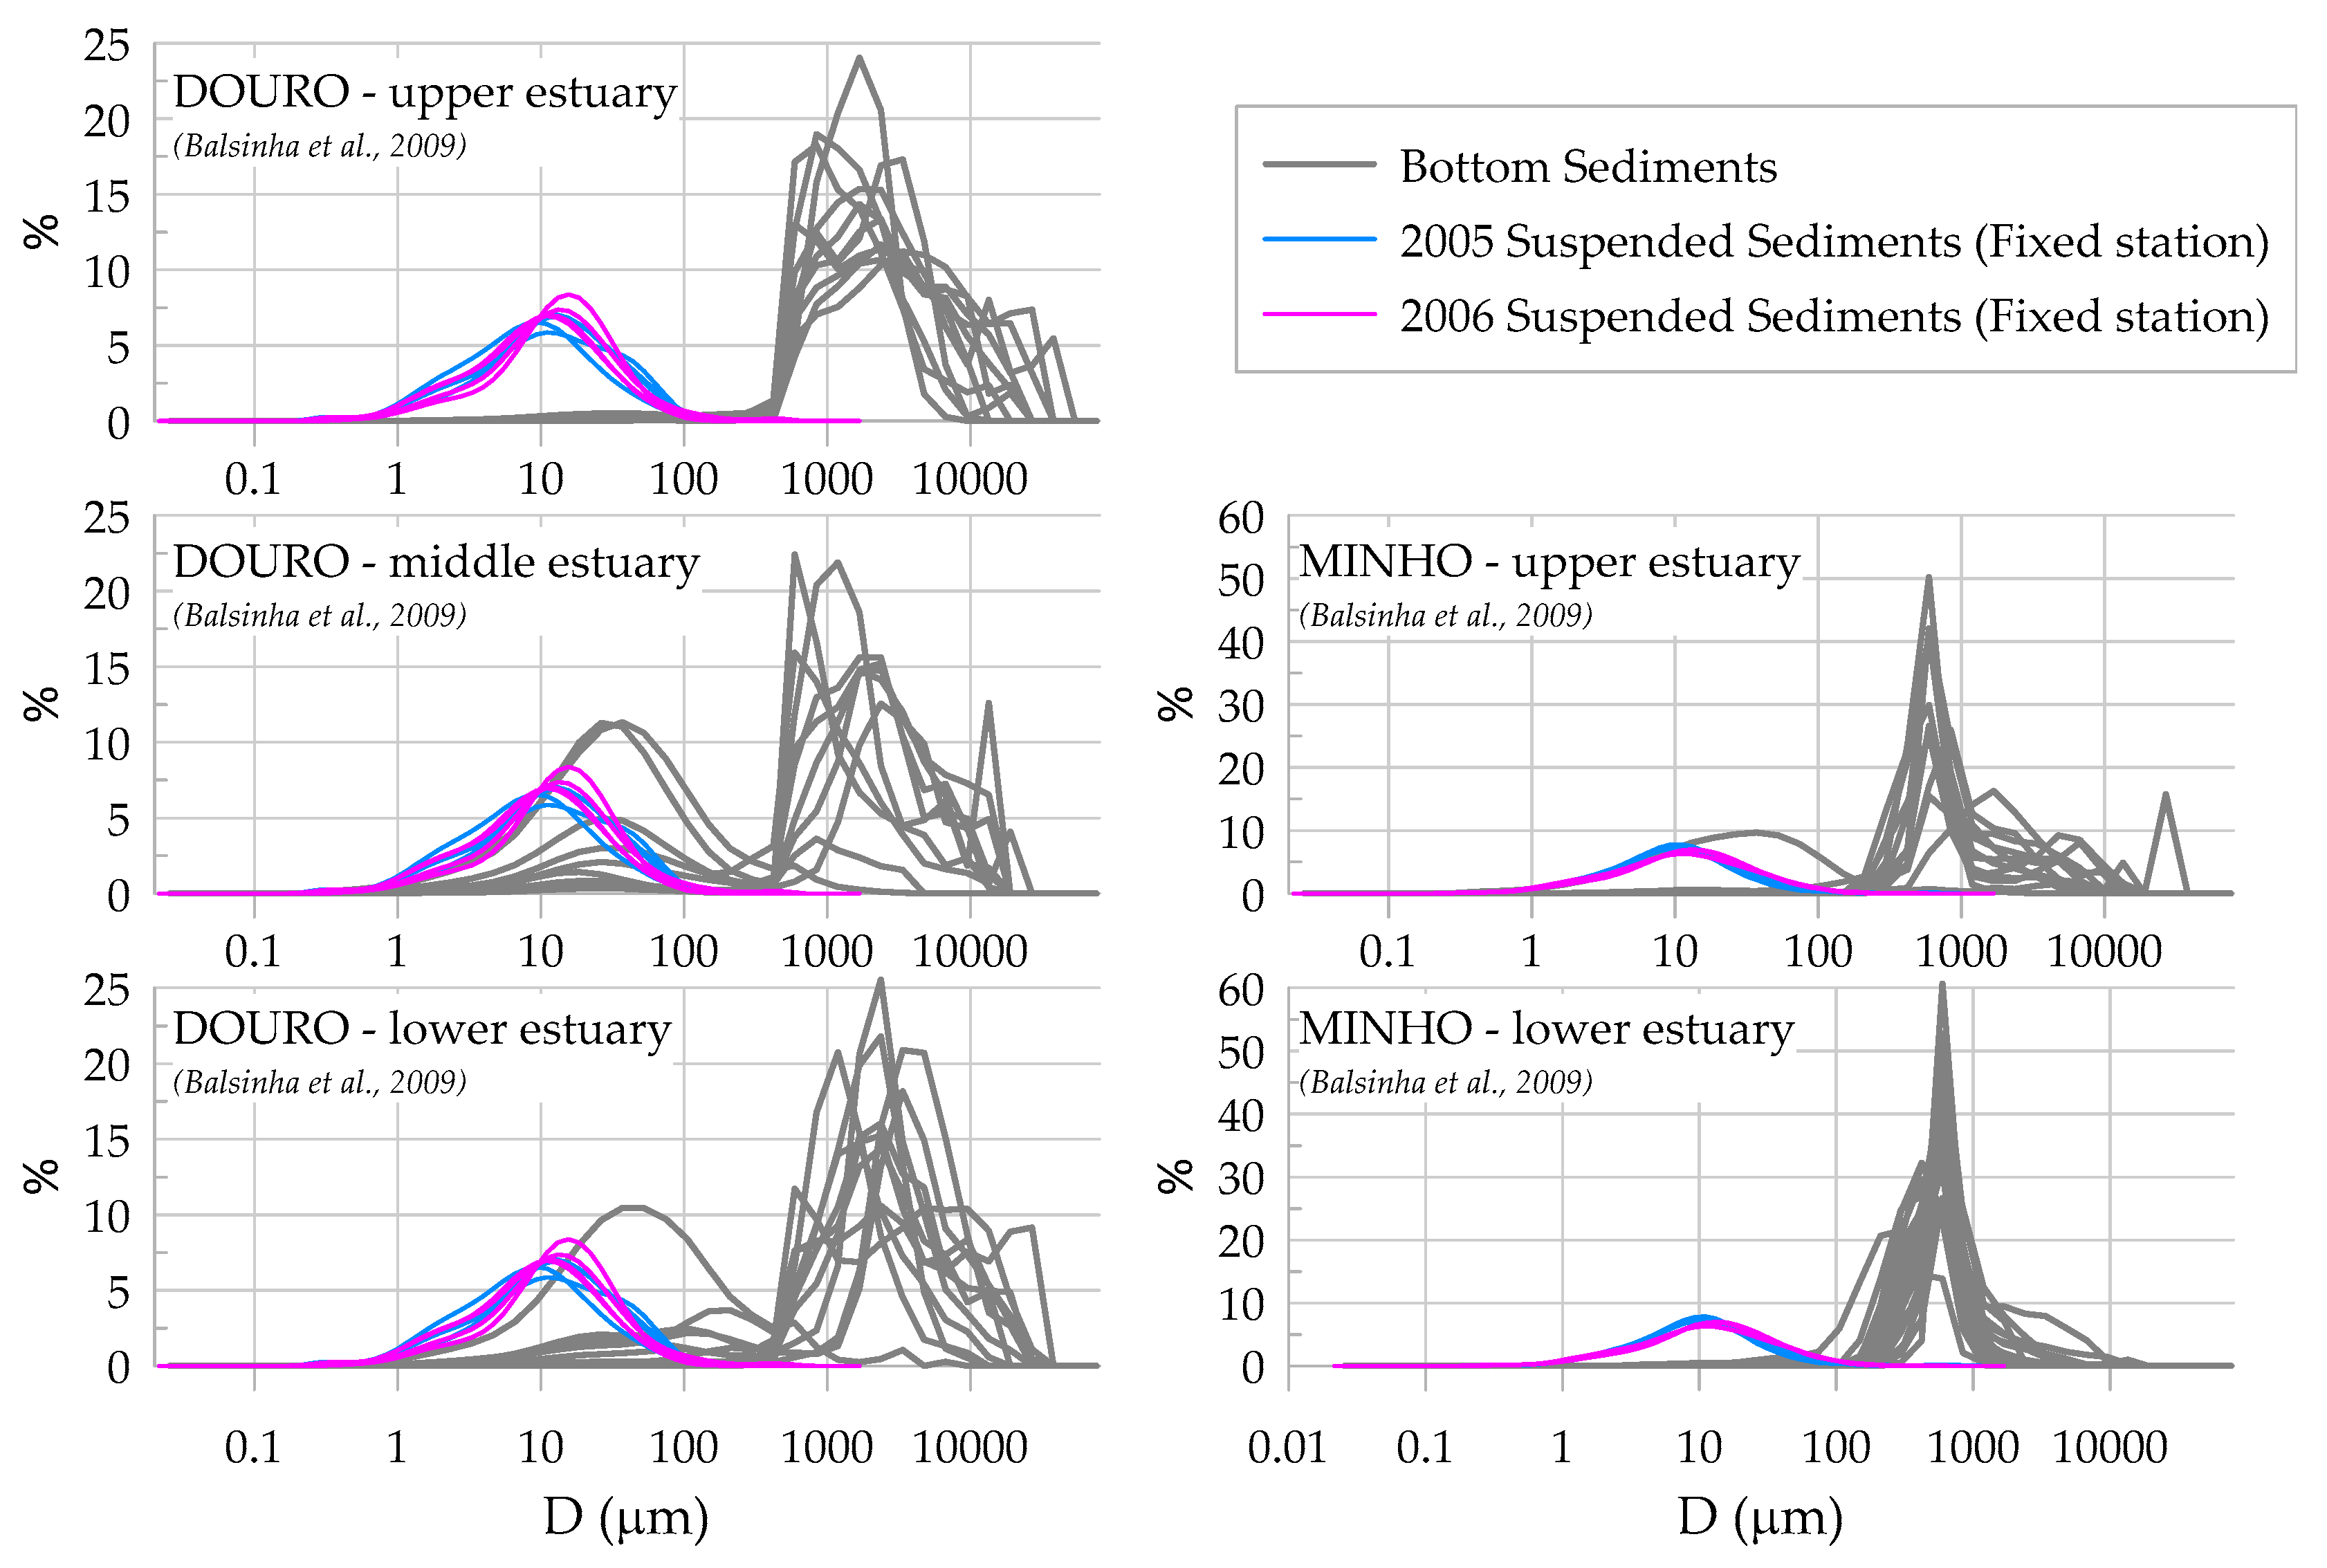
3.1. Estuarine Sediments
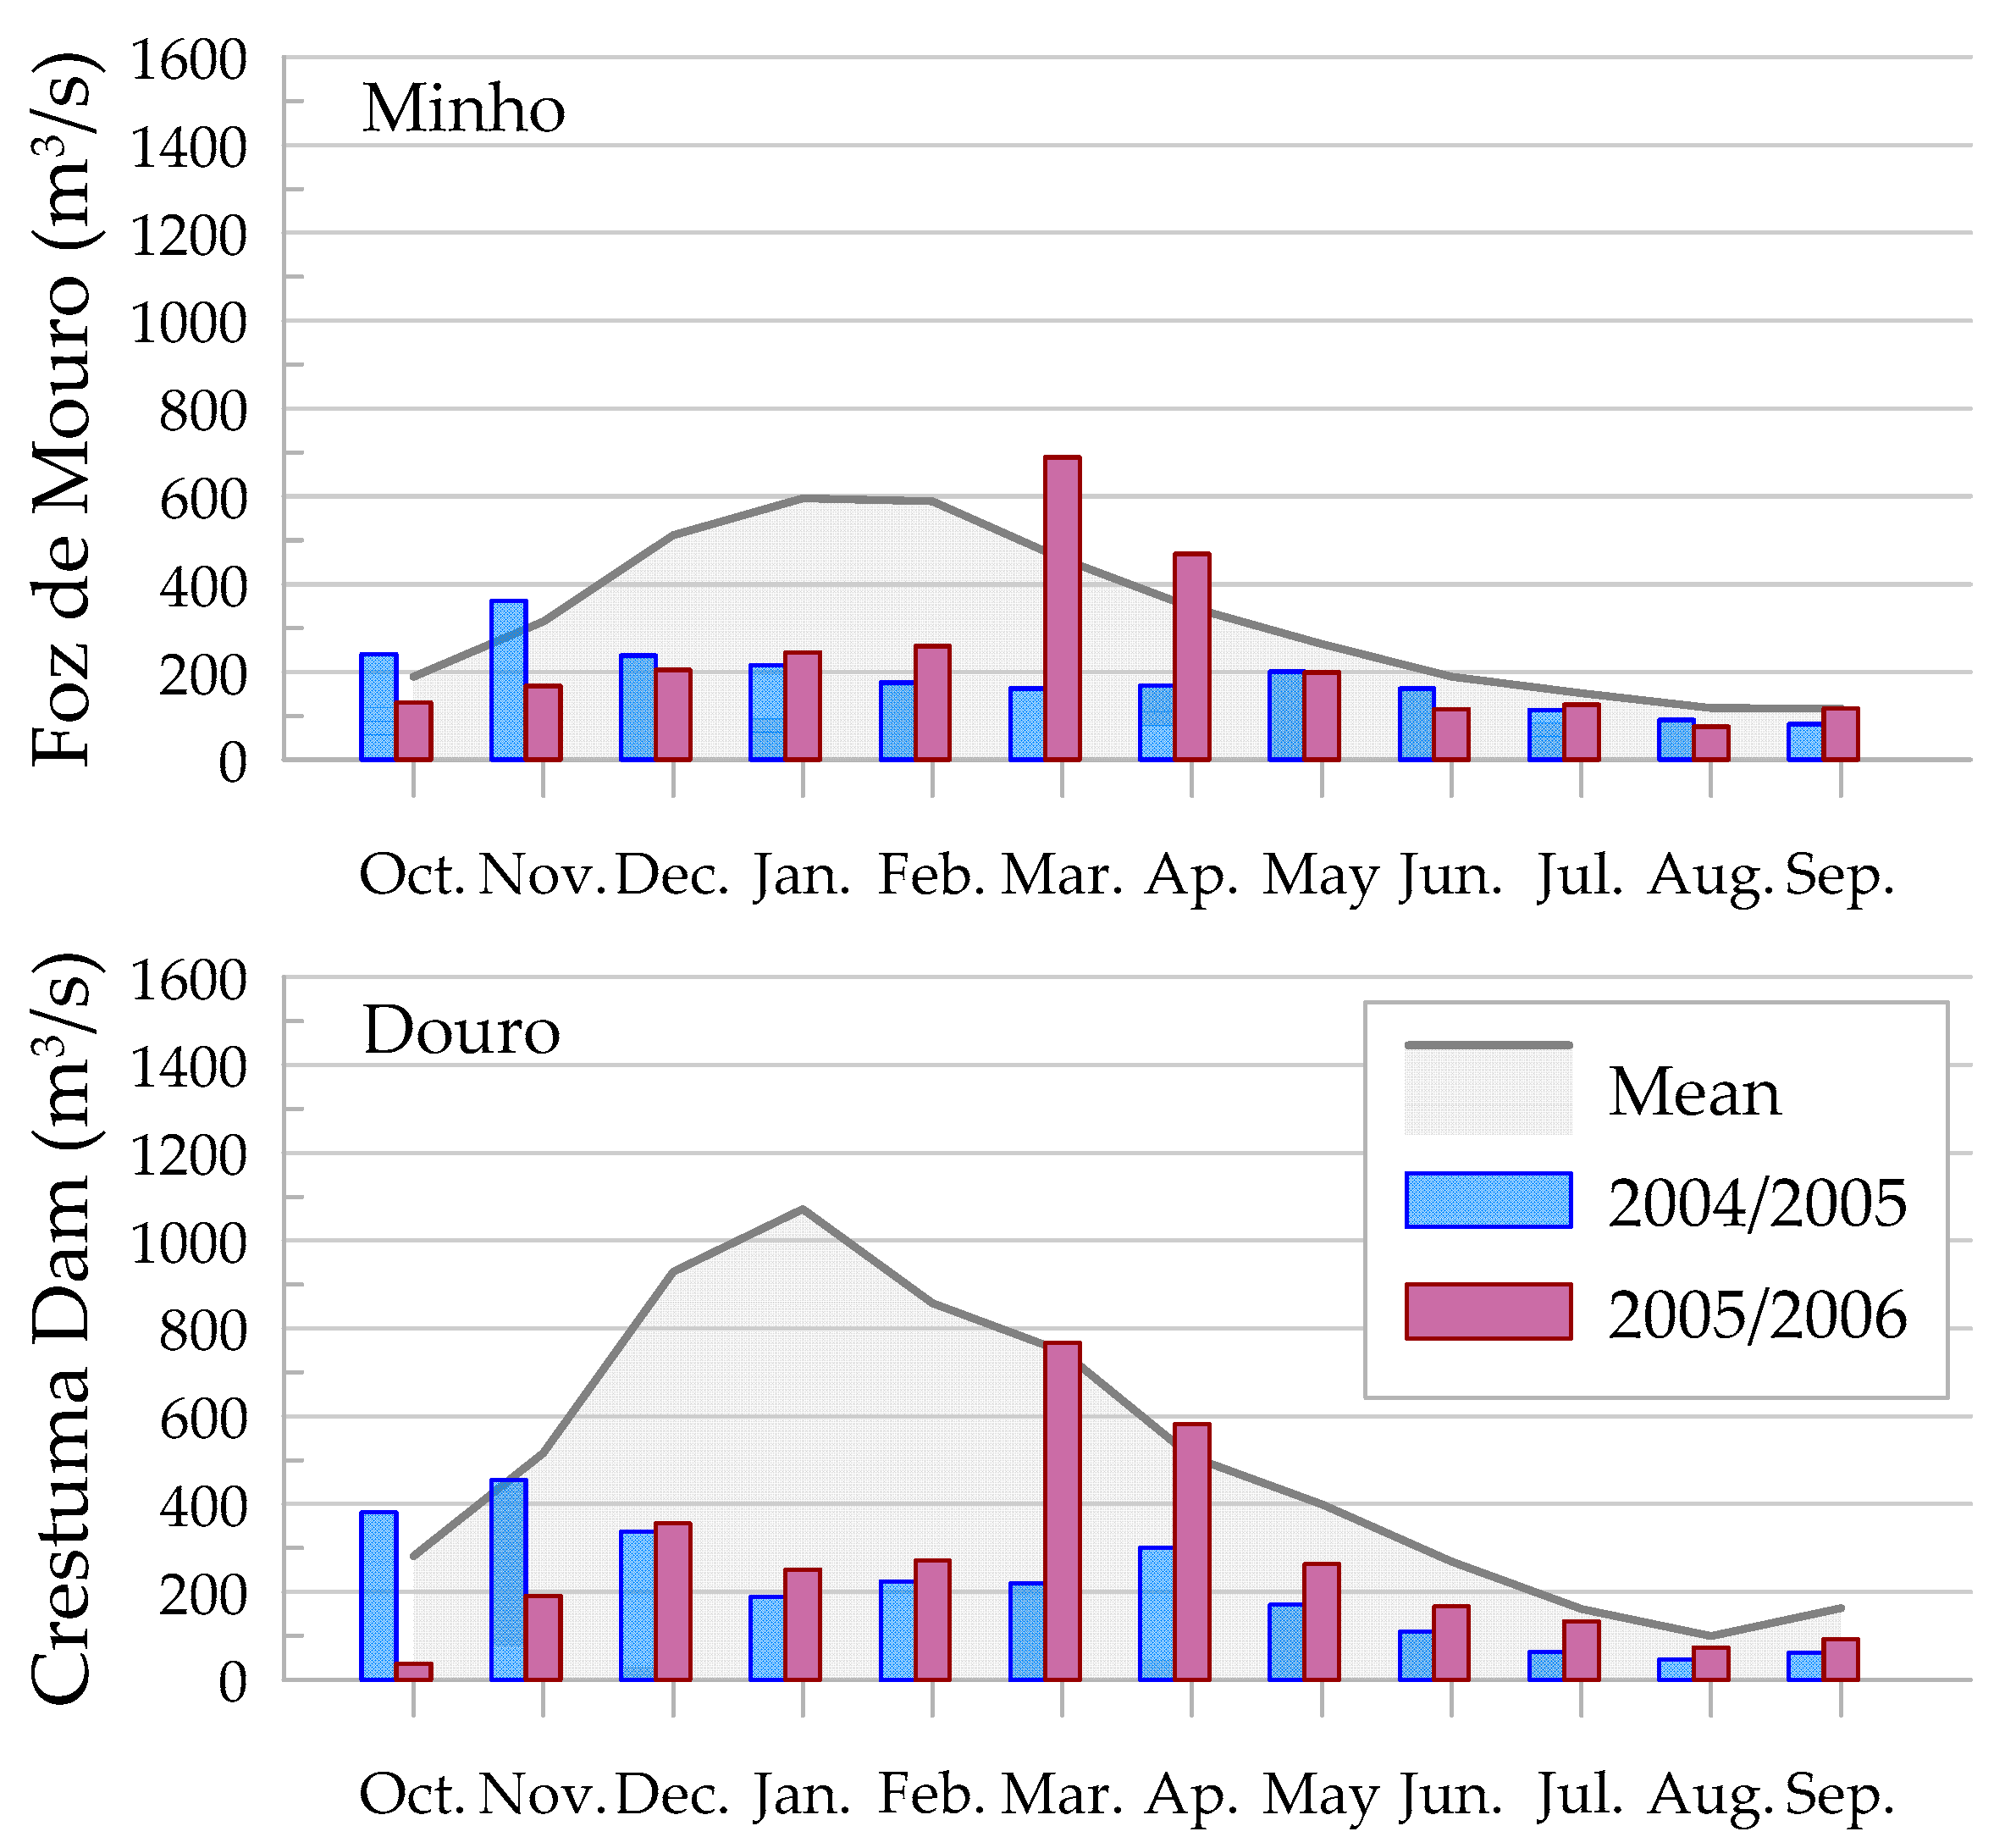
3.2. River Flow Regime
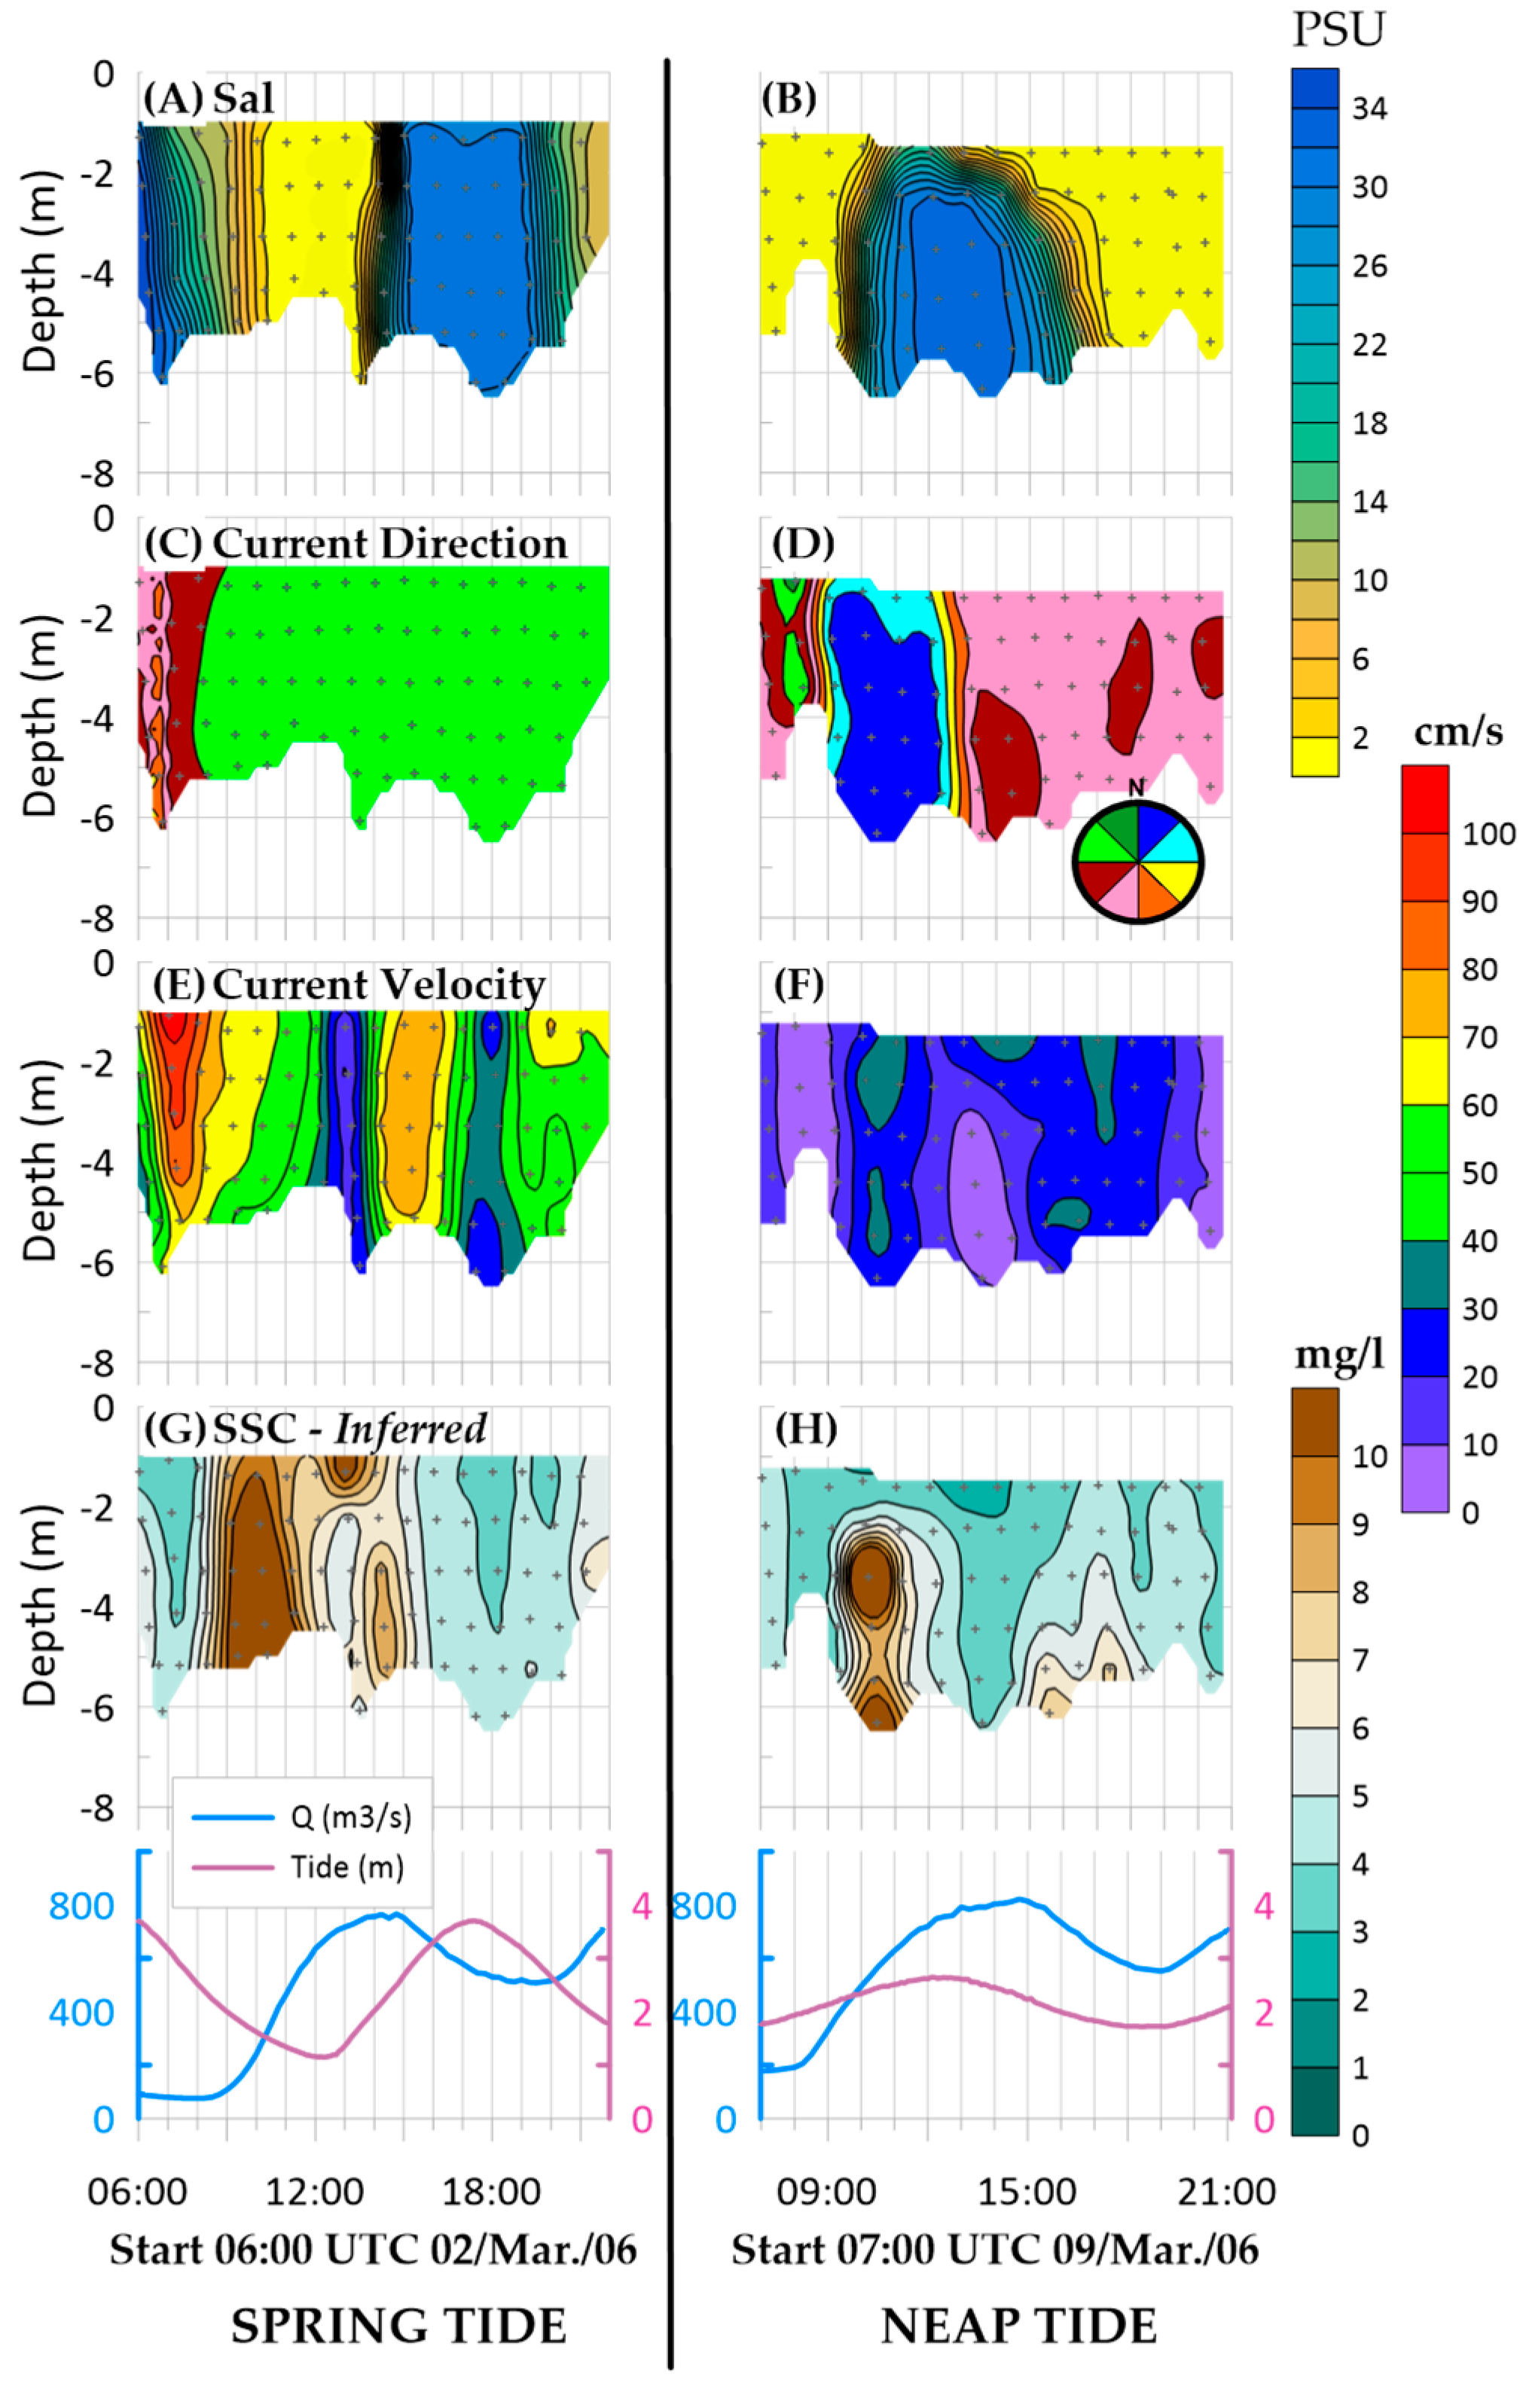
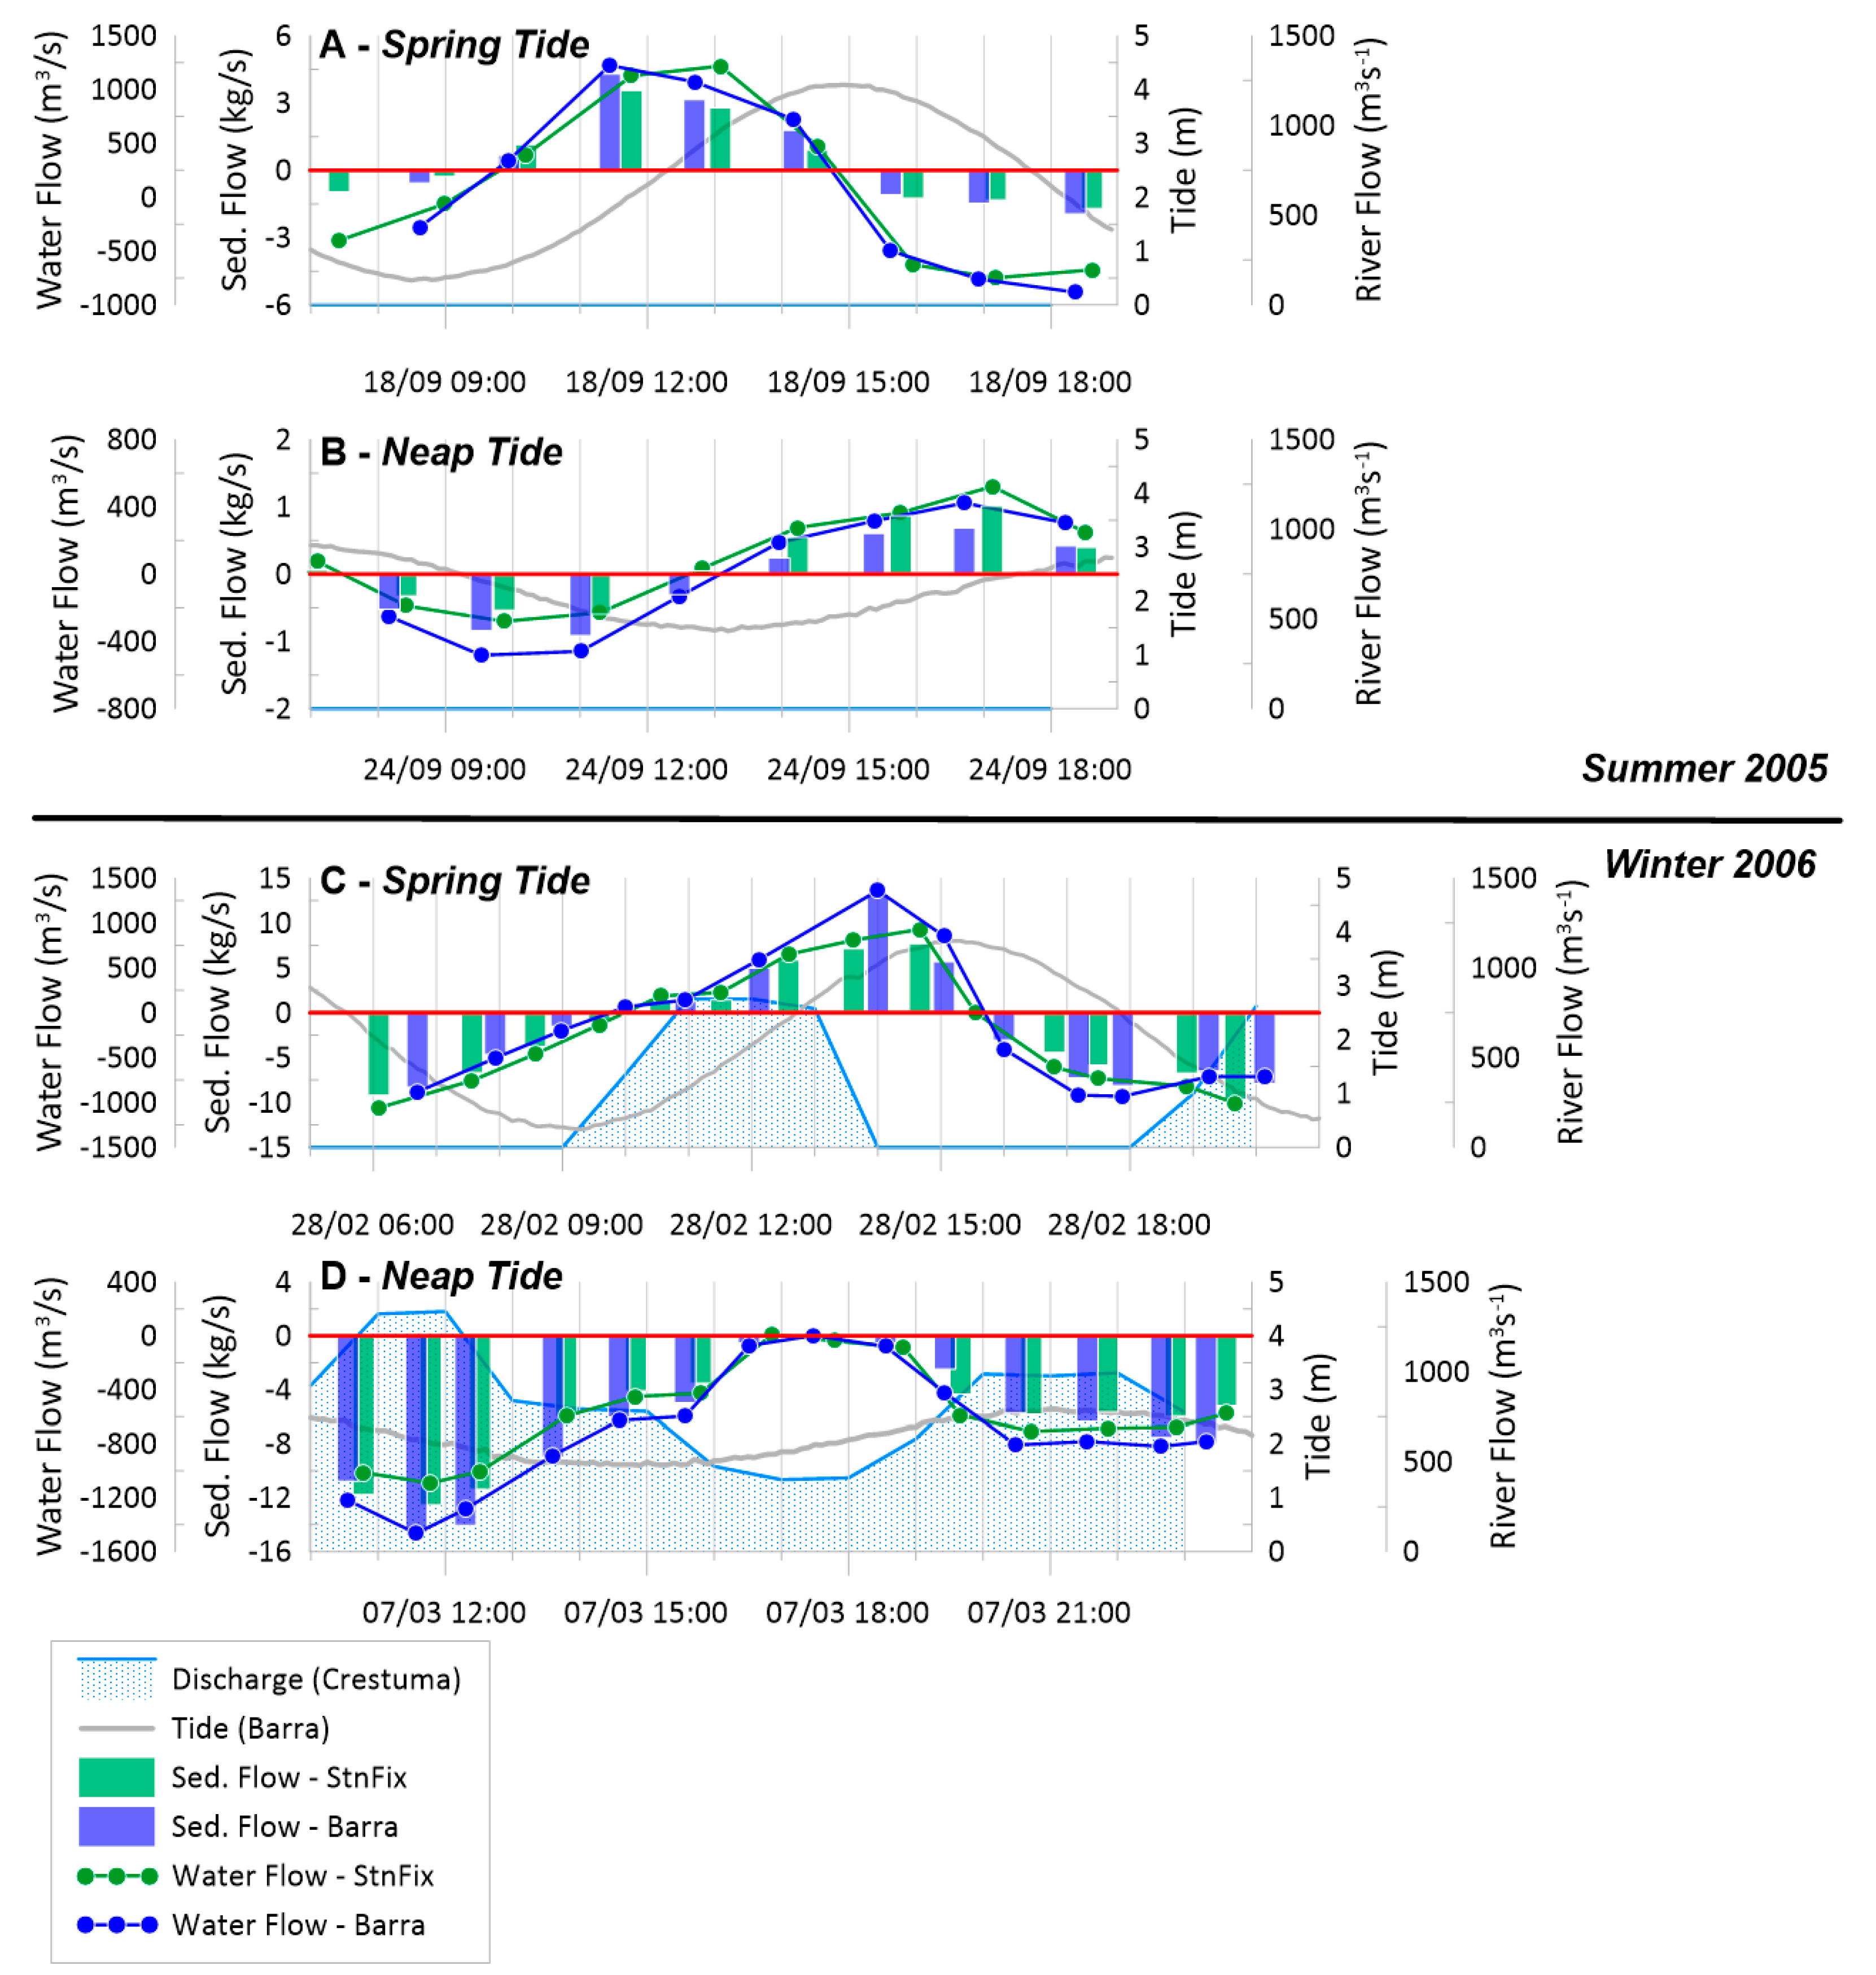
3.3. Minho
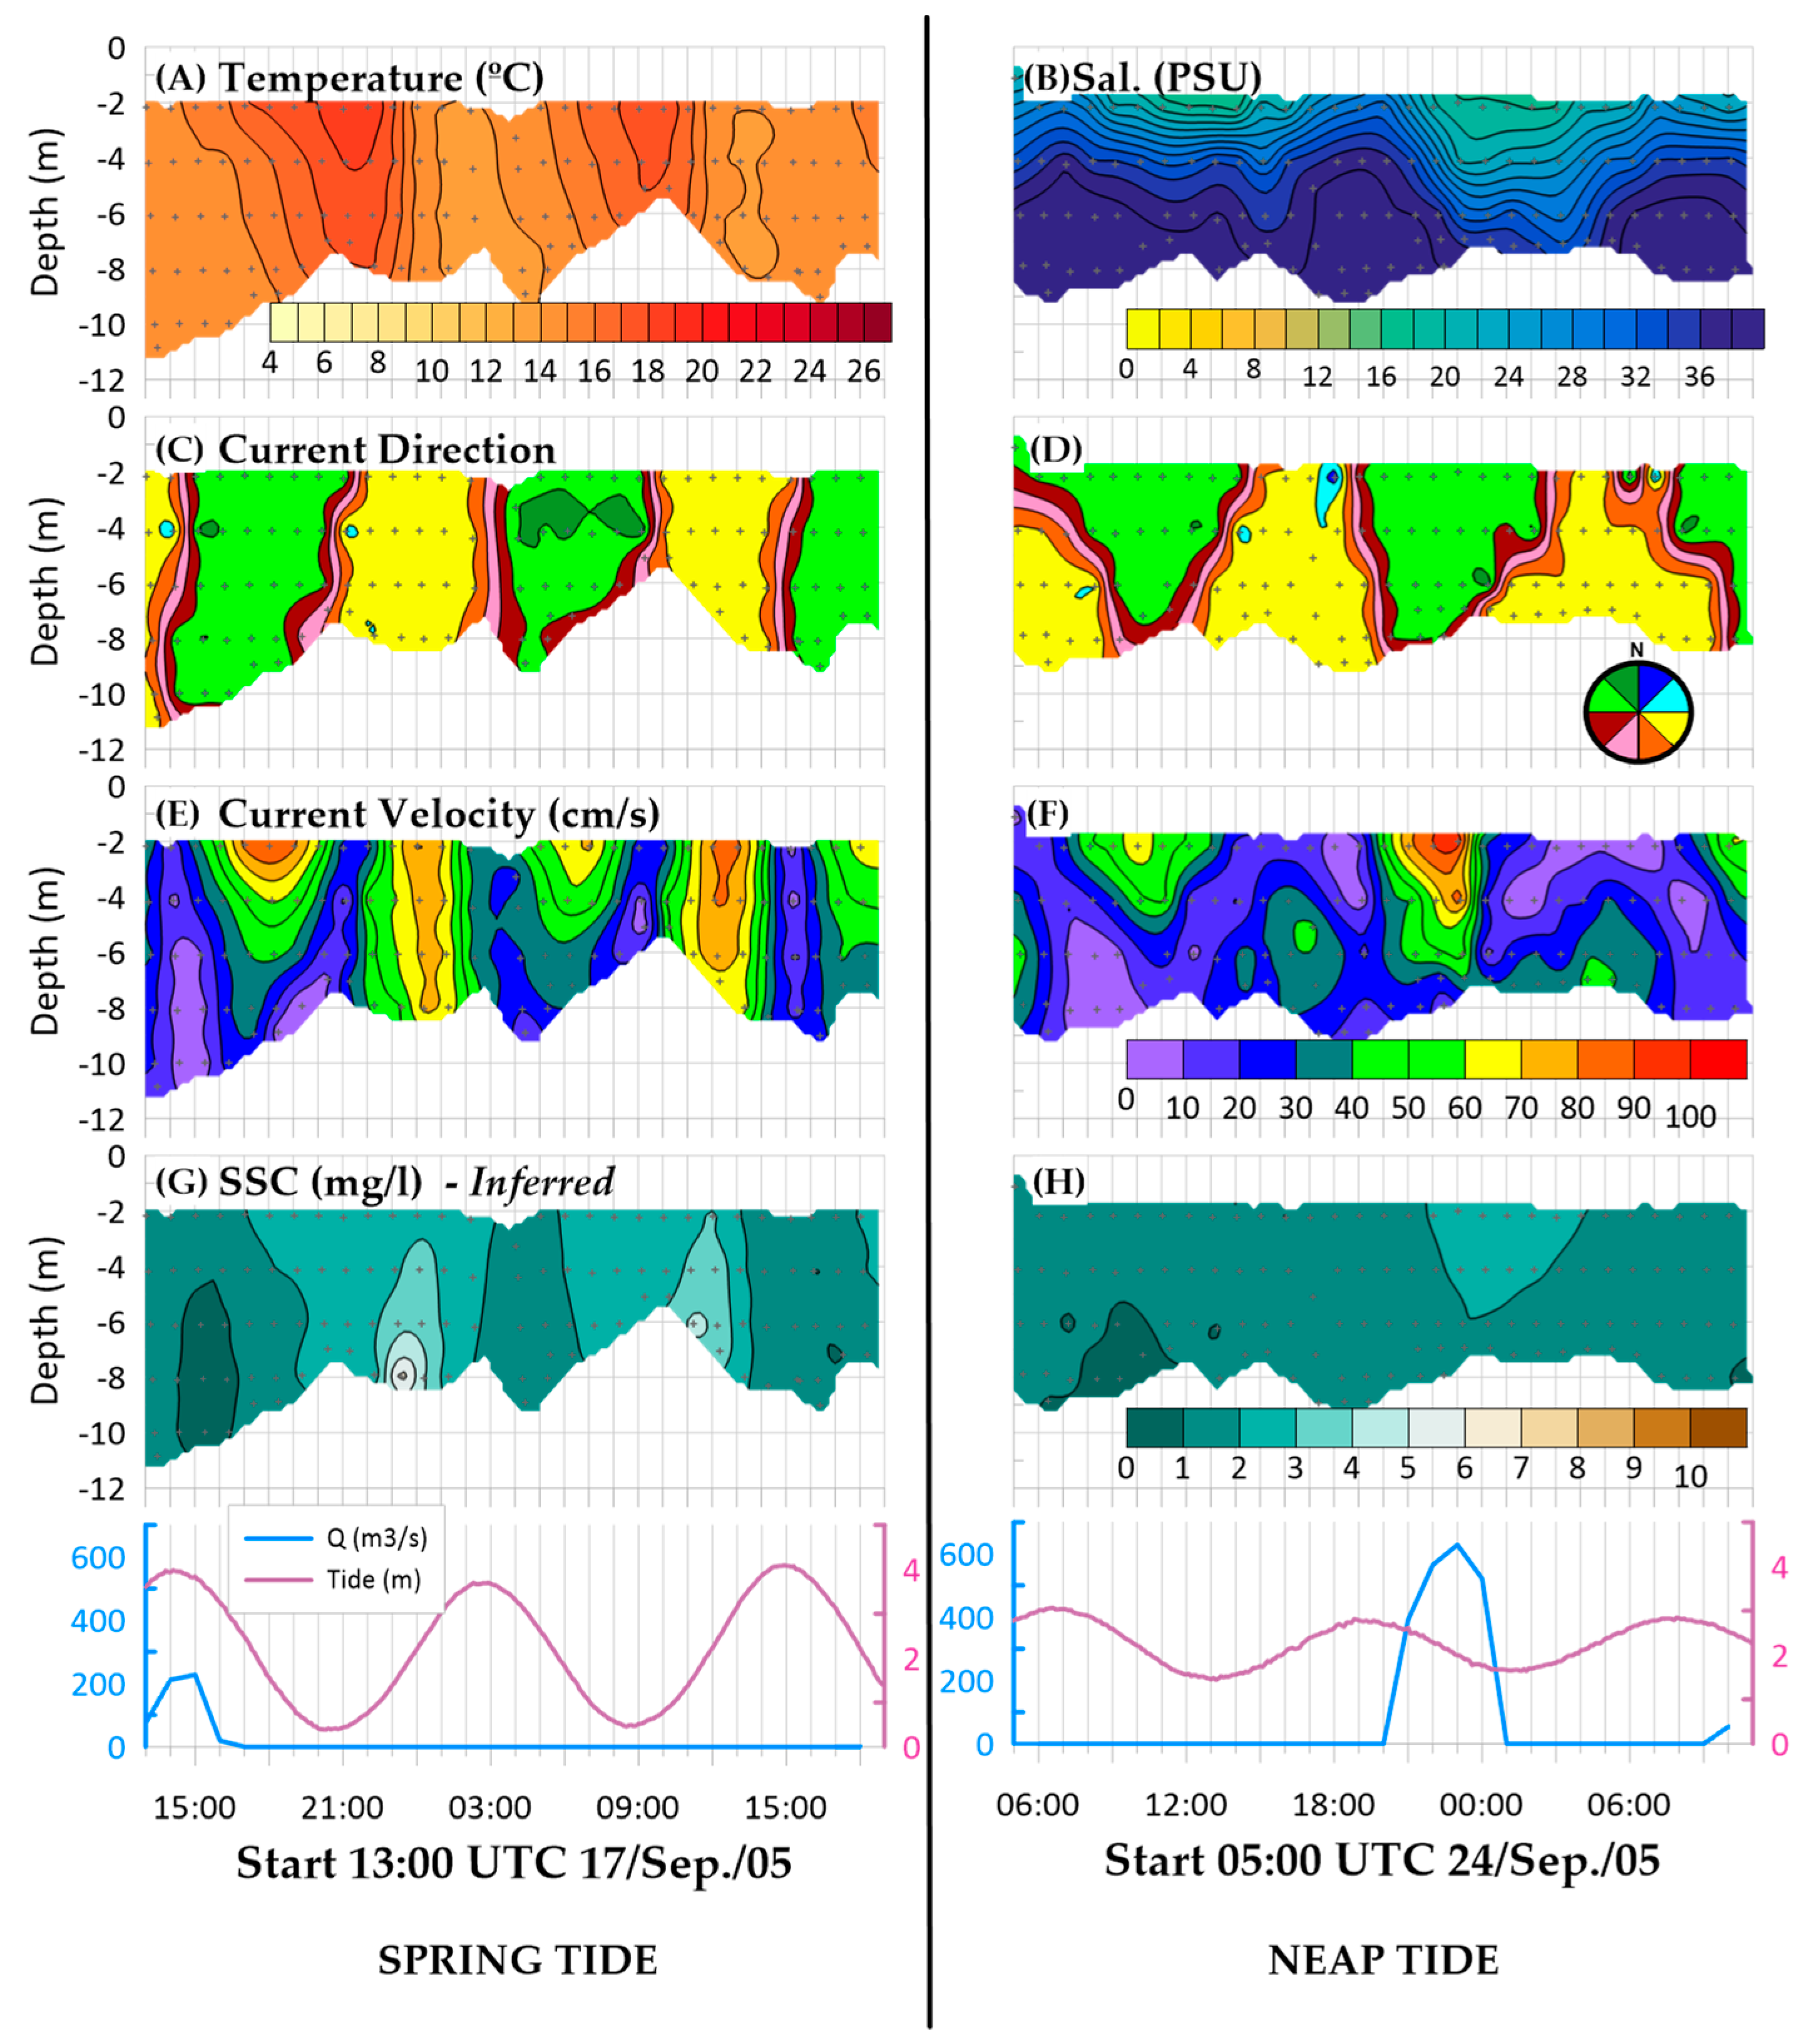
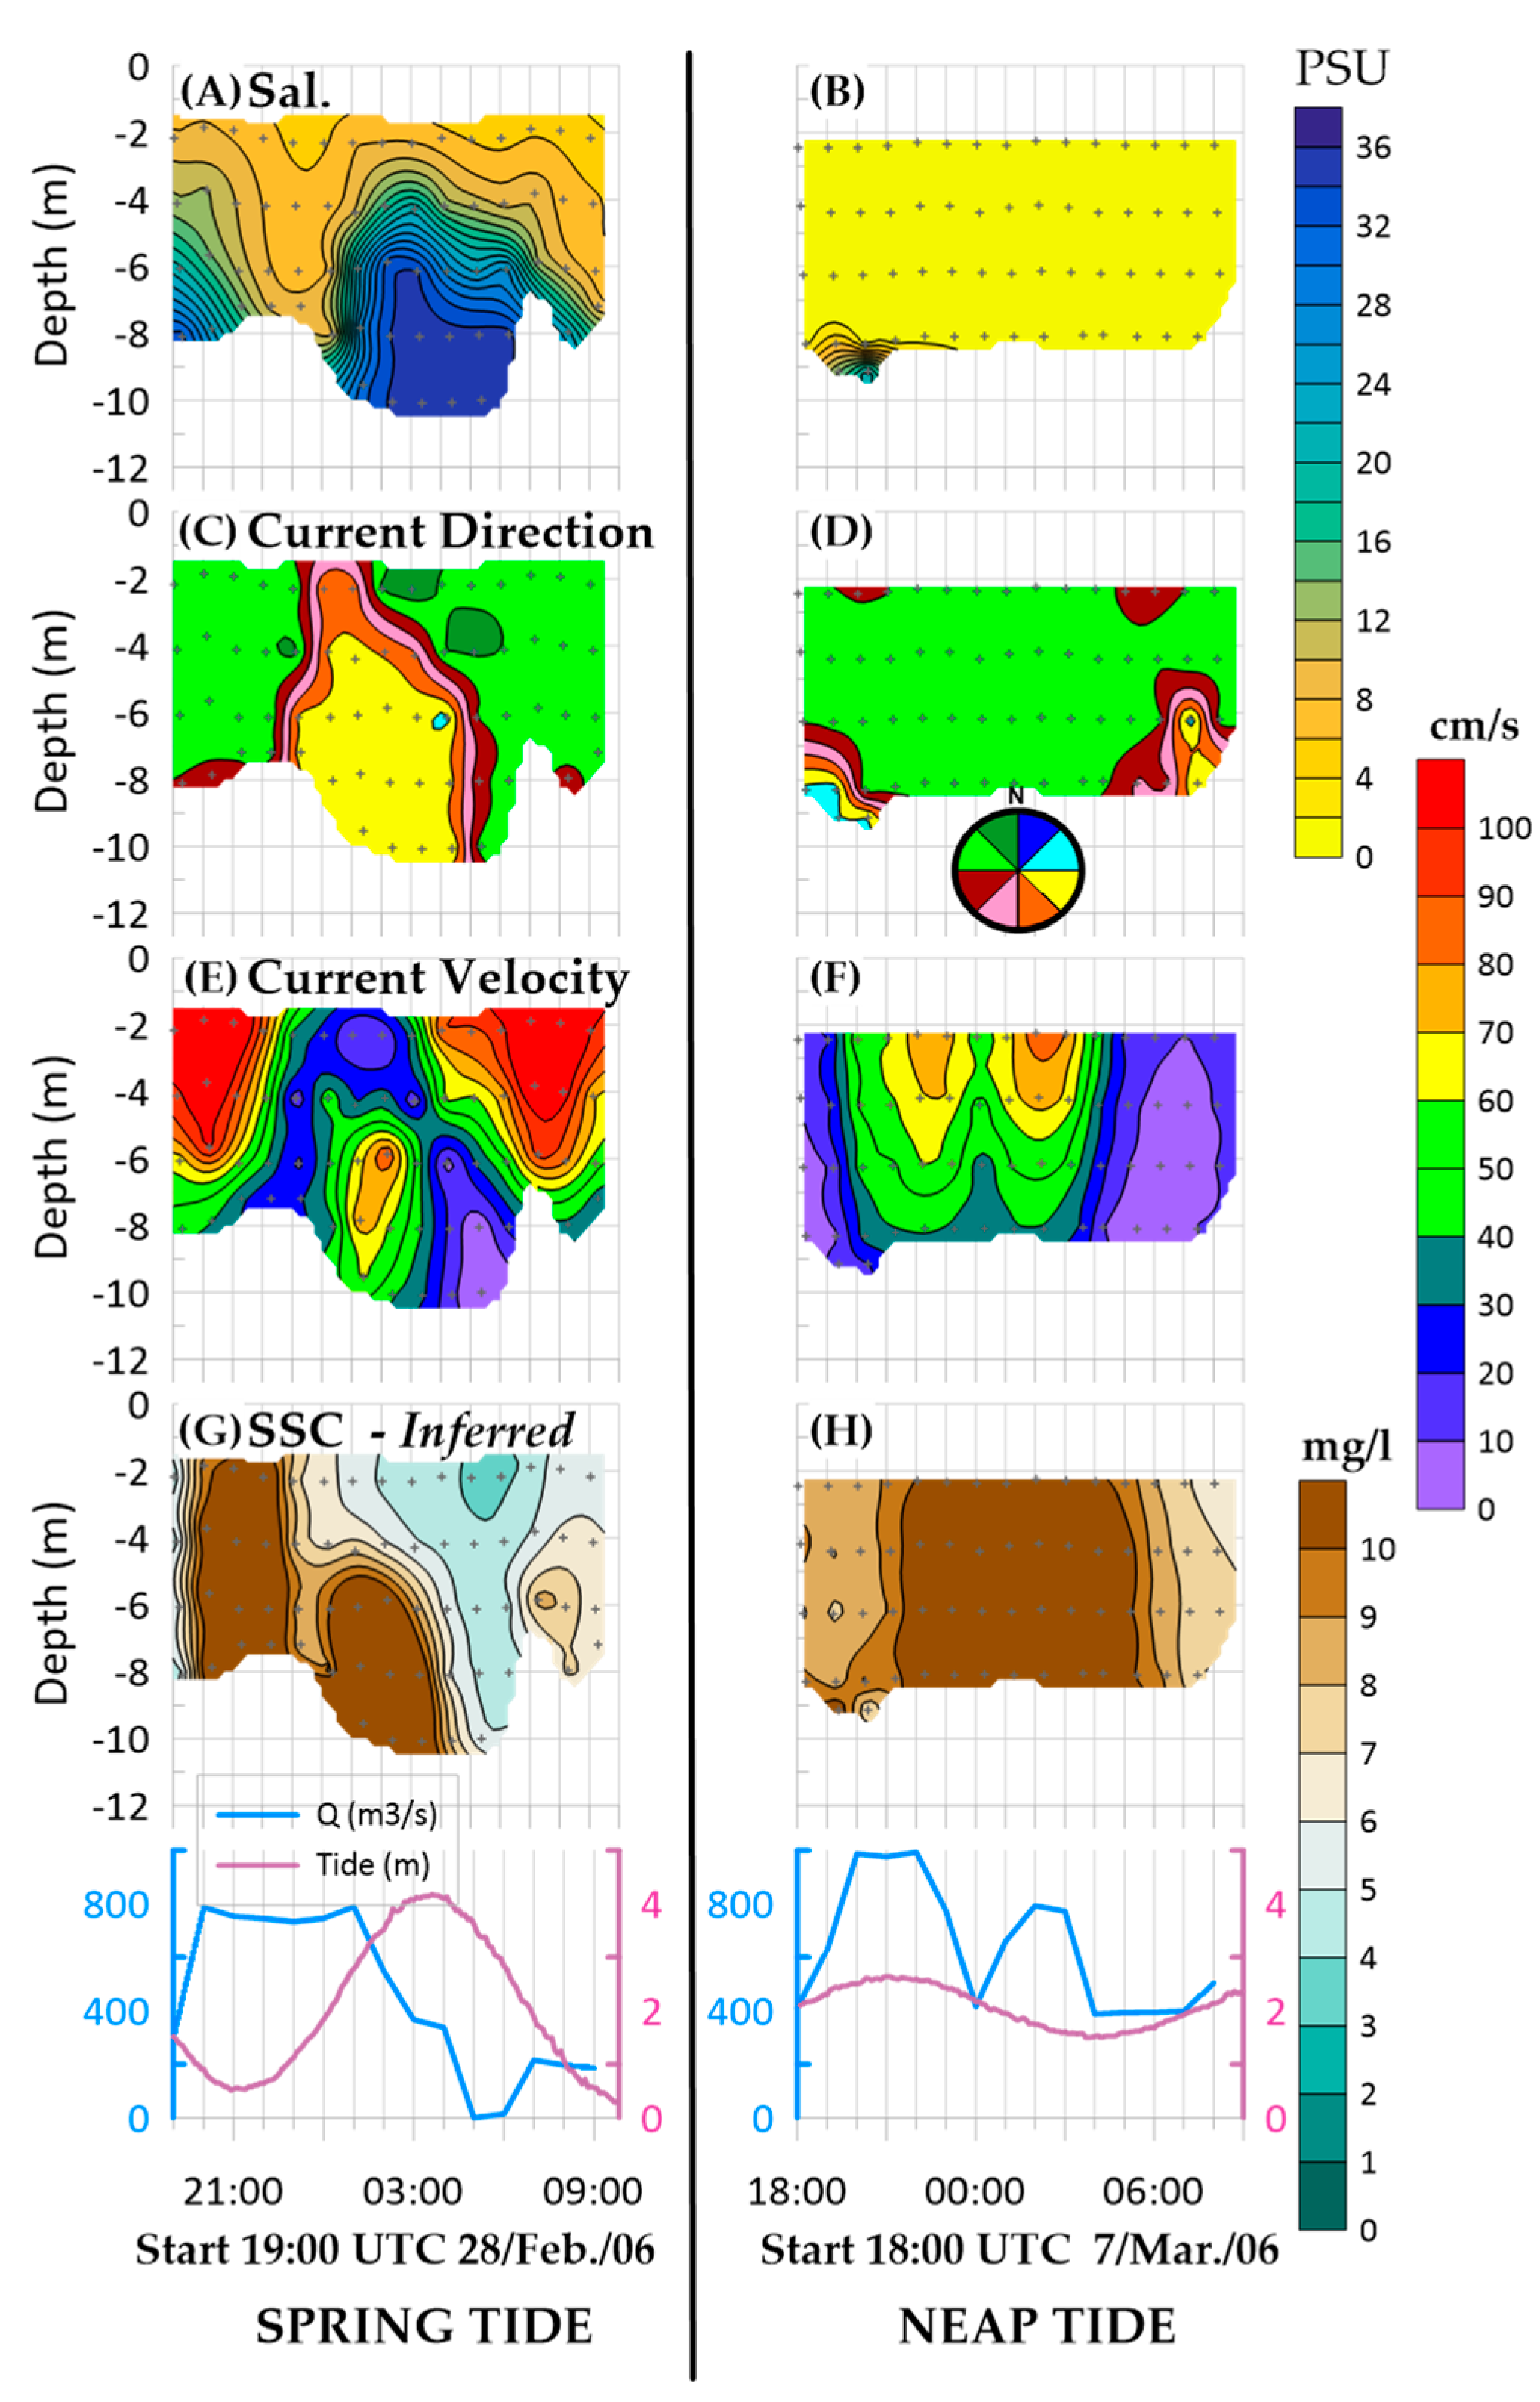
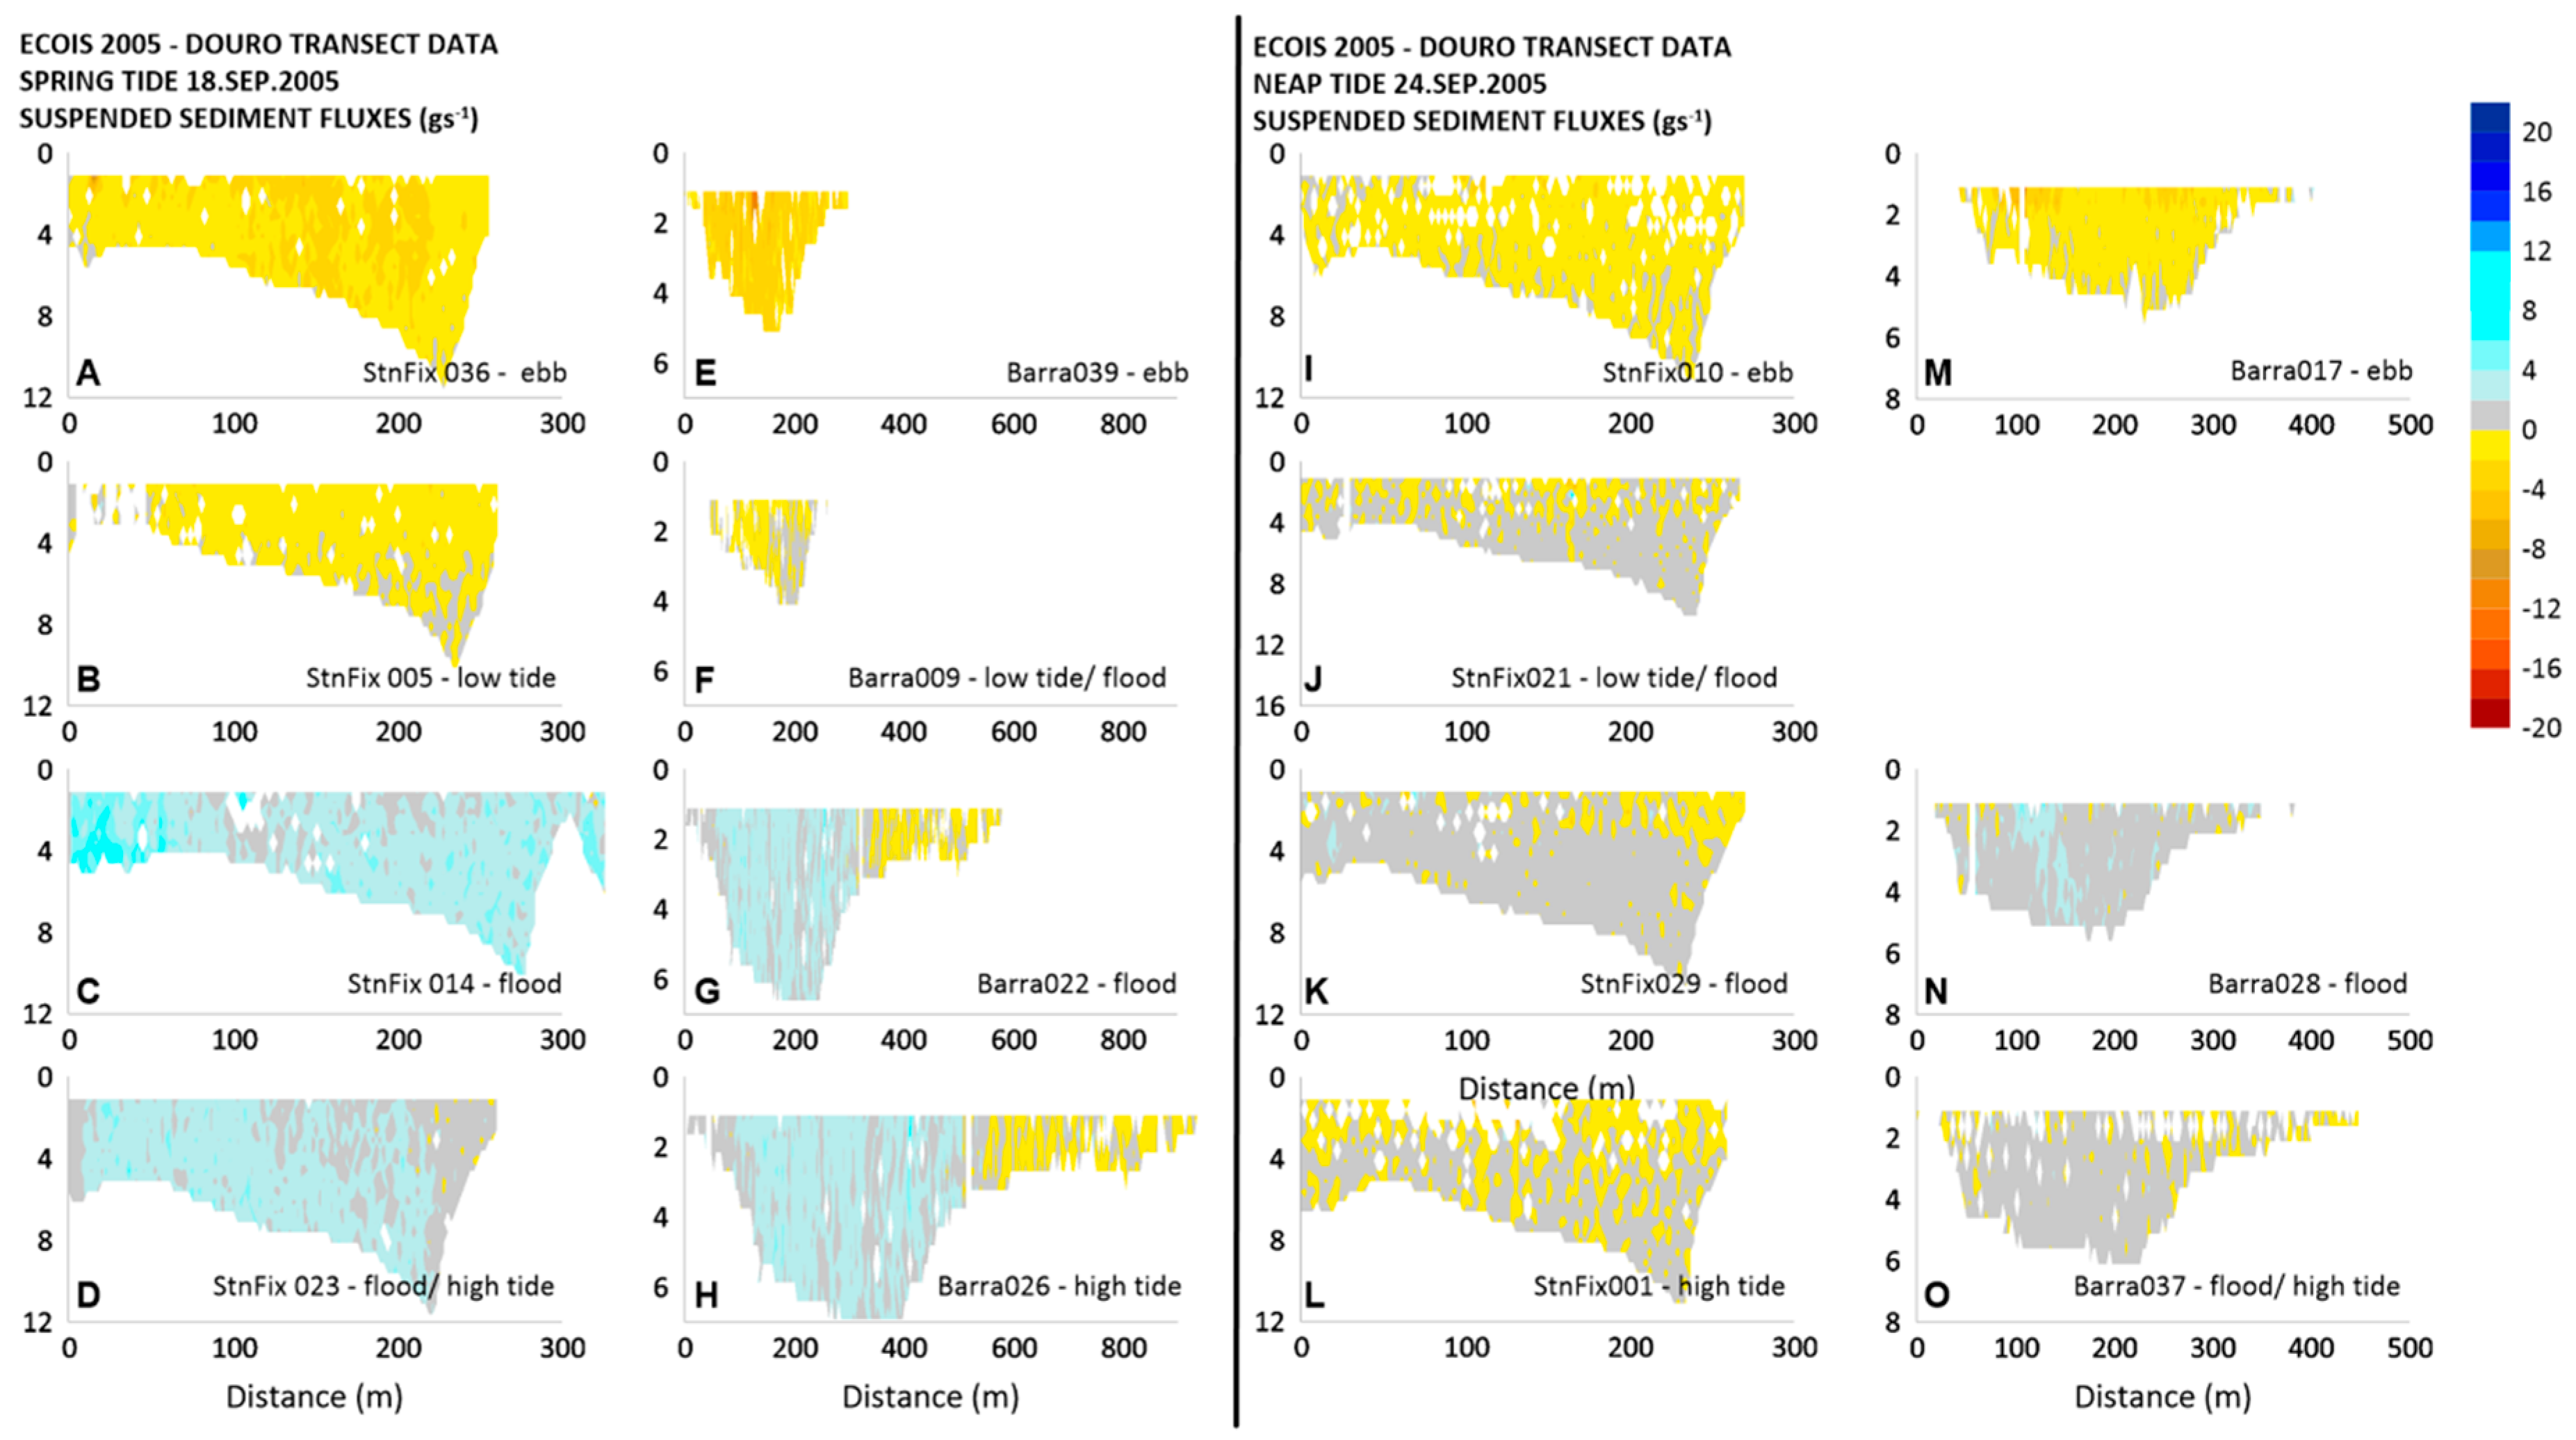
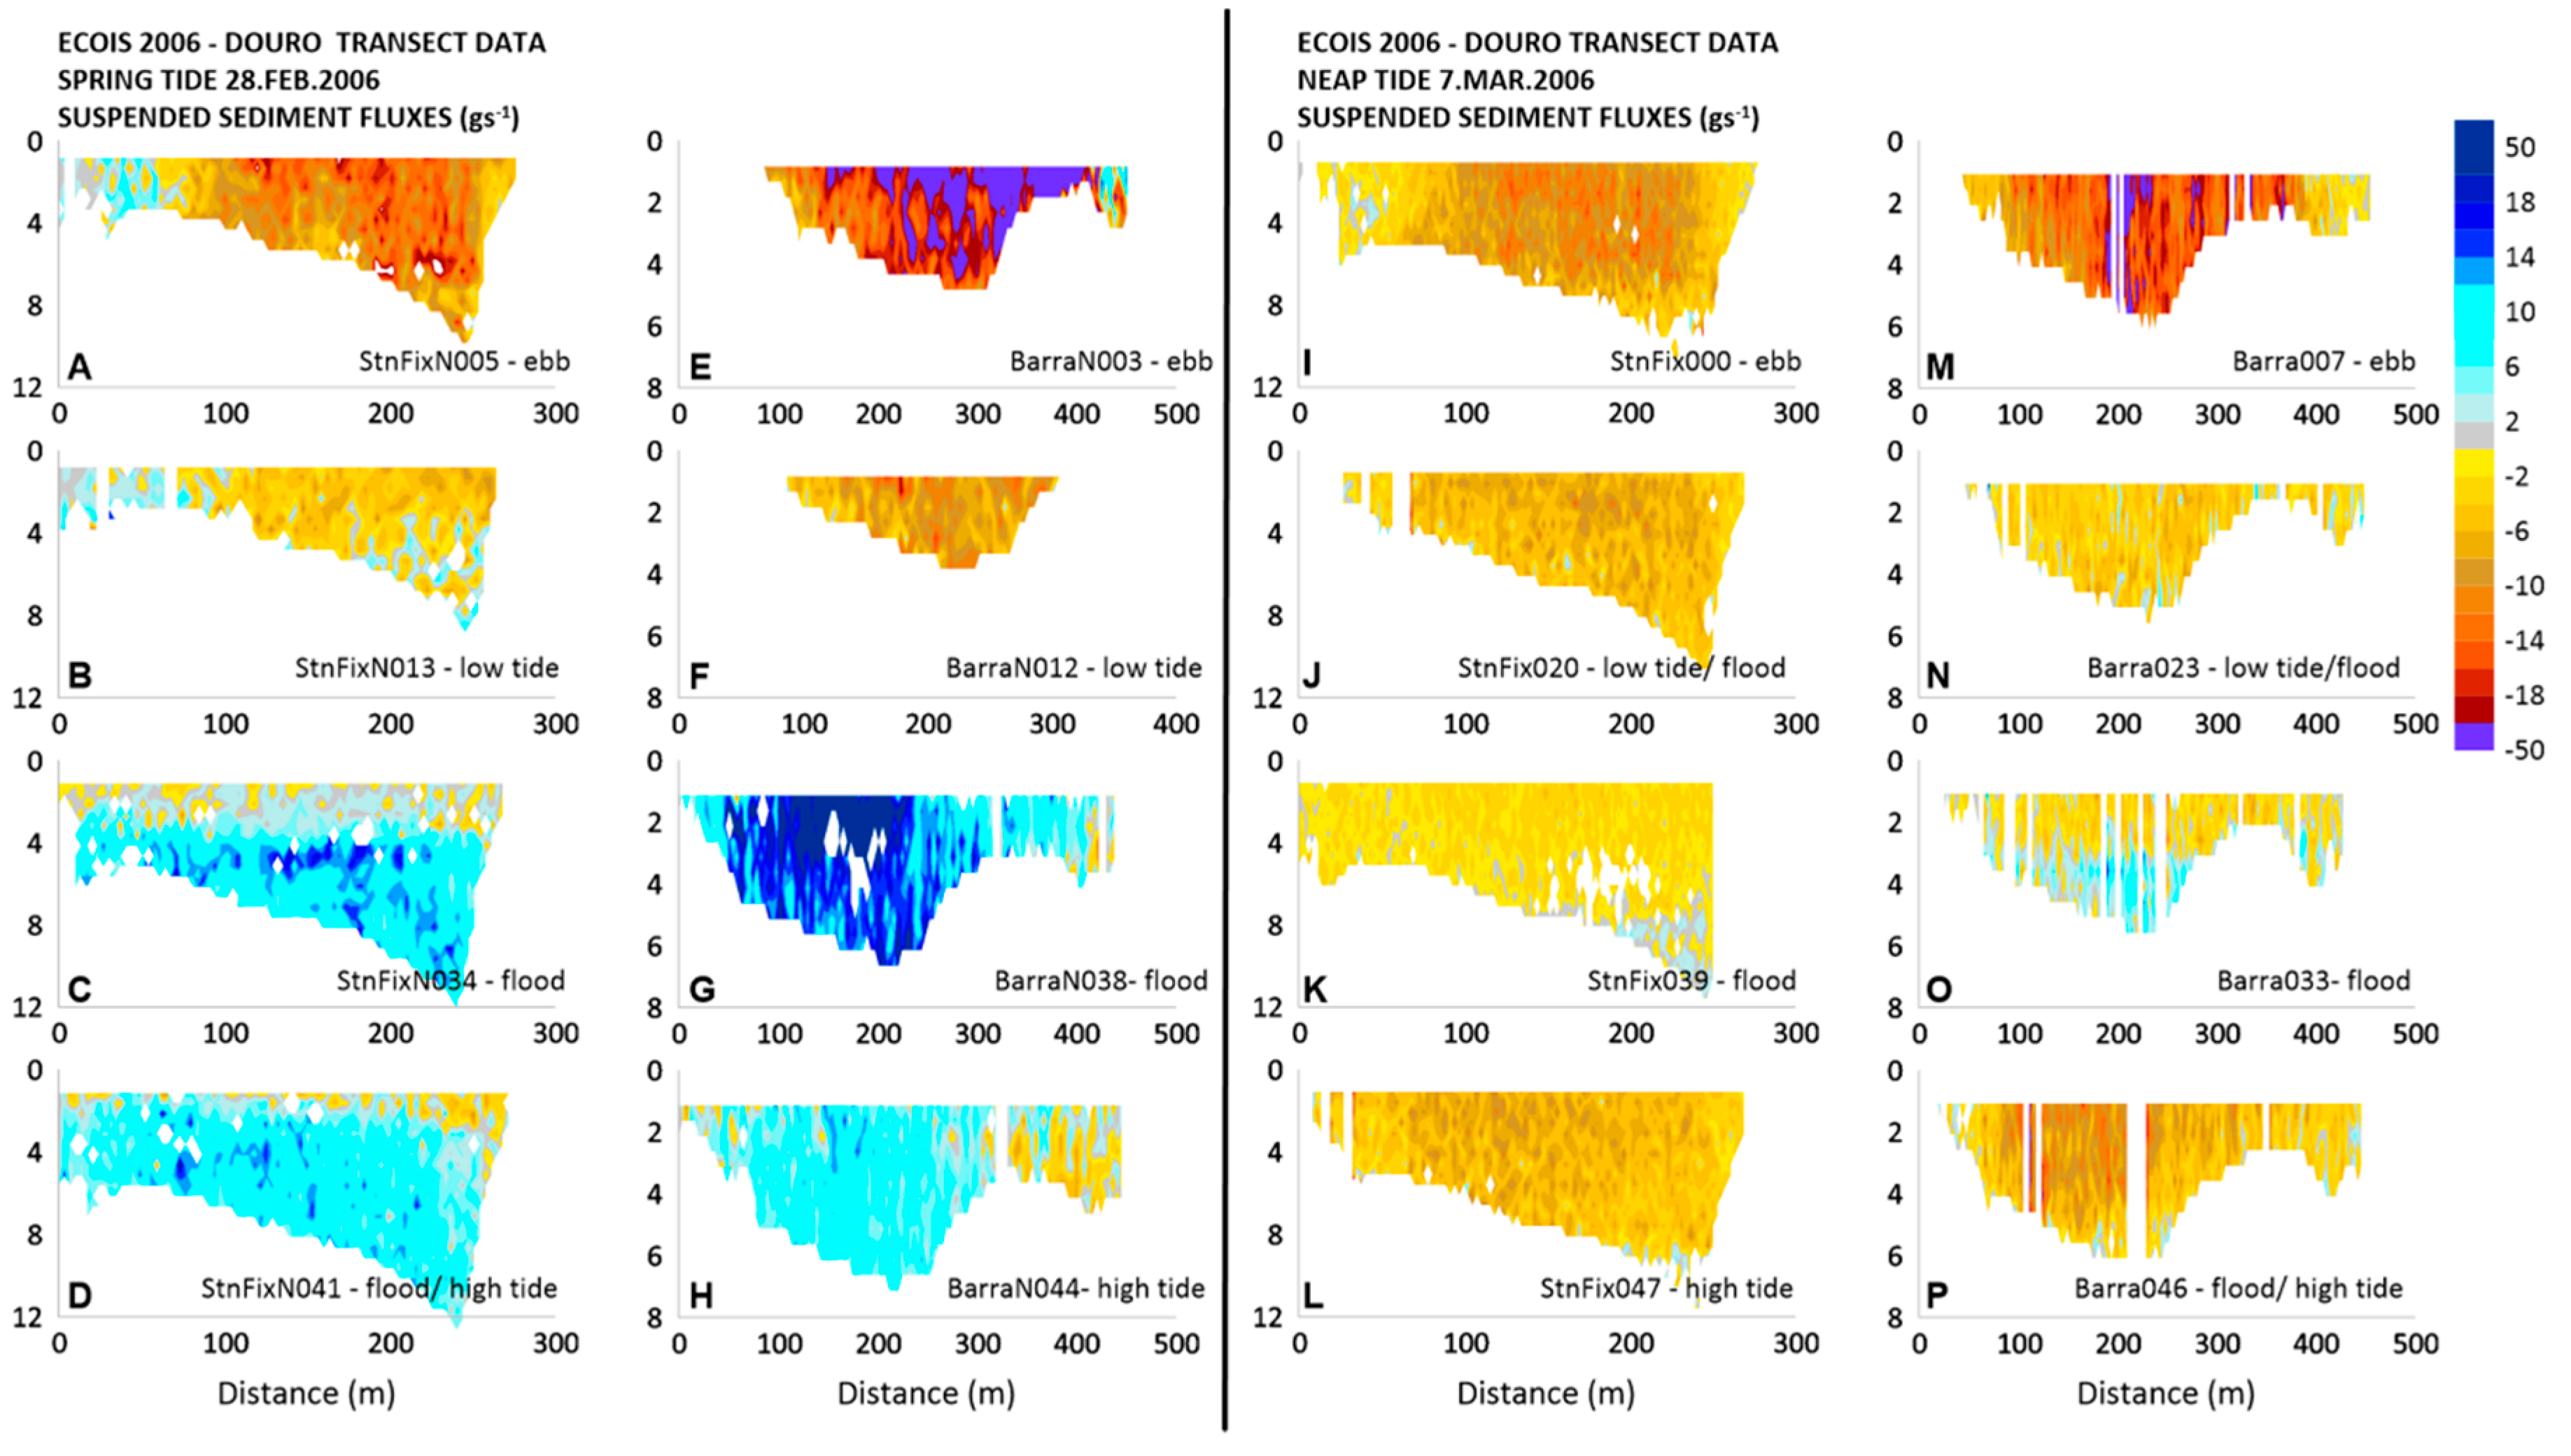
3.4. Douro
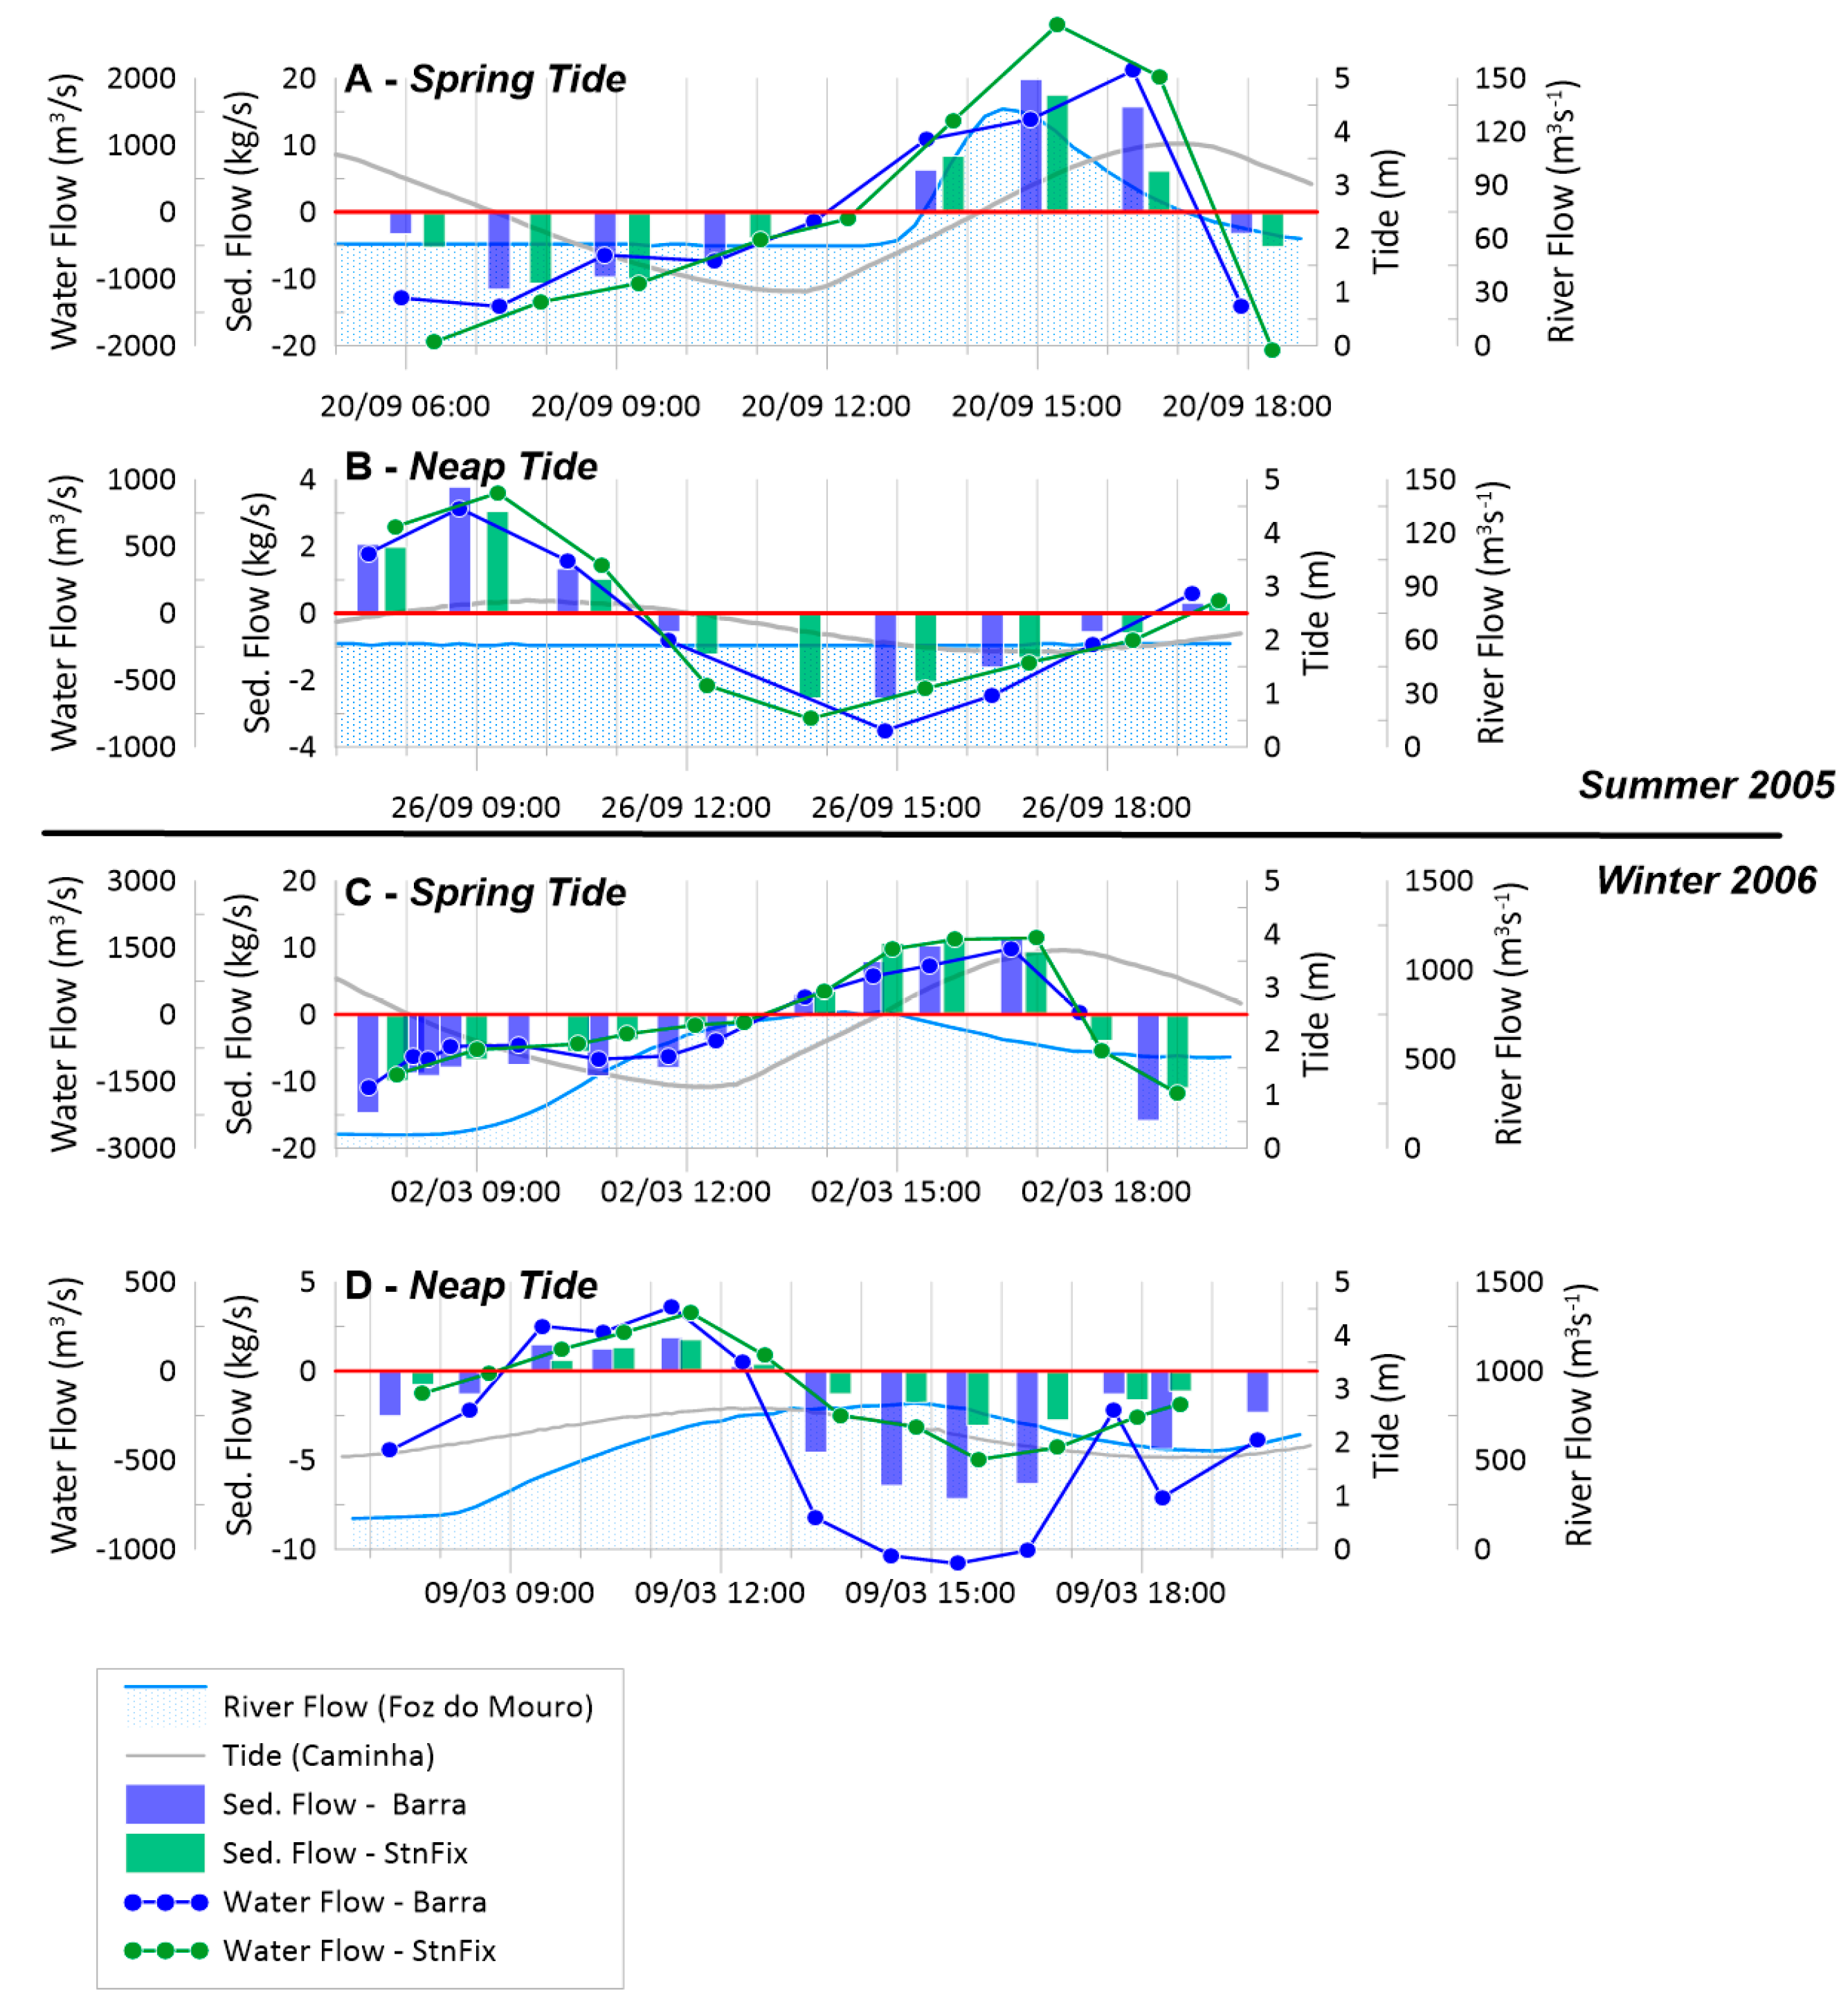
3.5. Estuary/Inner Shelf Sediment Exchange Patterns
4. Discussion and Final Conclusions
Author Contributions
Funding
Institutional Review Board Statement
Informed Consent Statement
Data Availability Statement
Acknowledgments
Conflicts of Interest
Appendix A

| Minho | Douro | |
|---|---|---|
| 2005—Spring Tides | Fixed Station Start: 13:00 UTC 19/09/2005 End: 18:00 UTC 20/09/2005 ADCP Transects Start: 06:00 UTC 20/09/2005 End: 18:00 UTC 20/09/2005 | Fixed Station Start: 13:00 UTC 17/09/2005 End: 18:00 UTC 18/09/2005 ADCP Transects Start: 07:00 UTC 18/09/2005 End: 19:00 UTC 18/09/2005 |
| 2005—Neap Tides | Fixed Station Start: 06:00 UTC 26/09/2005 End: 11:00 UTC 27/09/2005 ADCP Transects Start: 07:00 UTC 26/09/2005 End: 19:00 UTC 26/09/2005 | Fixed Station Start: 05:00 UTC 24/09/2005 End: 09:00 UTC 25/09/2005 ADCP Transects Start: 07:00 UTC 24/09/2005 End: 19:00 UTC 24/09/2005 |
| 2006—Spring Tides | Fixed Station Start: 06:00 UTC 02/03/2006 End: 21:00 UTC 02/03/2006 ADCP Transects Start: 07:00 UTC 02/03/2006 End: 19:00 UTC 02/03/2006 | Fixed Station Start: 19:00 UTC 28/02/2006 End: 09:00 UTC 01/03/2006 ADCP Transects Start: 06:00 UTC 28/02/2006 End: 19:00 UTC 28/02/2006 |
| 2006—Neap Tides | Fixed Station Start: 07:00 UTC 02/03/2006 End: 21:00 UTC 02/03/2006 ADCP Transects Start: 07:00 UTC 02/03/2006 End: 19:00 UTC 02/03/2006 | Fixed Station Start: 18:00 UTC 07/03/2006 End: 09:00 UTC 08/03/2006 ADCP Transects Start: 10:00 UTC 08/03/2006 End: 24:00 UTC 08/03/2006 |
References
- Iglesias, I.; Venâncio, S.; Pinho, J.L.; Avilez-Valente, P.; Vieira, J.M.P. Two Models Solutions for the Douro Estuary: Flood Risk Assessment and Breakwater Effects. Estuaries Coasts 2019, 42, 348–364. [Google Scholar] [CrossRef]
- Hopkinson, C.S.; Vallino, J.J. The Relationships among Man’s Activities in Watersheds and Estuaries: A Model of Runoff Effects on Patterns of Estuarine Community Metabolism. Estuaries 1995, 18, 598. [Google Scholar] [CrossRef]
- Andrade, C.F. Dinâmica Erosão e Conservação Das Zonas de Praia; Parque EXPO 98: Lisboa, Portugal, 1997; ISBN 972-8396-75-9. [Google Scholar]
- Balsinha, M.J.; Santos, A.I.; Alves, A.M.; Oliveira, A.T. Textural Composition of Sediments from Minho and Douro Estuaries (Portugal) and Its Relation with Hydrodynamics. J. Coast. Res. 2009, 56, 1330–1334. [Google Scholar] [CrossRef]
- Duarte Santos, F.; Mota Lopes, A.; Moniz, G.; Ramos, L.; Taborda, R. Grupo de Trabalho do Litoral: Gestão da Zona Costeira: O Desafio da Mudança; Duarte Santos, F., Penha-Lopes, G., Mota Lopes, A., Eds.; Lisbon, Portugal, 2017; ISBN 978-989-99962-1-2. Available online: https://ce3c.ciencias.ulisboa.pt/outreach/press&events/ver.php?id=919? (accessed on 29 October 2021).
- Alveirinho Dias, J.M.; Boski, T.; Rodrigues, A.; Magalhães, F. Coast Line Evolution in Portugal since the Last Glacial Maximum until Present—A Synthesis. Mar. Geol. 2000, 170, 177–186. [Google Scholar] [CrossRef]
- Ministério do Ambiente, Ordenamento do Território e Energia—Gabinete do Secretário de Estado do Ambiente. Cria o Grupo de Trabalho do Litoral; Gabinete do Secretário de Estado do Ambiente: Lisboa, Portugal, 2014; pp. 13042–13043.
- Ponte Lira, C.; Nobre Silva, A.; Taborda, R.; Freire de Andrade, C. Coastline Evolution of Portuguese Low-Lying Sandy Coast in the Last 50 Years: An Integrated Approach. Earth Syst. Sci. Data 2016, 8, 265–278. [Google Scholar] [CrossRef] [Green Version]
- Alveirinho Dias, J.M.; Jouanneau, J.M.; Gonzalez, R.; Araújo, M.d.F.; Drago, T.; Garcia, C.; Oliveira, A.; Rodrigues, A.; Vitorino, J.; Weber, O. Present Day Sedimentary Processes on the Northern Iberian Shelf. Prog. Oceanogr. 2002, 52, 249–259. [Google Scholar] [CrossRef]
- Araújo, M.d.F.; Jouanneau, J.-M.; Valério, P.; Gouveia, A.; Weber, O.; Oliveira, A.; Rodrigues, A.; Alveirinho Dias, J.A. Geochemical Tracers of Northern Portuguese Estuarine Sediments on the Shelf. Prog. Oceanogr. 2002, 52, 277–297. [Google Scholar] [CrossRef]
- Jouanneau, J.M.; Weber, O.; Drago, T.; Rodrigues, A.; Oliveira, A.; Dias, J.M.A.; Garcia, C.; Schmidt, S.; Reyss, J.L. Recent Sedimentation and Sedimentary Budgets on the Western Iberian Shelf. Prog. Oceanogr. 2002, 52, 261–275. [Google Scholar] [CrossRef]
- Vieira, M.E.C.; Bordalo, A.A. The Douro Estuary (Portugal): A Mesotidal Salt Wedge. Oceanol. Acta 2000, 23, 585–594. [Google Scholar] [CrossRef] [Green Version]
- Agência Portuguesa do Ambiente. Plano de Gestão da Região Hidrográfica do Minho e Lima—RH1; Agência Portuguesa do Ambiente: Amadora, Portugal, 2012.
- Agência Portuguesa do Ambiente. Plano de Gestão da Região Hidrográfica do Douro—RH3; Agência Portuguesa do Ambiente: Amadora, Portugal, 2012.
- Magalhães, F. Os Sedimentos da Plataforma Continental Portuguesa: Contrastes Espaciais, Perspetiva Temporal, Potencialidades Económicas. Ph.D. Thesis, Universidade de Lisboa, Lisboa, Portugal, 1999. [Google Scholar]
- Oliveira, I.M.; Valle, A.F.; Miranda, F. Littoral Problems in the Portuguese West Coast. In Proceedings of the Coastal Engineering Proceedings, Cape Town, South Africa, 14–19 November 1982; pp. 1951–1969. [Google Scholar]
- Portela, L.I. Estudo Dos Problemas de Assoreamento e Erosão No Estuário do Rio Minho. Relatório 1: Informação de Base e Evolução Morfológica Recente—Estudo Realizado Para O INAG; Instituto da Água, Laboratório Nacional de Engenharia Civil: Lisboa, Portugal, 2007. [Google Scholar]
- Guerrero, M.; Rüther, N.; Haun, S.; Baranya, S. A Combined Use of Acoustic and Optical Devices to Investigate Suspended Sediment in Rivers. Adv. Water Resour. 2017, 102, 1–12. [Google Scholar] [CrossRef]
- Rai, A.K.; Kumar, A. Continuous Measurement of Suspended Sediment Concentration: Technological Advancement and Future Outlook. Measurement 2015, 76, 209–227. [Google Scholar] [CrossRef]
- Gray, J.R.; Gartner, J.W. Technological Advances in Suspended-Sediment Surrogate Monitoring. Water Resour. Res. 2010, 46. [Google Scholar] [CrossRef] [Green Version]
- Sassi, M.G.; Hoitink, A.J.F.; Vermeulen, B. Impact of Sound Attenuation by Suspended Sediment on ADCP Backscatter Calibrations. Water Resour. Res. 2012, 48, 1–14. [Google Scholar] [CrossRef]
- Landers, M.N. Review of methods to estimate fluvial suspended sediment characteristics from acoustic surrogate metrics. In Proceedings of the 2nd Joint Federal Interagency Conference, Las Vegas, NV, USA, 27 June–1 July 2010. 12p. [Google Scholar]
- Gartner, J.W. Estimating Suspended Solids Concentrations from Backscatter Intensity Measured by Acoustic Doppler Current Profiler in San Francisco Bay, California. Mar. Geol. 2004, 211, 169–187. [Google Scholar] [CrossRef]
- Hoitink, A.J.F.; Hoekstra, P. Observations of Suspended Sediment from ADCP and OBS Measurements in a Mud-Dominated Environment. Coast. Eng. 2005, 52, 103–118. [Google Scholar] [CrossRef]
- Guerrero, M.; Rüther, N.; Szupiany, R.; Haun, S.; Baranya, S.; Latosinski, F. The Acoustic Properties of Suspended Sediment in Large Rivers: Consequences on ADCP Methods Applicability. Water 2016, 8, 13. [Google Scholar] [CrossRef] [Green Version]
- Latosinski, F.G.; Szupiany, R.N.; García, C.M.; Guerrero, M.; Amsler, M.L. Estimation of Concentration and Load of Suspended Bed Sediment in a Large River by Means of Acoustic Doppler Technology. J. Hydraul. Eng. 2014, 140, 04014023. [Google Scholar] [CrossRef]
- Moore, S.A.; Le Coz, J.; Hurther, D.; Paquier, A. Using Multi-Frequency Acoustic Attenuation to Monitor Grain Size and Concentration of Suspended Sediment in Rivers. J. Acoust. Soc. Am. 2013, 133, 1959–1970. [Google Scholar] [CrossRef] [PubMed]
- Topping, D.J.; Wright, S.A.; Melis, T.S.; Rubin, D.M. High-resolution measurements of suspended-sediment concentration and grain size in the Colorado River in Grand Canyon Using a Multi-Frequency Acoustic System. In Proceedings of the 10th International Symposium on River Sedimentation; World Association for Sediment and Erosion Research Moscow, Moscow, Russia, 1–4 August 2007; Volume 3, p. 19. [Google Scholar]
- Wright, S.A.; Topping, D.J.; Williams, C.A. Discriminating silt-and-clay from suspended-sand in rivers using side-looking acoustic profilers. In Proceedings of the 2nd Joint Federal Interagency Conference, Las Vegas, NV, USA, 27 June–1 July 2010. 12p. [Google Scholar] [CrossRef]
- ECOIS Team. ECOIS—Estuarine Contributions on Inner Shelf Dynamics (POCTI/CTA/48461/2002). Relatório Final; ECOIS Team: Lisboa, Portugal, 2008. [Google Scholar]
- Melo, W.; Pinho, J.; Iglesias, I.; Bio, A.; Avilez-Valente, P.; Vieira, J.; Bastos, L.; Veloso-Gomes, F. Hydro- and Morphodynamic Impacts of Sea Level Rise: The Minho Estuary Case Study. J. Mar. Sci. Eng. 2020, 8, 441. [Google Scholar] [CrossRef]
- Iglesias, I.; Avilez-Valente, P.; Bio, A.; Bastos, L. Modelling the Main Hydrodynamic Patterns in Shallow Water Estuaries: The Minho Case Study. Water 2019, 11, 1040. [Google Scholar] [CrossRef] [Green Version]
- Bastos, L.; Bio, A.; Pinho, J.L.S.; Granja, H.; Jorge da Silva, A. Dynamics of the Douro Estuary Sand Spit before and after Breakwater Construction. Estuar. Coast. Shelf Sci. 2012, 109, 53–69. [Google Scholar] [CrossRef]
- Oliveira, A.; Santos, A.I.; Morgado, A.; Jorge da Silva, A. Suspended sediment mineralogical signature—An approach to understand shelf water hydrodynamics. In Proceedings of the PECS 2008: Physics of Estuaries and Coastal Seas, Liverpool, UK, 25–29 August 2008. [Google Scholar]
- Santos, A.I.; Oliveira, A.; Balsinha, M.J. Suspended particulate matter tidal and seasonal variation in two mesotidal estuaries—Douro and minho (NW Portugal). In Proceedings of the PECS 2008: Physics of Estuaries and Coastal Seas, Liverpool, UK, 25–29 August 2008. [Google Scholar]
- Santos, A.I.; Balsinha, M.J.; Oliveira, A.; Jorge da Silva, A. Tide induced variability in the hydrography and dynamics of the minho and douro estuaries during low runoff. In Proceedings of the 5th Symposium on the Atlantic Iberian Margin—Abstract Book; Rocha, F., Terroso, D., Santos, A., Eds.; Universidade de Aveiro: Aveiro, Portugal, 2006; pp. 195–196. [Google Scholar]
- Portela, L.I. Sediment Transport and Morphodynamics of the Douro River Estuary. Geo-Mar. Lett. 2008, 28, 77–86. [Google Scholar] [CrossRef]
- Instituto Hidrográfico. Campanha Hidro-Morfológica Para o Estudo da Barra do Douro—Trabalho Realizado a Pedido da APDL—SET/OUT 1994; Instituto Hidrográfico: Lisboa, Portugal, 1995. [Google Scholar]
- Santos, A.I.; Carinhas, D.; Oliveira, A.; Pinto, J.P.; Freitas, M.C. Hydrodynamic and Sediment Transport Patterns in the Minho and Douro Estuaries (NW Portugal) Based on ADCP Monitoring Data: Part 2—Statistical Interpretation of Bottom Moored Datasets. Coasts 2021. under revision. [Google Scholar]
- Santos, A.I.; Carinhas, D.; Oliveira, A.; Pinto, J.P.; Freitas, M.C.; Hanes, D.M. A Statistical Interpretation of Acoustic Backscatter and Laser Responses to Suspended Particle Variations in the Coastal Shelf. Mar. Geol. 2021, 4, 106474. [Google Scholar] [CrossRef]
- Ribeiro, D.C.; Costa, S.; Guilhermino, L. A Framework to Assess the Vulnerability of Estuarine Systems for Use in Ecological Risk Assessment. Ocean. Coast. Manag. 2016, 119, 267–277. [Google Scholar] [CrossRef]
- Reis, J. Caracterização da Maré no Estuário do Minho; Instituto Superior Técnico, Universidade Técnica de Lisboa: Lisboa, Portugal, 2008. [Google Scholar]
- Instituto da Habitação e da Reabilitação Urbana. Forte da Ínsua—Inventário; Instituto da Habitação e da Reabilitação Urbana: Lisboa, Portugal, 2001. Available online: http://www.monumentos.gov.pt/Site/APP_PagesUser/SIPA.aspx?id=3607 (accessed on 29 October 2021).
- Ferreira, J.G.; Abreu, P.F.; Bettencourt, A.M.; Bricker, S.B.; Marques, J.C.; Joanaz de Melo, J.; Newton, A.; Nobre, A.M.; Patrício, J.; Salas, F.; et al. Monitoring Plan for Water Quality and Ecology for Portuguese Transitional and Coastal Waters. Development of Guidelines for the Application of the European Union Water Framework Directive; Ferreira, J.G., Ed.; INAG-IMAR; INAQ—Instituto da Agua: Ezeiza, Argentina, 2005; ISBN 972-9412-73-1. [Google Scholar]
- Reis, J.L.; Martinho, A.S.; Pires-Silva, A.A.; Silva, A.J. Assessing the Influence of the River Discharge on the Minho Estuary Tidal Regime. J. Coast. Res. 2009, 1405–1409. [Google Scholar]
- Azevedo, I.C.; Bordalo, A.; Duarte, P.M. Influence of River Discharge Patterns on the Hydrodynamics and Potential Contaminant Dispersion in the Douro Estuary (Portugal). Water Res. 2010, 44, 3133–3146. [Google Scholar] [CrossRef] [PubMed]
- Gómez-Gesteira, M.; Gimeno, L.; DeCastro, M.; Lorenzo, M.; Alvarez, I.; Nieto, R.; Taboada, J.; Crespo, A.; Ramos, A.; Iglesias, I.; et al. The State of Climate in NW Iberia. Clim. Res. 2011, 48, 109–144. [Google Scholar] [CrossRef] [Green Version]
- Dias, A.A.P. O Estuário do Rio Douro—O Risco de Cheias, Faculdade de Letras; Univesidade do Porto: Porto, Portugal, 2010. [Google Scholar]
- European Parliament Council of the European Union. Directive 2000/60/EC—Water Framework Directive; European Parliament Council of the European Union: Brussels, Belgium, 2000; pp. 1–73. [Google Scholar]
- Beck, H.E.; Zimmermann, N.E.; McVicar, T.R.; Vergopolan, N.; Berg, A.; Wood, E.F. Present and Future Köppen-Geiger Climate Classification Maps at 1-Km Resolution. Sci. Data 2018, 5, 180214. [Google Scholar] [CrossRef] [Green Version]
- Balsinha, M.J.; Santos, A.I.; Oliveira, A. Relação Turbidez vs. Concentração Nos Rios Douro e Minho—Calibração Dos Sensores de Turbidez Dos Correntómetros RCM9; Anais do Instituto Hidrográfico: Lisboa, Portugal, 2006; pp. 155–167. [Google Scholar]
- Wall, G.R.; Nystrom, E.A.; Litten, S. Use of an ADCP to Compute Suspended Sediment Discharge in the Tidal Hudson River, New York; U.S. Geological Survey Scientific Investigations Report 2006-5055; U.S. Geological Survey: Reston, VA, USA, 2006.
- Urick, R.J. Principles of Underwater Sound, 2nd ed.; McGraw Hill: New York, NY, USA, 1975. [Google Scholar]
- Santos, A.I.; Oliveira, A.; Carinhas, D.; Pinto, J.P.; Zacarias, N.; Freitas, M.C. The Acoustic Properties of In-Situ Measured Suspended Sediments and Their Implications on Concurrent ADCP Response—Case Studies of the Portuguese Inner Shelf. Mar. Geol. 2020, 419, 106079. [Google Scholar] [CrossRef]
- Thorne, P.D.; Meral, R. Formulations for the Scattering Properties of Suspended Sandy Sediments for Use in the Application of Acoustics to Sediment Transport Processes. Cont. Shelf Res. 2008, 28, 309–317. [Google Scholar] [CrossRef]
- Flammer, G.H. Ultrasonic measurement of suspended sediment. In U.S. Geological Survey Bulletin; U.S. Geological Survey: Reston, VA, USA, 1962. [Google Scholar]
- Gostiaux, L.; van Haren, H. Extracting Meaningful Information from Uncalibrated Backscattered Echo Intensity Data. J. Atmos. Oceanic Technol. 2010, 27, 943–949. [Google Scholar] [CrossRef]
- Han, Z.; Jin, Y.-Q.; Yun, C.-X. Suspended Sediment Concentrations in the Yangtze River Estuary Retrieved from the CMODIS Data. Null 2006, 27, 4329–4336. [Google Scholar] [CrossRef]
- Tattersall, G.R.; Elliott, A.J.; Lynn, N.M. Suspended Sediment Concentrations in the Tamar Estuary. Estuar. Coast. Shelf Sci. 2003, 57, 679–688. [Google Scholar] [CrossRef]
- Temmerman, S.; Govers, G.; Meire, P.; Wartel, S. Modelling Long-Term Tidal Marsh Growth under Changing Tidal Conditions and Suspended Sediment Concentrations, Scheldt Estuary, Belgium. Mar. Geol. 2003, 193, 151–169. [Google Scholar] [CrossRef]
- MacDonald, I.T.; Vincent, C.E.; Thorne, P.D.; Moate, B.D. Acoustic Scattering from a Suspension of Flocculated Sediments. J. Geophys. Res. Ocean. 2013, 118, 2581–2594. [Google Scholar] [CrossRef] [Green Version]
- Vincent, C.E.; MacDonald, I.T. A Flocculi Model for the Acoustic Scattering from Flocs. Cont. Shelf Res. 2015, 104, 15–24. [Google Scholar] [CrossRef]
- Dyer, K.R. Estuaries: A Physical Introduction; Wiley: Hoboken, NJ, USA, 1997; ISBN 9780471974710. [Google Scholar]
- Alveirinho Dias, J.M.; Gonzalez, R.; Garcia, C.; Diaz-del-Rio, V. Sediment Distribution Patterns on the Galicia-Minho Continental Shelf. Prog. Oceanogr. 2002, 52, 215–231. [Google Scholar] [CrossRef]
- Oliveira, A. Dinâmica da Matéria Particulada em Suspensão na Plataforma Continental Minhota—Sua Relação Com a Cobertura Sedimentar. Ph.D. Thesis, Universidade do Algarve, Faro, Portugal, 2001. [Google Scholar]
- Zhang, W.; Cui, Y.; Santos, A.I.; Hanebuth, T.J.J. Storm-Driven Bottom Sediment Transport on a High-Energy Narrow Shelf (NW Iberia) and Development of Mud Depocenters. J. Geophys. Res. Ocean. 2016, 121, 5751–5772. [Google Scholar] [CrossRef]


| B | A | #Points | R2 | p-Value | |
|---|---|---|---|---|---|
| Minho 2005 | 0.027 | −4.503 | 9 | 0.212 | 0.212 |
| Douro 2005 | 0.030 | −4.943 | 13 | 0.408 | 0.019 |
| Minho 2006 | 0.010 | −3.048 | 11 | 0.311 | 0.075 |
| Douro 2006 | 0.018 | −3.539 | 5 | 0.587 | 0.131 |
| >63 µm % | <63 µm % | Gravel (%) | Sand (%) | Silt (%) | Clay (%) | Mean (mm) | σ | D50 (mm) | ||
|---|---|---|---|---|---|---|---|---|---|---|
| Minho | Upper | 92.4 | 7.6 | 20.0 | 72.4 | 6.7 | 0.8 | 0.73 | 0.34 | 0.61 |
| Lower | 99.1 | 0.9 | 3.4 | 95.6 | 0.9 | 0.0 | 0.53 | 0.57 | 0.53 | |
| Douro | Upper | 98.3 | 1.7 | 49.5 | 48.8 | 1.6 | 0.2 | 2.06 | 0.33 | 2.09 |
| Middle | 78.8 | 21.2 | 33.4 | 45.4 | 19.2 | 2 | 0.60 | 0.20 | 0.75 | |
| Lower | 90.85 | 9.15 | 50.8 | 40.1 | 8.3 | 0.8 | 1.38 | 0.26 | 1.64 |
| >63 µm % | <63 µm % | Gravel (%) | Sand (%) | Silt (%) | Clay (%) | Mean (mm) | σ | D50 (mm) | ||
|---|---|---|---|---|---|---|---|---|---|---|
| Minho | 2005 | 3.8 | 96.2 | 0 | 3.8 | 79.2 | 17.0 | 0.009 | 0.36 | 0.010 |
| 2006 | 6.2 | 93.8 | 0 | 6.2 | 787 | 15.1 | 0.011 | 0.33 | 0.011 | |
| Douro | 2005 | 5.0 | 95.0 | 0.0 | 5.0 | 78.0 | 17.0 | 0.010 | 0.34 | 0.011 |
| 2006 | 3.8 | 96.2 | 0.0 | 3.8 | 80.4 | 15.9 | 0.011 | 0.35 | 0.011 |
| Survey Duration (Hours) (% of Total Tidal Cycle) | Water (×106 m3) | Sediments (×103 kg) | ||
|---|---|---|---|---|
| 20.SEP.2005 SPRING TIDE (12.3 h) 70.1 m3/s * | Barra | 12 (97%) | 2 | 50 |
| StnFix | 11.9 (97%) | 6 | 7 | |
| 26.SEP.2005 Neap tide (13.8 h) 113.1 m3/s * | Barra | 11.8 (85%) | −6 | −5 |
| StnFix | 11.8 (85%) | −5 | −10 | |
| 02.MAR.2006 Spring tide (12.5 h) 477.3 m3/s * | Barra | 11.1 (89%) | −8 | −70 |
| StnFix | 12 (96%) | 2 | −3 | |
| 09.MAR.2006 Neap tide (12.6 h) 557.4 m3/s * | Barra | 12.3 (98%) | −20 | −100 |
| StnFix | 10.8 (85%) | −4 | −30 |
| Survey Duration (Hours) (% of Total Tidal Cycle) | Water (×106 m3) | Sediments (×103 kg) | ||
|---|---|---|---|---|
| 18.SEP.2005 SPRING TIDE (12 h) 0 m3/s * | Barra | 11.2 (93%) | 10 | 30 |
| StnFix | 11.2 (93%) | 5 | 20 | |
| 24.SEP.2005 NEAP TIDE (12.2 h) 83.41 m3/s * | Barra | 11.4 (93%) | 2 | 4 |
| StnFix | 11.4 (93%) | −1 | −4 | |
| 28.FEB.2006 SPRING TIDE (12 h) 268.85 m3/s * | Barra | 13.4 (111%) | −3 | −20 |
| StnFix | 13.6 (113%) | −8 | −60 | |
| 7.MAR.2006 NEAP TIDE (12.4 h) 569.25 m3/s * | Barra | 13.9 (112%) | −30 | −200 |
| StnFix | 13.9 (112%) | −30 | −300 |
Publisher’s Note: MDPI stays neutral with regard to jurisdictional claims in published maps and institutional affiliations. |
© 2021 by the authors. Licensee MDPI, Basel, Switzerland. This article is an open access article distributed under the terms and conditions of the Creative Commons Attribution (CC BY) license (https://creativecommons.org/licenses/by/4.0/).
Share and Cite
Santos, A.I.; Oliveira, A.; Pinto, J.P.; Freitas, M.C. Hydrodynamic and Sediment Transport Patterns in the Minho and Douro Estuaries (NW Portugal) Based on ADCP Monitoring Data: Part 1-Tidal Sediment Exchanges. Coasts 2021, 1, 31-55. https://doi.org/10.3390/coasts1010003
Santos AI, Oliveira A, Pinto JP, Freitas MC. Hydrodynamic and Sediment Transport Patterns in the Minho and Douro Estuaries (NW Portugal) Based on ADCP Monitoring Data: Part 1-Tidal Sediment Exchanges. Coasts. 2021; 1(1):31-55. https://doi.org/10.3390/coasts1010003
Chicago/Turabian StyleSantos, Ana Isabel, Anabela Oliveira, José Paulo Pinto, and M. Conceição Freitas. 2021. "Hydrodynamic and Sediment Transport Patterns in the Minho and Douro Estuaries (NW Portugal) Based on ADCP Monitoring Data: Part 1-Tidal Sediment Exchanges" Coasts 1, no. 1: 31-55. https://doi.org/10.3390/coasts1010003
APA StyleSantos, A. I., Oliveira, A., Pinto, J. P., & Freitas, M. C. (2021). Hydrodynamic and Sediment Transport Patterns in the Minho and Douro Estuaries (NW Portugal) Based on ADCP Monitoring Data: Part 1-Tidal Sediment Exchanges. Coasts, 1(1), 31-55. https://doi.org/10.3390/coasts1010003