
Modeling the Knowledge Production Function Based on Bibliometric Information

Abstract
1. Introduction
“When , then the growth rate of technological progress would rise rapidly with increasing level of technology. However, such situations have not been observed in developed nations through postwar periods, so Barro and Sala-i-Martin [10] imposed the condition .”
- (i)
- The construction of the per capita knowledge production rate (productivity) as a function of knowledge amount;
- (ii)
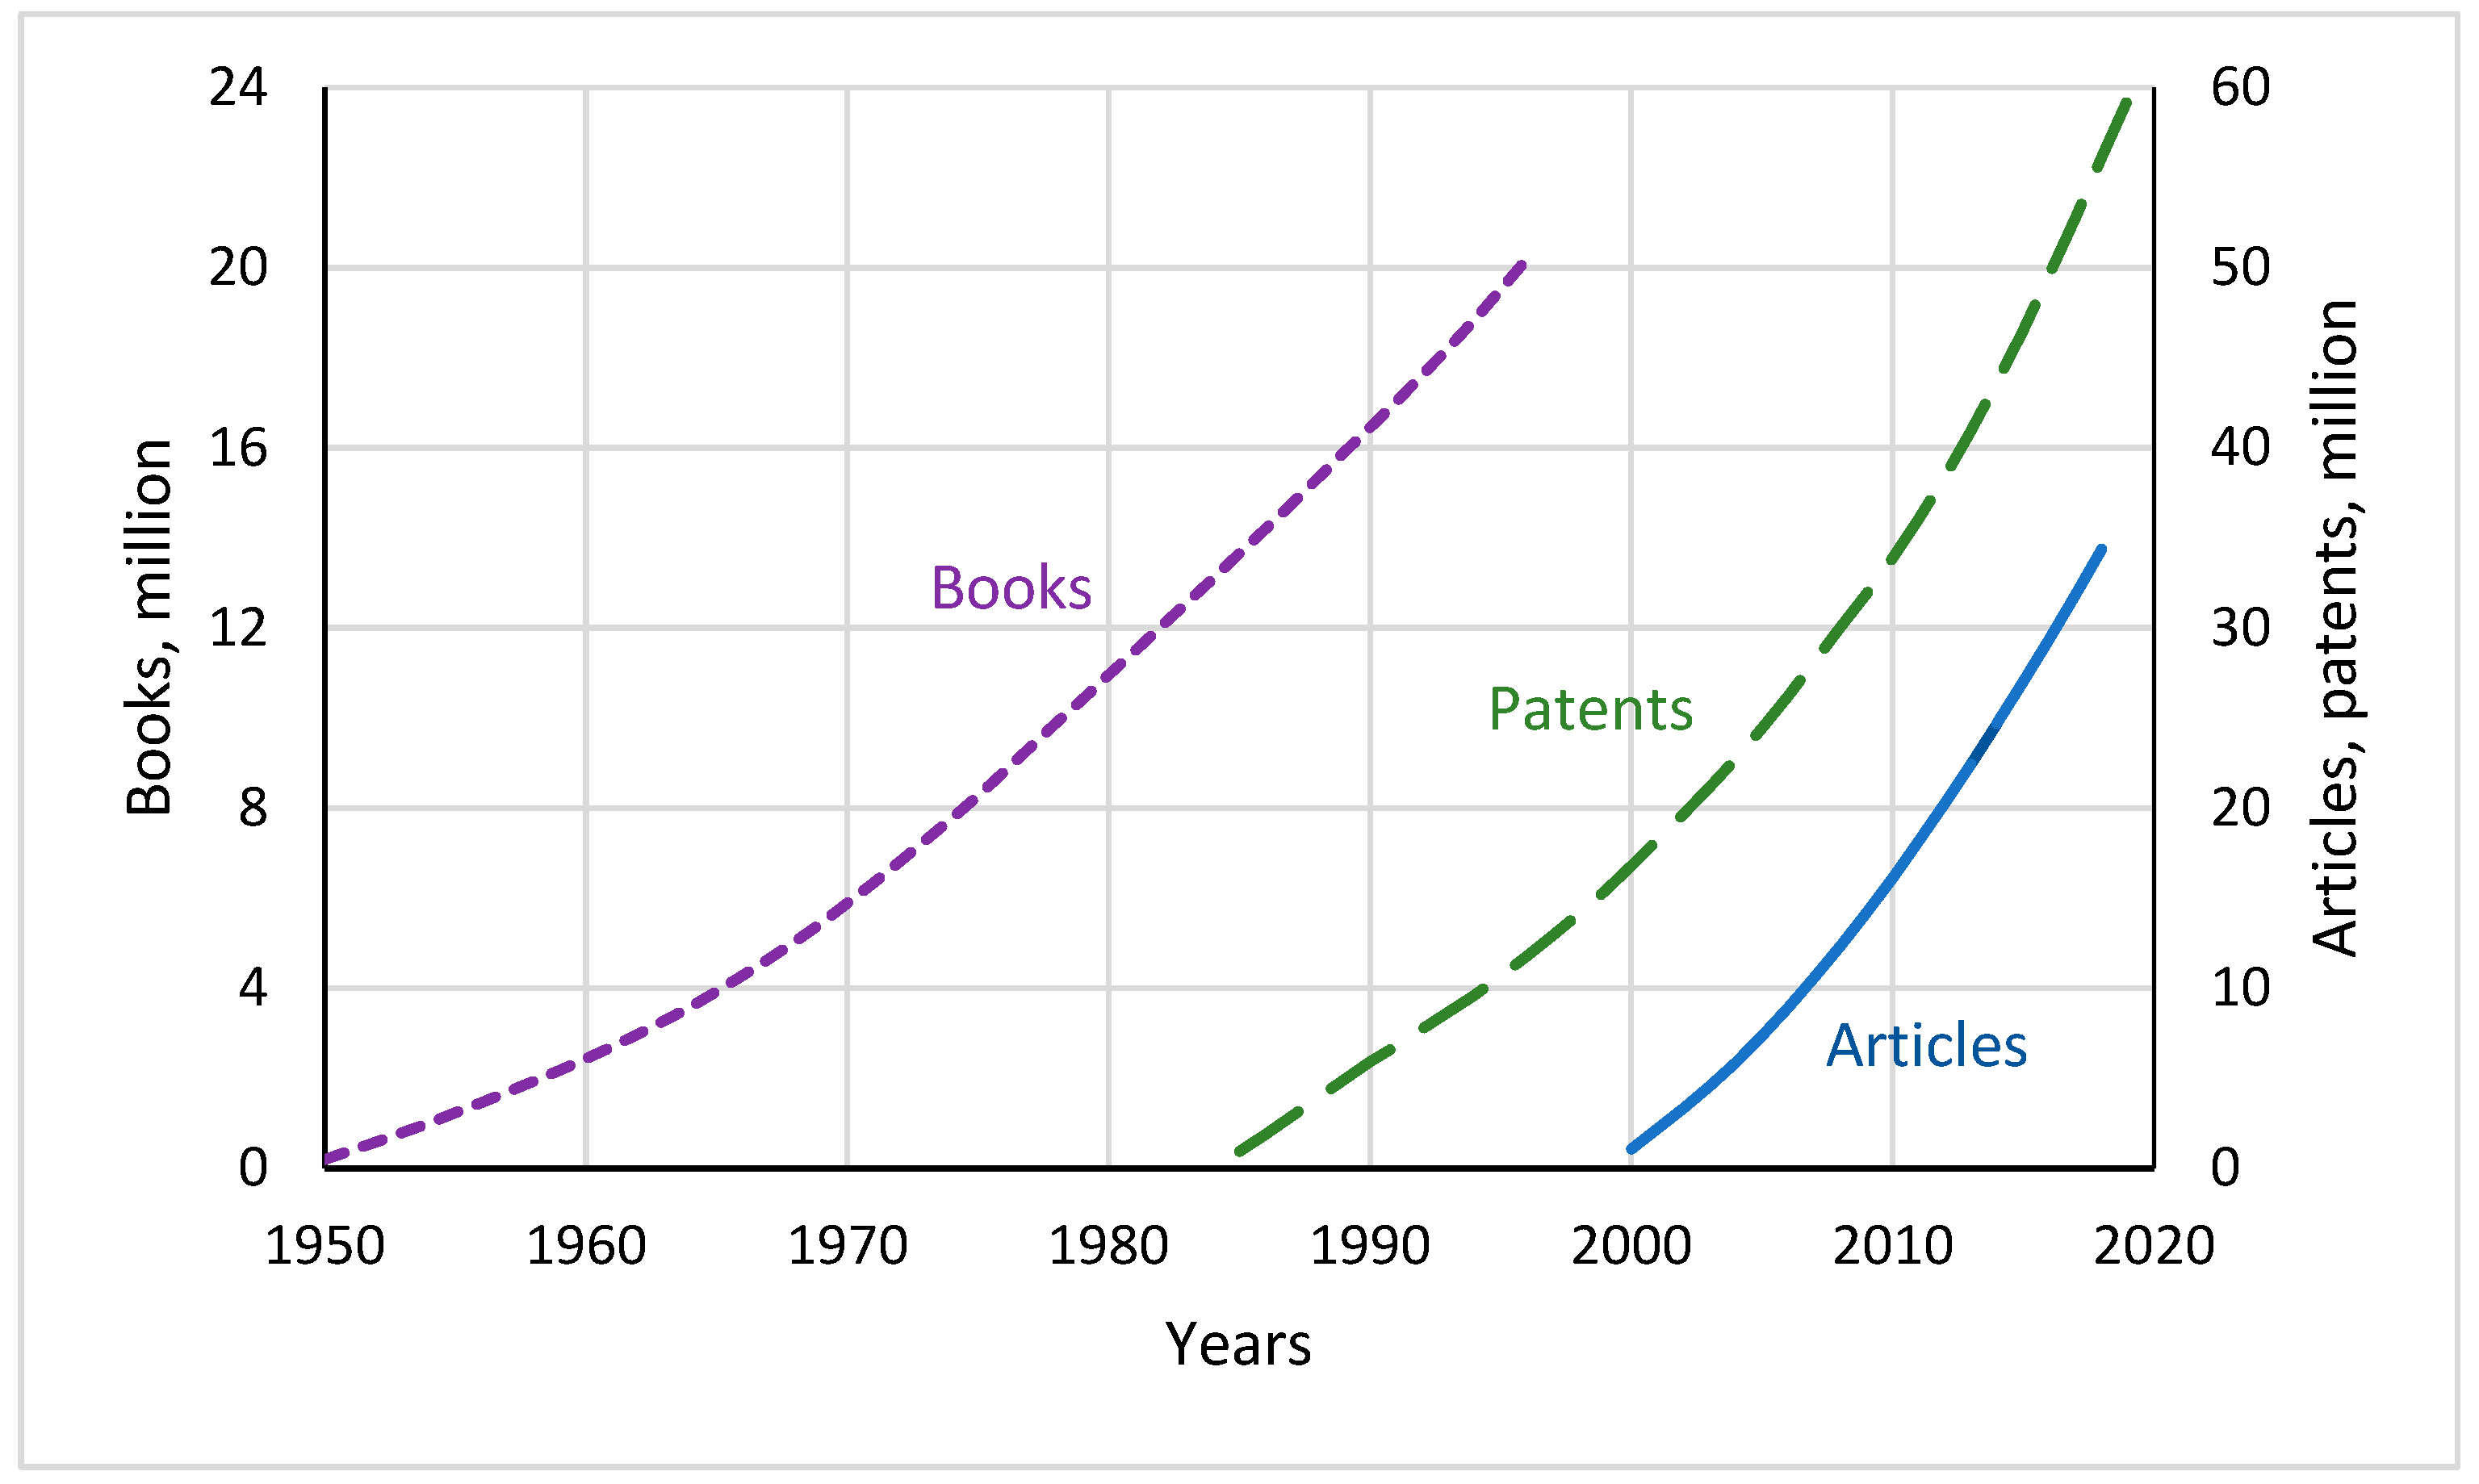
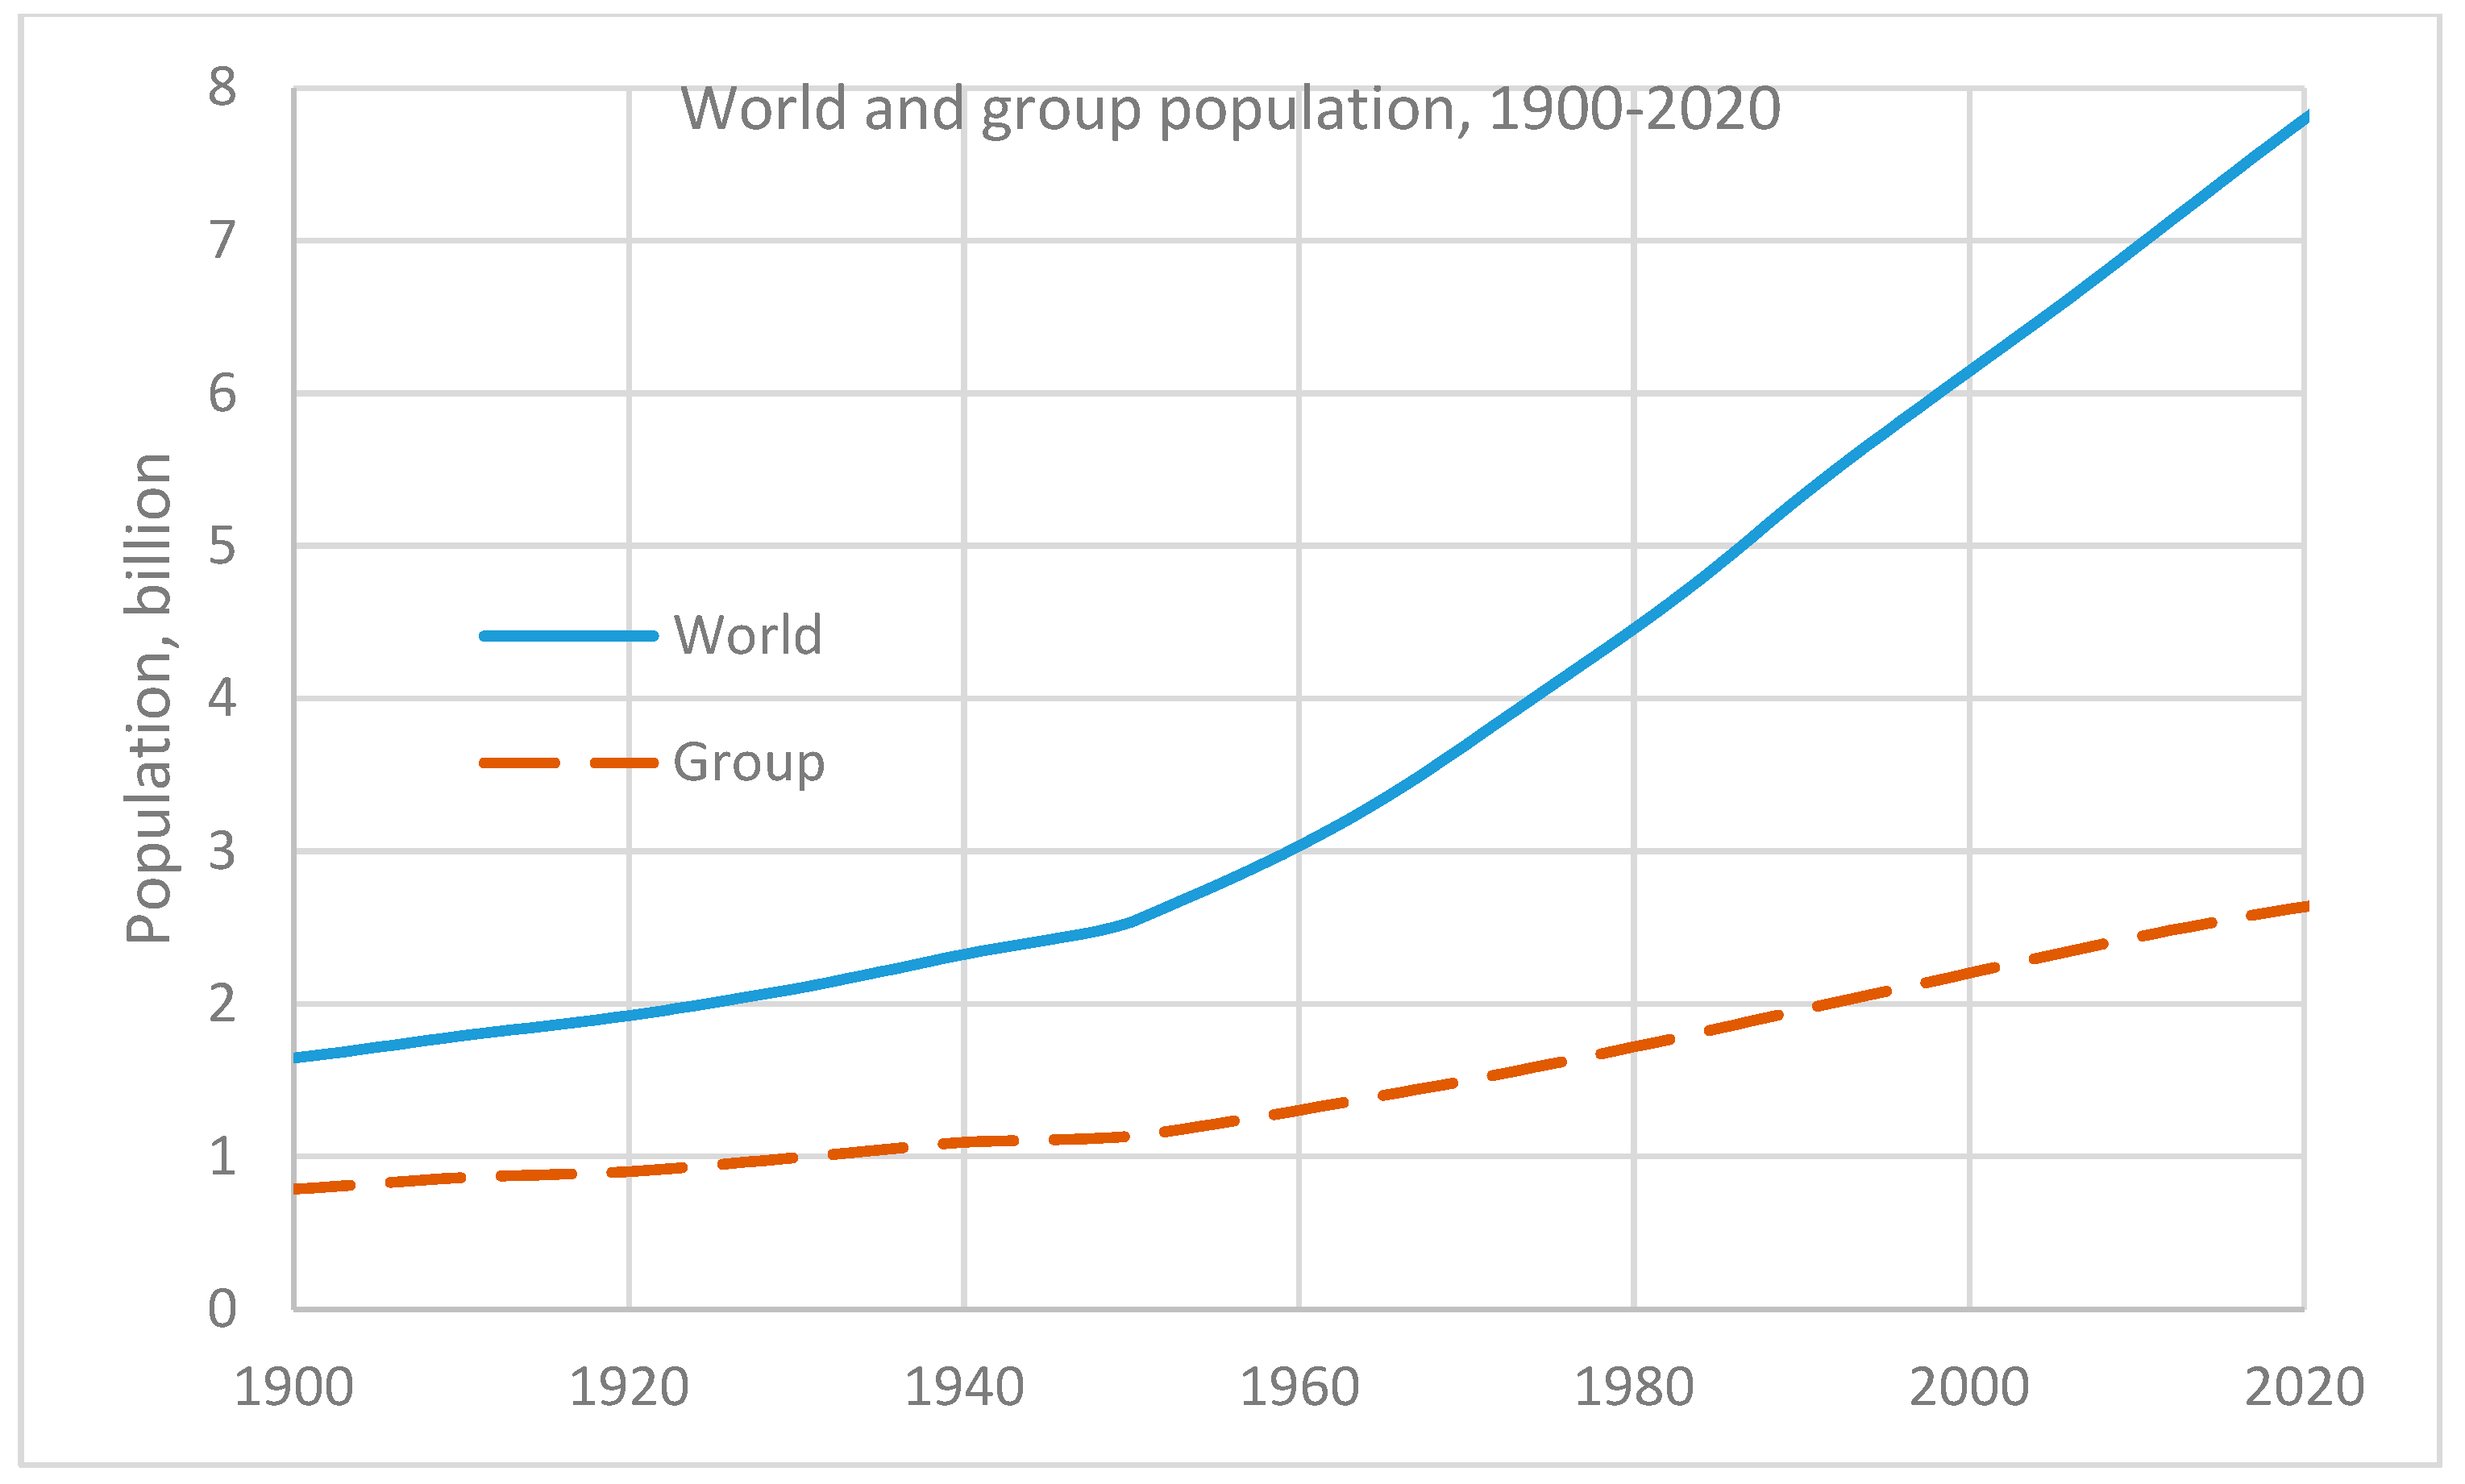
- The collection of literature data on patent applications, scientific and technical articles, books of all genres, the information storage capacity, the population, and the GDP series over time;
- (iii)
- The calibration of the developed model using the collected empirical data to find values of the model parameters and assess the model adequacy;
- (iv)
- The interpretation of the results obtained, including an assessment of the threshold knowledge amount separating the pre-information society from the information one, and finding the transition point between them.
2. Model
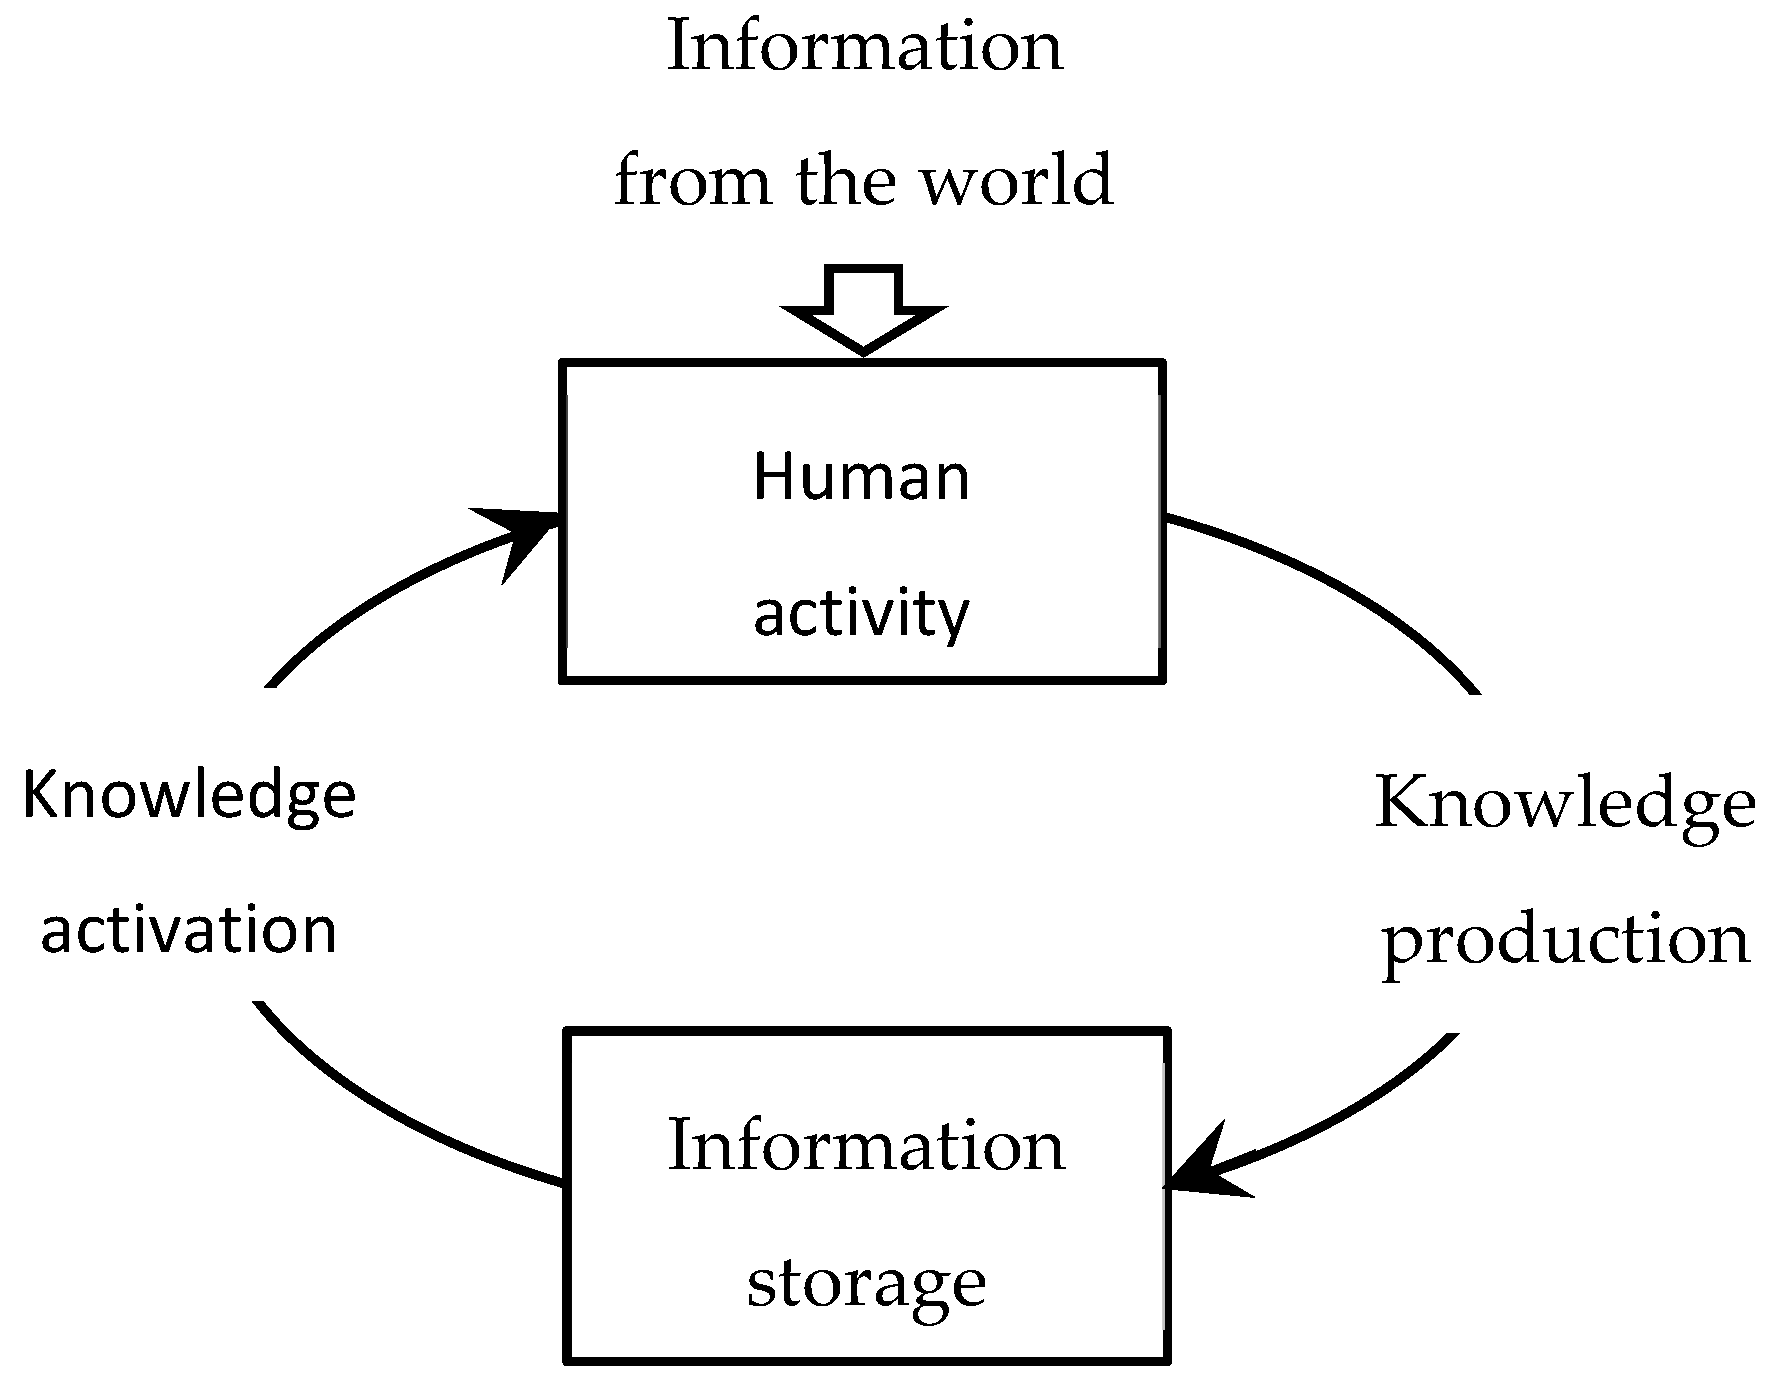
2.1. Knowledge Production and Accumulation
2.2. Productivity Function
- In an extremely undeveloped society , knowledge has not yet been accumulated (formally ), but knowledge is produced with a non-zero initial productivity ;
- In a highly developed information society , productivity increases slowly according to the power law with an exponent not exceeding 1 (since an average knowledge producer uses a very limited amount of knowledge in his creative process—this is close to the opinion of Barro and Sala-i-Martin [10], mentioned in the Introduction).
- Constant productivity
- Productivity as a linear function of knowledge
2.3. Asymptotics
2.4. Exponential Productivity
3. Model Calibration
3.1. From Continuous to Discrete
3.2. Bibliometric Data
3.3. Initial Amount of Knowledge
4. Results and Discussion
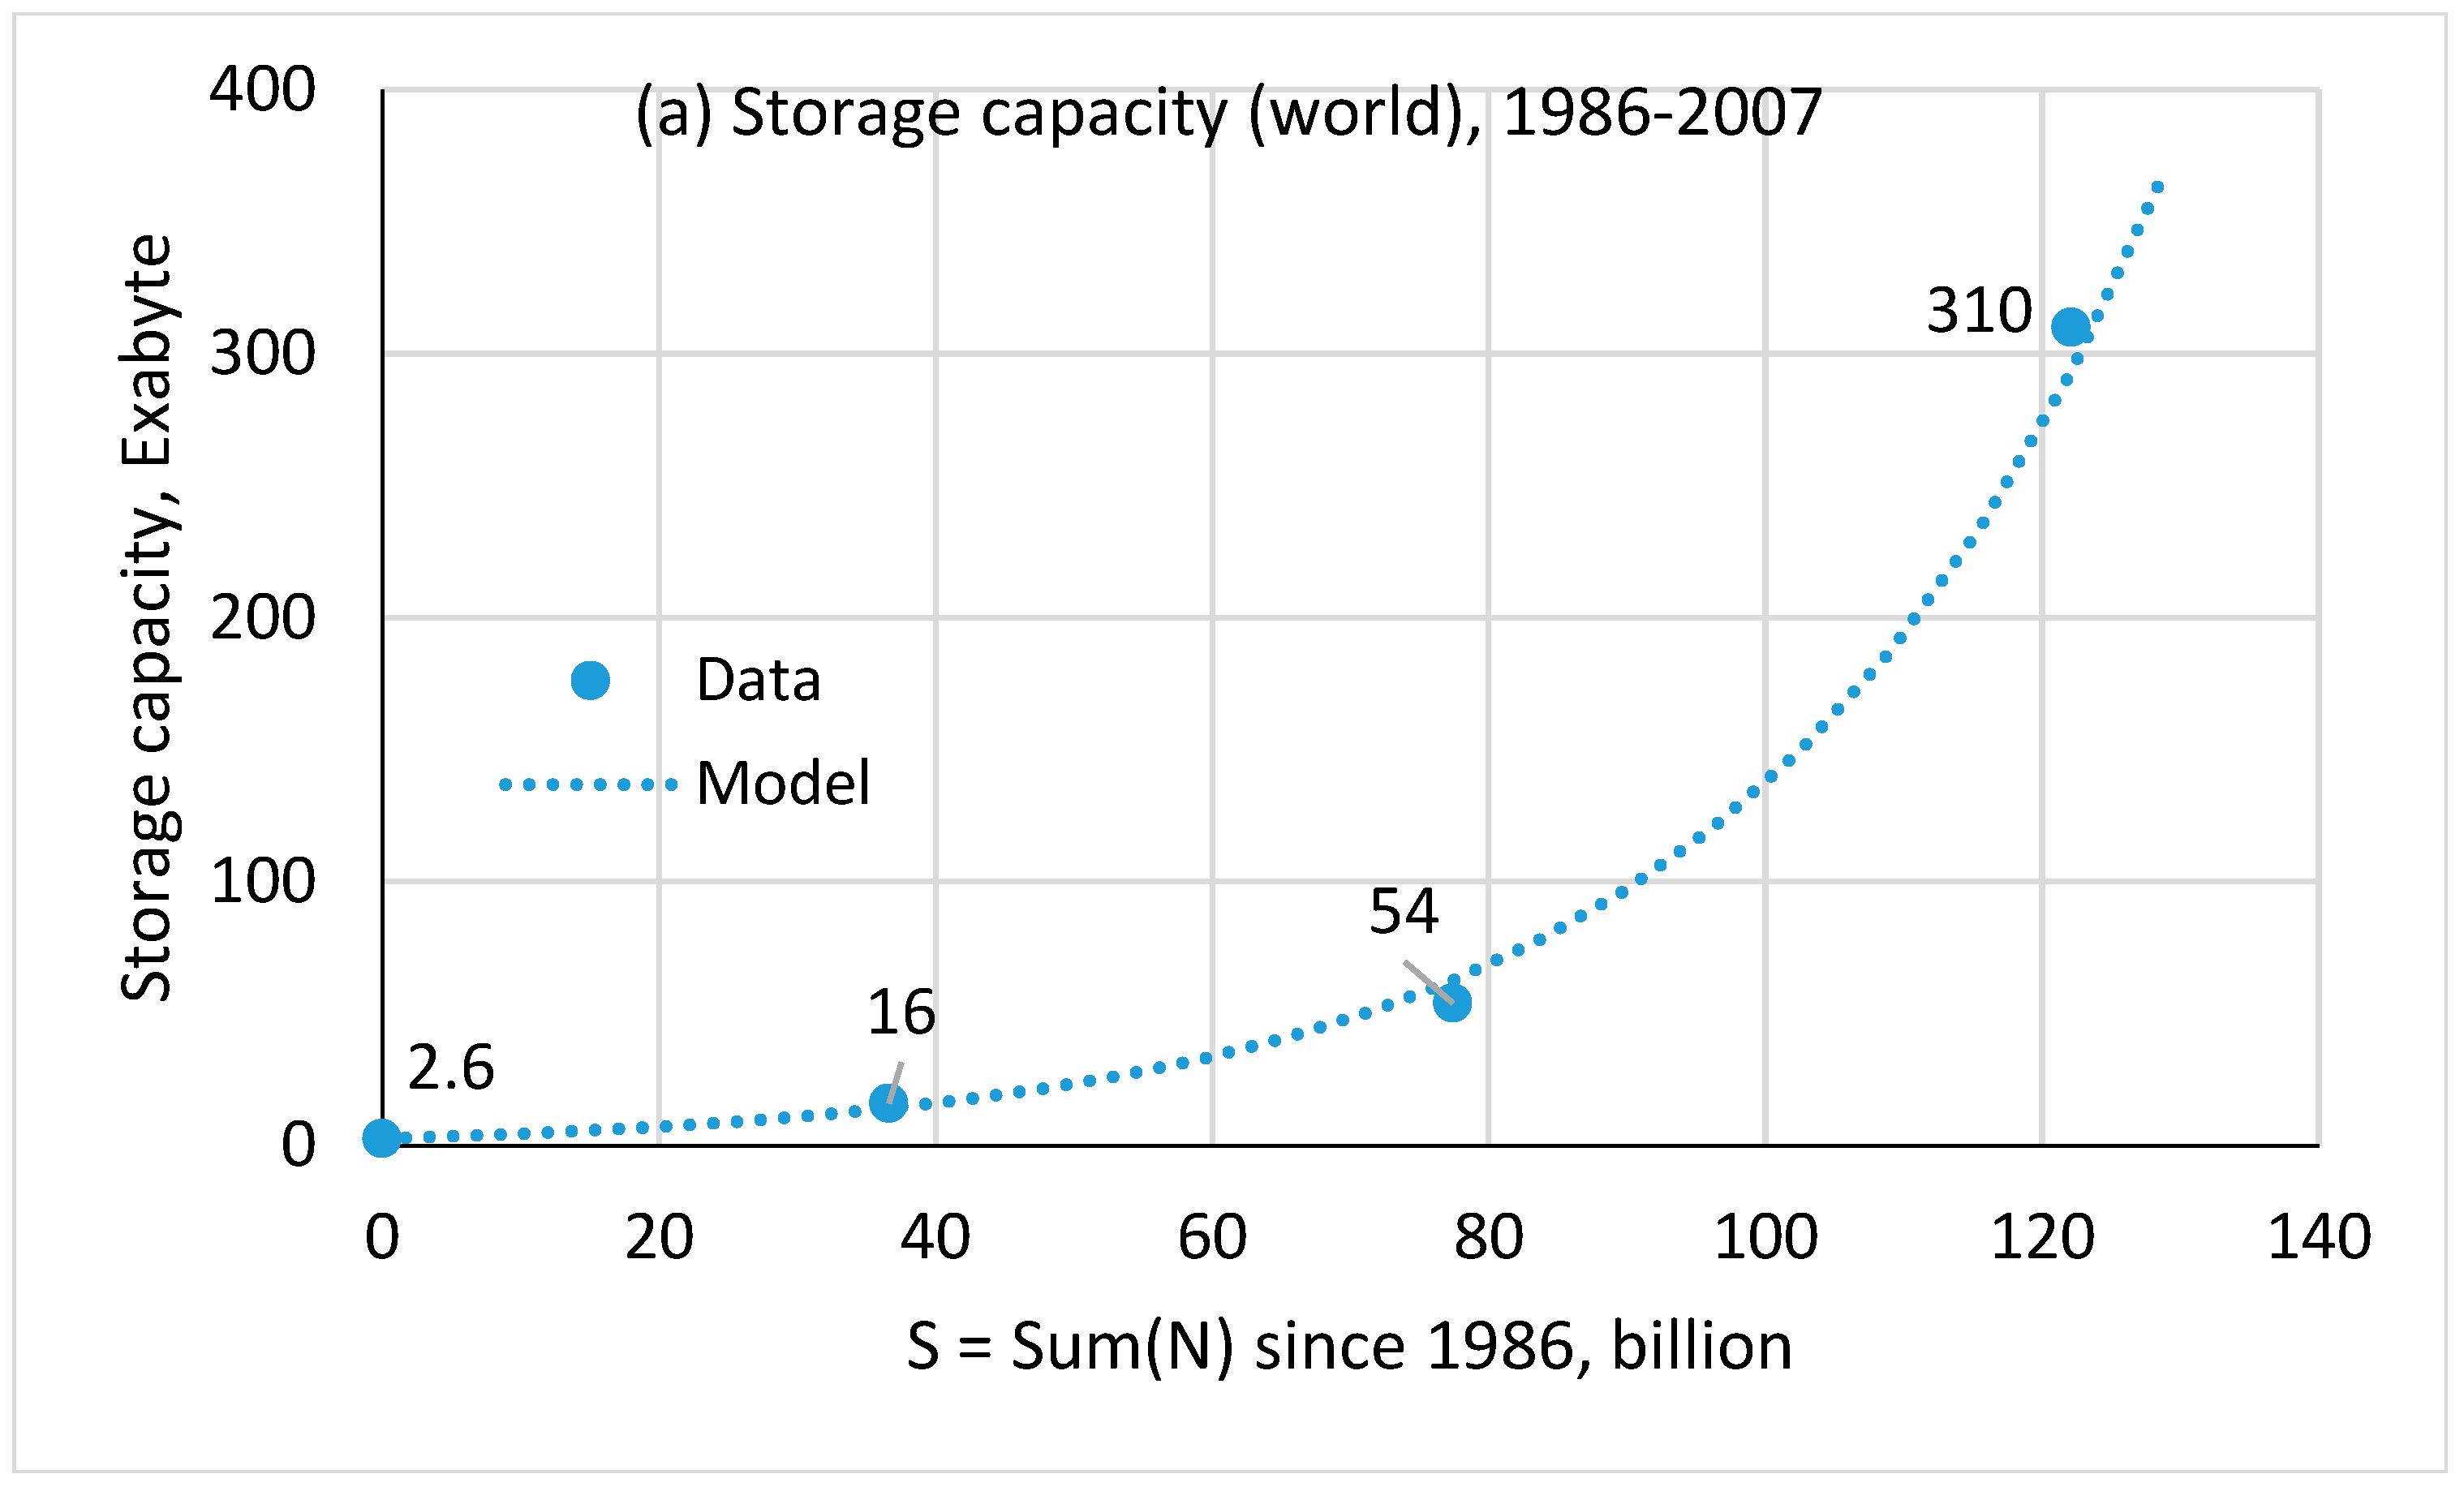
4.1. Storage Capacity
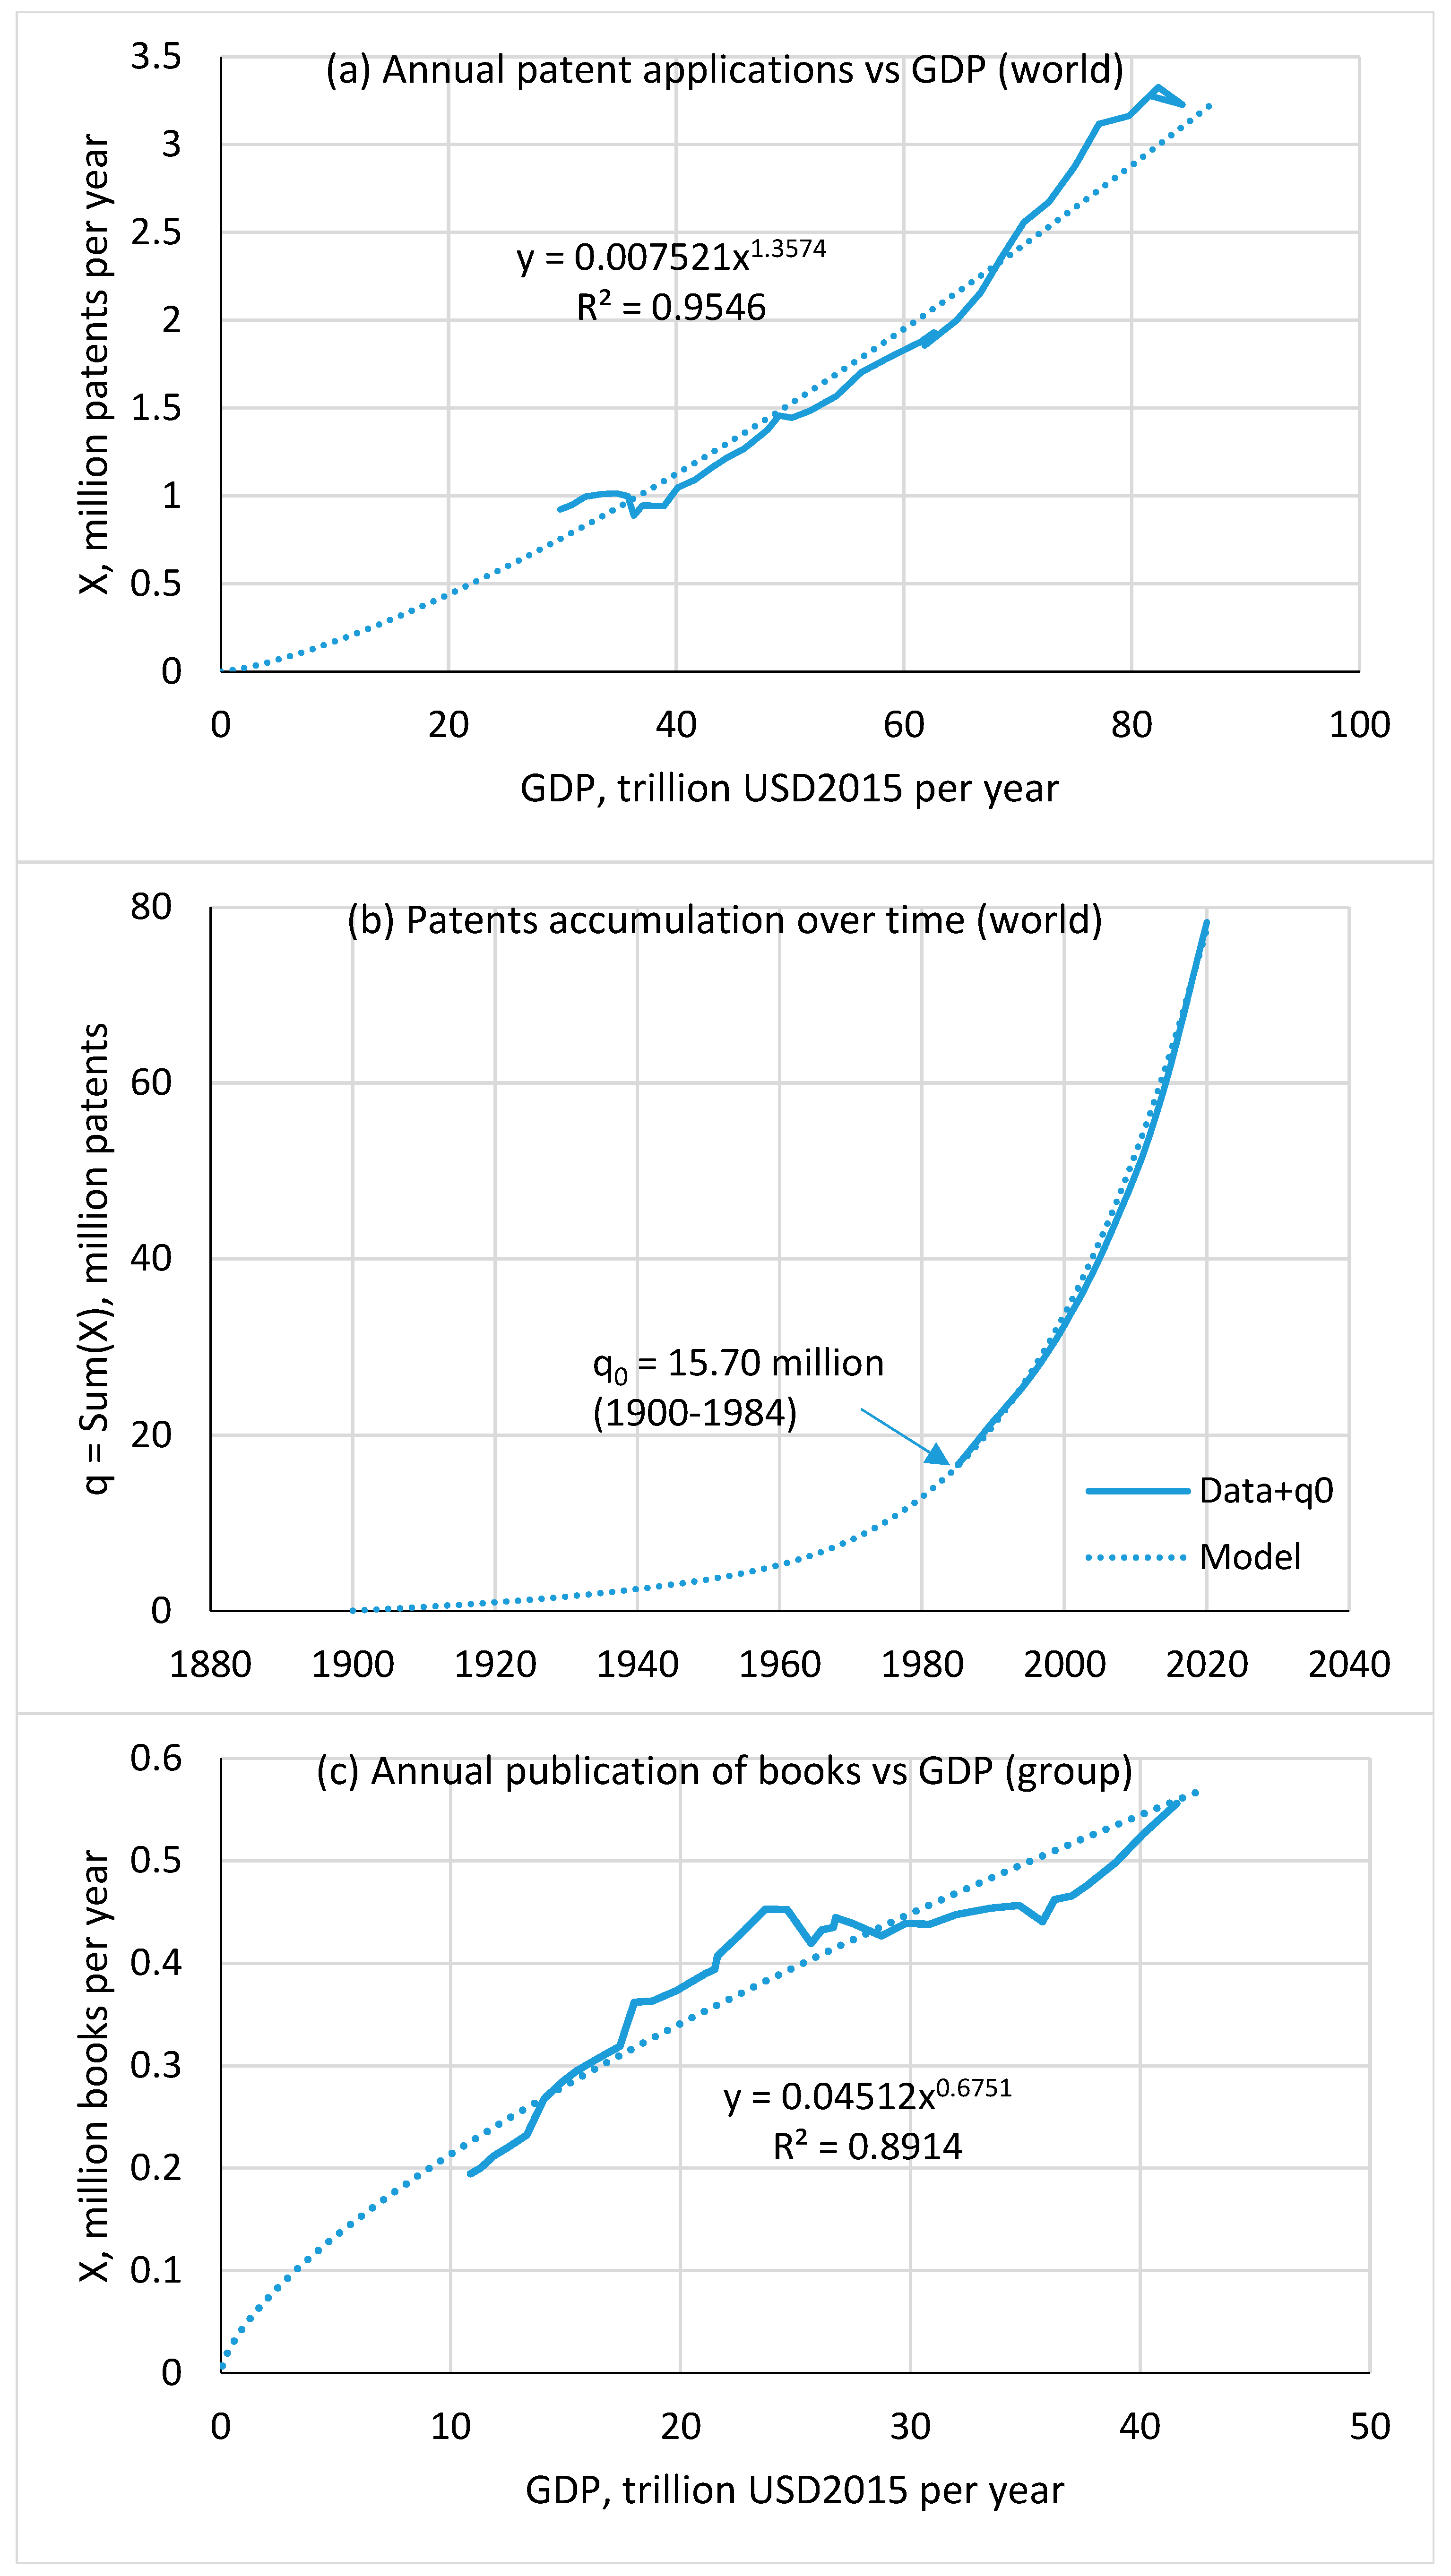
4.2. Patents
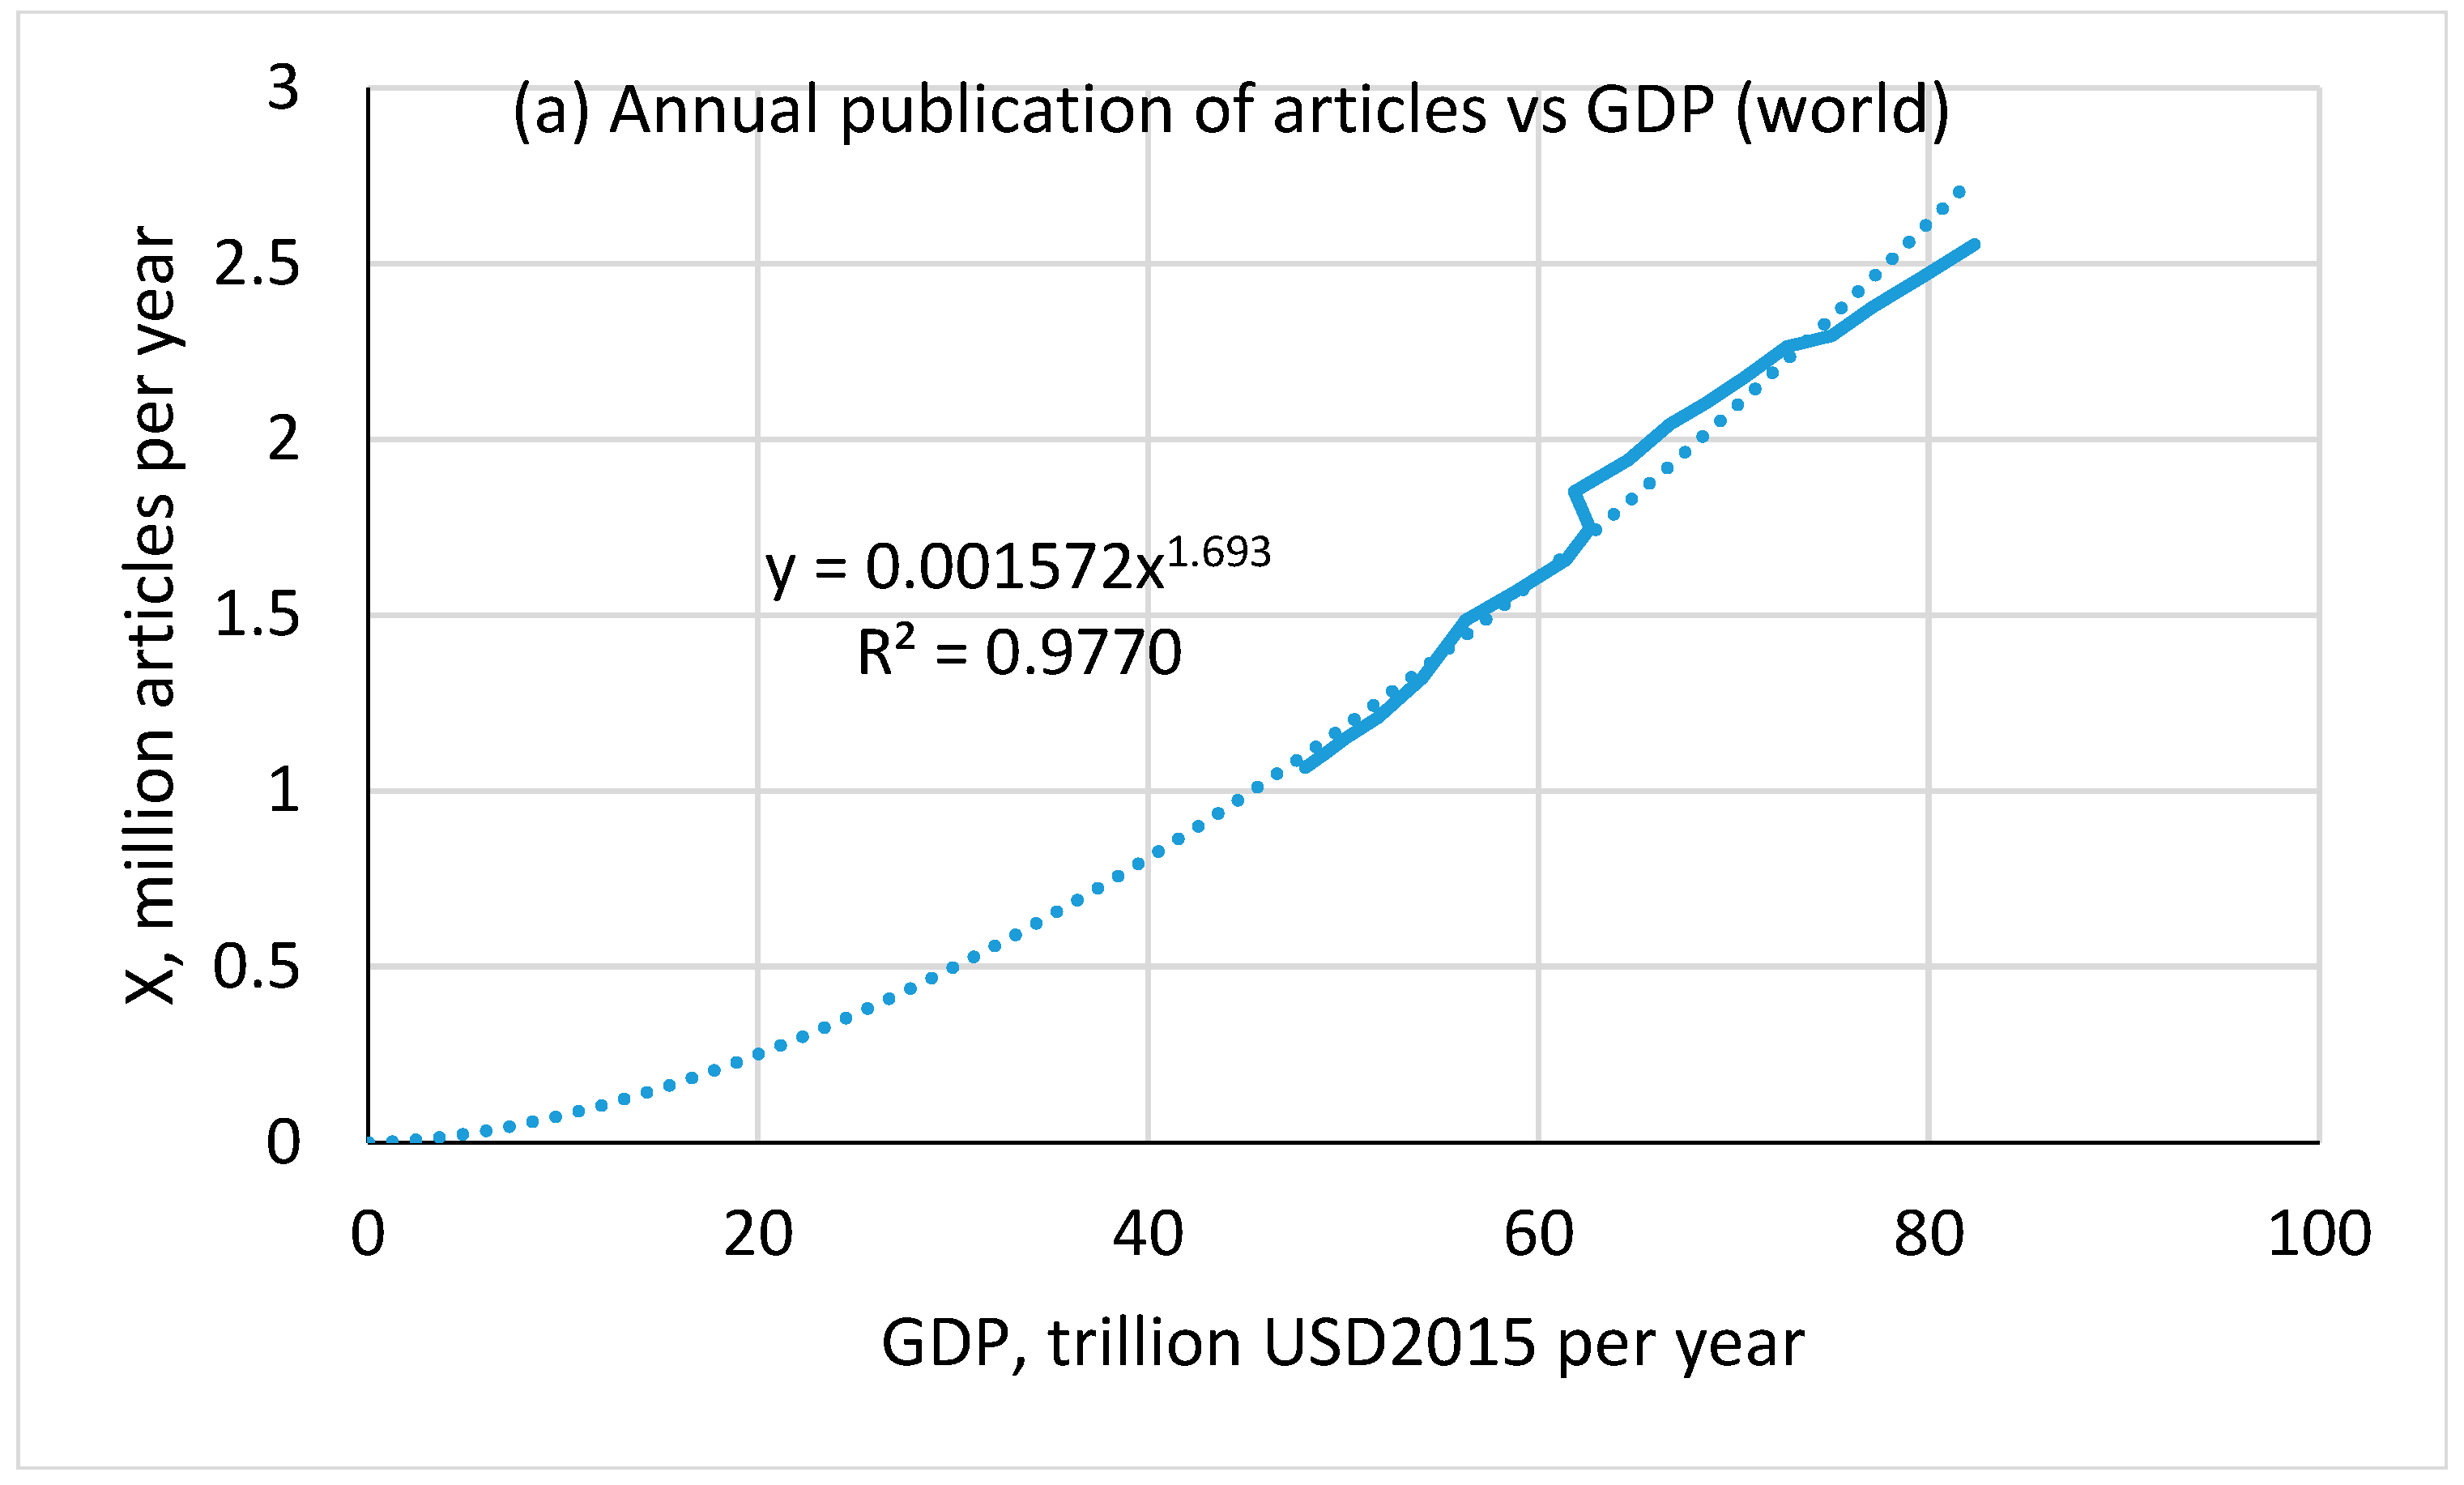
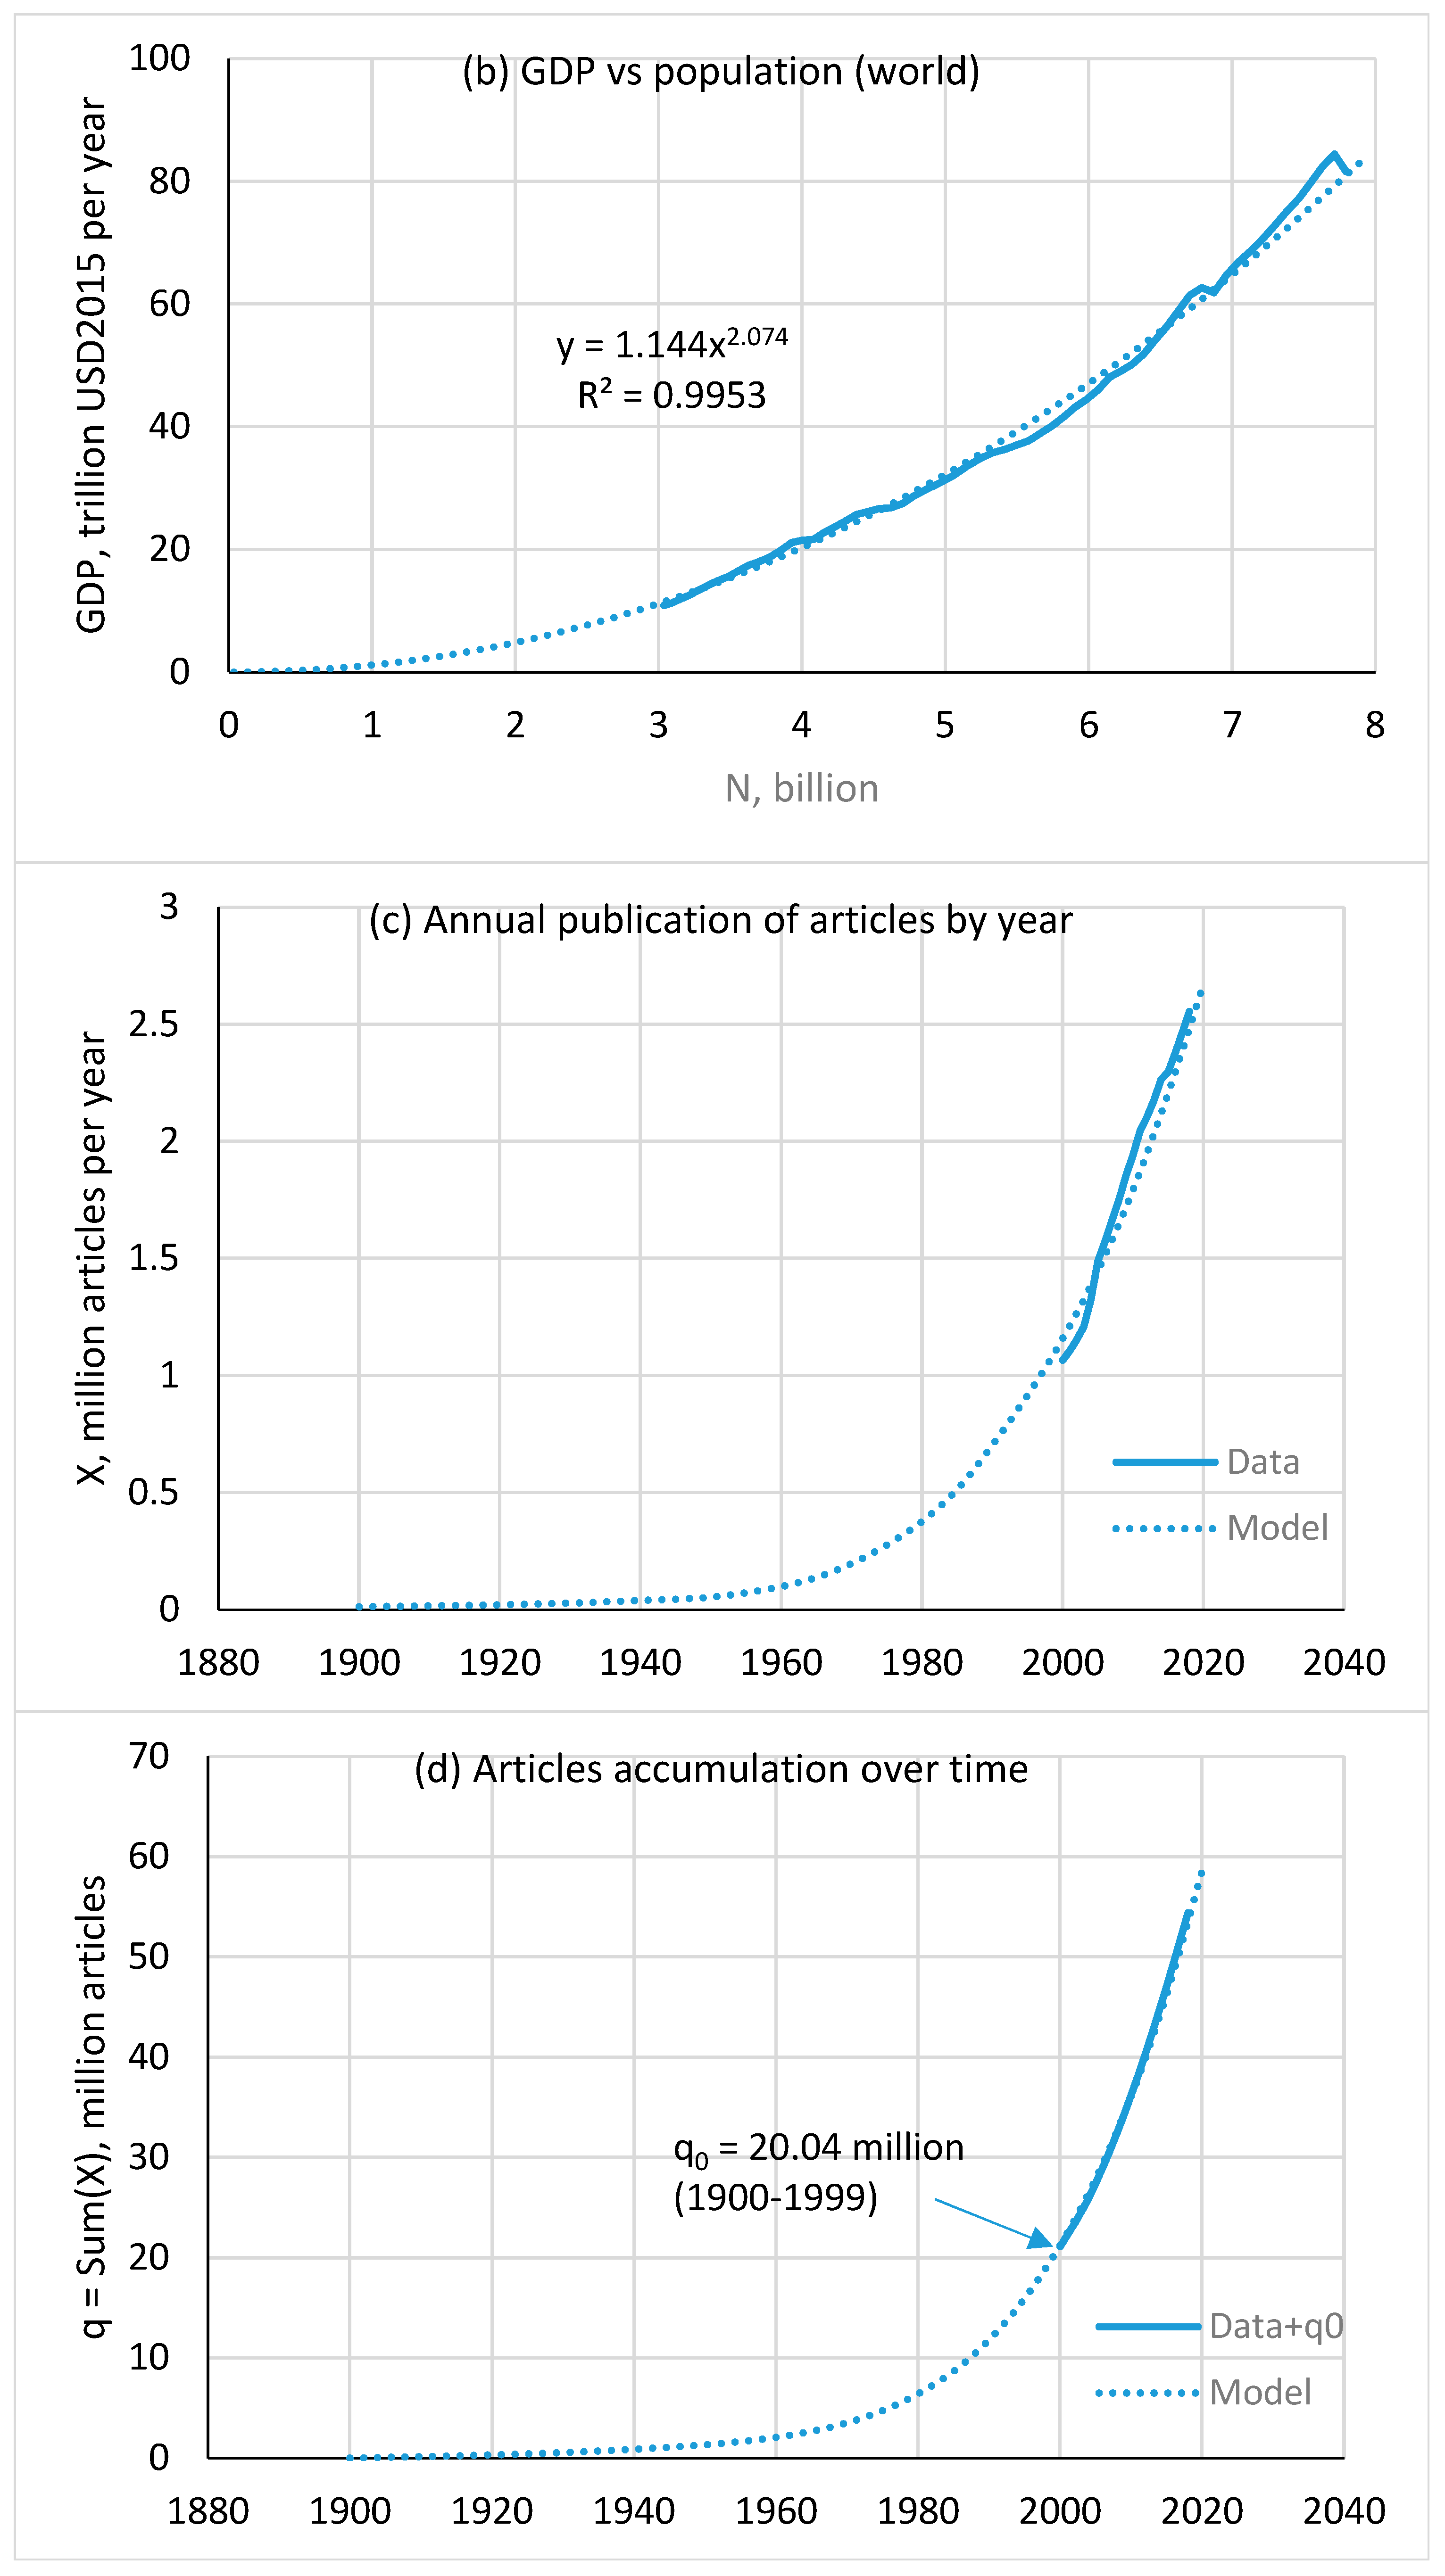
4.3. Articles
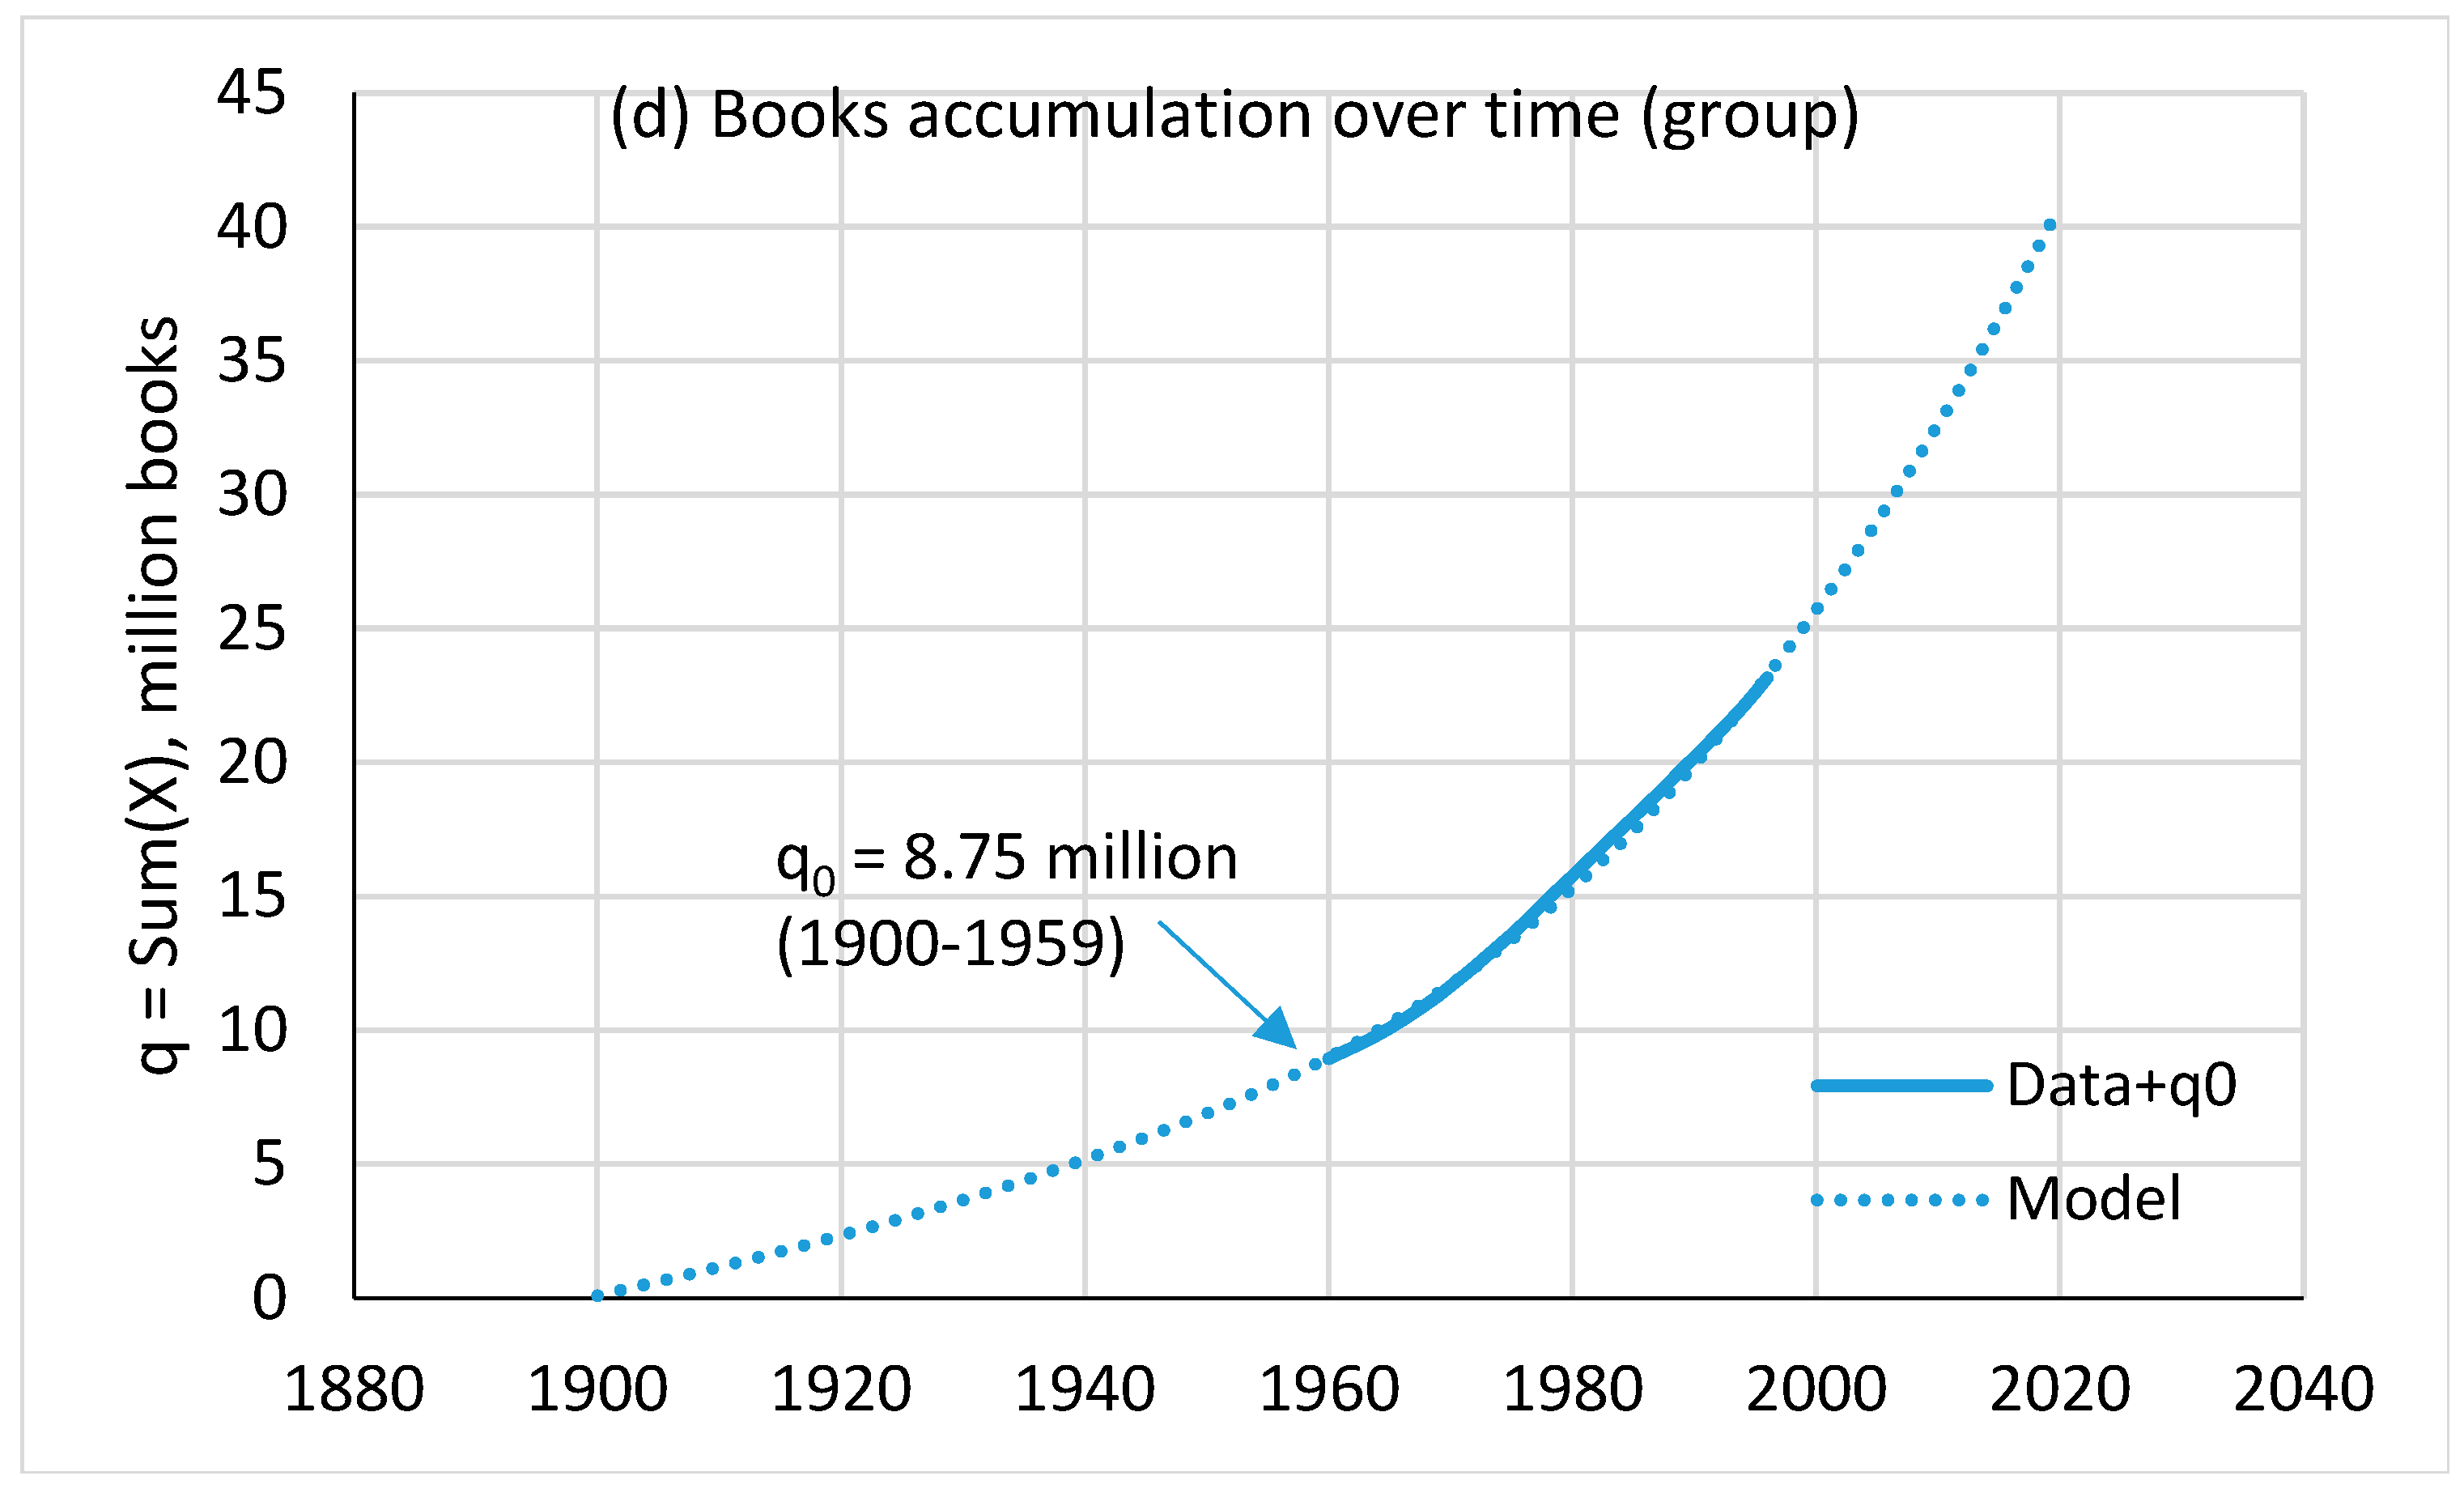
4.4. Books
4.5. Memory Capacity Assessment
4.6. Productivity Increase
4.7. Constant Productivity Approximation
4.8. Model Limitations and Capabilities
- The model is written for the world as a whole. This global system is closed in the sense that all knowledge is produced within the system, and there is no knowledge coming from outside.
- The model is not applicable to individual countries because there is an exchange of knowledge between countries. To be applicable to individual countries, the model must be modified by including knowledge flows in Equation (1) that reflect the exchange between countries.
- The available data series are not long enough, which reduces the model calibration accuracy. The series length in years is as follows: articles—19, information storage—22, patents—36, and books—47. In the case of books, systematic data are available only for a group of 30 countries. There are also quite large deviations from the trend (Figure 5c). These deviations can be smoothed out only by moving to an integral curve describing the accumulation of books (Figure 5d). Therefore, the calculation results for books should be considered rather approximate, especially when trying to extend them to the entire world.
- The model can be used as a tool for predicting the development of civilization through the accumulation of knowledge. There are limitations on the forecast horizon, in particular, because the model does not account for the rapid development of artificial intelligence, which contributes to a significant increase in human productivity and the acceleration of knowledge production.
- Knowledge production is present in the world system model [9], along with demographic, economic, and environmental factors. As shown there, this system is at the edge of losing stability. The model in [9] uses the constant productivity approximation, which is acceptable, as we have found out, for a pre-information society. However, in a developed information society, productivity is no longer constant, but grows as knowledge accumulates. Including the function in global dynamics will allow us to clarify the behavior of the world system and improve the accuracy of forecasts.
- In the future, it is necessary that we study the influence on the knowledge production function of two separate factors: population education and artificial intelligence.
5. Conclusions
Funding
Institutional Review Board Statement
Informed Consent Statement
Data Availability Statement
Conflicts of Interest
References
- Dolgonosov, B.M.; Naidenov, V.I. An informational framework for human population dynamics. Ecol. Mod. 2006, 198, 375–386. [Google Scholar]
- Romer, P.M. Increasing returns and long-run growth. J. Polit. Econ. 1986, 94, 1002–1037. [Google Scholar] [CrossRef]
- Romer, P.M. Endogenous technological change. J. Polit. Econ. 1990, 98, S71–S102. [Google Scholar] [CrossRef]
- Kremer, M. Population, population growth and technological change: One million B.C. to 1990. Quart. J. Econ. 1993, 108, 681–716. [Google Scholar] [CrossRef]
- Abdih, Y.; Joutz, F. Relating the knowledge production function to total factor productivity: An endogenous growth puzzle. IMF Staff Pap. 2006, 53, 242–271. [Google Scholar]
- Dong, J.; Li, W.; Cao, Y.; Fang, J. How does technology and population progress relate? An empirical study of the last 10,000 years. Technol. Forecast. Soc. Change 2016, 103, 57–70. [Google Scholar]
- Kato, H. Population Growth and Technological Progress—From a Historical View. In An Empirical Analysis of Population and Technological Progress; Springer Briefs in Population Studies; Springer: Tokyo, Japan, 2016. [Google Scholar] [CrossRef]
- Dolgonosov, B.M. Knowledge production and world population dynamics. Technol. Forecast. Soc. Change 2016, 103, 127–141. [Google Scholar]
- Dolgonosov, B.M. Knowledge-induced dynamics of the global human-environment system: Between sustainability and collapse. Adv. Environ. Res. 2024, 103, 93–132. [Google Scholar]
- Barro, R.J.; Sala-i-Martin, X. Economic Growth, 2nd ed.; MIT Press: Cambridge, UK, 2003. [Google Scholar]
- Collins, J.; Baer, B.; Weber, E.J. Population, Technological Progress and the Evolution of Innovative Potential; Economics Discussion Papers; University of Western Australia Business School: Crawley, Australia, 22 May 2013. [Google Scholar]
- Jones, C.I. R&D-based models of economic growth. J. Polit. Econ. 1995, 103, 759–784. [Google Scholar]
- Jones, C.I. Growth: With or without scale effects? Amer. Econ. Rev. 1999, 89, 139–144. [Google Scholar] [CrossRef]
- Okuducu, M.B.; Aral, M.M. Knowledge based dynamic human population models. Technol. Forecast. Soc. Change 2017, 122, 1–11. [Google Scholar] [CrossRef]
- Abramo, G.; D’Angelo, C.A.; Carloni, M. The balance of knowledge flows. J. Informetr. 2019, 13, 1–9. [Google Scholar] [CrossRef]
- Court, V.; McIsaac, F. A representation of the world population dynamics for integrated assessment models. Envir. Mod. Assess. 2020, 25, 611–632. [Google Scholar] [CrossRef]
- Sadovnichy, V.; Akaev, A.; Korotayev, A. A mathematical model for forecasting global demographic dynamics in the age of intelligent machines. arXiv 2022. [Google Scholar] [CrossRef]
- Akaev, A.A.; Sadovnichii, V.A. The human component as a determining factor of labor productivity in the digital economy. Stud. Russ. Econ. Dev. 2021, 32, 29–36. [Google Scholar] [CrossRef]
- Hilbert, M. How much of the global information and communication explosion is driven by more, and how much by better technology? J. Amer. Soc. Inform. Sci. Technol. 2014, 65, 856–861. [Google Scholar]
- Umarov, S.; Tsallis, C.; Steinberg, S. On a q-central limit theorem consistent with nonextensive statistical mechanics. Milan J. Math. 2008, 76, 307–328. [Google Scholar] [CrossRef]
- OECD. Triadic Patent Families. 2022. Available online: https://data.oecd.org/rd/triadic-patent-families.htm#indicator-chart (accessed on 17 September 2022).
- World Bank. Scientific and Technical Journal Articles. 2022. Available online: https://data.worldbank.org/indicator/IP.JRN.ARTC.SC?yearlowdesc=true (accessed on 23 September 2022).
- Fink-Jensen, J. Book Titles per Capita. 2015. Available online: https://hdl.handle.net/10622/AOQMAZ (accessed on 3 June 2022).
- UN. World Population Prospects. 2022. Available online: https://population.un.org/wpp/ (accessed on 5 July 2022).
- Gapminder. Population. 2022. Available online: https://www.gapminder.org/data/documentation/gd003/ (accessed on 10 October 2022).
- Kong, J.; Zhang, J.; Deng, S.; Kang, L. Knowledge convergence of science and technology in patent inventions. J. Informetr. 2023, 17, 101435. [Google Scholar]
- von Foerster, H.; Mora, P.M.; Amiot, L.W. Doomsday: Friday, 13 November, A.D. 2026. Science 1960, 132, 1291–1295. [Google Scholar]
- Korotayev, A.; Goldstone, J.A.; Zinkina, J. Phases of global demographic transition correlate with phases of the great divergence and great convergence. Technol. Forecast. Soc. Change 2015, 95, 163–169. [Google Scholar] [CrossRef]
- Grinin, L.; Grinin, A.; Korotayev, A. Dynamics of technological growth rate and the forthcoming singularity. In The 21st Century Singularity and Global Futures; Korotayev, A., LePoire, D., Eds.; World-Systems Evolution and Gloibal Futures; Springer: Cham, Switzerland, 2020. [Google Scholar] [CrossRef]
- Grinin, L.; Grinin, A.; Korotayev, A. A quantitative analysis of worldwide long-term technology growth: From 40,000 BCE to the early 22nd century. Technol. Forecast. Soc. Change 2020, 155, 119955. [Google Scholar]
- Hilbert, M.; López, P. The world’s technological capacity to store, communicate, and compute information. Science 2011, 332, 60–65. [Google Scholar] [CrossRef] [PubMed]


| Model Parameters | Storage 1986–2007 | Patents 1985–2020 | Articles 2000–2018 | Books 1950–1996 |
|---|---|---|---|---|
| 2.6 | 15.70 | 20.04 | 8.75 | |
| 1 | 1 | 0.7580 | 0.5814 | |
| 0.487 | 0.0490 | — | — | |
| 0.06978 | 0.08841 | — | — | |
| — | — | 0.01804 | 0.05304 | |
| 0.9963 | 0.9991 | 0.9997 | 0.9977 |
| Type | Number of Texts (in 2007), Million | Specific Capacity, Megabyte per Text | Total Capacity, Petabyte * |
|---|---|---|---|
| Storage (world) | — | — | 310,000 |
| Patents (world) | 44.0 | 1.5 | 0.07 |
| Articles (world) | 30.6 | 1.5 | 0.05 |
| Books (group) | 30.4 | 14 | 0.30 |
| Type | Year | |||
|---|---|---|---|---|
| Storage * | 1986 | 2.6 | 0.1581 | 63.4 |
| 2007 | 292.8 | 10.02 | ||
| Patents ** | 1985 | 15.92 | 0.1574 | 2.69 |
| 2020 | 78.51 | 0.4234 | ||
| Articles ** | 2000 | 20.04 | 0.1750 | 2.15 |
| 2018 | 54.42 | 0.3757 | ||
| Books ** | 1950 | 8.749 | 0.1872 | 2.03 |
| 1996 | 28.94 | 0.3805 |
Disclaimer/Publisher’s Note: The statements, opinions and data contained in all publications are solely those of the individual author(s) and contributor(s) and not of MDPI and/or the editor(s). MDPI and/or the editor(s) disclaim responsibility for any injury to people or property resulting from any ideas, methods, instructions or products referred to in the content. |
© 2025 by the author. Licensee MDPI, Basel, Switzerland. This article is an open access article distributed under the terms and conditions of the Creative Commons Attribution (CC BY) license (https://creativecommons.org/licenses/by/4.0/).
Share and Cite
Dolgonosov, B.M. Modeling the Knowledge Production Function Based on Bibliometric Information. Knowledge 2025, 5, 7. https://doi.org/10.3390/knowledge5020007
Dolgonosov BM. Modeling the Knowledge Production Function Based on Bibliometric Information. Knowledge. 2025; 5(2):7. https://doi.org/10.3390/knowledge5020007
Chicago/Turabian StyleDolgonosov, Boris M. 2025. "Modeling the Knowledge Production Function Based on Bibliometric Information" Knowledge 5, no. 2: 7. https://doi.org/10.3390/knowledge5020007
APA StyleDolgonosov, B. M. (2025). Modeling the Knowledge Production Function Based on Bibliometric Information. Knowledge, 5(2), 7. https://doi.org/10.3390/knowledge5020007