Abstract
Piezoelectrics have been used in several recent works to extract energy from the environment. This study examines the average wind speed across Iran and evaluates the amount of extracted voltage from vortex-induced vibrations with the piezoelectric cantilever beam (Euler–Bernoulli beam). This study aims to compute the maximum extracted voltage from polyvinylidene fluoride piezoelectric cantilever beam at the resonance from vortex-induced vibration to supply wireless network sensors, self-powered systems, and actuators. This simulation is proposed for the first-ranked meteorological station at its mean velocity over six years (2015–2020), and the finite element method is used for this numerical computation. The wind data of 76 meteorological stations in Iran over the mentioned period at the elevation of 10 m are collected every three hours and analyzed. Based on the statistical data, it is indicated that Zabol, Siri Island, and Aligudarz stations had recorded the maximum mean wind speed over the period at 6.42, 4.73, and 4.42 m/s, respectively, and then energy harvesting at the mean wind speed of top-ranked station (Zabol) is simulated. The prevailing wind directions are also studied with WRPLOT view software, and the wind vector field of 15 top-ranked stations is plotted. For energy harvesting simulation, periodic vortex shedding behind the bluff body, known as vortex-induced vibration, is considered numerically (finite element method). The piezoelectric cantilever beam is at a millimeter-scale and has a natural frequency of 630 Hz in its mode shapes to experience resonance phenomenon, which leads to maximum extracted voltage. The maximum extracted voltages for three piezoelectric cantilever beams with the natural frequency of 630 Hz with the wind speed of 6 m/s are 1.17, 1.52, and 0.043 mV, which are suitable for remote sensing, supplying self-power electronic devices, wireless networks, actuators, charging batteries, and setting up smart homes or cities. To achieve this, several energy harvesters with various dimensions should be placed in different orientations to utilize most of the blown wind.
1. Introduction
The energy crisis, air pollution, increasing energy demand, and global warming have motivated various communities to shift to renewable energy sources such as wind, solar, wave, and geothermal energy. Global energy demand is predicted to increase 25% by 2040. Renewable energy sources, nuclear energy, and natural gas will meet most of this energy demand [1]. Energy production from wind resources is proper because of its characteristics such as sustainability, high potential, and predictability [2]. The extraction of energy by wind farms has almost doubled from 2014 to 2018 [3]. Wind energy resources can supply 35% of the world’s energy needs, about 10 million megawatts [4]. According to the Global Wind Energy Council’s (GWEC) report (2021), energy extraction capability from wind has increased from 24 gigawatts in 2001 to 743 gigawatts in 2020. In 2020, wind energy harvesting increased by 53% compared to 2019, and newly installed wind farms are 93 gigawatts, including 6.1 gigawatts offshore and 86.9 gigawatts onshore wind farms. The share of different countries in this increase in wind energy use is as follows: China 56%, Brazil 19%, the United States 18%, Germany and the Netherlands 2% each, and other countries 3% [5].
Conventional wind turbines are expensive and have hazards such as environmental damage, radar interruption, and visual impacts [6]. Nonetheless, several novel methods for harvesting energy from ambient have been explored, such as mechanical vibration and thermal, chemical, and solar energy using piezoelectric, thermoelectric, and photovoltaic panels. One of the sources of mechanical vibrations is vortex-induced vibration (VIV) due to the passage of fluid flow such as wind or water through the bluff body and vortex shedding. These vortices shed periodically and cause a fluctuation in pressure around the bluff body [7]. VIV phenomenon has been studied for decades due to the damage from vibrations caused by the periodic force exerted by vortices. The most vibration amplitude occurs at the resonance frequency, which can damage the structure [8]. Nevertheless, utilizing these vibrations could be called a source of renewable energy [9].
By placing a piezoelectric beam at the wake of the bluff body, the cyclic vortices cause polarization in the piezoelectric. Piezoelectric energy harvesters (PEHs) can be an excellent alternative to batteries in electronic tools supplied by electrochemical batteries because of the limited lifespan of those batteries. With the help of these energy harvesters, self-powered electronic devices can be generalized [10]. Since vibration causes fatigue, flexible piezoelectric such as polyvinylidene fluoride (PVDF) or macro fiber composite (MFC) are a good option in vibration-based piezoelectric energy harvesters [11]. Piezoelectric energy harvesters have wide applications in the field of wireless sensor networks [12], IoT [13], medical [14], and smart homes [15].
In recent years, much research has been carried out on Iran’s wind energy potential assessment. Hosseinalizadeh et al. [16] evaluated the economic viability of small-scale wind turbines in 88 regions of Iran. The researchers used HOMER software to evaluate the effects of economic and investment factors. This study assessed a cost-effective wind turbine’s lowest average speed and the lowest capacity. Fazelpour et al. [3] have studied the prevailing winds of the eastern part of Iran (Sistan and Balouchestan Province). For statistical analysis of 5-year data (2009–2013) at the height of 10 m, the Weibull distribution has been used. Finally, they have recommended two wind turbines, DW61-900 with a rated power of 900 kW and DW61-250 with a rated power of 250 kW. Tizpar et al. [17] analyzed wind data of the northern part of Sistan Balouchestan province in southeast Iran with Weibull distribution. They found that energy production in this region with wind turbines of 80 m in height is efficient.
These investigations used conventional wind turbines to extract energy on a large scale. There is much experimental and numerical simulation research on harvesting energy from VIV [18]. Kan et al. [19] proposed a hybrid rotational piezoelectric energy harvester excited non-harmonically by the magnet for achieving multiple resonance frequencies to harvest the peak voltage. They found that this device is proper for harvesting energy from low-speed wind at a wide range. Arionfard and Nishi [20], in an experimental energy conversion system investigation, proposed a novel double rotational cylinder mechanism to convert energy from flow-induced vibration (FIV). In this study, the amount of output energy is not concerned. With the change of location of cylinders, a wide range of vibration types were tested. The results showed that the most efficient conversion system is gap-switching-induced vibration. Energy extraction from the movement of the submerged cylinder due to the vortex-induced vibration with a conversion system was studied experimentally and numerically by Gu et al. [21]. The conversion system consists of the rod and a rotational generator. The output power vs. Reynolds number was calculated in this study. Yayla et al. [22] investigated the experimental and numerical energy harvesting from turbulent flow in a channel with piezoelectric matter. The vortex generator plate, made up of conical nozzles, was used to increase the amount of electricity generated. They discovered that the best Reynolds number for extracting energy is about 30,000. Cha et al. [23] explored the possibility of extracting energy from fishtail vibration with piezoelectric materials (MFC piezoelectric sealed with epoxy) to drive fish tags. In this research, fluid-solid interaction (FSI) was described. In a study, Lai et al. [23] investigated harvesting energy from a low-speed wind regime with a novel hybrid energy conversion system. A piezoelectric layer made the conversion system with a dielectric generator inside a cylinder. VIV caused vibration in the beam, and piezoelectric directly converted this vibration into electricity. The dielectric was mounted in the cylinder, which could move normally in the flow direction and produce electricity. Li et al. [24] proposed an energy harvester structure based on a galloping piezoelectric-electromagnetic. In this structure, a vibration of the piezoelectric beam caused a vibration in the magnets, and electromagnetic energy could be captured. They have found that at a wind speed of 9 m/s, the effective output power is 121% more than the classic galloping piezoelectric with no magnet. The results from the numerical simulation were finally verified experimentally, which had a good agreement with the results derived from the simulation. Song et al. [25] have investigated tandem piezoelectric energy harvesters from water flow. In this study, mathematic models were coupled with hydrodynamics forces obtained from the computational fluid dynamics. They have found that, in a high-speed flow regime, a piezoelectric beam placed downstream performs better due to vortex-induced vibration. The maximum extracted power from the downstream piezoelectric harvester was 371 µW, which was approximately 2.5 times the amount extracted from the upstream harvester. Zhao et al. [26] have studied energy harvesting based on transverse galloping for wireless sensing power supply. They have also compared the single degree of freedom model (SDOF) with single-mode and multi-mode Euler–Bernoulli distributed parameters and then validated with the experimental model, which had a rough agreement with distributed parameters. A non-linear bi-directional piezoelectric energy harvester with vortex-induced vibration was developed and analyzed by Su and Wang [27]. In this model, the Euler–Bernoulli piezoelectric cantilever beam was fabricated and experimentally tested in a wind tunnel. They have found that the prototype has extreme non-linearity in a horizontal direction. With the added magnet, the structure greatly enhanced the lock-in region.
Wind energy conversion systems (WECS) impact factors are mean wind speed and prevailing wind direction [28]; the wind data of 76 meteorological stations in Iran is collected every three hours and analyzed in this study. Therefore, this study examines the average wind speed over Iran and evaluates the amount of extracted voltage from vortex-induced vibrations, with the piezoelectric cantilever beam (Euler–Bernoulli beam). This study aims to compute the maximum extracted voltage from PVDF piezoelectric cantilever beam at the resonance from VIV, to supply wireless network sensors, self-powered systems, and actuators. This simulation is proposed for the first-ranked meteorological station (Zabol station) at its mean velocity over the mentioned period, and the finite element method is used for this numerical computation.
2. Materials and Methods
2.1. Data Collection and Stations Description
Iran has a 1.6 million m2 area with different climates and is located in Central Asia and the Northern Hemisphere. The Alborz and Zagros Mountains ranges in Iran’s north, west, and southwest is mountainous. Iran’s central and eastern regions are deserts. The Persian Gulf and the Gulf of Oman are the southern edges of Iran. In addition to the mountain range, there is the coastal area of the Caspian Sea in the north. It depicts weather and climate variations in every part of Iran, allowing summer and winter to be felt simultaneously in different areas of the country [29].
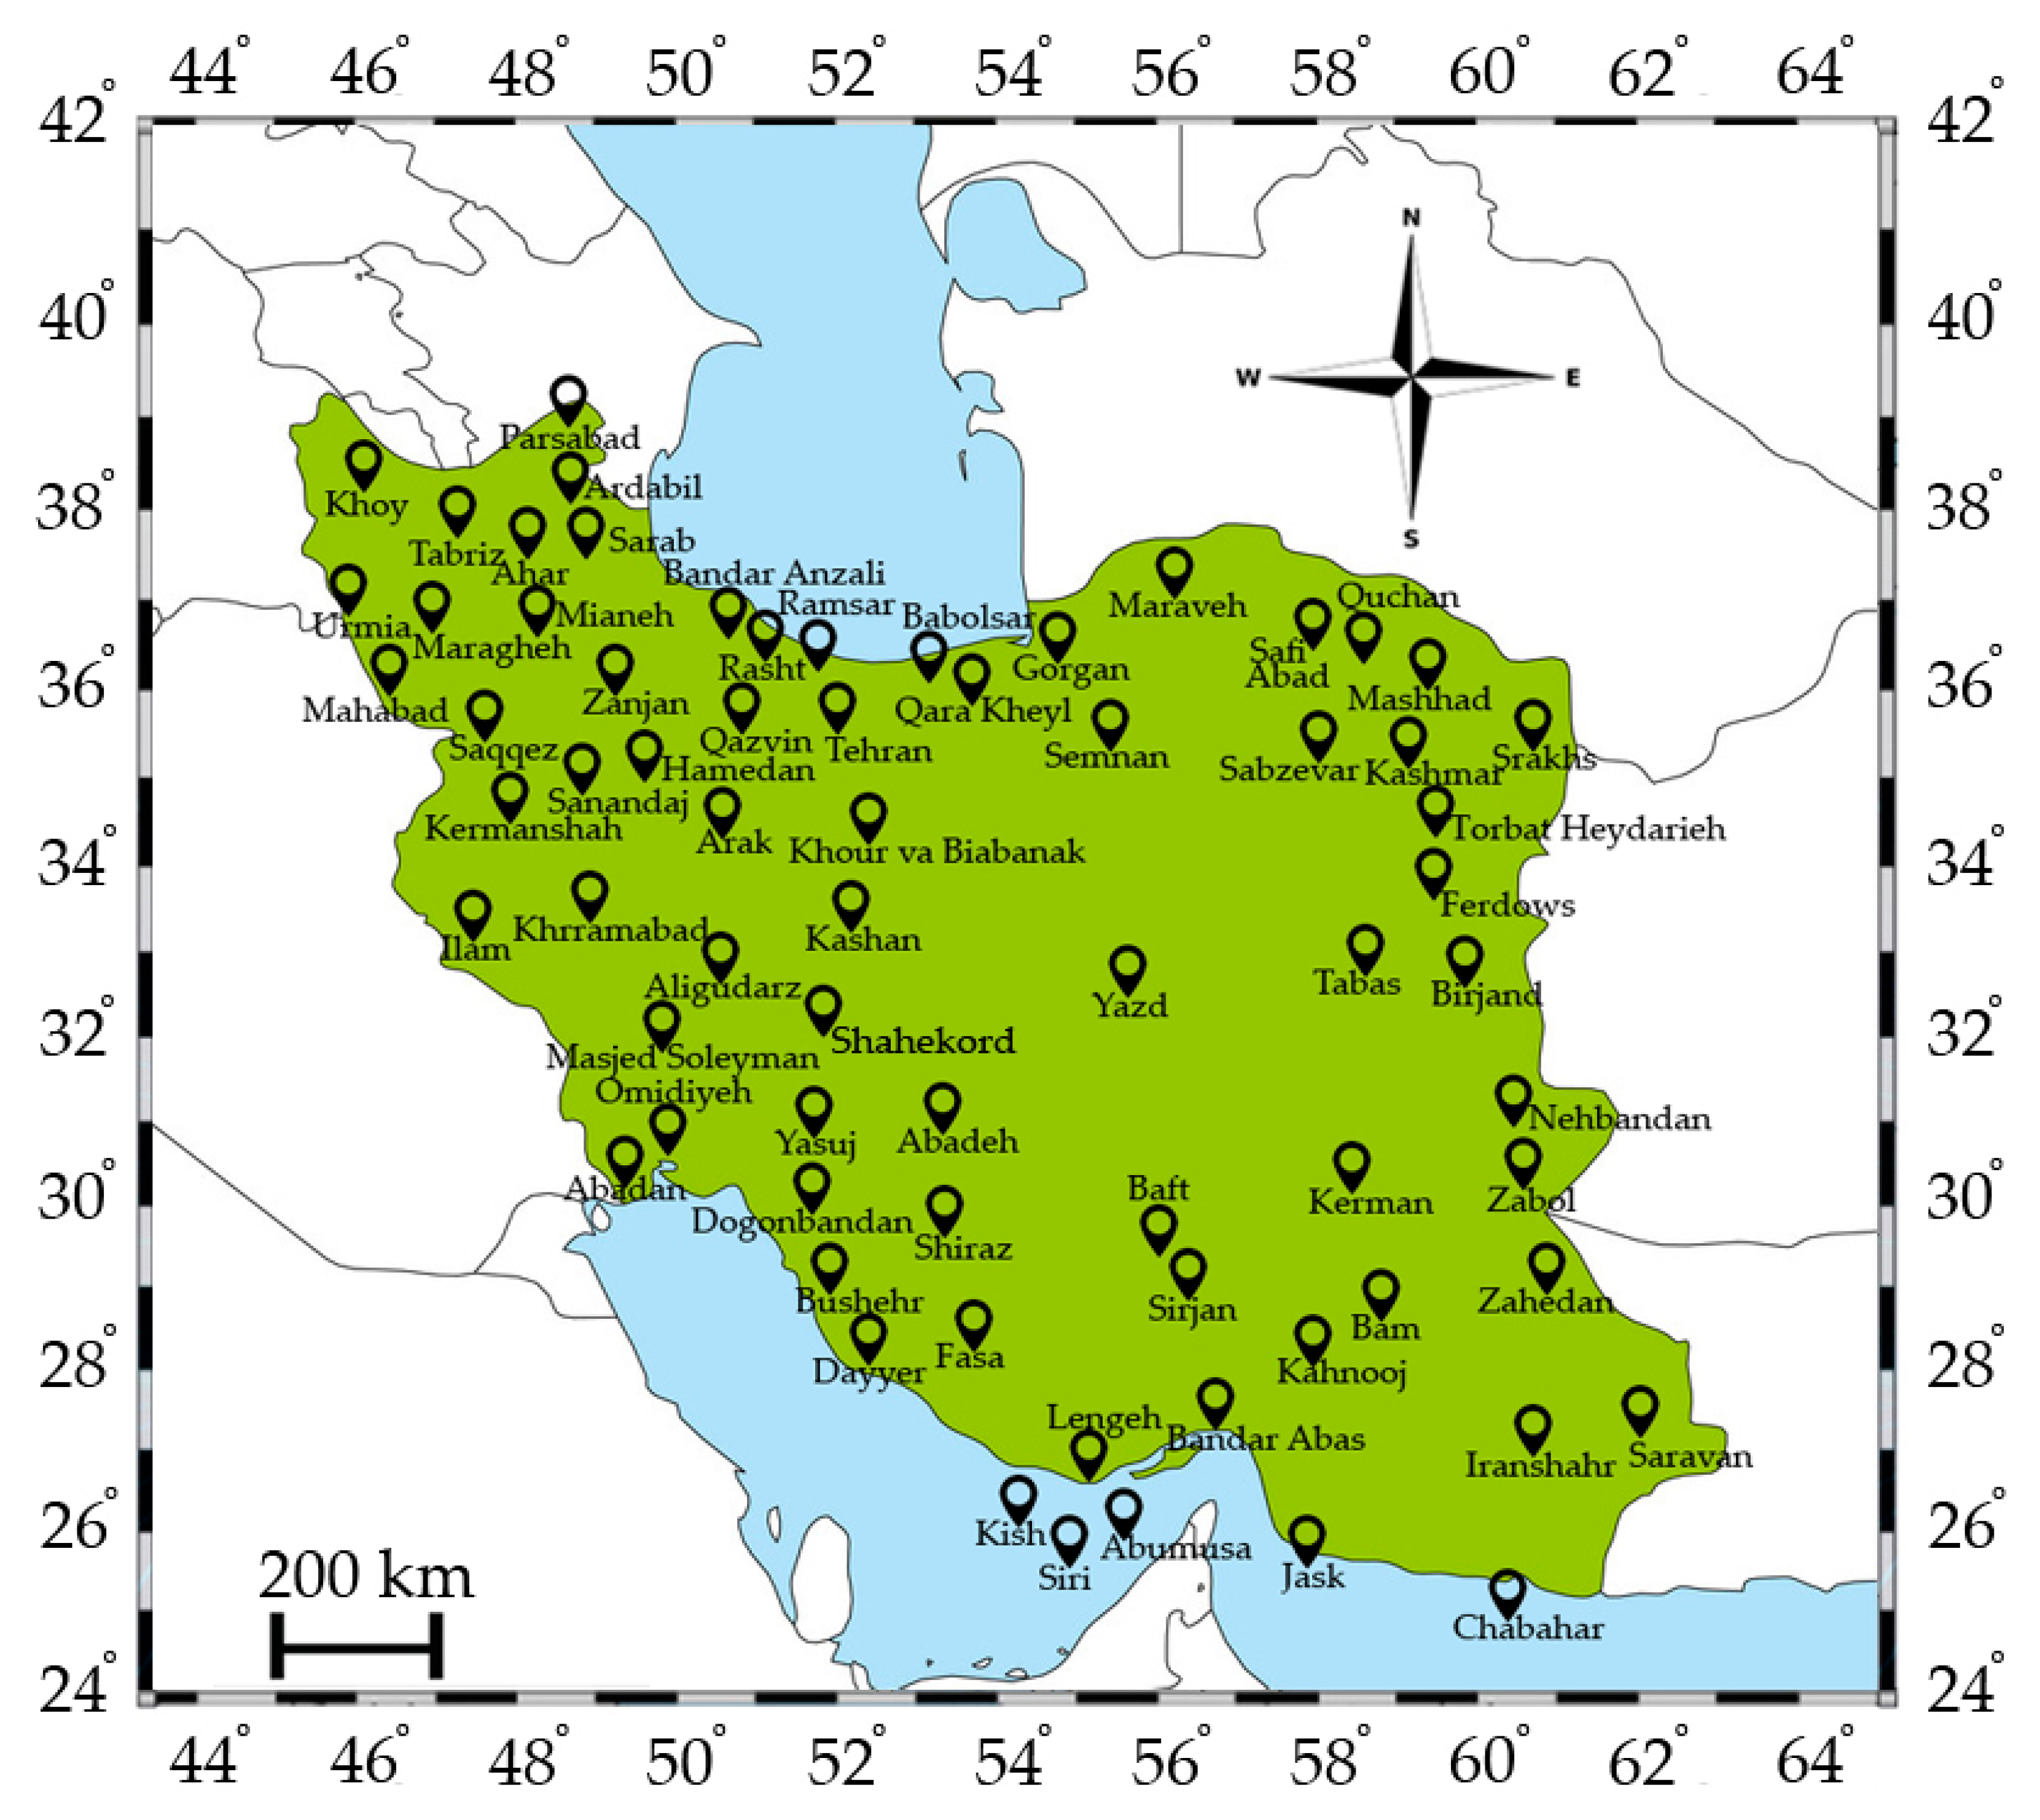
Meteorological data of 76 synoptic stations across Iran, including coastal, desert, and mountainous areas, were collected from Iran’s meteorological organization (IRIMO) over six years (1 August 2015 to 1 July 2020). Iran is an ideal case for studying wind energy potential and its variability. Iran has a complex and diverse topography (including mountains, plateaus, plains, hills, and basins), and climate conditions (e.g., arid, semiarid, Mediterranean, and humid climate zones) [30,31]. Figure 1 illustrates 76 synoptic stations across Iran.

Figure 1.
Location of 76 synoptic stations of Iran.
Wind speed and direction, humidity, and temperature are all determined by synoptic data. In this analysis, only wind data is taken into account. Wind data are analyzed with WRPLOT view software (Ver. 8.0.2). Table S1 lists each station’s geographical characteristics and wind indicators, such as the prevailing wind direction, mean wind speed, and maximum speed. Each station’s windrose plot was examined to determine the prevailing wind direction. The average wind speed in these stations ranges from 1.35 to 6.42 m/s in Dogonbadan (Kohgiluyeh and Boyer province) and Zabol (Sistan and Balouchestan province), respectively.
2.2. Simulation Procedure
By placing an object in the moving fluid, vortices appear behind it. These vortices shed at the wake periodically and exert an external periodic pressure difference to the body placed in a fluid. Vortex-induced vibration is a function of Reynolds (Re) and Strouhal (St) numbers calculated from Equations (1) and (2).
In these Equations, ρ is the air density (kg/m3), V is wind speed (m/s), D is diameter of the bluff body (m), is dynamic viscosity of the air (Pa·s), and is the vortex shedding frequency (Hz). The shedding from a circular cross-sectioned cylinder occurs when the Reynolds number is in the range of 102–107, and the Strouhal number approximately is 0.21 [32].
The extraction of energy from vibrations induced by wind flow vortices with piezoelectric material is simulated in this research. The wind flow passes through the circular bluff body, exerting lift force on the cantilever piezoelectric beam periodically (due to the pressure difference). This force causes polarization and vibration in the piezoelectric.
Vibration equation of beam can be expressed as Equation (3), in which y, , and are displacement, velocity, and acceleration, C is mechanical damping, and k is stiffness.
As mentioned, external force that is exerted at the beam is lift force and also expressed in Equation (4), where A0 is projected area and CL is coefficient of lift force.
Motion equation of VIV can be obtained from Equation (5), where ω0 is natural frequency and ζ is damping ratio.
Strain in piezoelectric beam can be obtained from Equation (6), in which ub is the amplitude of piezoelectric beam. By integration of potential Vector D, Piezoelectric charge Q can be obtained in which D and Q are expressed by Equations (6) and (7), where d31 is piezoelectric constant, Eb is Young’s modulus of the piezoelectric cantilever, w (m) is thickness, and L (m) is the length of piezoelectric.
At last, voltage polarization of piezoelectric can be obtained from Equation (9).
In Equation (9), Cb (V/C) is capacitance of piezoelectric.
Energy Harvesting Simulation
Drag force had no impact because of the PEH structure, thus it was neglected. The lift force acting on the piezoelectric cantilever beam due to wind flow passing through the bluff body was measured (per length). Wind speed ranged from 1 to 6 m/s. The highest average wind speed in this timeframe was about 6 m/s, according to 6-year synoptic data from 76 meteorological stations. Since the maximum lift force is exerted at maximum velocity, a simulation based on a wind speed of 6 m/s is proposed. A schematic of the PEH structure is shown in Figure 2. The flow field is considered as a rectangular channel with a length and width of 100 and 20 mm, respectively. The oscillator cantilever piezoelectric beam is 15 mm away from the circular bluff body, which is fixed and has a diameter of 2 mm.
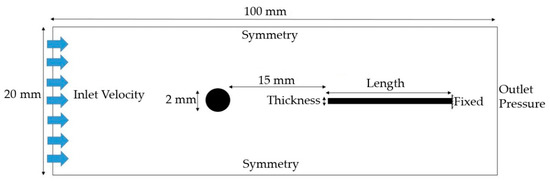
Figure 2.
Schematic of piezoelectric energy harvester (PEH) structure.
According to the specificity of the bluff body diameter, wind speed, and other required parameters, the Reynolds number is about 800. The Strouhal number can also be considered equal to 0.21, which ultimately has a vortex shedding frequency of 630 Hz.
The resonance phenomenon will occur if the vortex shedding frequency equals the piezoelectric beam’s normal frequency. The maximum deflection of the piezoelectric beam occurs when the resonance happens, and the highest voltage can be obtained from the piezoelectric beam. At resonance phenomenon, due to oscillations and high displacement of the piezoelectric beam, conventional piezoceramics cannot be used due to fragility, and flexible piezoelectrics such as PVDF or MFC should be used. This study uses PVDF piezoelectric; its characteristic parameter is listed in Table 1.

Table 1.
The polyvinylidene fluoride (PVDF) piezoelectric parameters.
As the vortex shedding frequency is known, three piezoelectric beams are selected by trial-and-error approach and eigenfrequency study simulation. These three PVDF beams with different dimensions have a natural frequency of about 630 Hz (at mode shapes), which at the wind velocity of 6 m/s leads to a resonance phenomenon. The following three specifications in Table 2 demonstrate piezoelectric beam dimensions.
Table 2.
Specifications of piezoelectric beam.
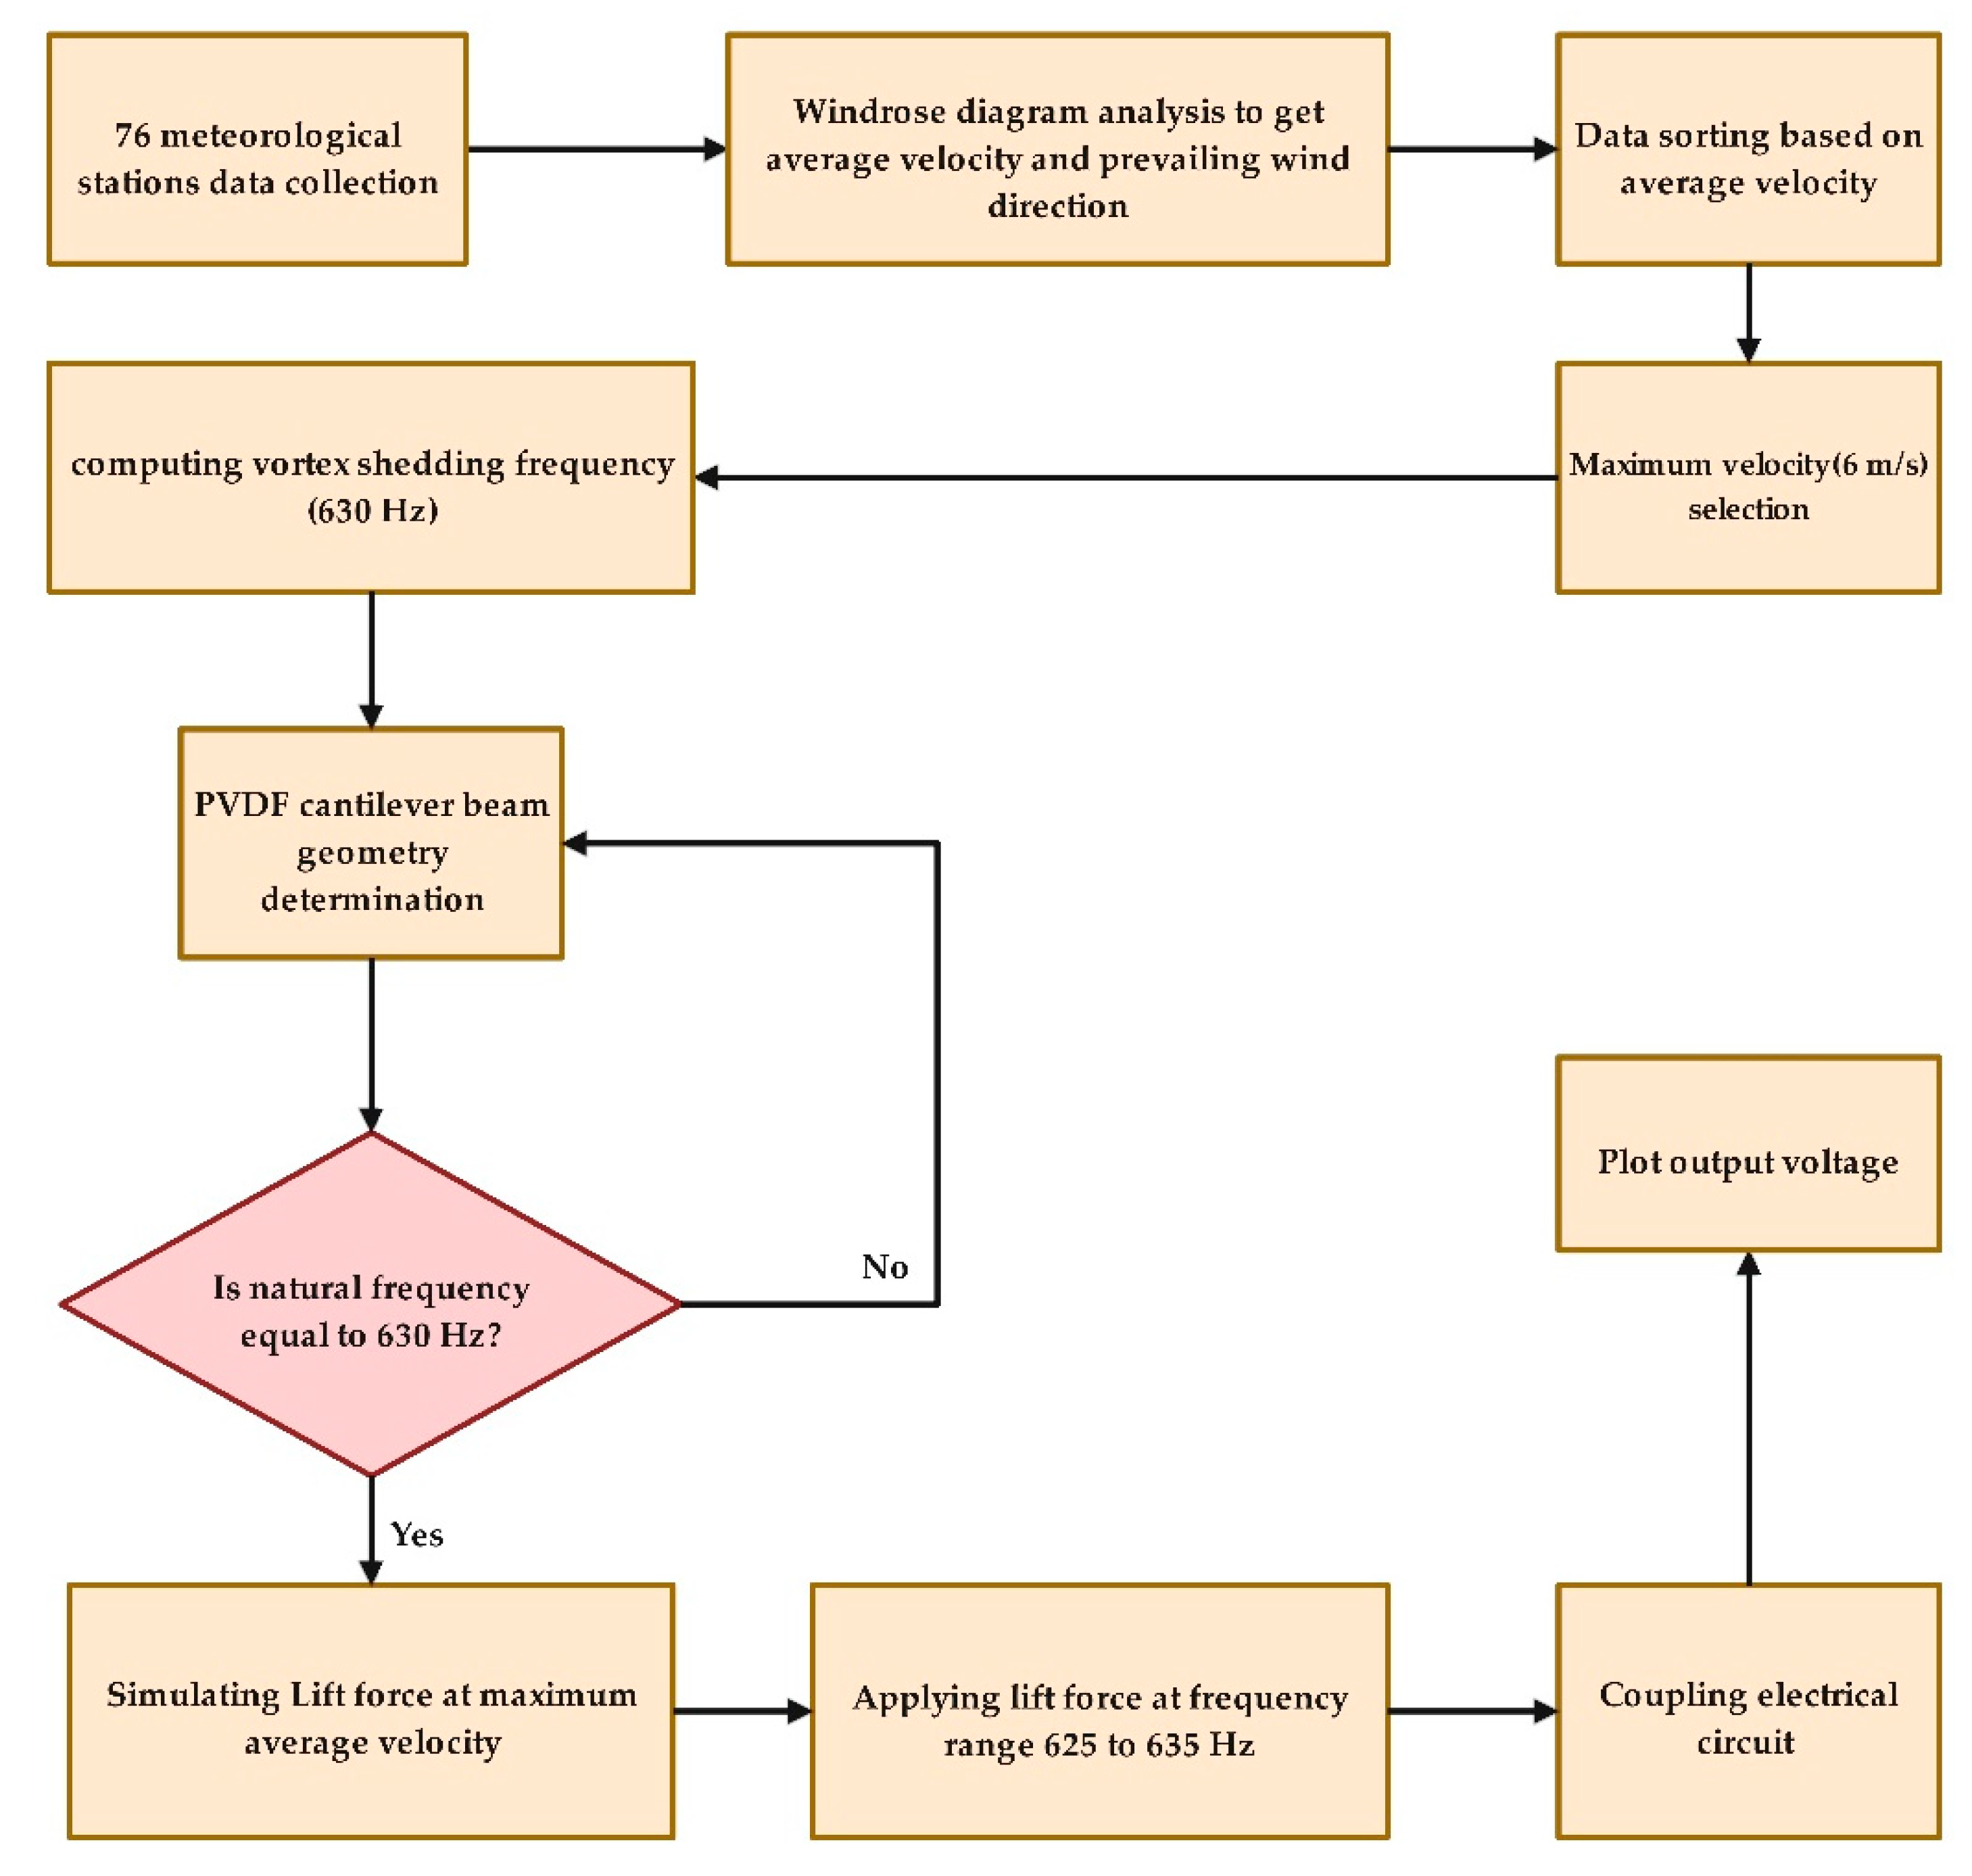
The lift force (per length) in the wind velocity range of 1 to 6 m/s is numerically simulated. The maximum lift force (6 m/s wind velocity) is applied with a frequency domain in the range of 625 to 635 Hz with the step of 0.01. Coupled electrostatic and electrical circuit modules with a resistor of 109 Ω are used to simulate the output voltage at the resonance for energy extraction. The energy harvesting simulation flowchart is presented in Figure 3.
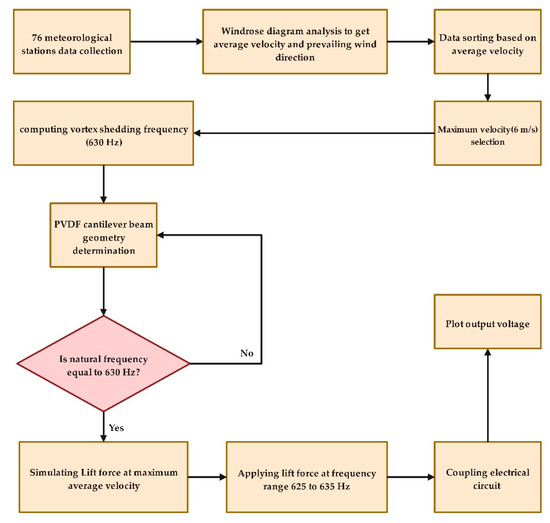
Figure 3.
Energy harvesting simulation flowchart.
3. Results and Discussion
Table S1 is ranked according to the average wind speed for energy harvesting. Zabol city, Siri Island, and Aligudarz city have the highest average speeds, and their topography is desert, marine, and mountainous, respectively. Each of these three cities is discussed in greater depth in the following sections. The wind vector field for the first 15 stations is shown in Figure 4. The predominant winds of the south of Iran, the Persian Gulf, and the Omen Sea are all oriented west (Figure 4). The most significant wind vector in Iran is guided northwest for Zabol station. The central part of Iran is not among the top 15 stations with the fastest mean wind speed, which may be due to the country’s civilization in this area. According to meteorological data of Birjand, Sabzevar, and Quchan cities, the prevailing wind direction is toward the east.
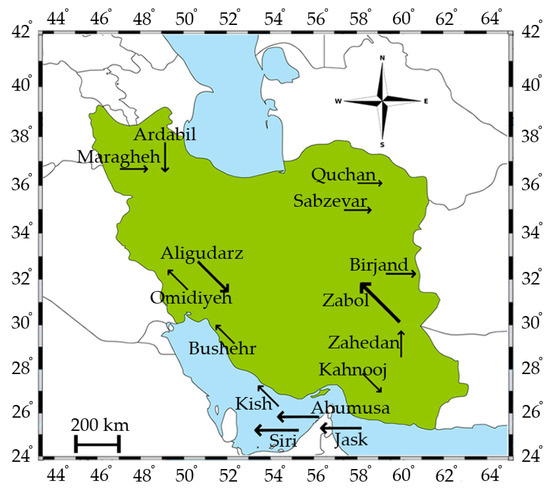
Figure 4.
Wind vector field of the first 15 ranked meteorological stations.
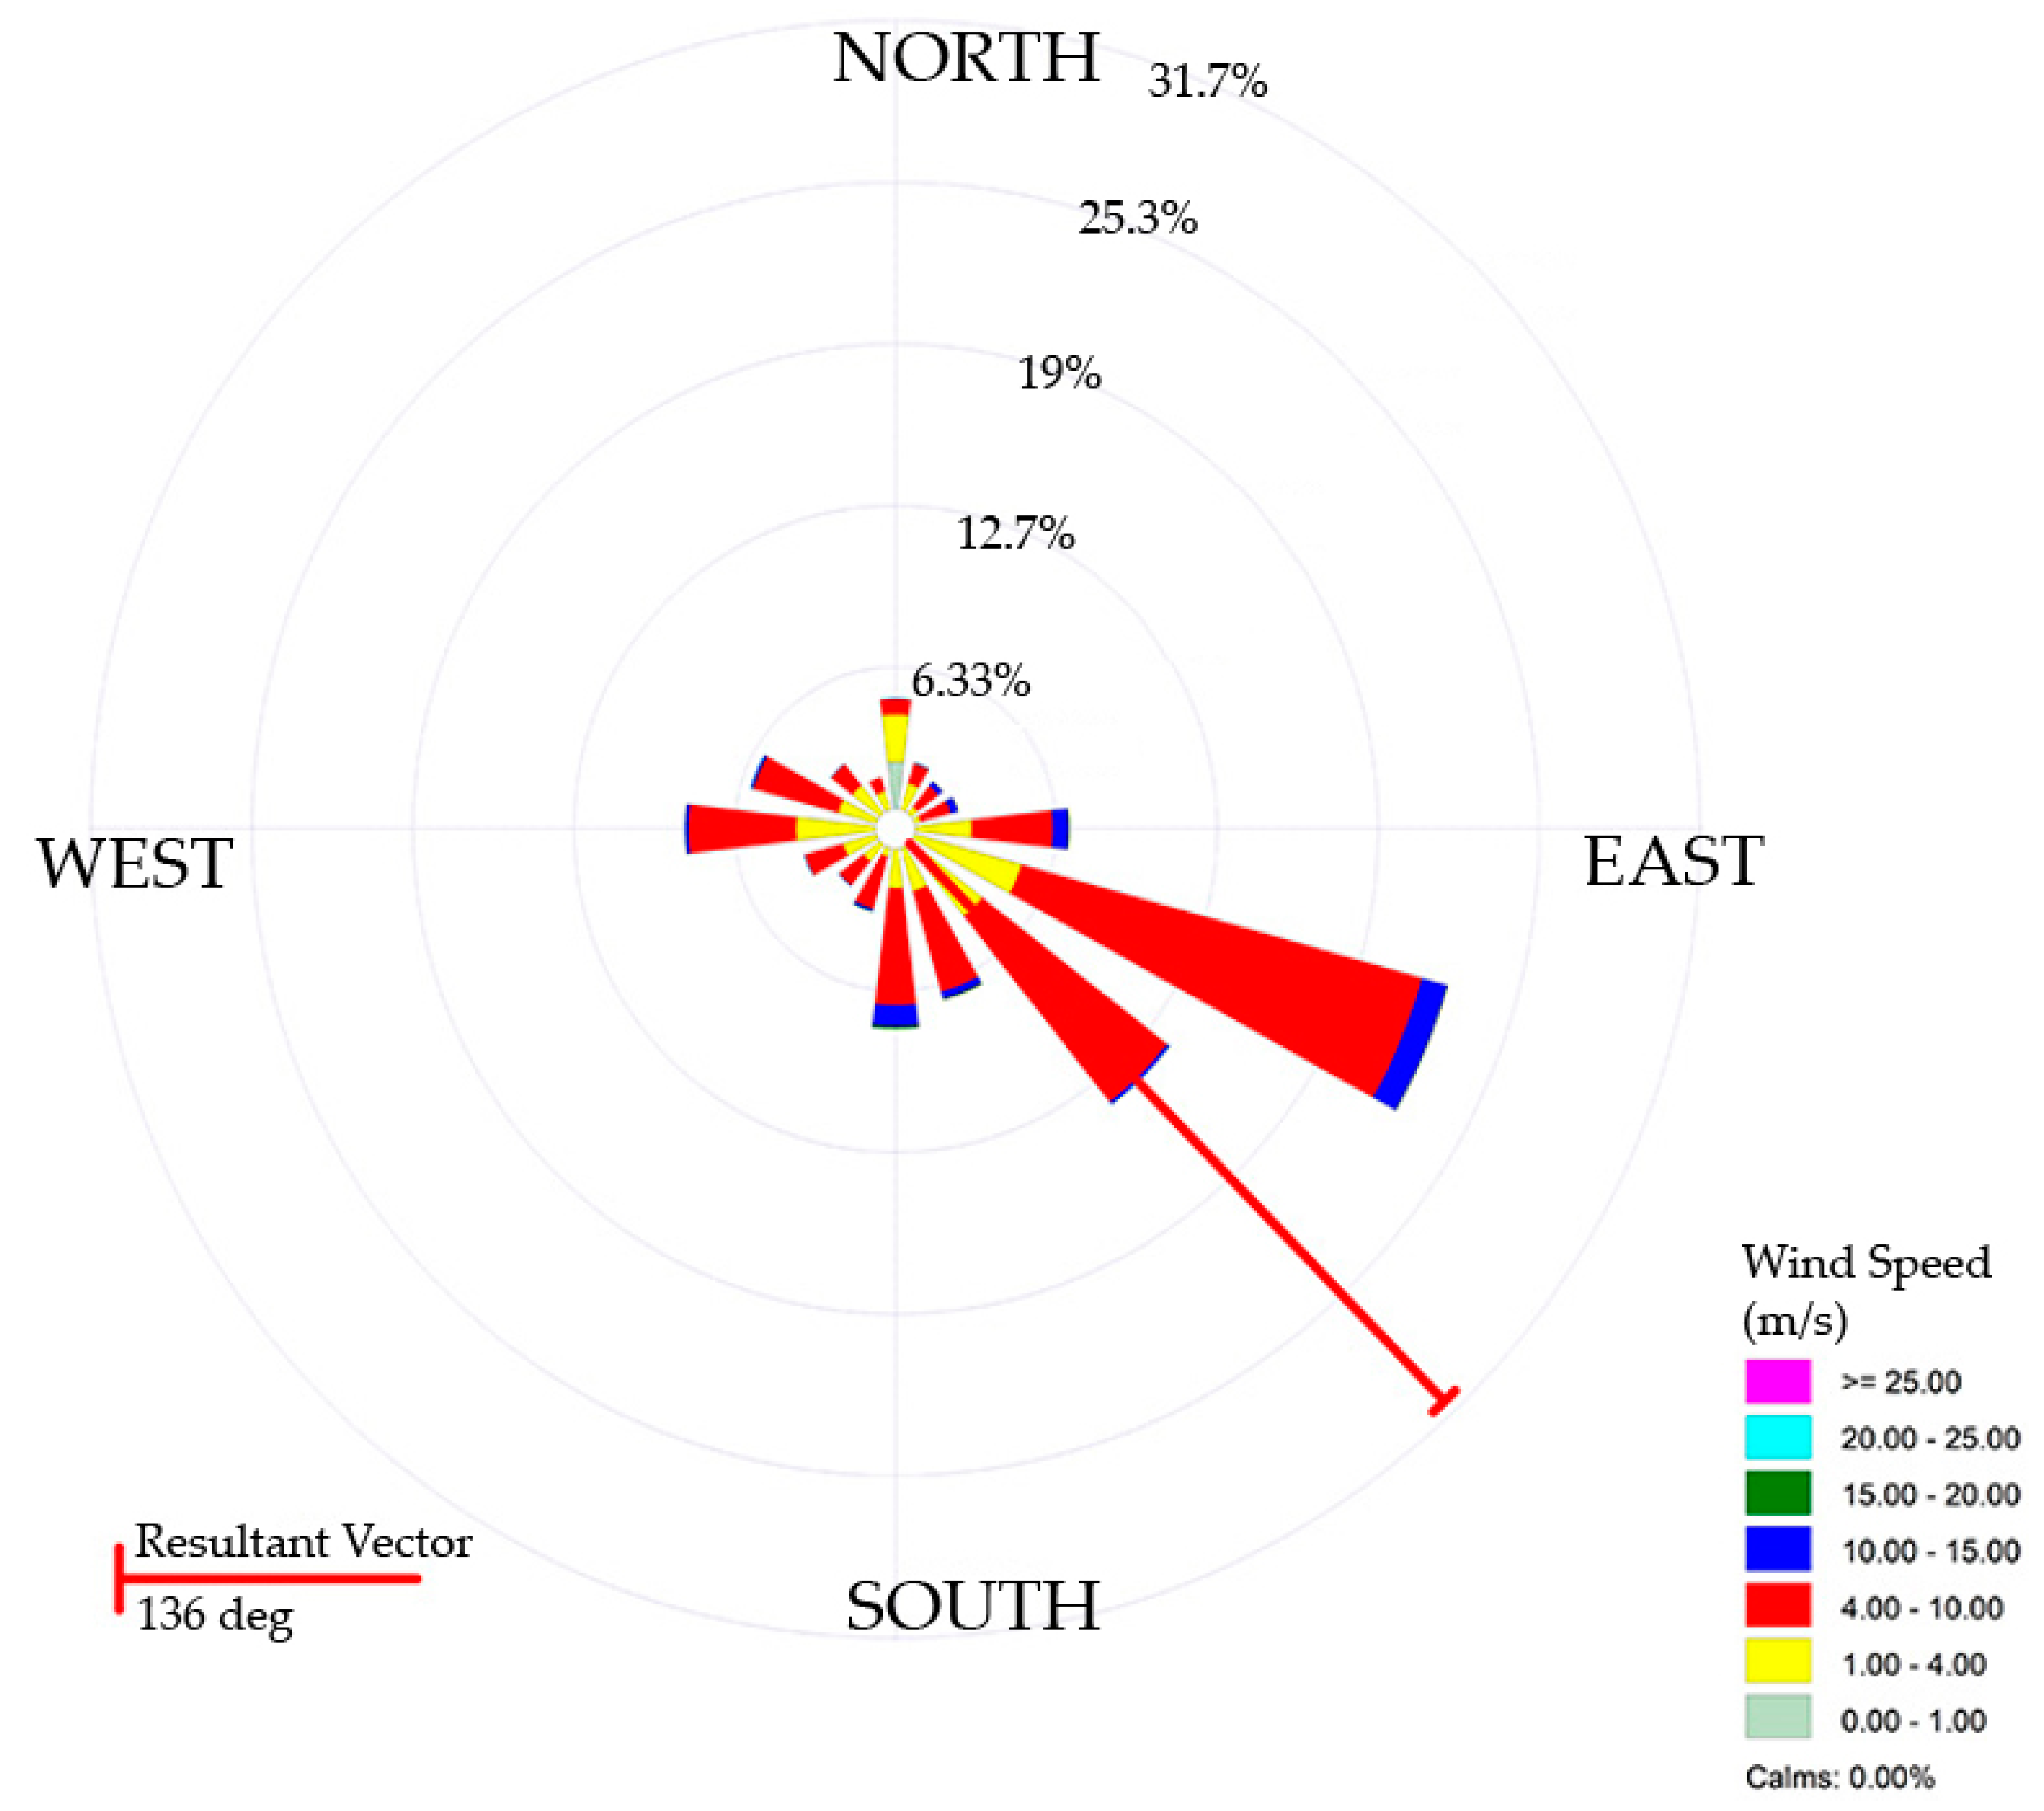
3.1. Zabol
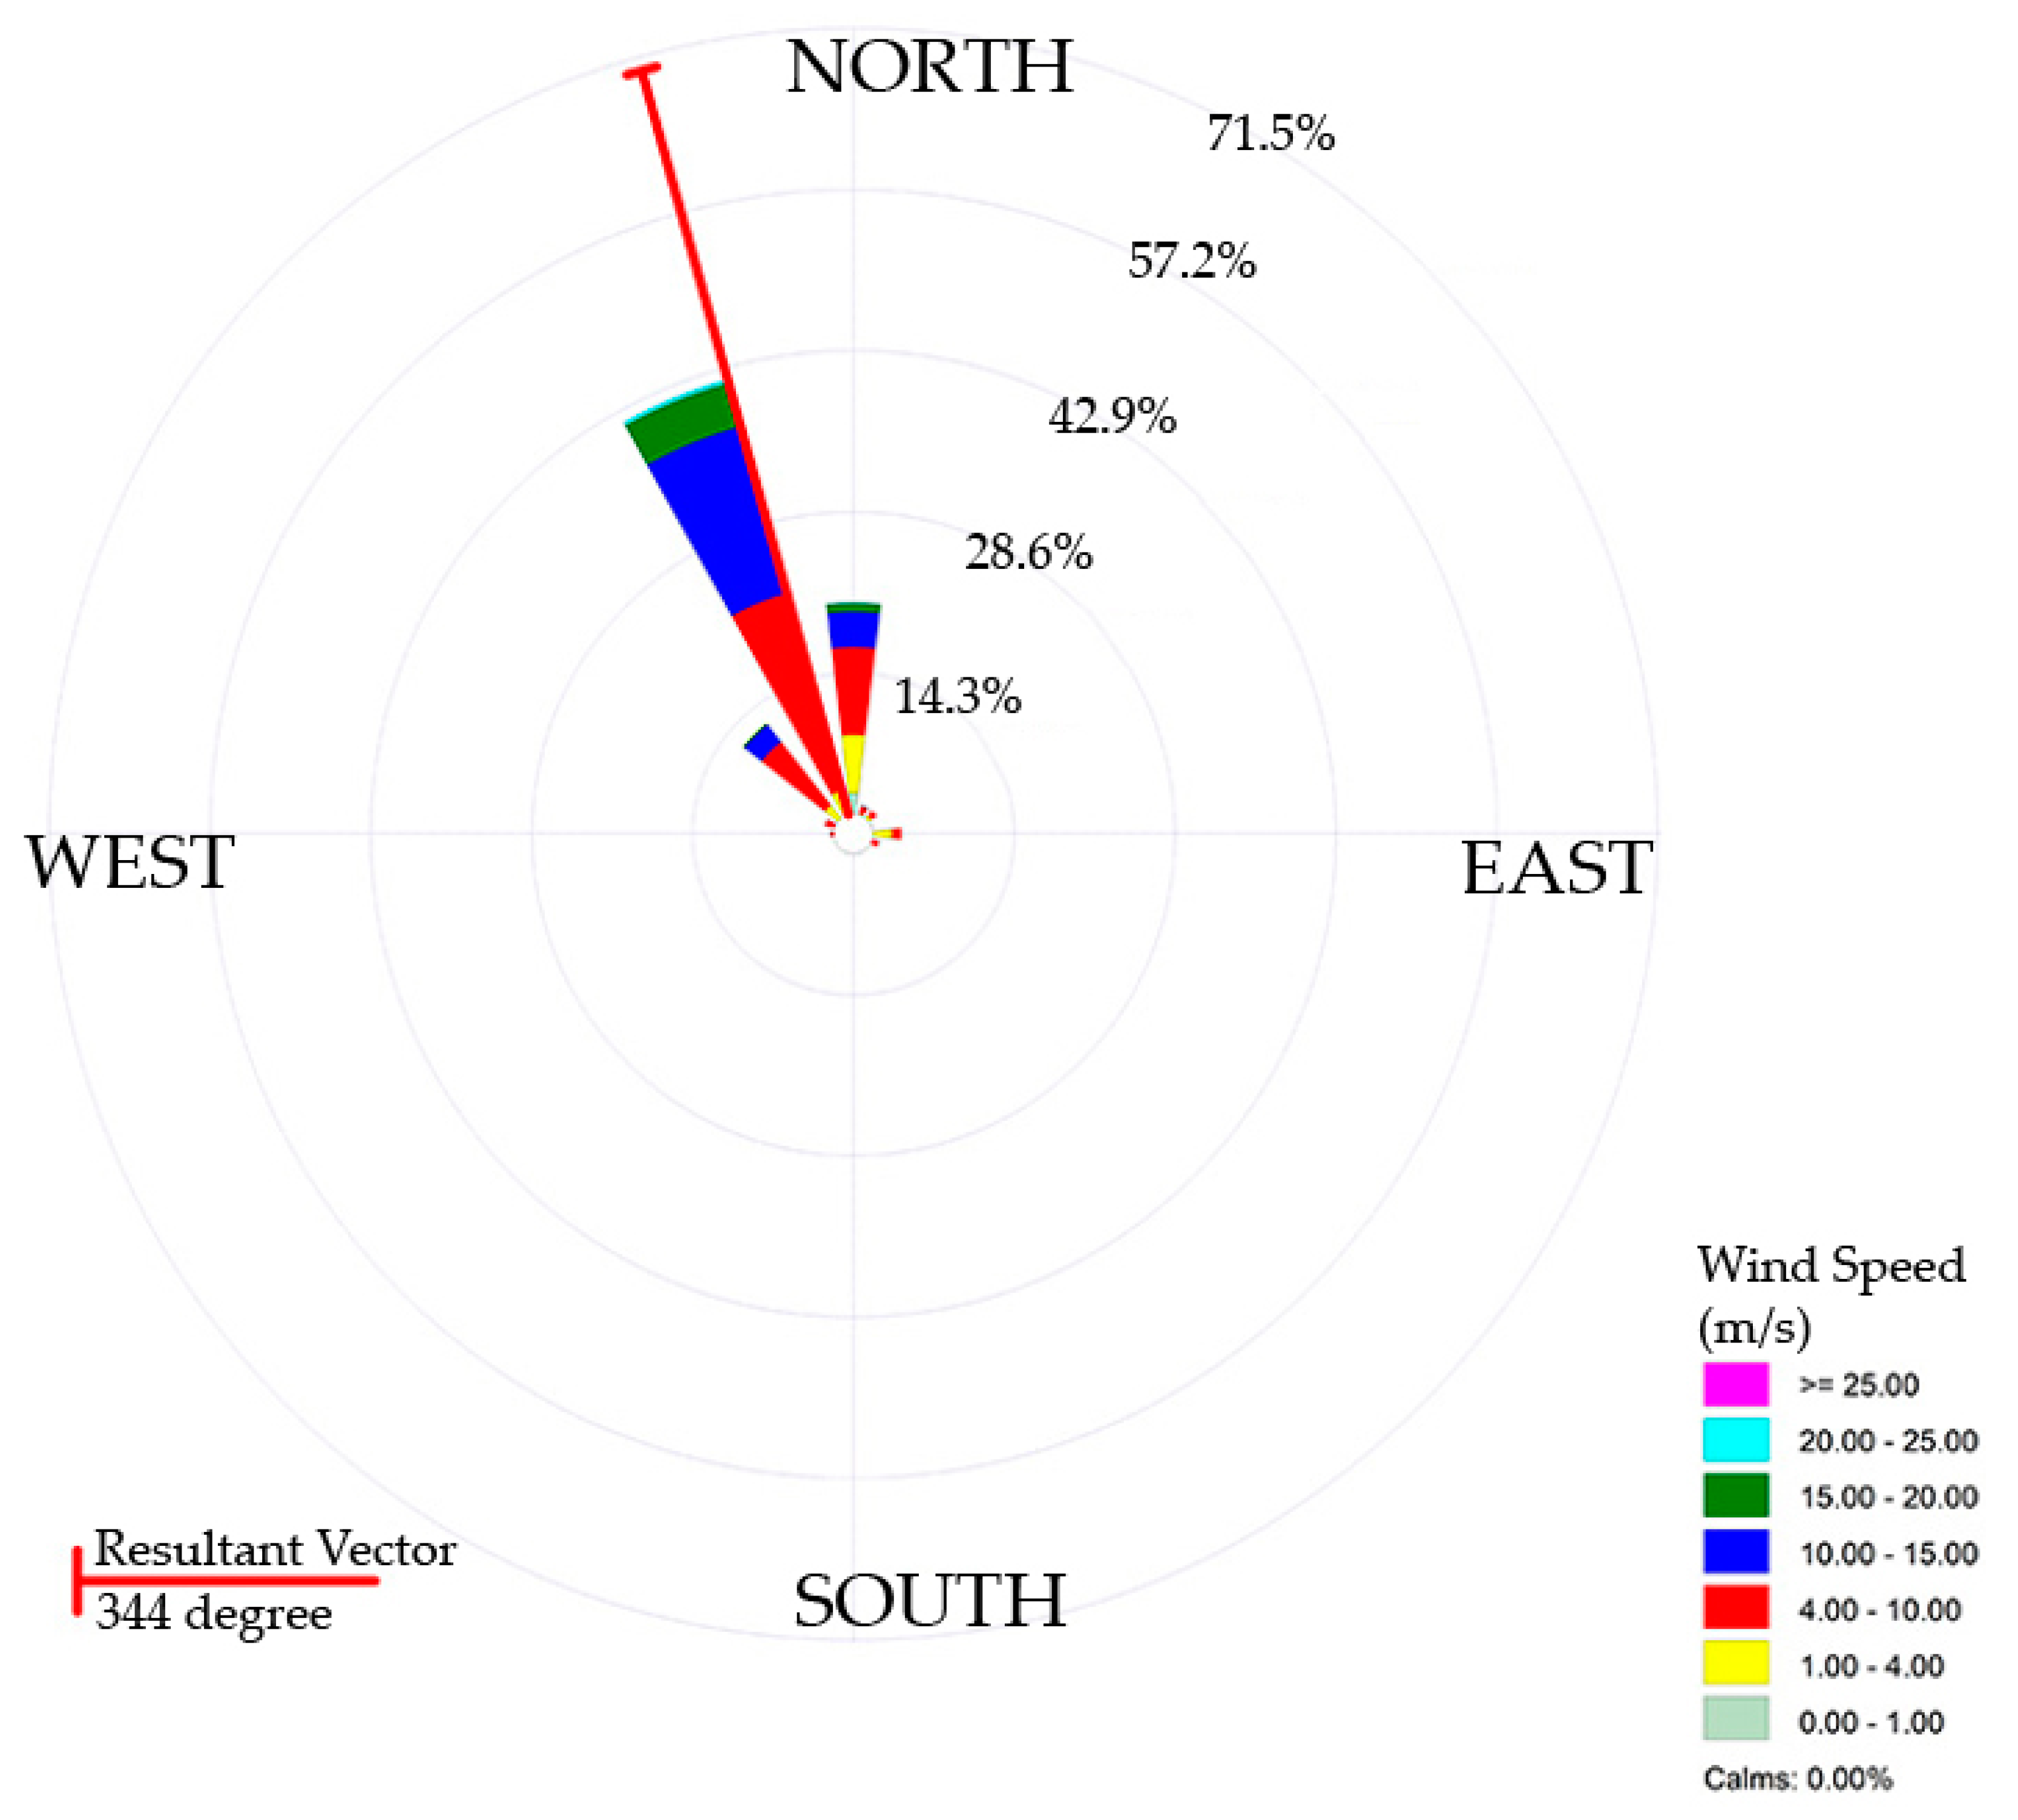
Zabol city is located in the northwestern part of Sistan and Balouchestan. Winds of over 200 km per hour blow through Zabol city, which has a desert topography. According to the meteorological data from the synoptic station throughout the period, the average wind speed in this station was 6.42 m/s. The prevailing wind direction is northwest, according to the windrose diagram of this station (Figure 5).

Figure 5.
Windrose diagram of Zabol station.
The resultant vector is shown in windrose diagrams. The resultant vector combines the frequency of winds in each direction to get an average wind direction. In the calculation of the resultant vector, wind speed has no role. For the Zabol station, the resultant vector is in the same direction as the prevailing wind direction. The frequency distribution of different wind classes (Figure 6) indicates that the recorded speed of 45% of the blown winds is between 1 and 4 m/s, and about 50% has a speed between 4 and 15 m/s, which is significant.
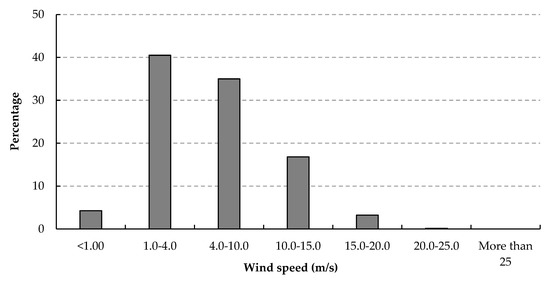
Figure 6.
Wind class frequency distribution of Zabol station.
3.2. Siri Island
Siri Island is located in the southern part of Iran in Hormozgan province and is considered a coastal location. According to the meteorological data of the synoptic station, the average wind speed over the mentioned period was 4.73 m/s (Table S1). Based on the windrose diagram (Figure 7), approximately 33% of the prevailing winds have been blown from west and southwest, 30% from east and northeast. The resultant vector determines the direction to the northwest.
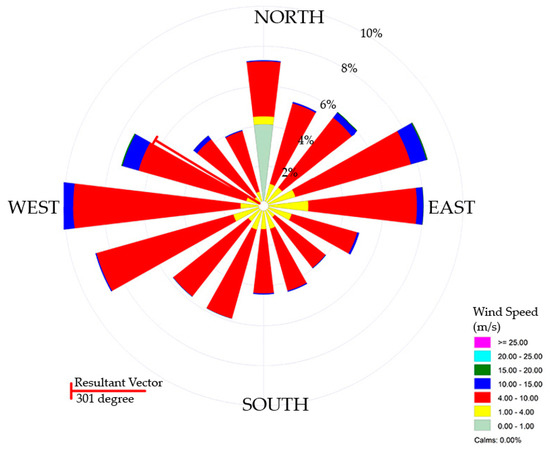
Figure 7.
Windrose diagram of Siri Island station.
The frequency distribution of different wind classes is shown in Figure 8. According to that, more than 90% of prevailing winds of Siri Island have a speed between 1 and 15 m/s, and about 50% of this recorded data is between 4 and 15 m/s, which plays a key role in energy conversion systems. The highest wind speed of the region in the period is reported to be 42 m/s.
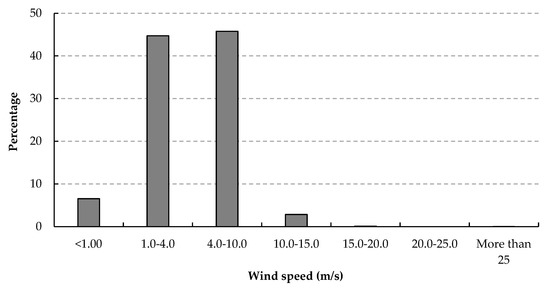
Figure 8.
Wind class frequency distribution of Siri Island station.
3.3. Aligudarz
Aligudarz meteorological station is in a mountainous region located in the western part of Iran. The average wind speed in this region from August 2015 to July 2020 is 4.42 m/s. According to the windrose diagram (Figure 9), 35% of the wind in this area blows from the southeast. The resultant vector is also towards the southeast.
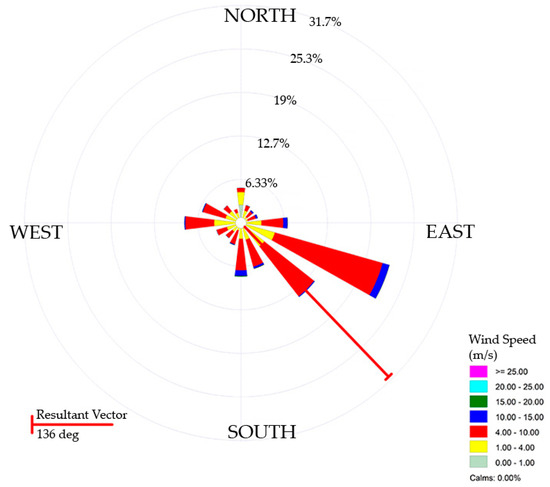
Figure 9.
Windrose diagram of Aligudarz station.
The frequency distribution of different wind classes is in Figure 10, which demonstrates that 48% of the winds have a speed between 1 and 4 m/s, and approximately 43% have a speed between 4 and 15 m/s. The highest reported wind speed in this meteorological station is 64 m/s.
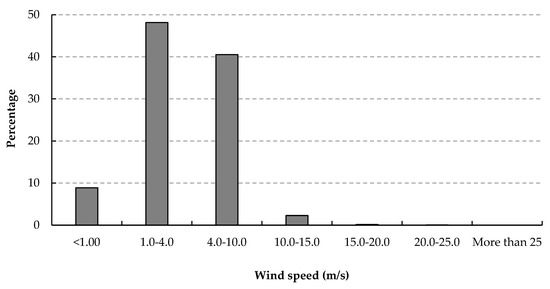
Figure 10.
Wind class frequency distribution of Aligudarz station.
3.4. Energy Harvesting Simulation
3.4.1. Lift Force
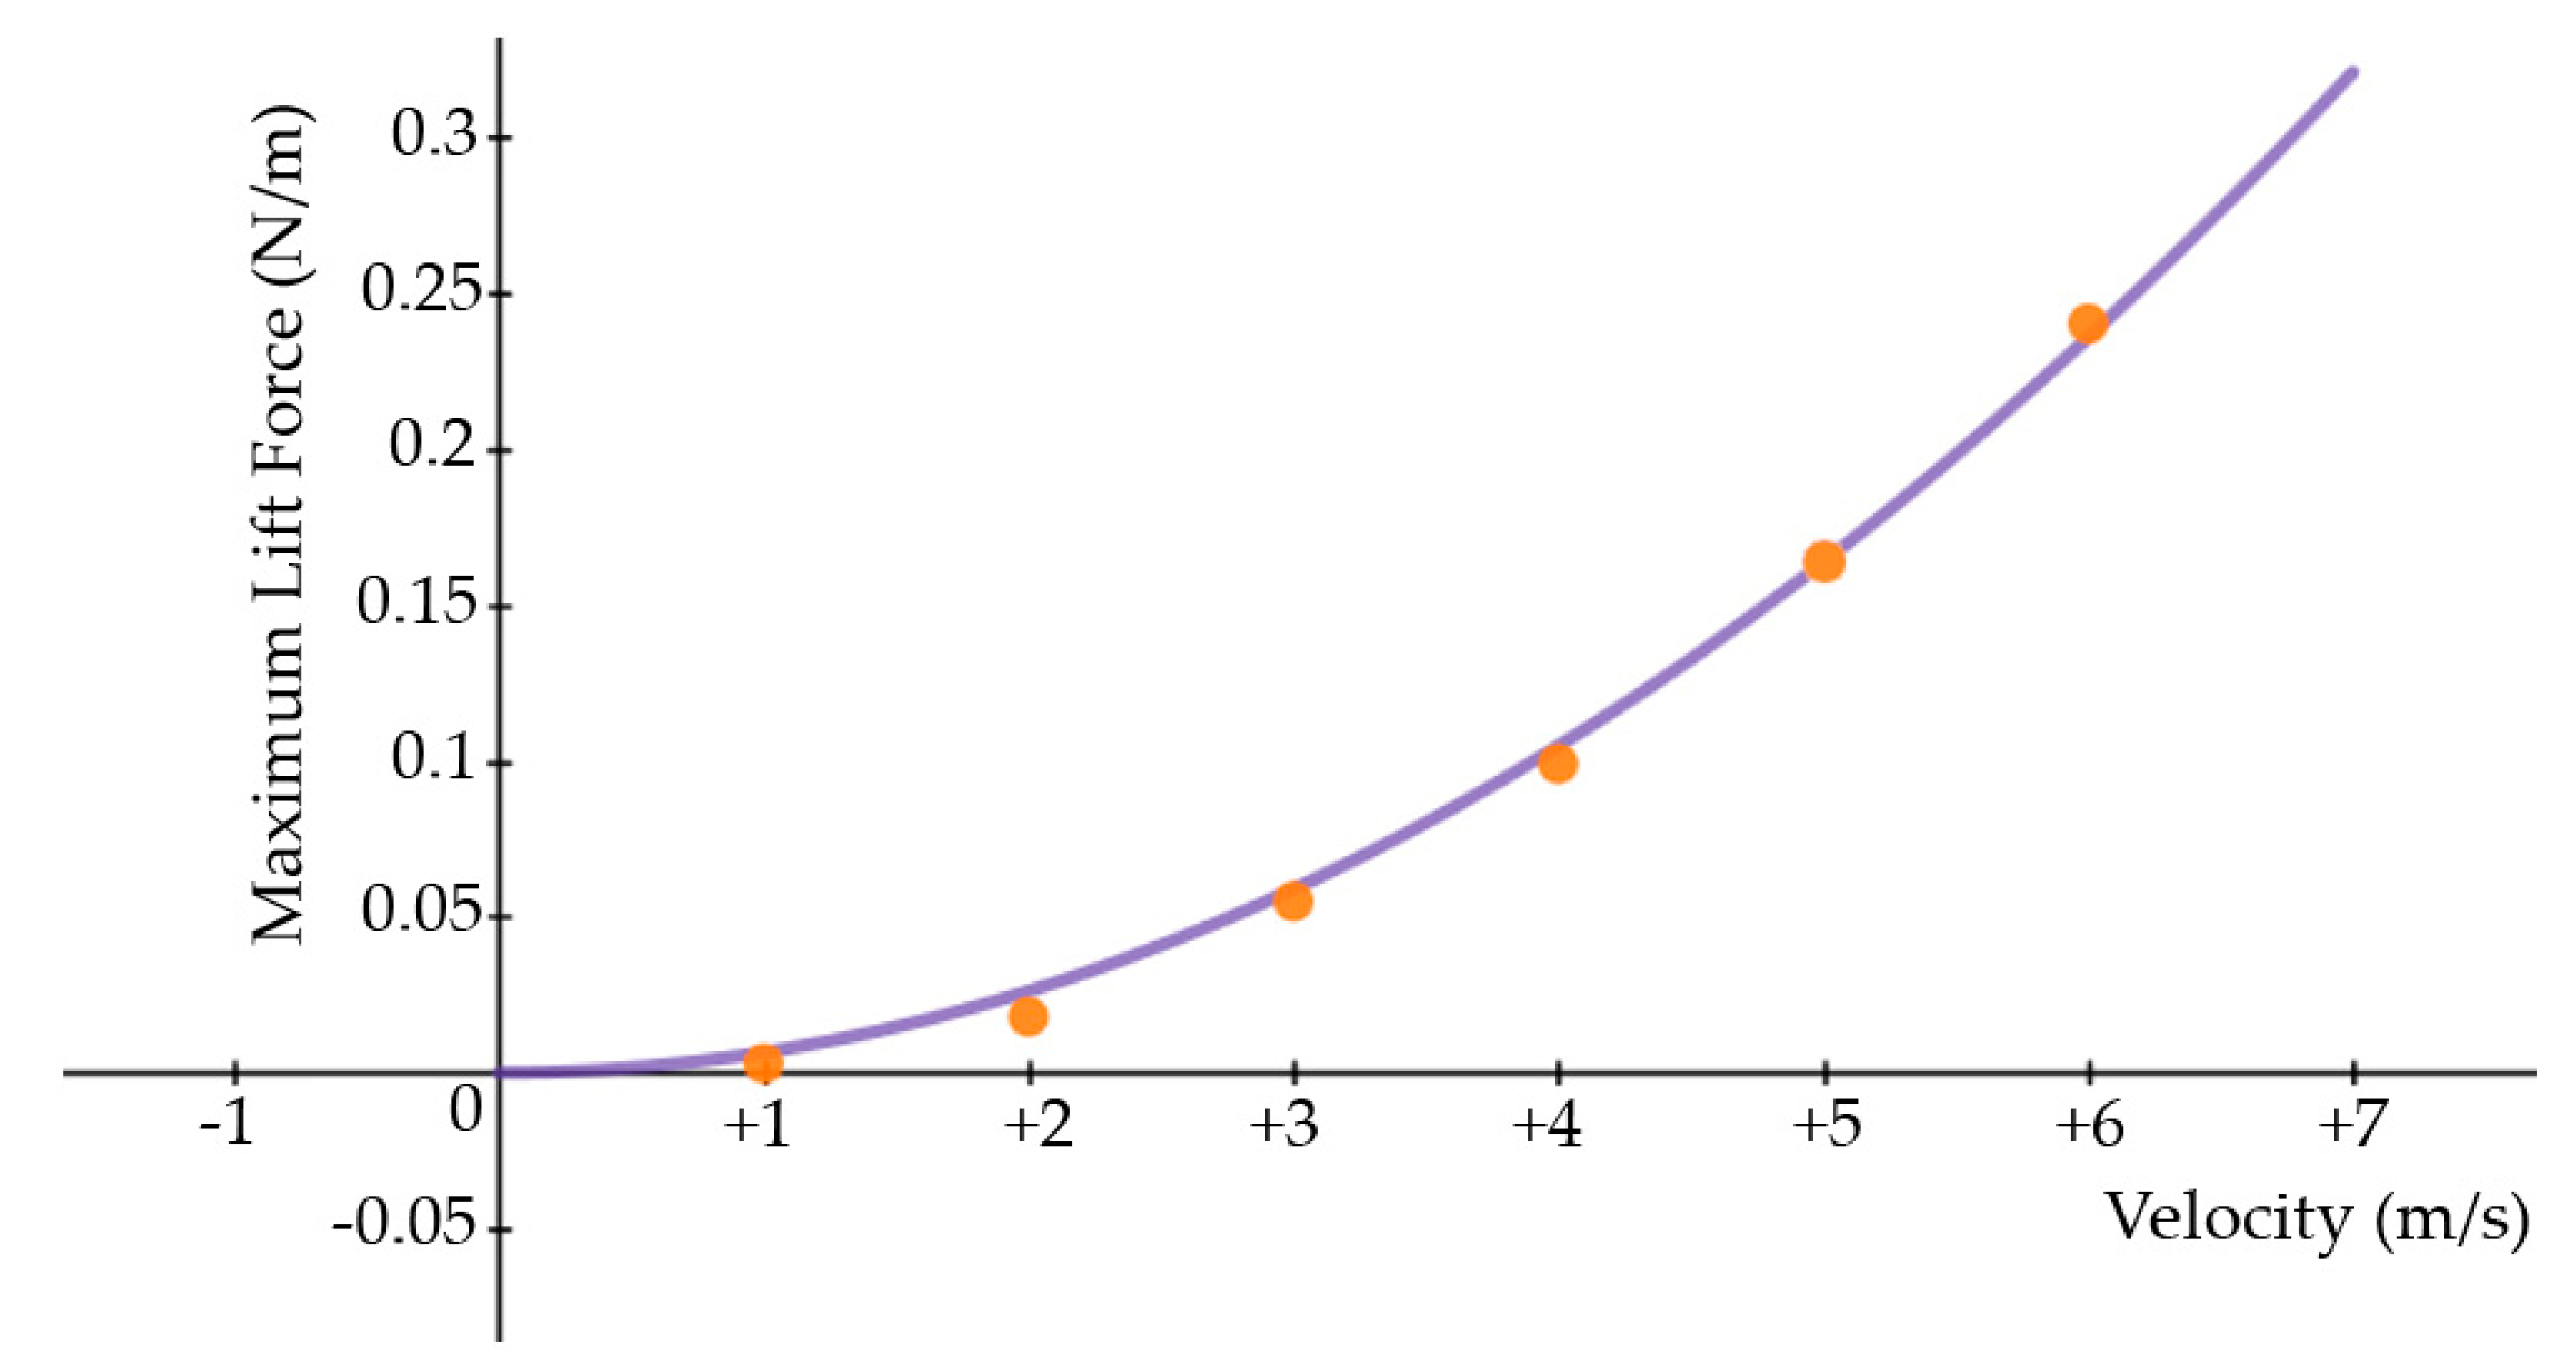
The maximum amount of the lift force at each velocity is presented in Table 3. The lift force is proportional to the square of the velocity, therefore:
Table 3.
Maximum amount of lift force at different velocities.
The R2 value of the curve fitting to the maximum points of lift force was equivalent to 0.996, which is very close to 1 when a parabolic curve was fitted to the maximum points of lift force at each velocity. This implies that the simulation of the lift force at each velocity is a function of the parabolic curve (Figure 11).
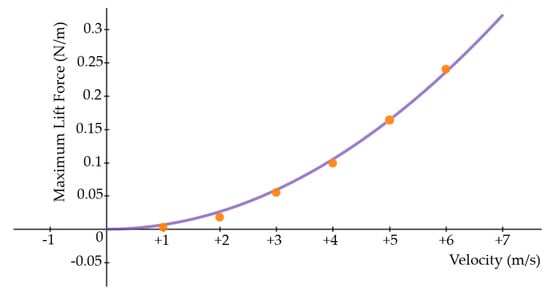
Figure 11.
Curve fitting to the maximum points of lift force.
3.4.2. Simulation Based on Piezoelectric Beam I
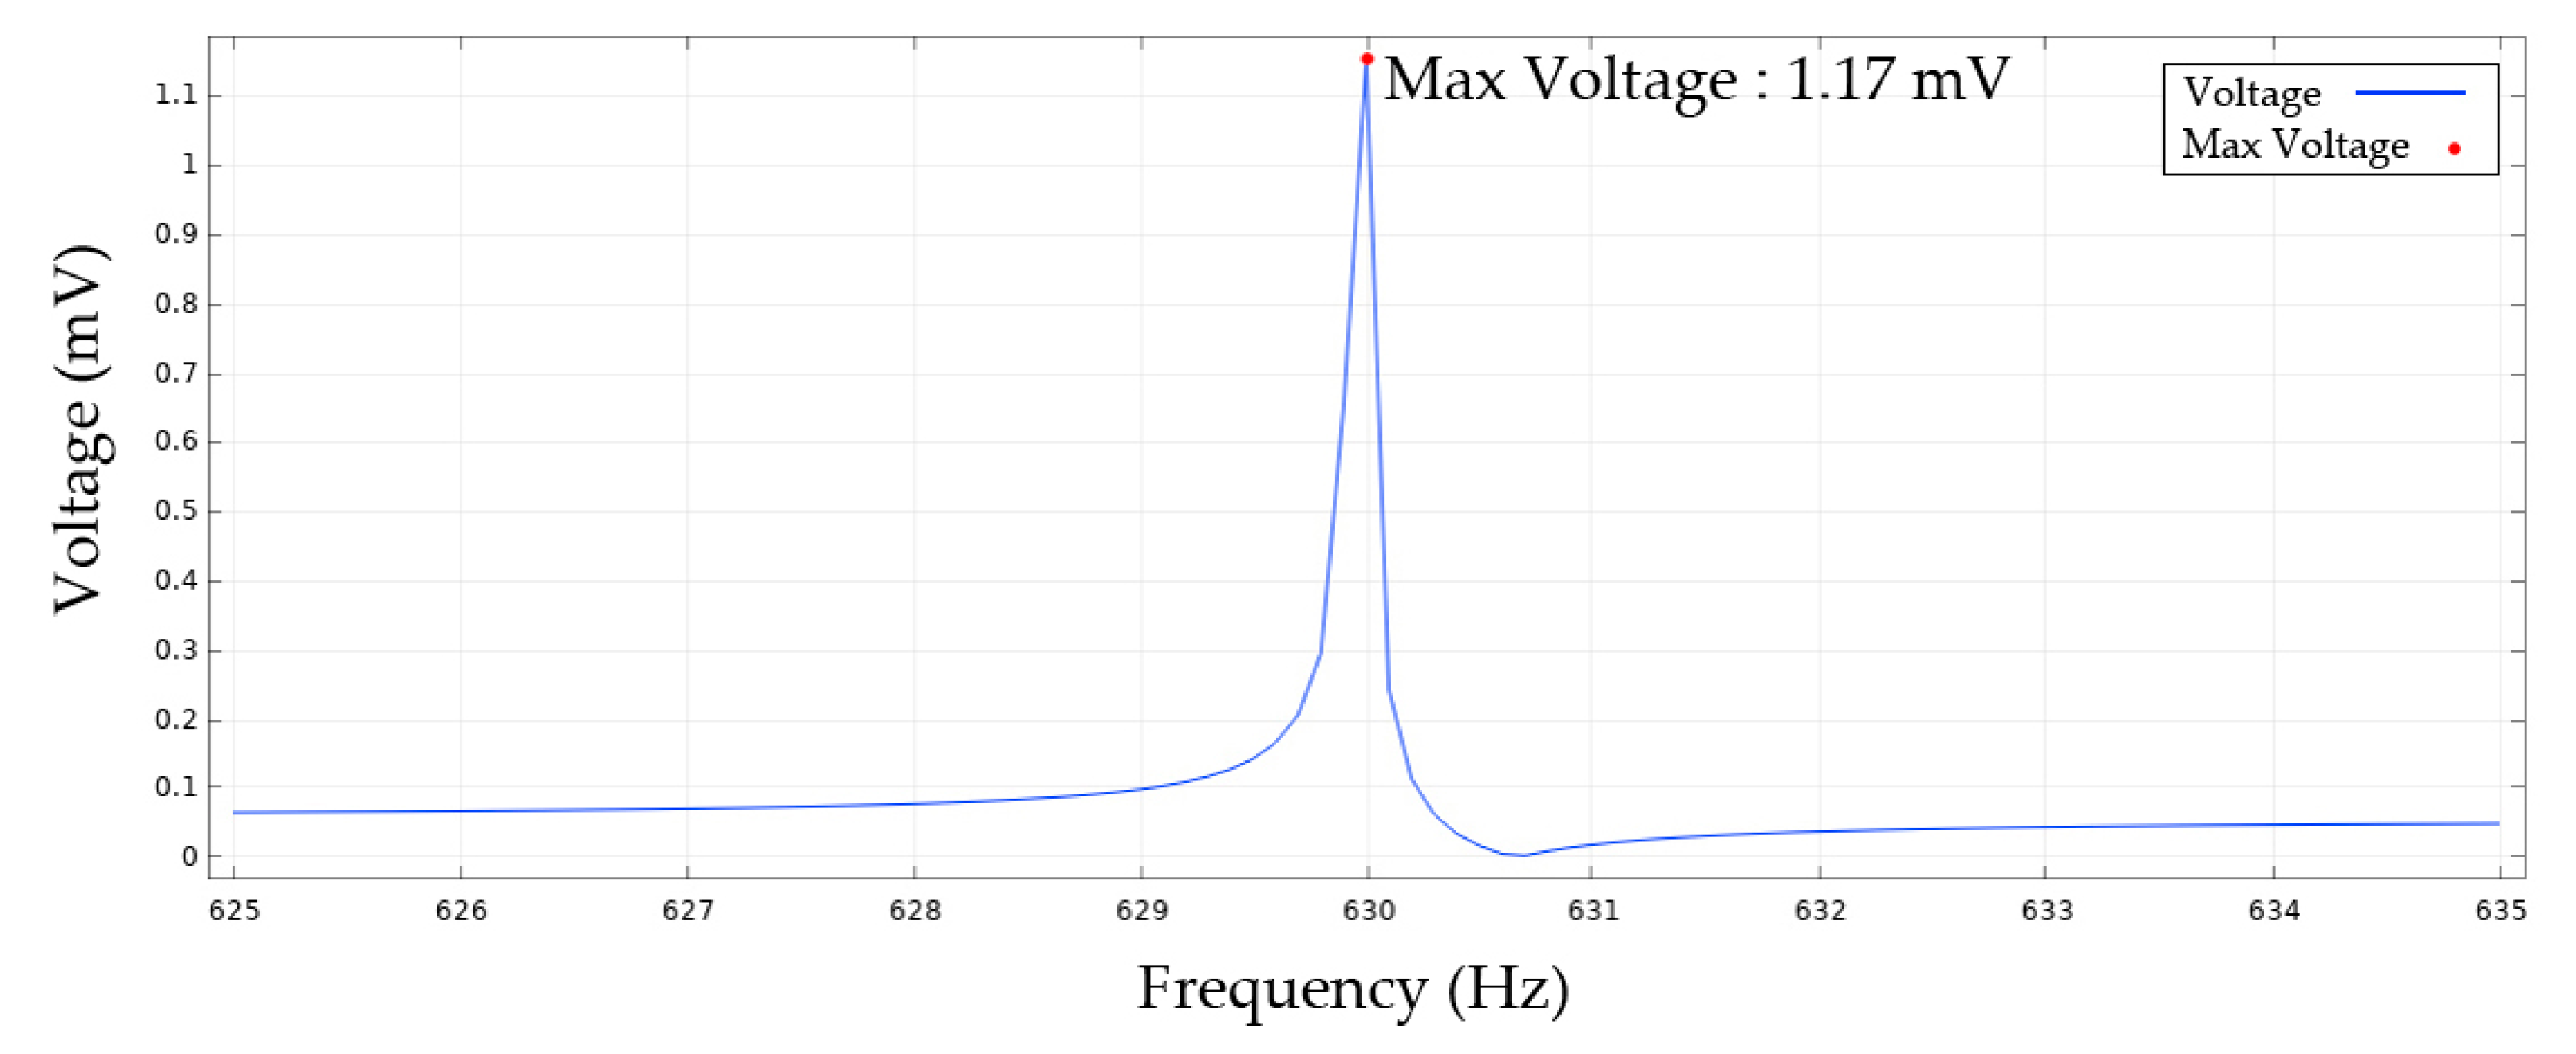
The natural frequency of the piezoelectric beam, which is 18.5 mm long and 1.0016 mm thick, is about 630 Hz in its first mode shape. This frequency is close to the vortex shedding frequency in the wind flow passage at a speed of 6 m/s through the bluff body with the specified diameter. The deformation of this cantilever beam is shown in Figure 12. As can be observed from Figure 13, the resonance happened at the frequency of around 630 Hz, and the maximum voltage of 1.17 mV has extracted from the first mode shape.
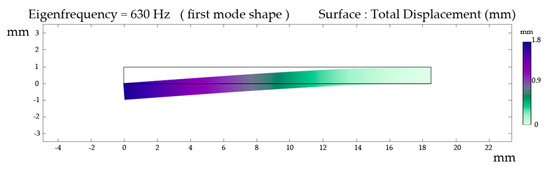
Figure 12.
First mode shape of piezoelectric beam I.
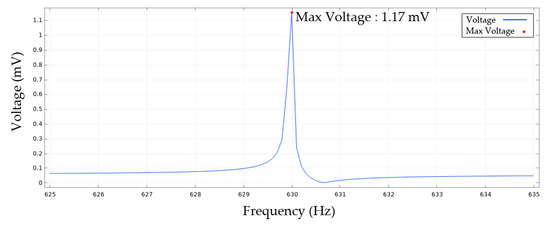
Figure 13.
Output voltage from piezoelectric beam I at first mode shape.
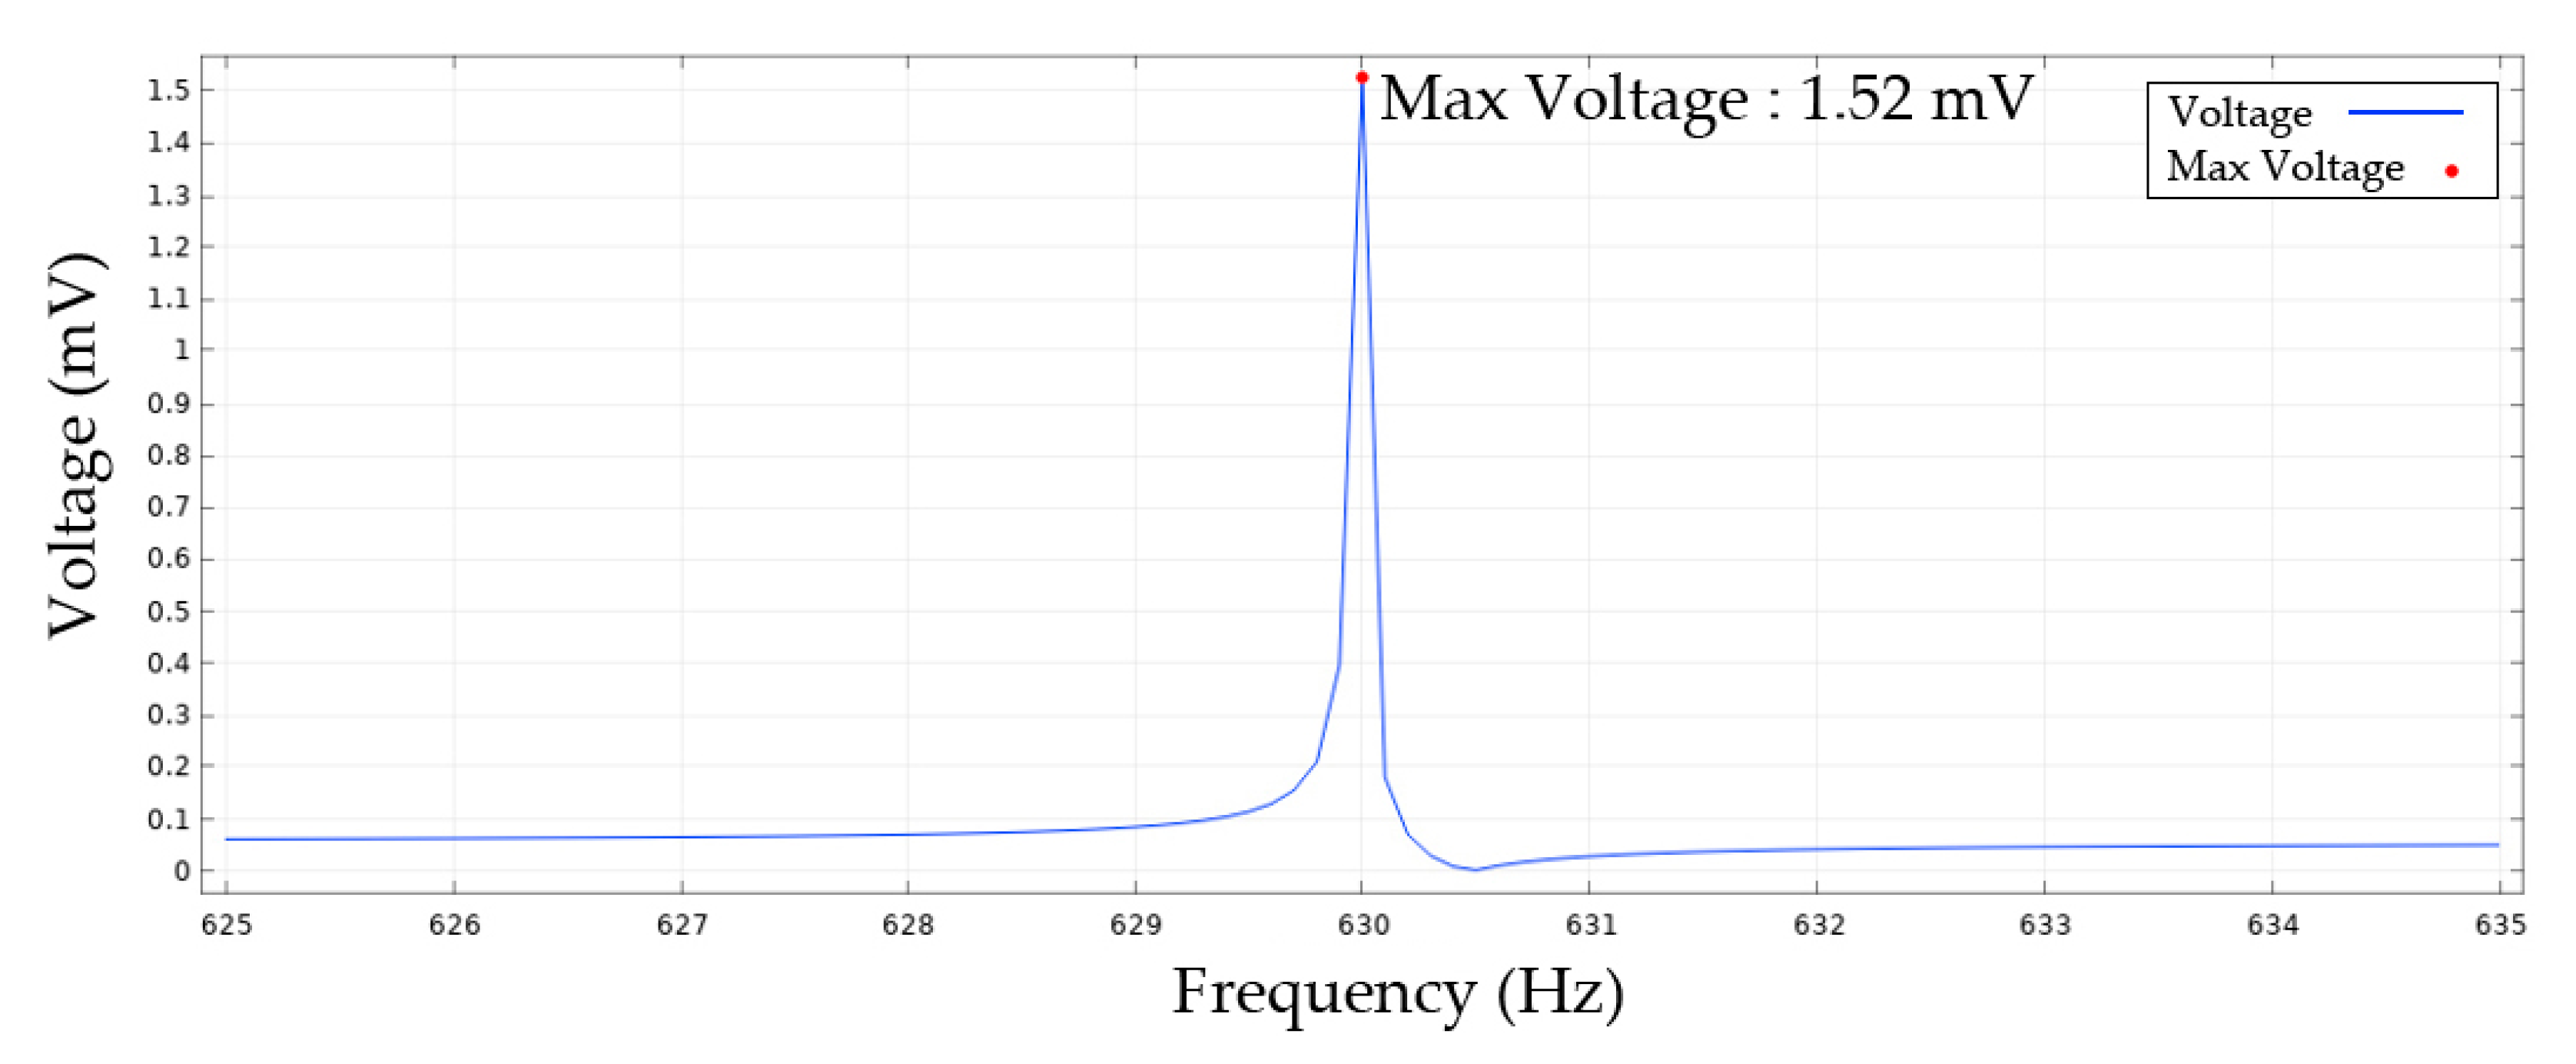
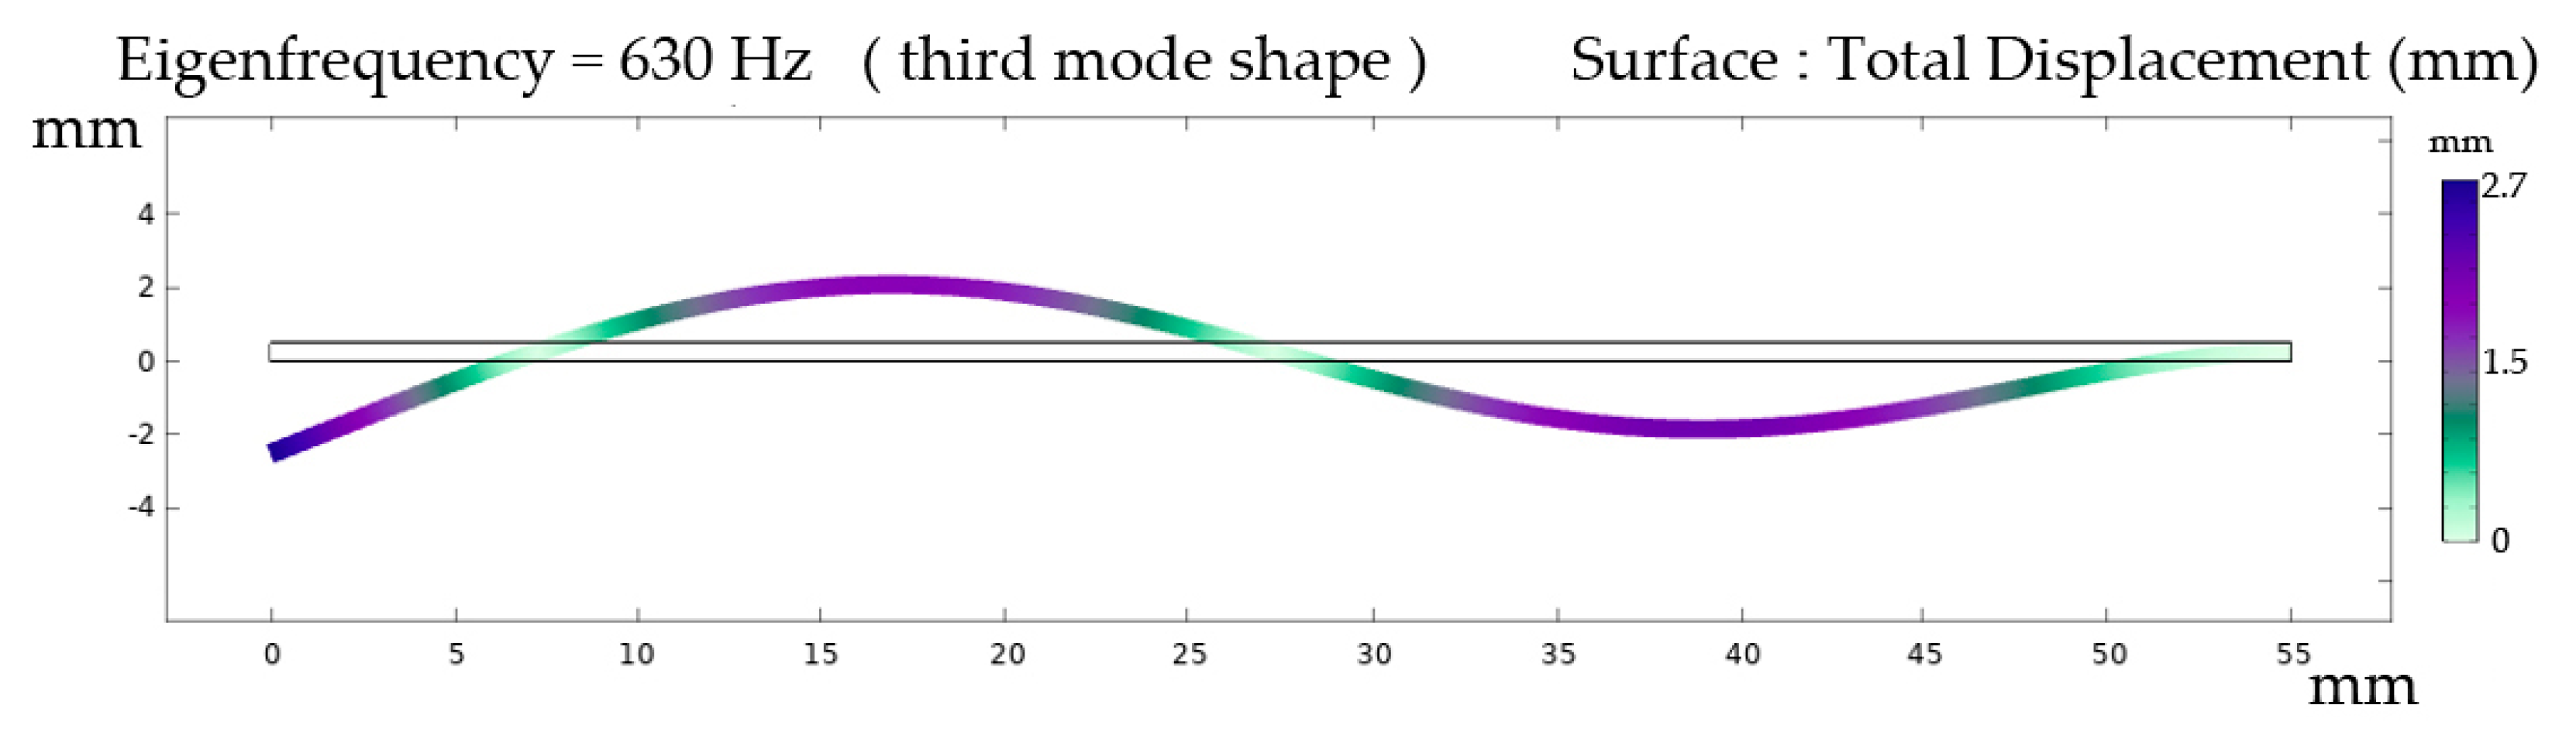
3.4.3. Simulation Based on Piezoelectric Beam II
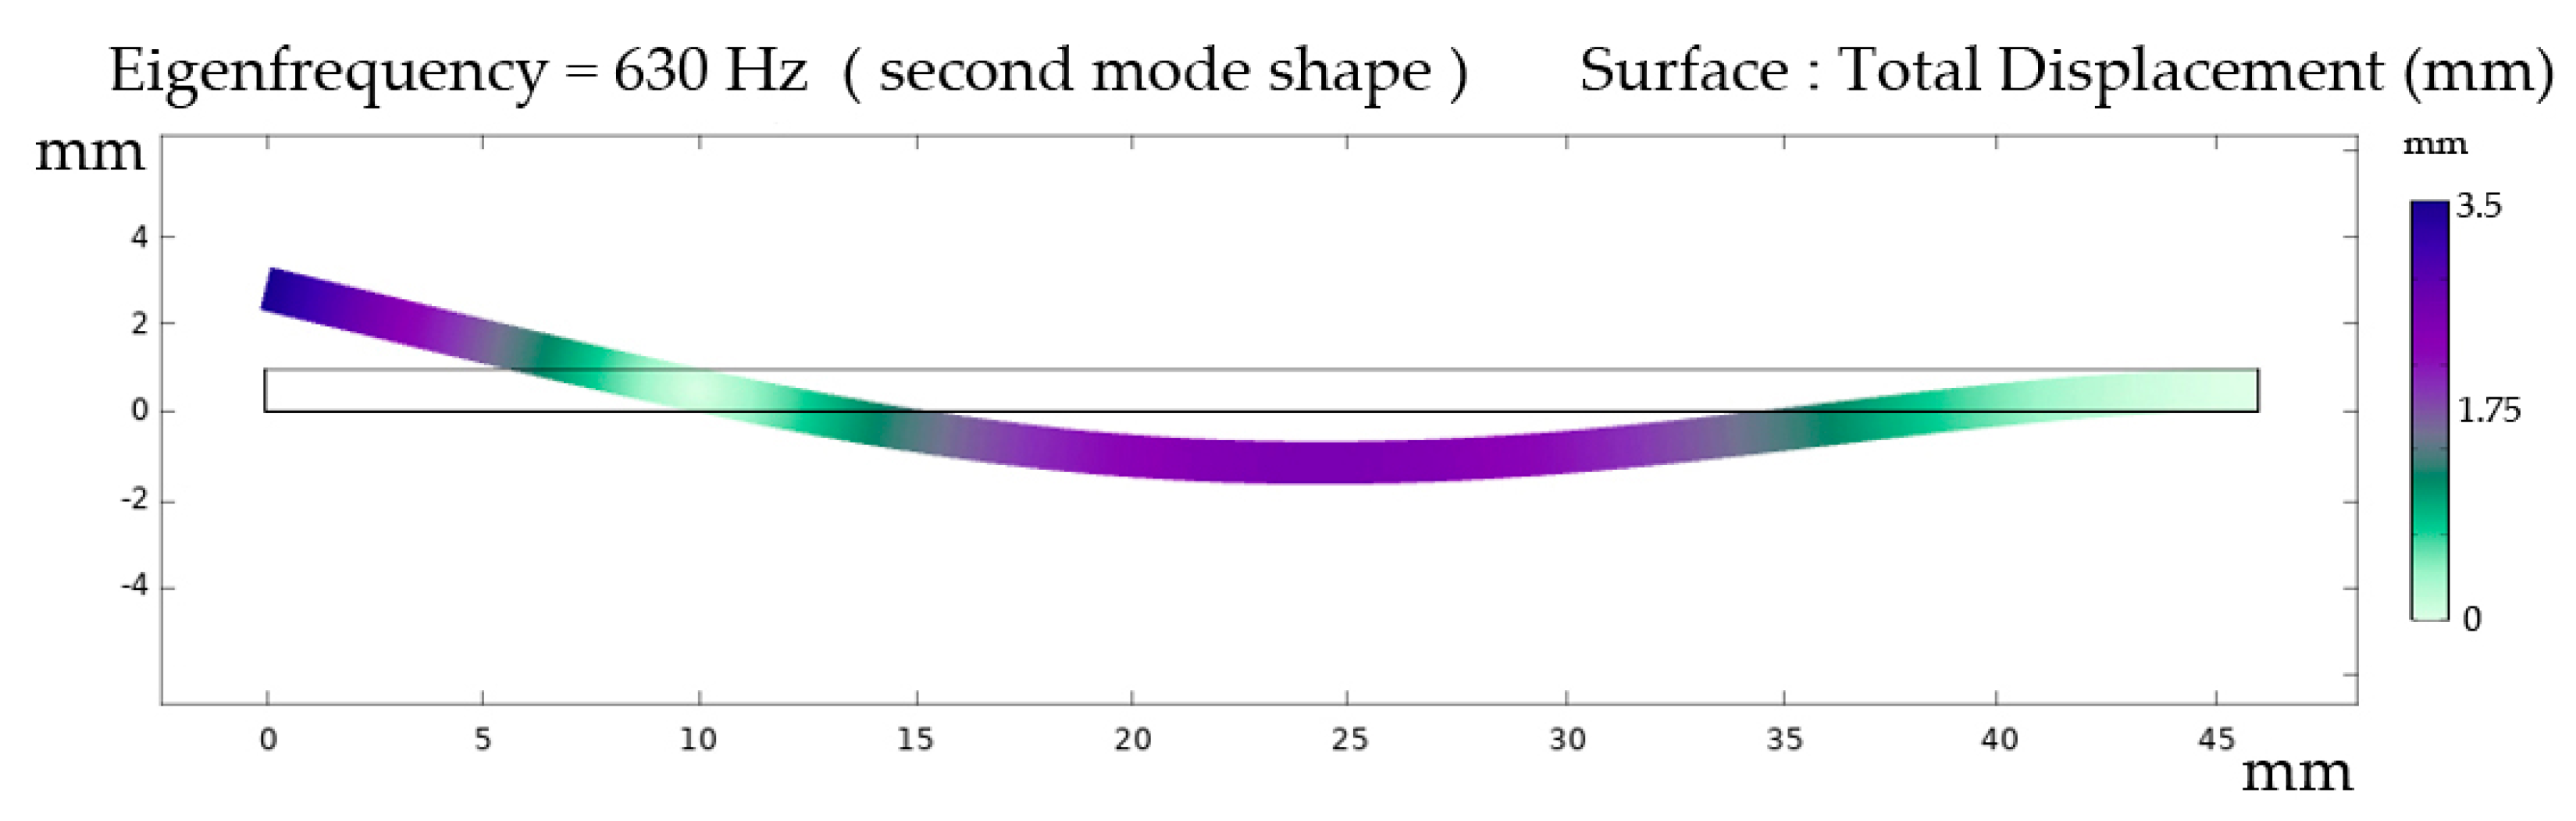
The second piezoelectric beam, 46 mm long and 0.99 mm thick, experiences a resonance phenomenon at the second mode shape (Figure 14). The output voltage at the frequency of 630 Hz is equal to 1.52 mV. Figure 15 shows the output voltage versus frequency for this beam.

Figure 14.
Second mode shape of piezoelectric beam II.
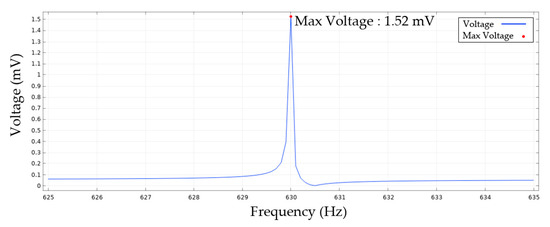
Figure 15.
Output voltage from piezoelectric beam II at second mode shape.
3.4.4. Simulation Based on Piezoelectric Beam III
The third piezoelectric beam, with a length of 55 mm and a thickness of 0.5053 mm, in its third mode shape has a frequency equal to 630 Hz, in which resonance phenomena occur in the third mode shape (Figure 16). The maximum output voltage is equal to 0.043 mV. Figure 17 shows the output voltage versus frequency.

Figure 16.
Third mode shape of piezoelectric beam III.
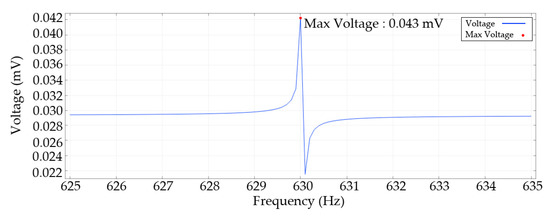
Figure 17.
Output voltage from piezoelectric beam III at third mode shape.
4. Conclusions
The proportion of renewable energy in a community’s energy supply is steadily growing. Wind energy has been highly regarded among various renewable energy sources due to its high capacity, ease of conversion, and predictability and has thus made considerable progress over the years. The use of non-rotating turbines such as vortex bladeless wind turbines [33] and Invelox [34] is one of the latest advances in wind energy extraction. Piezoelectric materials have also been widely investigated due to their simplicity of operation and the possibility of using them in low-power or self-actuating sensors and electronic devices. Therefore, in this study, wind data of 76 meteorological stations in Iran over six years (2015–2020) were collected every three hours, and the average speed and direction of the prevailing winds of each were examined. Three meteorological stations in Zabol with 6 m/s, Aligudarz 4.5 m/s, and Siri 4 m/s had the highest average of wind speeds in this period. Zabol, Aligudarz, and Siri Island stations prevailing wind directions are northwest, southwest, and west, respectively. Winds are toward the west for the southern part of Iran (the Persian Gulf and Oman Sea).
Considering the maximum average speed, known bluff body’s diameter, and the Strouhal number (approximately 0.21), the frequency of vortex shedding is about 630 Hz. By selecting three elements of PVDF piezoelectric cantilever with different sizes and a natural frequency of 630 Hz, the voltage extracted when the resonance phenomenon occurs is as follows:
- The maximum voltage of 1.17 mV has been harvested from the piezoelectric element with dimensions of 18.5 × 1.0016 mm.
- From the second piezoelectric element with 46 × 0.99021 mm dimensions, which has a natural frequency of 630 Hz at its second mode, a voltage of 1.52 mV was extracted.
- The third element with dimensions of 55 × 0.5503 mm, which has a natural frequency of 630 Hz in its third shape mode, can also pick up the maximum voltage of 0.043 mV during amplification.
The amount of voltage obtained is also low due to the energy harvester’s small size; therefore, multiple elements of various sizes and orientations can be positioned at a distance of 20 times the length of each other to neutralize each other’s effect due to wind cycling and to increase harvested energy. This study shows that energy harvesting from vortex-induced vibration can supply wireless sensors and self-powered systems for developing smart cities and houses.
Supplementary Materials
The following supporting information can be downloaded at: https://www.mdpi.com/article/10.3390/knowledge2030030/s1, Table S1: Stations geographical characteristics and wind flow indicators of stations.
Author Contributions
Conceptualization, M.A., K.A.S. and M.K. (Mehdi Khanbazi); methodology, M.A., K.A.S. and M.K. (Mehdi Khanbazi); software, M.A., K.A.S. and M.K. (Mehdi Khanbazi); validation, M.A., K.A.S. and M.K. (Mehdi Khanbazi); formal analysis, M.A., K.A.S. and M.K. (Mehdi Khanbazi); investigation, M.A., K.A.S. and M.K. (Mehdi Khanbazi); resources, M.A., K.A.S. and M.K. (Mehdi Khanbazi); data curation, M.A., K.A.S. and M.K. (Mehdi Khanbazi); writing—original draft preparation, M.A., K.A.S. and M.K. (Majid Khanali); writing—review and editing, S.M.M.S. and M.V.M.; visualization, M.A., K.A.S. and M.K. (Mehdi Khanbazi); supervision, K.A.S. and M.K. (Majid Khanali); funding acquisition, S.M.M.S. All authors have read and agreed to the published version of the manuscript.
Funding
This research received no external funding.
Institutional Review Board Statement
Not applicable.
Informed Consent Statement
Not applicable.
Data Availability Statement
The data supporting the findings of this study are available from the first author (M.A.) upon reasonable request.
Acknowledgments
Seyed Mohammad Moein Sadeghi’s research at the Transilvania University of Brasov, Romania, was supported by the program “Transilvania Fellowship for Postdoctoral Research/Young Researchers”, during his research in Romania.
Conflicts of Interest
The authors declare no conflict of interest.
Abbreviations
The following abbreviations are used in this manuscript:
| Density | |
| Dynamic Viscosity | |
| V | Wind Speed |
| D | Diameter of the bluff body |
| St | Strouhal number |
| 𝑑 | Piezoelectric Charge constant |
| s | Compliance of Piezoelectric |
| g | Piezoelectric Voltage coefficient |
| Vortex Shedding frequency | |
| Reynolds number | |
| ε | Dielectric Permittivity |
| k | Electromechanical Coupling factor |
References
- Pudasainee, D.; Kurian, V.; Gupta, R. 2-Coal: Past, Present, and Future Sustainable Use; Elsevier: Amsterdam, The Netherlands, 2020. [Google Scholar] [CrossRef]
- Mahmoodi, K.; Ghassemi, H.; Razminia, A. Wind Energy Potential Assessment in the Persian Gulf: A Spatial and Temporal Analysis. Ocean Eng. 2020, 216, 107674. [Google Scholar] [CrossRef]
- Potić, I.; Joksimović, T.; Milinčić, U.; Kićović, D.; Milinčić, M. Wind Energy Potential for the Electricity Production—Knjaževac Municipality Case Study (Serbia). Energy Strategy Rev. 2021, 33, 100589. [Google Scholar] [CrossRef]
- Fazelpour, F.; Markarian, E.; Soltani, N. Wind Energy Potential and Economic Assessment of Four Locations in Sistan and Balouchestan Province in Iran. Renew. Energy 2017, 109, 646–667. [Google Scholar] [CrossRef]
- Renewables Consulting Group. Global Offshore Wind: Annual Market Report 2020; Norwegian Energy Partners: Stavanger, Norway, 2020. [Google Scholar]
- Allaei, D.; Andreopoulos, Y. INVELOX: Description of a New Concept in Wind Power and its Performance Evaluation. Energy 2014, 69, 336–344. [Google Scholar] [CrossRef]
- Chizfahm, A.; Yazdi, E.A.; Eghtesad, M. Dynamic Modeling of Vortex Induced Vibration Wind Turbines. Renew. Energy 2018, 121, 632–643. [Google Scholar] [CrossRef]
- Zheng, C.; Liu, Z.; Wu, T.; Wang, H.; Wu, Y.; Shi, X. Experimental Investigation of Vortex-Induced Vibration of a Thousand-Meter-Scale Mega-Tall Building. J. Fluids Struct. 2019, 85, 94–109. [Google Scholar] [CrossRef]
- Lefebure, D.; Dellinger, N.; François, P.; Mosé, R. Analytical and CFD Study of the Influence of Control Parameters on the Maximum Efficiency of a Hydro-Power Conversion System Based on Vortex-Induced Vibrations. Renew. Energy. 2020, 155, 369–377. [Google Scholar] [CrossRef]
- Hamlehdar, M.; Kasaeian, A.; Safaei, M.R. Energy Harvesting from Fluid Flow using Piezoelectrics: A Critical Review. Renew. Energy 2019, 143, 1826–1838. [Google Scholar] [CrossRef]
- Orrego, S.; Shoele, K.; Ruas, A.; Doran, K.; Caggiano, B.; Mittal, R.; Kang, S.H. Harvesting Ambient Wind Energy with an Inverted Piezoelectric Flag. Appl. Energy 2017, 194, 212–222. [Google Scholar] [CrossRef]
- Wang, L.; Zhao, L.; Luo, G.; Zhao, Y.; Yang, P.; Jiang, Z.; Maeda, R. System Level Design of Wireless Sensor Node Powered by Piezoelectric Vibration Energy Harvesting. Sens. Actuators A Phys. 2020, 310, 112039. [Google Scholar] [CrossRef]
- Asthana, P.; Khanna, G. A Broadband Piezoelectric Energy Harvester for IoT Based Applications. Microelectron. J. 2019, 93, 104635. [Google Scholar] [CrossRef]
- Surmenev, R.A.; Orlova, T.; Chernozem, R.V.; Ivanova, A.A.; Bartasyte, A.; Mathur, S.; Surmeneva, M.A. Hybrid Lead-Free Polymer-Based Nanocomposites with Improved Piezoelectric Response for Biomedical Energy-Harvesting Applications: A Review. Nano Energy 2019, 62, 475–506. [Google Scholar] [CrossRef]
- Petrini, F.; Gkoumas, K. Piezoelectric Energy Harvesting from Vortex Shedding and Galloping Induced Vibrations Inside HVAC Ducts. Energy Build. 2018, 158, 371–383. [Google Scholar] [CrossRef]
- Hosseinalizadeh, R.; Sadat Rafiei, E.; Alavijeh, A.S.; Ghaderi, S.F. Economic Analysis of Small Wind Turbines in Residential Energy Sector in Iran. Sustain. Energy Technol. Assess. 2017, 20, 58–71. [Google Scholar] [CrossRef]
- Tizpar, A.; Satkin, M.; Roshan, M.B.; Armoudli, Y. Wind Resource Assessment and Wind Power Potential of Mil-E Nader Region in Sistan and Baluchestan Province, Iran—Part 1: Annual Energy Estimation. Energy Convers. Manag. 2014, 79, 273–280. [Google Scholar] [CrossRef]
- Zheng, M.; Han, D.; Gao, S.; Wang, J. Numerical Investigation of Bluff Body for Vortex Induced Vibration Energy Harvesting. Ocean Eng. 2020, 213, 107624. [Google Scholar] [CrossRef]
- Kan, J.; Fan, C.; Wang, S.; Zhang, Z.; Wen, J.; Huang, L. Study on a Piezo-Windmill for Energy Harvesting. Renew. Energy 2016, 97, 210–217. [Google Scholar] [CrossRef]
- Arionfard, H.; Nishi, Y. Experimental Investigation on the Performance of a Double-Cylinder Flow-Induced Vibration (FIV) Energy Converter. Renew. Energy 2019, 134, 267–275. [Google Scholar] [CrossRef]
- Gu, M.; Song, B.; Zhang, B.; Mao, Z.; Tian, W. The Effects of Submergence Depth on Vortex-Induced Vibration (VIV) and Energy Harvesting of a Circular Cylinder. Renew. Energy 2020, 151, 931–945. [Google Scholar] [CrossRef]
- Yayla, S.; Ayça, S.; Oruç, M. A Case Study on Piezoelectric Energy Harvesting with using Vortex Generator Plate Modeling for Fluids. Renew. Energy 2020, 157, 1243–1253. [Google Scholar] [CrossRef]
- Lai, Z.; Wang, S.; Zhu, L.; Zhang, G.; Wang, J.; Yang, K.; Yurchenko, D. A Hybrid Piezo-Dielectric Wind Energy Harvester for High-Performance Vortex-Induced Vibration Energy Harvesting. Mech. Syst. Signal Process. 2021, 150, 107212. [Google Scholar] [CrossRef]
- Li, X.; Bi, C.; Li, Z.; Liu, B.; Wang, T.; Zhang, S. A Piezoelectric and Electromagnetic Hybrid Galloping Energy Harvester with the Magnet Embedded in the Bluff Body. Micromachines 2021, 12, 626. [Google Scholar] [CrossRef] [PubMed]
- Song, R.; Hou, C.; Yang, C.; Yang, X.; Guo, Q.; Shan, X. Modeling, Validation, and Performance of Two Tandem Cylinder Piezoelectric Energy Harvesters in Water Flow. Micromachines 2021, 12, 872. [Google Scholar] [CrossRef]
- Zhao, L.; Tang, L.; Yang, Y. Comparison of Modeling Methods and Parametric Study for a Piezoelectric Wind Energy Harvester. Smart Mater. Struct. 2013, 22, 125003. [Google Scholar] [CrossRef]
- Su, W.-J.; Wang, Z.-S. Development of a Non-Linear Bi-Directional Vortex-Induced Piezoelectric Energy Harvester with Magnetic Interaction. Sensors 2021, 21, 2299. [Google Scholar] [CrossRef]
- Koçak, K. Practical Ways of Evaluating Wind Speed Persistence. Energy 2008, 33, 65–70. [Google Scholar] [CrossRef]
- Esfandeh, S.; Danehkar, A.; Salmanmahiny, A.; Sadeghi, S.M.M.; Marcu, M.V. Climate Change Risk of Urban Growth and Land Use/Land Cover Conversion: An In-Depth Review of the Recent Research in Iran. Sustainability 2022, 14, 338. [Google Scholar] [CrossRef]
- Abdi, E.; Samdaliry, H.; Ghalandarayeshi, S.H.; Khoramizadeh, A.; Sohrabi, H.; Deljouei, A.; Kvist Johannsen, V.; Etemad, V. Modeling wind-driven tree mortality: The effects of forest roads. Austrian J. For. Sci. 2020, 137, 1–21. [Google Scholar]
- Nazari, M.; Chaichi, M.R.; Kamel, H.; Grismer, M.; Sadeghi, S.M.M. Evaluation of Estimation Methods for Monthly Reference Evapotranspiration in Arid Climates. Arid. Ecosyst. 2020, 10, 329–336. [Google Scholar] [CrossRef]
- White, F.M. Viscous Fluid Flow, 3rd ed.; McGraw–Hill: New York, NY, USA, 2006. [Google Scholar]
- Jokar, H.; Mahzoon, M.; Vatankhah, R. Nonlinear Dynamic Characteristics of Horizontal-Axis Wind Turbine Blades Including Pre-Twist. Ocean Eng. 2022, 256, 111441. [Google Scholar] [CrossRef]
- Aravindhan, N.; Natarajan, M.P.; Ponnuvel, S.; Devan, P.K. Performance Analysis of Shrouded Invelox Wind Collector in the Built Environment. Sci. Technol. Built Environ. 2022, 28, 677–689. [Google Scholar] [CrossRef]


Publisher’s Note: MDPI stays neutral with regard to jurisdictional claims in published maps and institutional affiliations. |
© 2022 by the authors. Licensee MDPI, Basel, Switzerland. This article is an open access article distributed under the terms and conditions of the Creative Commons Attribution (CC BY) license (https://creativecommons.org/licenses/by/4.0/).